Abstract
As the strategic task of China’s modernization, the implementation of new-type urbanization has an important impact on carbon emissions from the construction industry. To fill the gap in considering the spatial correlation and threshold characteristics of new-type urbanization on carbon emissions from the construction industry, this paper constructs a comprehensive evaluation indicator of new-type urbanization, and the spatial economic model and the threshold regression model are adopted to analyze the panel data of 30 provinces in China from 2002 to 2020. The results indicate that (1) carbon emissions from China’s construction industry exhibit a significant positive spatial correlation, with more than half of provinces distributed as H-H and L-L types. (2) New-type urbanization has significant positive direct and indirect effects on carbon emissions in the construction industry; the labor efficiency, energy intensity, and development level of the construction industry and trade openness also have a significant spillover effect on carbon emissions from the construction industry. (3) At this stage, new-type urbanization exhibits a threshold effect on carbon emissions from the construction industry due to the different levels of development and energy intensity of the construction industry. After crossing the threshold value, the promotion effect of new-type urbanization on carbon emissions from the construction industry gradually increases. This paper provides a reference for promoting carbon emission reduction in the construction industry in the process of new-type urbanization.
1. Introduction
Since the Industrial Revolution, the combustion of fossil fuels and chemical substances such as petroleum through human activities has released a large amount of greenhouse gases, resulting in global warming [1]. The climate problems caused by global warming are serious, posing a huge threat to the human living environment and natural resources [2]. Therefore, several countries have achieved or set carbon neutrality targets in policy documents or laws [3] and have taken measures to reduce CO2 emissions [4]. During the 75th United Nations General Assembly, China pledged to peak its carbon emissions by 2030 and achieve carbon neutrality by 2060 [5].
After more than 40 years of reform and opening up, China’s urban space has expanded by nearly 8.4 times, and the urbanization rate of the population reached 63.89% in 2020, indicating that China is experiencing a rapid process of urbanization. In addition, according to the greenhouse gas emission data released by Maplecroft, a British risk assessment company [6], China’s carbon emissions exceeded 6 billion tons in 2020, making it one of the world’s largest carbon emitters, and sustainable development issues such as energy consumption and environmental pollution have become increasingly prominent [7,8]. Thus, China proposed urbanization with Chinese characteristics as early as 2002. Based on it, China officially released the “National New-type Urbanization Plan” in March 2014, proposing new-type urbanization with human-centered and sustainable development connotations, requiring the concept of ecological civilization to be fully integrated into the urbanization process [9]. In addition to the proportion of urban population, new-type urbanization pursues coordinated and sustainable development of the society, economy, land, ecology, culture, and other aspects. As a strategic task of China’s modernization, the implementation of new-type urbanization will create a large number of public service systems and infrastructure investment space, including medical, educational, service, and other supporting facilities, and the construction industry will bear the brunt [10].
The construction industry is a high energy-consuming sector and one of the major sources of carbon emissions in China. According to the “2022 Research Report China Building Energy Consumption and Carbon Emissions” released by the China Building Energy Efficiency Association, the total carbon emissions from the whole process of China’s construction industry in 2020 was 5.08 billion tons, accounting for 50.9% of national carbon emissions, indicating that the construction industry occupies a major position in China’s total carbon emissions. With the country’s rapid urbanization and economic development, the proportion of building energy consumption in China’s total energy consumption will gradually rise [11]. And the carbon emissions of China ‘s construction industry are expected to peak after 2030 [12,13,14,15].
New-type urbanization has sustainable development connotations, but its promotion will lead to more demand for buildings and infrastructure, resulting in an increase in carbon emissions in the construction industry. On the other hand, the construction industry has the characteristics of large potential and low costs of emission reduction, which has become a key breakthrough in China’s energy conservation and emission reduction [16]. Hence, in the current process of new-type urbanization, the impact of new-type urbanization on the carbon emissions from the construction industry is being explored to reduce energy waste and carbon emission intensity in the construction industry, which is important to achieve China’s energy conservation and emission reduction targets.
A large number of previous studies have focused on the impact of new-type urbanization on total regional carbon emissions at the macro level, with less attention paid to the construction sector specifically. Moreover, few studies have considered the spatial effect of new-type urbanization on carbon emissions from the construction industry. To fill the research gaps mentioned above, this paper examines the spatial effect and threshold effect of new-type urbanization on carbon emissions from the construction industry from linear and nonlinear perspectives.
The rest of this paper is organized as follows: the literature review and research hypothesis are presented in Section 2. The methods and data are introduced in Section 3. Section 4 contains the empirical results and discussion. Finally, the conclusion and policy implications are presented in Section 5.
2. Literature Review and Research Hypothesis
2.1. Research on New-Type Urbanization
With the advancement of Chinese-style urbanization and the continuous enrichment of its concepts, there is research on new-type urbanization focusing on the following two aspects: the connotation of new-type urbanization and the measurement of its development level. The concept of new-type urbanization was first explicitly put forward in the Communique of the Central Economic Work Conference in 2012 [17]. However, the evolution of its conceptual connotation has gone through two phases: from 2002 to 2011, the road of urbanization with Chinese characteristics was taken, laying the foundation for the connotation of new-type urbanization; after 2012, the urbanization was given the construction requirements of “new type”, and the connotation of new-type urbanization has been continuously enriched [18]. Different from the crude development of traditional urbanization, which simply pursues the gathering of population and economic activities in cities and promotes the urbanization of land, new-type urbanization is centered on human beings [19]. Many scholars have different understandings and expressions of the connotation of new-type urbanization, but it is generally considered to be inconsistent with traditional urbanization [18,20,21,22]. According to the Communique of the 2012 Central Economic Work Conference and the National New-Type Urbanization Plan, the concept of new-type urbanization is “to fully integrate the concept and principles of ecological civilization into the whole process of urbanization, and to take the road of new-type urbanization that is intensive, intelligent, green and low-carbon” [23], with urban-rural integration, industrial interaction, conservation and intensification, ecological livability, and harmonious development as its basic features [19].
As for measuring the development level of urbanization, some studies in the past only used a single indicator for analysis [24,25,26], ignoring the quality and benefits of the urbanization process, and the evaluation of urbanization was not comprehensive enough. In order to reflect the inherent requirements of new-type urbanization, the National New-Type Urbanization Plan (2014–2020) selects 18 indicators to establish an urbanization indicator system based on four aspects: urbanization level, basic public services, infrastructure, and resources and environment, which provides national guidance for the construction of a composite indicator system for new-type urbanization [23]. Some scholars measured the development level of comprehensive urbanization from various aspects such as population, land, and economy [27,28]. Furthermore, some scholars have incorporated aspects related to the quality of urbanization development, such as ecology and social services, into the indicator system for the level of new-type urbanization, taking into account the connotation of new-type urbanization [29,30,31,32].
2.2. Research on Carbon Emissions from the Construction Industry
Research related to carbon emissions from the construction industry mainly concentrates on the measurement of carbon emissions and the analysis of its impact factors. In order to measure the carbon emissions from the construction industry, scholars commonly adopt different measurement methods based on specific research objects, such as the carbon emission factor method, the input–output method (input–output analysis), and the life cycle assessment (LCA) method. Some scholars have adopted the carbon emission factor method for national and regional carbon emissions from the construction industry based on a macro perspective [14,29,33,34,35]. Also, some studies have chosen the input–output method to account for carbon emissions from the construction industry on a regional scale [36,37,38,39]. Since the input–output table required for this method is updated once every five years in China, it cannot be applied in time for the latest measurement. In addition, life cycle assessment is mostly applied to single engineering materials or construction projects [40,41,42]. Compared with the other two methods, the carbon emission factor method is suitable for measuring carbon emissions from a macro perspective, whose calculation process is simple and direct; on the other hand, the data used in this method are more available, which is why it has become the choice of most scholars to study the carbon emissions from the construction industry [29].
In terms of the key factors affecting carbon emissions in the construction industry, it can be seen that the demographic system, technological revolution, industrial system, energy consumption intensity, and foreign direct investment are the main factors affecting carbon emissions in the construction industry [4,29,43]. In general, urban population density or total population is positively correlated with urban carbon emissions, but different levels of economic development will affect the level of positive correlation between the two [4,44,45]. The technological revolution has reduced carbon emissions overall [46,47], and in some regions, the level of technological development may contribute to an increase in energy consumption and carbon emissions [48,49]. The expansion of urban building area and building scale will also cause an increase in energy consumption in the construction industry [50,51,52,53]. In addition, some research points out that FDI has a promoting effect on carbon emissions in various industries (except transportation) [54,55].
2.3. Research on the Impact of New-Type Urbanization on Carbon Emissions
Existing studies have examined the relationship between urbanization and carbon emissions based on various methods and research perspectives and have reached different conclusions. Studies have suggested that urbanization has increased energy consumption and carbon emissions. Al-mulali et al. [56] demonstrated that urbanization, energy consumption and carbon emissions are positively and stably correlated over time in 84% of countries, based on a panel of countries around the world from 1980 to 2008. Zhang et al. [57] used the dynamic panel estimation method to conclude that China’s urbanization process has had a positive impact on carbon emissions. Other studies have argued that increased levels of urbanization contribute to carbon reduction [50]. Sharma et al. [58] analyzed global panel data for 69 countries from 1985–2005 and found that urbanization has had a negative impact on carbon emissions across countries at different levels of economic development. Wang et al. [24] found that developed countries have achieved decoupling of urbanization from carbon emissions and that urbanization has a negative impact on the construction industry. Moreover, some studies have concluded that the impact of urbanization on carbon emissions shows a staged pattern. There is evidence of an inverted U-shaped relationship between urbanization and per capita CO2 emissions, i.e., urbanization will first exacerbate CO2 emissions, but its impact on carbon emissions will turn to a negative change as carbon emissions peak [45,59,60].
Many previous studies have used a “urbanization rate” as a single indicator to characterize the level of urbanization and explore its impact on carbon emissions [25,26]. As China’s urbanization progresses and its connotation continues to be enriched, a few scholars have adopted multiple indicators to measure the level of urbanization, considering the slight deficiency and one-sidedness of a single indicator [7,28]. There are also linear and nonlinear aspects of research on new-type urbanization on energy consumption and carbon emissions. As for linear aspects, on the one hand, some studies conclude that new-type urbanization will still make a significant contribution to carbon emissions, because new-type urbanization is in the initial stage of low-carbon economic transformation, and its green and low-carbon features are not yet fully apparent for carbon emission reduction [61]; on the other hand, some studies show that new-type urbanization can promote the enhancement of the efficiency of carbon emissions through the urban agglomeration effect [31,62]. In addition, some scholars have explored the nonlinear relationship between the two through the EKC model [32,61], the threshold model [30], and the nonparametric additive model [63]. Research on the relationship between new-type urbanization and energy consumption and carbon emissions is further refined to specific industries, for example, such as the construction industry which has become one of the hot topics.
New-type urbanization affects construction carbon emissions by influencing population migration, industrial development, urban construction, and ecological protection [12,53,62]. (1) New-type urbanization leads to massive rural–urban migration through the promotion of population urbanization, which increases carbon emissions from the demand for more buildings and infrastructure [64]. The agglomeration of the urban population improves the efficiency of energy use in areas such as public transportation, improves the consumption structure and consumer attitudes of residents. It promotes cleaner and more environmentally friendly consumption as well as energy conservation and emission reduction, among other things, in order to reduce the intensity of carbon emissions [62]. (2) New-type urbanization advocates connotative economic development, which mainly includes new-type industrialization driven by information technology and the transformation and upgrading of industrial structures [23,65]. The transformation and development of industry requires public buildings as space carriers, resulting in an accretion in carbon emissions from the construction industry. In the meantime, urbanization promotes the gathering of factors and the development of science and technology, which makes it possible to realize clean production and carbon emission reduction in the construction industry [24,62]. (3) New-type urbanization emphasizes the core of human beings, pays more attention to the improvement of public service levels and the social security system, and ensures the equal allocation of public resources in cities and towns [23,66]. At the present stage, this involves improving public infrastructure, such as increasing the area of paved roads and the number of public transportation vehicles in cities, as well as progressively improving healthcare conditions and facilities, which may generate significant carbon emissions from the construction sector.
Scholars have come to different conclusions about the relationship between the two. Guo et al. [29] constructed a comprehensive evaluation index of urbanization from four aspects, population, economy, society, and land urbanization, by using the entropy method, and the results showed that comprehensive urbanization plays a significant role in promoting the carbon emissions from urban civil buildings. Xiao et al. [34] explored the impact of new-type urbanization on urban building carbon emissions from three dimensions: scale, average and structure, and found that the construction of new-type urbanization reduces urban buildings’ carbon emissions, industrial upgrading has an obvious reduction effect on buildings’ carbon emissions, and urban green space significantly inhibits buildings’ carbon emissions. In summary, there are few studies on the impact of new-type urbanization on carbon emissions from the construction industry, and few studies have considered the spatial effect of new-type urbanization on carbon emissions from the construction industry. Due to the fact that population, technology, and capital will flow between regions [61], the impact of new-type urbanization on the carbon emissions from the construction industry is not only limited to the region but also may have an impact on the adjacent regions. Based on the analysis above, this study proposes Hypothesis 1:
Hypothesis 1 (H1).
The construction of new-type urbanization contributes to carbon emissions from the construction industry in the region and has spatial spillover effects on neighboring regions.
Regarding the nonlinear relationship between new-type urbanization and carbon emissions, the extent of the impact of new-type urbanization on carbon emissions from the construction industry may also be affected by factors such as the scale of development and the energy intensity of the construction industry. It has been shown in the literature that the scale of development and energy intensity are important factors that significantly affect carbon emissions in the construction industry [67]. In the pre-development period of the construction industry, a large amount of energy was consumed due to the large demand for housing brought about by the rapid advancement of land urbanization, as well as rough construction production. The development of the construction industry to a certain extent will attract capital to stimulate innovation and vitality, but also become the focus of carbon emission reduction regulation. The construction industry tends to be standardized, there are sufficient funds to develop green energy, and there is the introduction of low-carbon technology and equipment, so as to promote carbon emission reduction [68]. The impact of new-type urbanization on carbon emissions in the construction industry may vary depending on the level of development of the construction industry. Based on the above analysis, this study proposes Hypothesis 2.
Hypothesis 2 (H2).
The impact of new-type urbanization on carbon emissions from the construction industry has a threshold effect due to different levels of development in the construction industry.
Energy intensity characterizes the technological capacity of building material production, construction processes, construction waste treatment, etc. [4]. Improvements in the level of technology and reductions in energy intensity can reduce the cost of ineffective emission reductions. In addition, there are regional imbalances in China’s economic development, which can lead to differences in the level of technological progress [30], one of which is reflected in different energy intensities. Therefore, the impact of new-type urbanization on carbon emissions in the construction industry may exhibit threshold characteristics due to differences in energy intensity. Accordingly, this study proposes Hypothesis 3.
Hypothesis 3 (H3).
The impact of new-type urbanization on carbon emissions from the construction industry has a threshold effect due to differences in energy intensity.
3. Methods and Data
3.1. Methods
3.1.1. Method for Measuring Spatial Features
In order to select a suitable model to measure spatial features, global and local Moran’s indices (Moran’s ) [69] were used to test for spatial correlation. The global and local Moran’s are defined as follows:
where represents the number of regions included in the study area, and are the observations of region and region , respectively, and is the mean of the observations. The range of global Moran’s is (−1, 1), while the local Moran’s is not limited to (−1, 1). (0, 1) means positive autocorrelation, while (−1, 0) is the opposite. Moran’s is equal to 0, which means that the observations follow a random distribution where there is no spatial autocorrelation.
represents the elements of the spatial weight matrix. In this paper, the spatial inverse distance matrix (take the reciprocal of the square of the distance between regions) was selected as the spatial weight matrix. The distance between region and region is , which can be expressed as follows:
3.1.2. Spatial Econometric Models
Considering the possible spatial correlation of carbon emissions from the construction industry and the fact that econometric tests ignoring spatial correlation would lead to biased parameter estimates, a spatial econometric model was constructed to explore the spatial spillover effect of new-type urbanization on carbon emissions from the construction industry. The spatial econometric model is as follows:
where means the dependent variable for period of study region ; and are the core explanatory variable and control variable for period of study region , respectively; , , , , , and are the parameters to be estimated; and denote region and time effects, respectively; denotes residuals; is a random disturbance term; and is a spatial weight matrix. Formula (4) is the general nested spatial econometric model (GNS) and the following three models are the most widely used forms of spatial econometric models: if ≠ 0, = 0, = 0, and = 0, then Formula (4) is the spatial autoregressive model (SAR); if = 0, = 0, = 0, and ≠ 0, Formula (4) is the spatial error model (SEM); if ≠ 0, ≠ 0, ≠ 0, and = 0, Formula (4) is the spatial Durbin model (SDM). These three models are the most widely used forms of spatial measurement models. In the following section, various tests are used to determine and select the optimal model. Since the above model regression coefficients deviate from the true partial regression coefficients, the direct, indirect, and total effects need to be decomposed using the partial differential form [70].
3.1.3. Threshold Panel Models
Considering the possible nonlinear effect of new-type urbanization on carbon emissions from the construction industry, we chose the threshold regression model proposed by Hansen [71], which is used to test the threshold effect of new-type urbanization on carbon emissions from the construction industry by using the development level and energy intensity of the construction industry as threshold variables. Since there may be multiple threshold values for the threshold variables, the threshold panel model of this paper was conducted as follows:
where represents individual fixed effects; is the threshold variable; is the indicative function whose value satisfies the corresponding condition in parentheses and takes 1, otherwise 0; is the threshold value, and are parameters to be estimated; and is the stochastic disturbance.
3.2. Variables and Data Sources
3.2.1. Dependent Variable
The explained variable of this paper is carbon emissions from the construction industry (CEC), which includes direct carbon emissions from on-site construction activities and indirect carbon emissions from the upstream industrial chain in the production and transportation stage of building materials [36,38]. Direct carbon emissions are measured by taking into account 17 types of energy sources (including raw coal, washed coal, other washed coal, shaped coal, coke, coke oven gas, other gas, other coking products, crude oil, gasoline, kerosene, diesel, fuel oil, liquefied petroleum gas, dry gas from refineries, natural gas, and other petroleum products), electricity and heat consumption. The data on energy consumption were obtained from the “China Energy Statistical Yearbook” from 2003 to 2021. Indirect carbon emissions were calculated based on the consumption of five types of building materials, including cement, steel, glass, wood, and aluminum. Material consumption data were obtained from the “China Construction Industry Statistical Yearbook” from 2003 to 2021. Due to the lack of continuous updating of China’s input–output table and missing data, the estimated results may have deviations. Thus, the carbon emissions calculation model of China’s construction industry is based on the accounting method provided by the IPCC. The model is as follows:
In Formula (5), subscripts (t = 1, …, 30) and t (t = 2002, …, 2020) represent the province and the t year, respectively. represents the total carbon emissions from the construction industry; and represent the total direct and indirect carbon emissions from the construction industry, respectively. is the total direct energy consumption from energy source r (r = 1, …, 17). is the carbon emission coefficient of energy combustion from energy source r, which is calculated based on the carbon emission factor, lower heating value, and carbon oxidation ratio of different energy sources, as shown in Table 1.
Table 1.
Carbon emission conversion factors of different energy sources.
and represent the total direct consumption of electricity and heat by the construction industry, respectively. is the carbon dioxide emission coefficient of electricity, reported in Table 2; is the carbon dioxide emission coefficient of heat. According to the atomic weight of carbon (12) and the molecular weight of carbon dioxide (44), in Equation (5), the carbon emissions can be calculated by multiplying the carbon dioxide emissions by 12/44. And the carbon dioxide emission coefficient of heating in each province is from the relevant literature [72].
Table 2.
CO2 emission coefficient of electricity of 30 provinces in China’s mainland.
is the total consumption of the -th type of building materials; represents the carbon dioxide emission coefficient of the -th type of building materials. The building materials considered in this paper include cement, steel, glass, timber, and aluminum, and the corresponding emission coefficients for each type of material are as follows: 0.822 kg/kg, 1.789 kg/kg, 0.966 kg/kg, −842.8 kg/m3, and 2.6 kg/kg [46]. represents the recycling coefficient of the -th type of building materials: 0.80 (steel), 0.2 (timber), 0.45 (cement), 0.17 (glass), and 0.85 (aluminum) [46].
3.2.2. Core Explanatory Variable
Drawing on the relevant literature [29,73,74] and based on the connotation characteristics of new-type urbanization (NU), a comprehensive evaluation index system is constructed from five dimensions: the economy, population, land, society, and ecology. To measure new-type urbanization, an improved entropy method [62,63,75] was adopted considering the time variable, which can avoid the errors caused by subjective judgment in the subjective weighting method. The specific measurement steps are as follows:
- (1)
- Standardize the positive and negative indicators of the data used.
is the standardized indicator of the sample; = 1, …, n (n = 570), = 1, …, m (m = 24); is the maximum value of indicator ; is the minimum value of indicator .
- (2)
- Calculate the entropy weight of each indicator according to the principle of the entropy value method.
is the weight of indicator ; is the weight of the sample value under the indicator for that indicator.
- (3)
- Calculate the composite score for each sample.
The specific indices are shown in Table 3. Moreover, the year 2002 is one of the nodal points in the development of urbanization and the germination stage of the core concept of new-type urbanization, which began to focus on the legal rights of migrants [65]. On the premise of data availability, we selected the period of 2002–2020 for the study.
Table 3.
New-type urbanization index system.
3.2.3. Control Variables
Based on existing relevant studies [4,46,51,76], a series of variables that could potentially affect carbon emissions from the construction industry were selected to control from the aspects of economics, policies, and the environment. Specifically, these variables included: the level of development in the construction industry (CD), measured by the ratio of the value added from the construction industry to GDP; labor efficiency in the construction industry (LE), represented by the per capita value added by the industry (using the ratio of constant value added in 2002) to the number of employees in the construction industry as a proxy variable; the technological level of the construction industry (TL), represented by the construction industry’s equipment technology rate; the energy intensity of the construction industry (EI), represented by the ratio of the construction industry’s energy consumption in terms of standard coal to the value of increased construction output; trade openness (FDI), represented by the ratio of foreign direct investment to GDP; government intervention (GOV), represented by the ratio of general public budget expenditure to GDP; and the natural population growth rate (CP), which reflects the trend and speed of natural population growth.
3.2.4. Data Source
The data in this paper are panel data of 30 provinces, municipalities and autonomous regions of China (excluding Hong Kong, Macao, Taiwan, and Tibet) from 2002 to 2020, obtained from the China Energy Statistical Yearbook, the China Construction Statistical Yearbook, the China Urban Statistical Yearbook, the China Labor and Employment Statistical Yearbook, the China Urban and Rural Construction Statistical Yearbook, the China Education Statistical Yearbook, the China Statistical Yearbook, and the Statistical Yearbook of each province. Missing data are filled by interpolation; some variables are logarithmically treated in order to attenuate the effect of data heteroskedasticity. The descriptive statistics of each variable are shown in Table 4.
Table 4.
Variable descriptions.
4. Results and Discussion
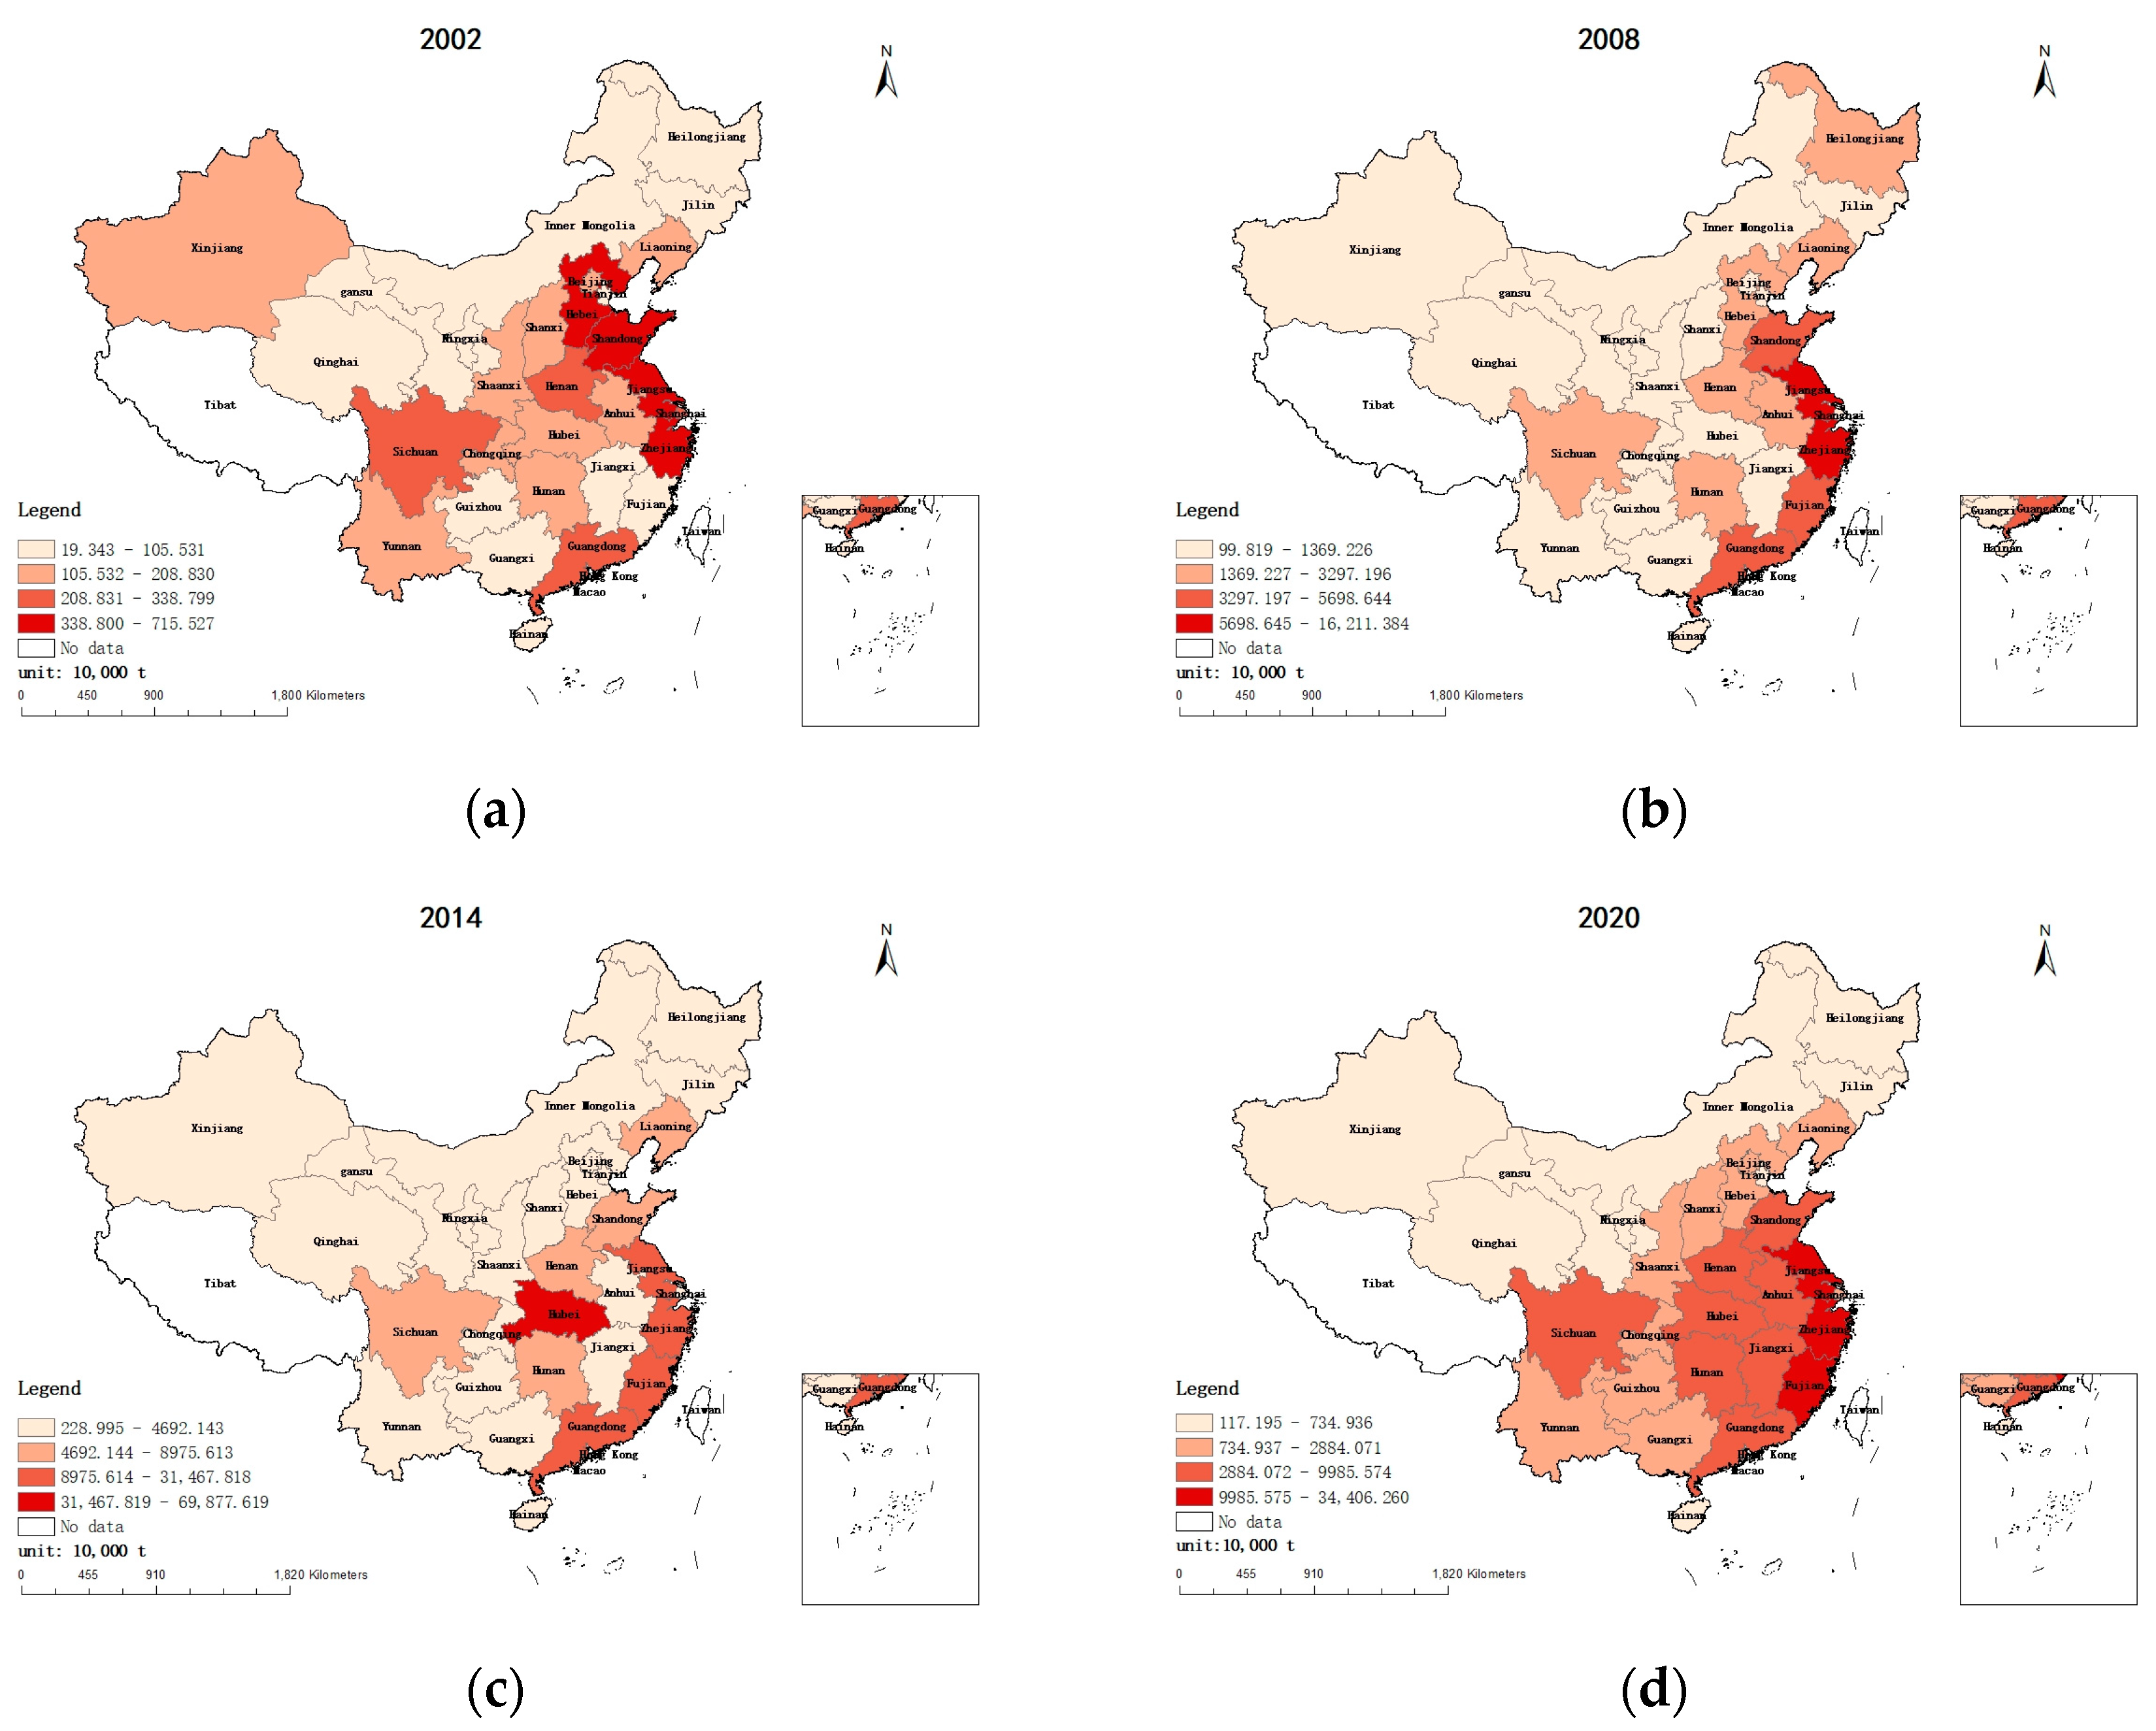
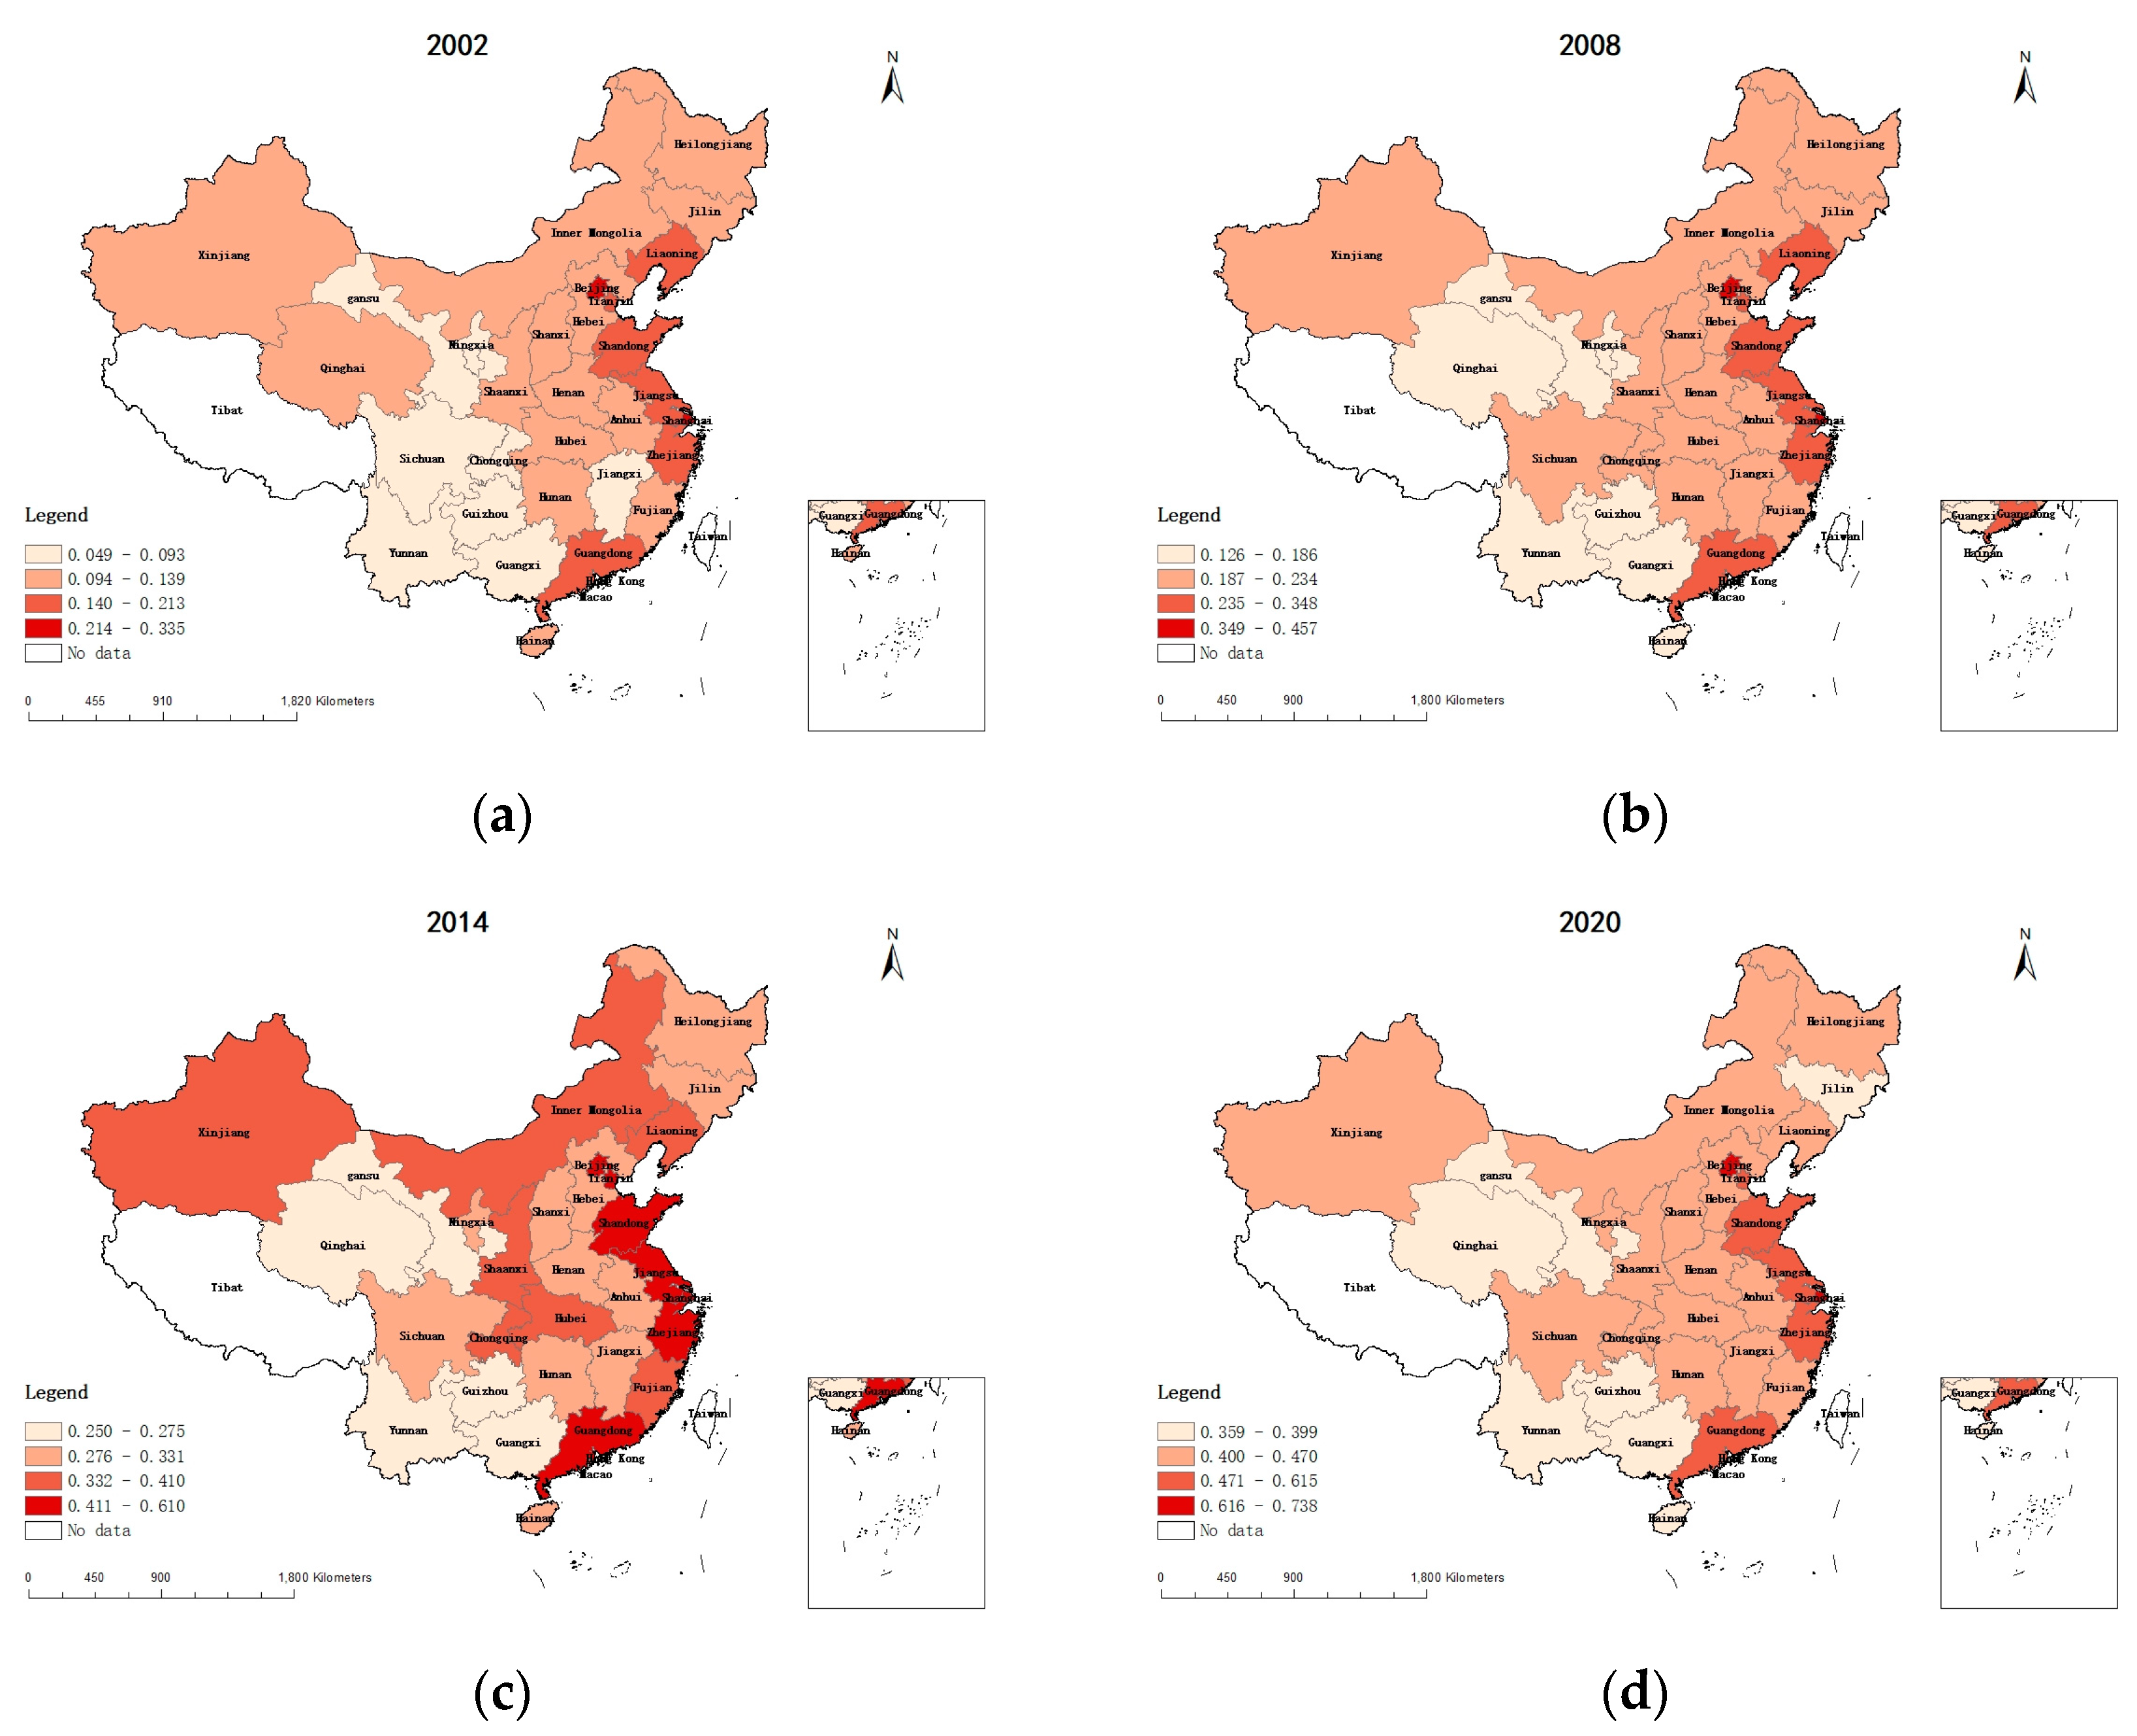
4.1. Spatiotemporal Distribution of CEC and NU in China
In this study, we selected four sample years—2002, 2008, 2014, and 2020. The raw data were categorized into four levels based on intensity, ranging from low to high, using ArcGIS 10.7 software. The spatiotemporal distribution of CEC and NU in China’s 30 provinces from 2002 to 2020 are shown in Figure 1 and Figure 2.
Figure 1.
Spatial distribution of carbon emissions from the construction industry for: (a) 2002; (b) 2008; (c) 2014; (d) 2020. (Source: calculated and organized by the authors).
Figure 2.
2002–2020 carbon emissions from China’s construction industry (Source: calculated and organized by the authors).
Figure 1 and Figure 2 illustrate the overall trend of increasing and then decreasing carbon emissions from China’s construction industry from 2002 to 2020, revealing evident spatial heterogeneity. During the study period, the carbon emissions from the construction industry in the Jiangsu, Zhejiang, and Guangdong provinces remained at medium–high- and high-intensity levels, while those in North China (excluding Hebei Province), Northeast China, Northwest China, Southwest China (excluding Sichuan Province), and South China (excluding Guangdong Province) remained at low and medium–low levels. The carbon emissions from the construction industry in Anhui Province, Jiangxi Province, Shandong Province in East China, and Guizhou Province in Southwest China continued to trend upwards. Meanwhile, the other provinces and regions initially experienced an increase, followed by a decrease in carbon emissions.
In 2002, 26.7% of the 30 provinces had high and medium–high levels of carbon emissions. This proportion decreased to 16.7% in 2008, remained the same in 2014, and increased to 36.7% in 2020. Overall, the provinces with high and medium–high construction carbon emissions are mostly concentrated in East and Central China in terms of spatial distribution.
As seen from Figure 3, China’s new-type urbanization level retains obvious spatial heterogeneity and unevenness in different provinces. In 2002, provinces with high and medium–high levels of new-type urbanization are mainly located in the eastern coastal areas, significantly exceeding the levels of most central and western provinces and regions. In 2008, the levels of NU increased to different extents in all provinces. However, upon comparison, it can be observed that the number of provinces with low levels of NU decreased significantly. Moreover, we can see that the spatial scope of provinces with higher levels has expanded from eastern to central and western areas, suggesting a narrowing of the gap between their urbanization levels. In 2020, the level of NU in all provinces improved, while the spatial distribution of provinces with the new-type urbanization level in the low range narrowed. Generally speaking, the level of China’s new-type urbanization has the spatial characteristics of high in the east and low in the west, with the inter-provincial gap showing a trend of narrowing, implying strengthening of the balance of spatial distribution.
Figure 3.
Spatial distribution of new-type urbanization for: (a) 2002; (b) 2008; (c) 2014; (d) 2020. (Source: calculated and organized by the authors).
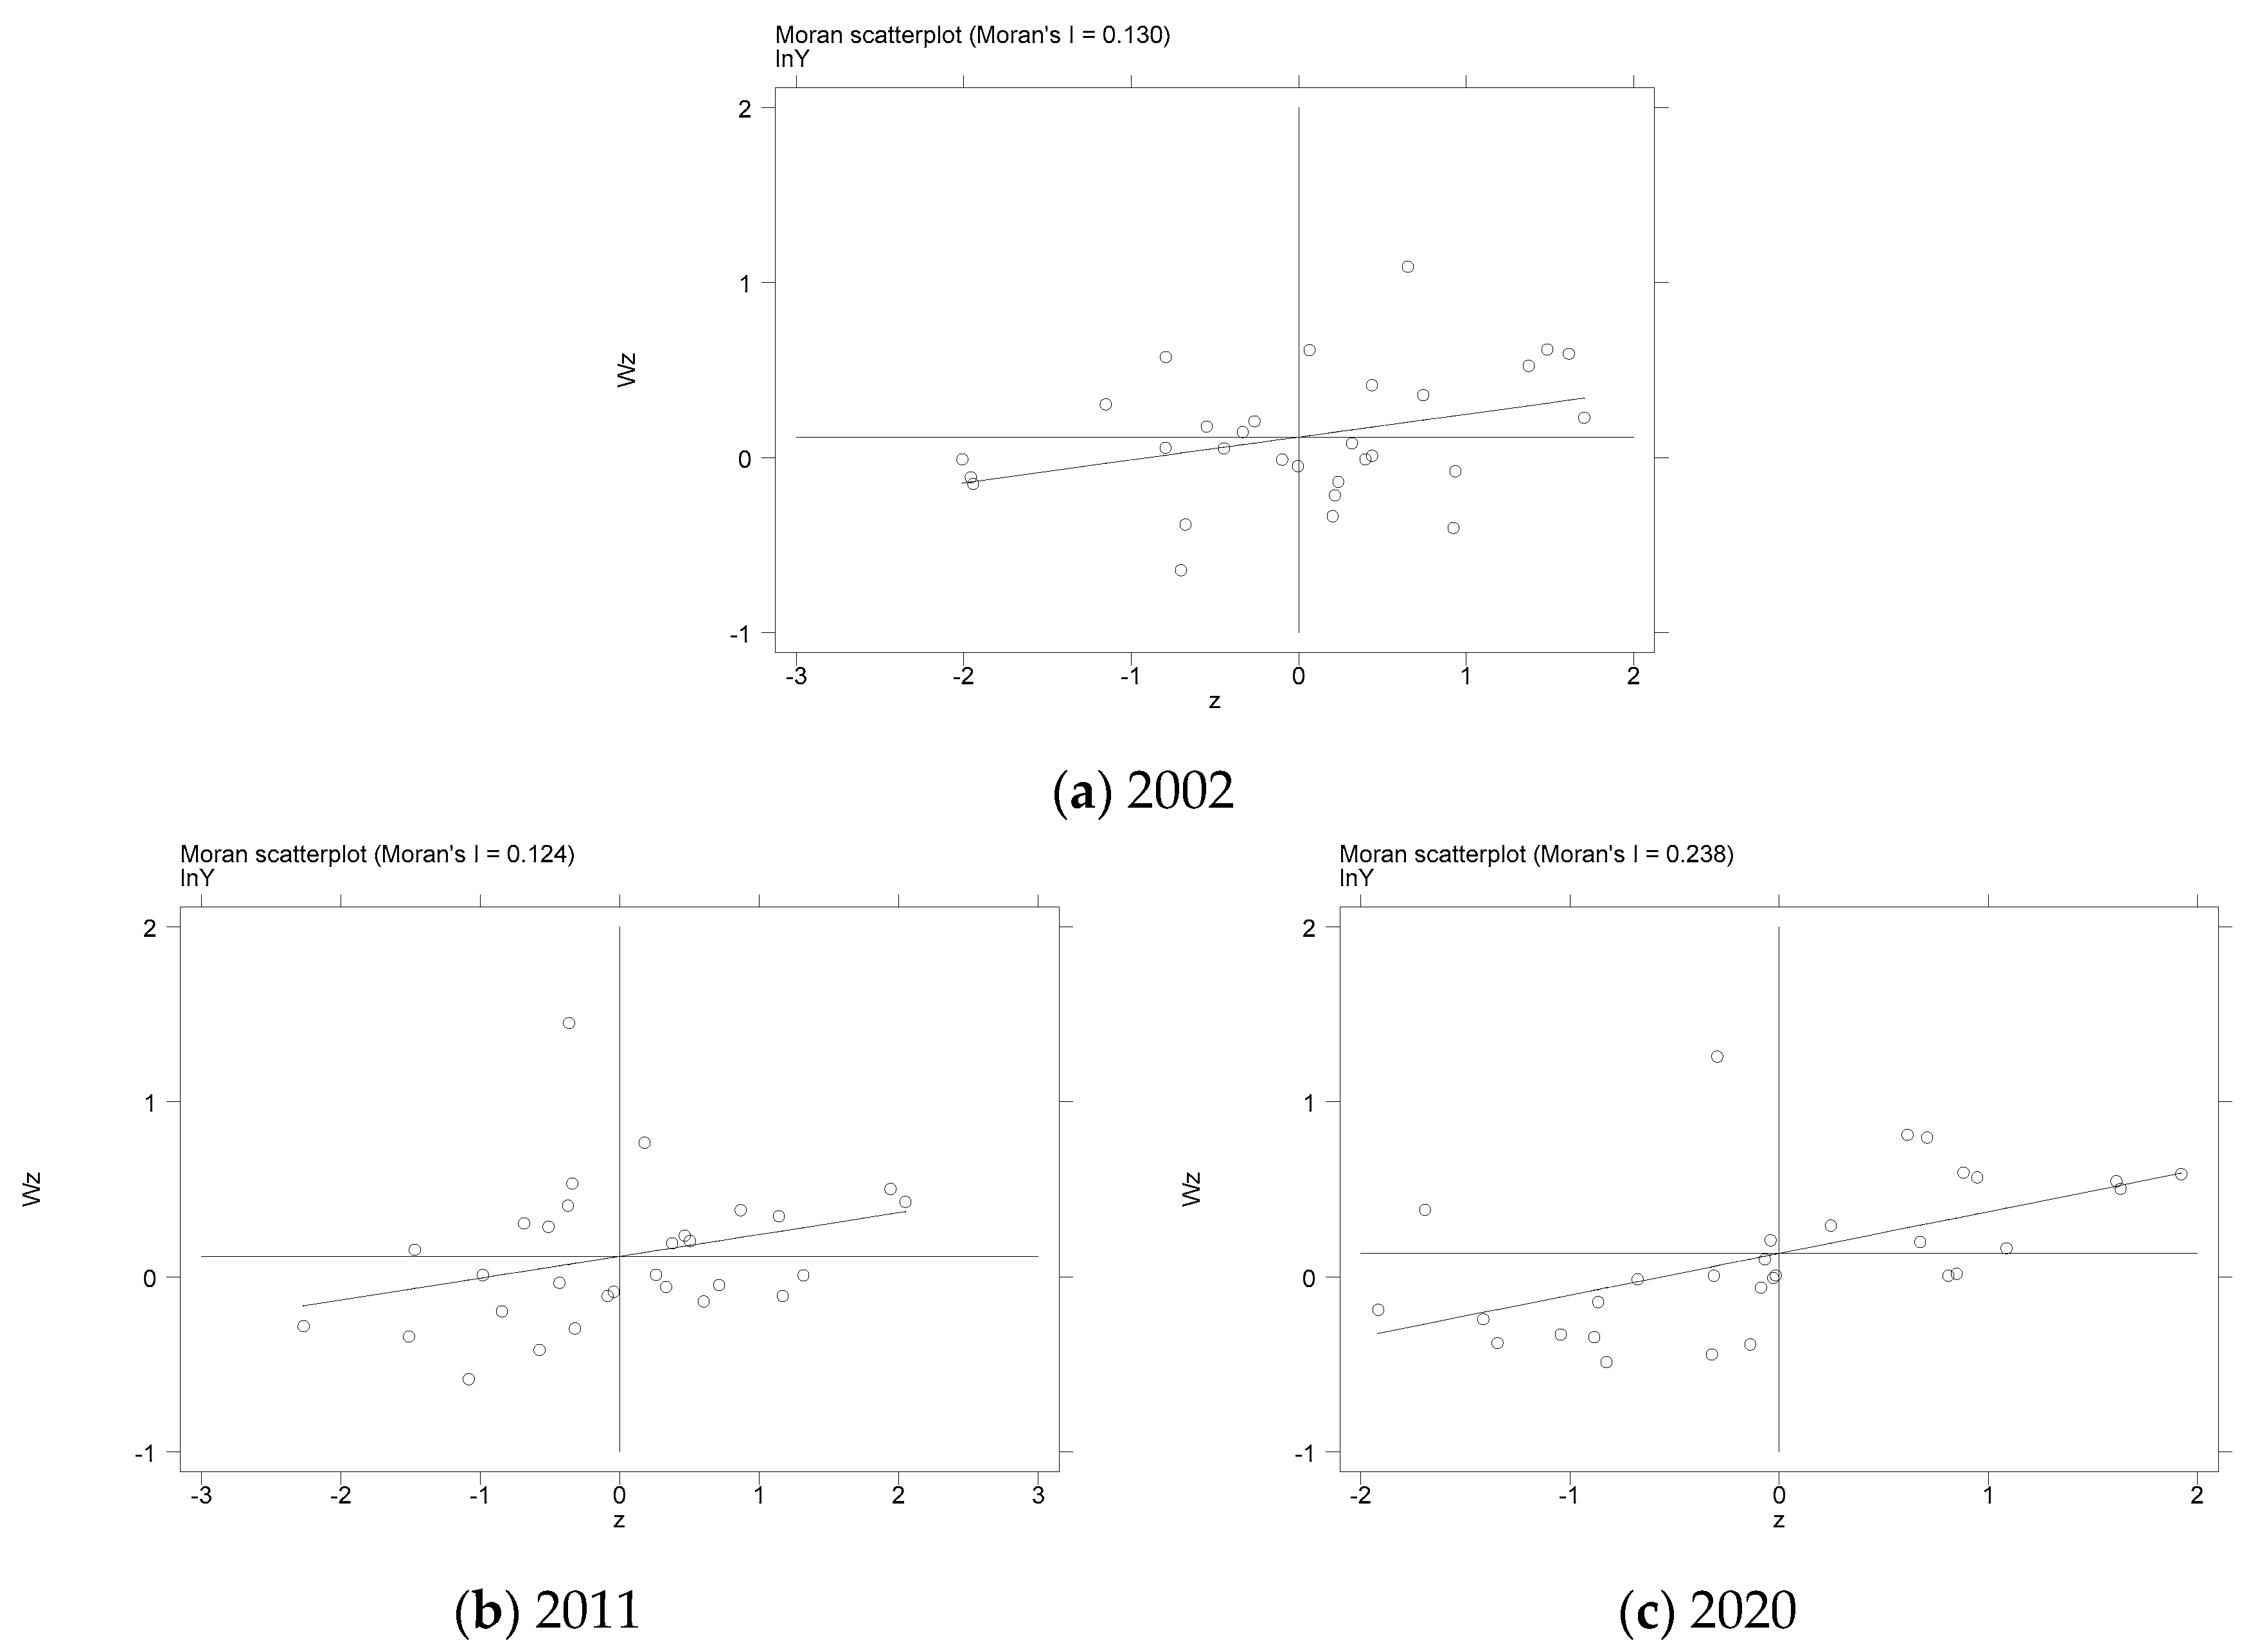
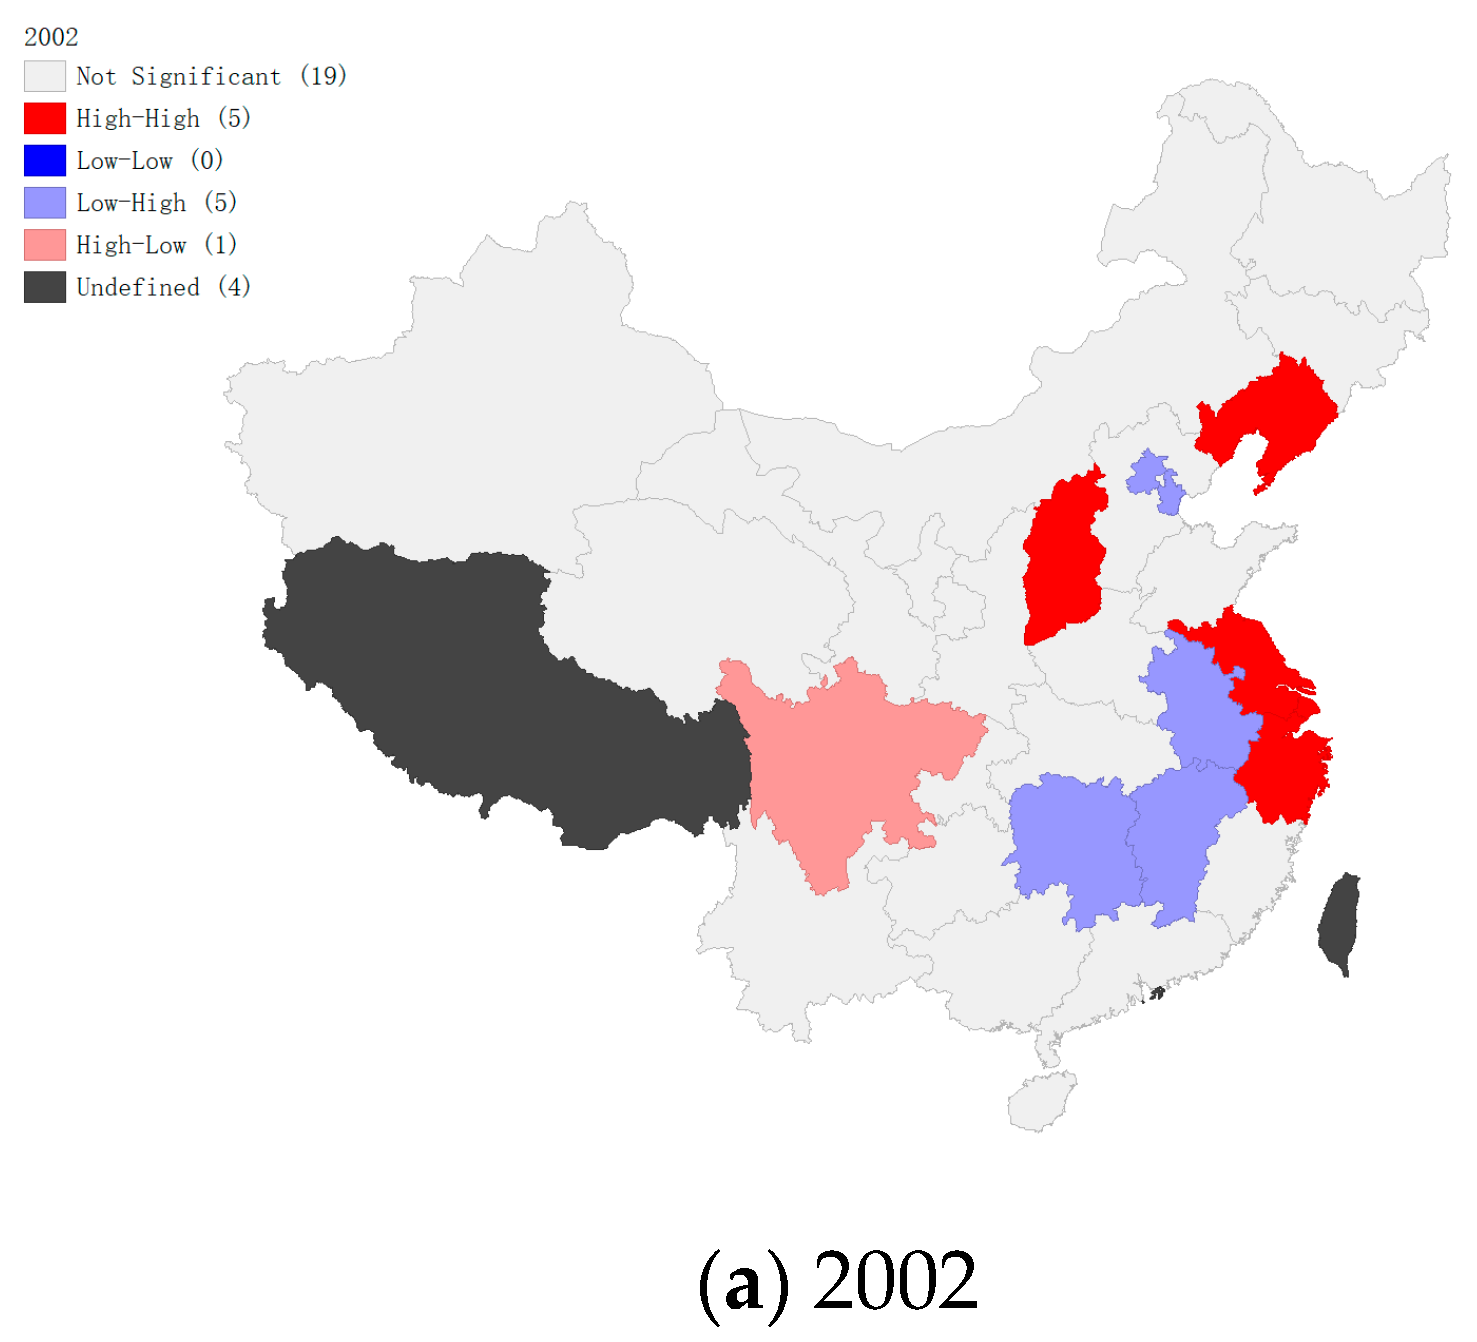
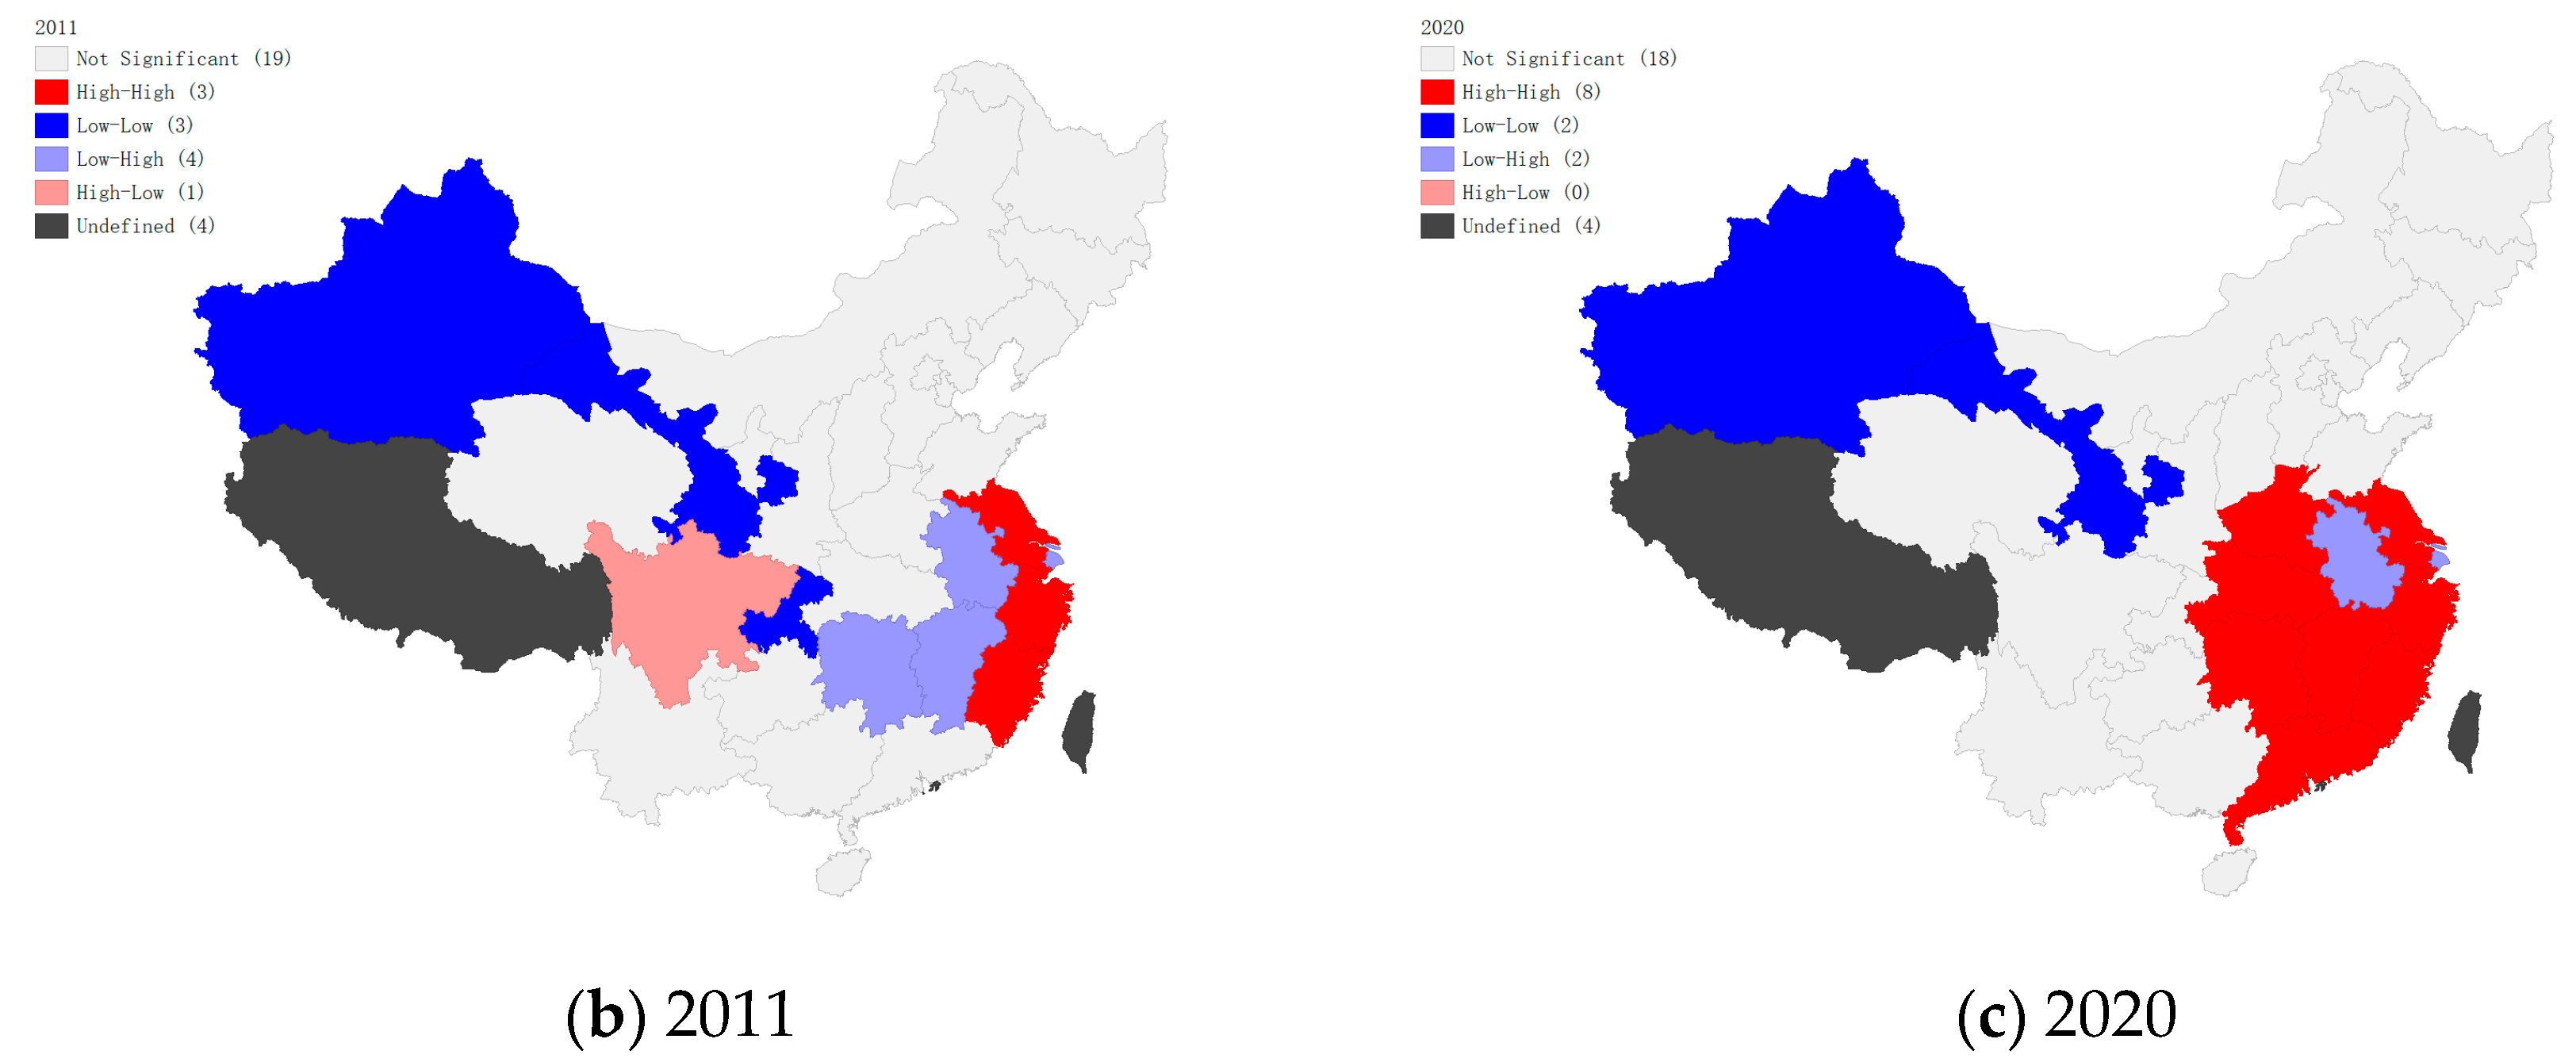
4.2. Spatial Autocorrelation Analysis
To accurately measure the spatial correlation between the provinces, it was essential to construct an appropriate spatial weight matrix [70]. Thus, this research adopted the three most commonly used spatial weight matrices to test the spatial correlation: (1) the Rook contiguity based spatial weight matrix (W1); (2) the spatial inverse distance matrix (W2); and (3) the economic geographic spatial weight matrix (W3) [77].
The results of global Moran’s I calculation under different spatial weight matrices are shown in Table 5: the global Moran’s I is significantly positive in most years, and generally enhanced although there are fluctuations in the degree of significance, indicating that the carbon emissions from the construction industry in China’s 30 provinces are positively autocorrelated. Therefore, it is necessary to study the impact of spatial effects on carbon emissions from the construction industry. As seen in Table 5, the global Moran’s I based on W2 from 2002 to 2020 passed the significance test in 16 years and failed it in 3 years with a positive value. The global Moran’s I calculated using W2 has more years that pass the significance test than other weight matrices. This suggests that the carbon emissions from the construction industry have relatively robust positive spatial effect.
Table 5.
The Moran’s I of CEC from 2002 to 2020.
By calculating the local Moran’s I, this study further explores the spatial aggregation characteristics of carbon emissions from the construction industry in different geographical locations. Scatterplots of three years (2002, 2011, and 2020 of the study period) were selected for analysis. The Moran scatterplot contains four types of spatial aggregation, in order from the first quadrant to the fourth quadrant: H-H type (high–high), L-H type (low–high), L-L type (low–low), and H-L type (high–low). The Moran scatterplots are shown in Figure 4, with more than half of the 30 provinces located in the first and third quadrants, indicating that there is spatial aggregation of carbon emissions from China’s construction industry in some regions. Lisa cluster maps and significance maps are shown in Figure 5 and Figure 6. At the beginning of the study period, for example, in 2002, H-H type provinces are clustered in some provinces in Northeast, North, and East China, and the clustering characteristics of L-L type provinces are not significant; in the middle of the study period, for example, in 2011, H-H type provinces are distributed in the eastern coastal area of the Yangtze River delta, and the L-L type provinces are distributed in Northwest China and some provinces in Southwest China; at the end of the study period, for example, in 2020, the area of H-H type provinces expanded and is mostly concentrated in the middle and lower reaches of the Yangtze River and the Pearl River Delta region, while the area of L-L type provinces can be narrowed down to the Northwest China region. Combining the local Moran’s I and Lisa cluster map, there is an obvious spatial correlation of carbon emissions from China’s construction industry.
Figure 4.
Moran scatter plot of carbon emissions for: (a) 2002; (b) 2011; (c) 2020. (Source: calculated and organized by the authors).

Figure 5.
LISA cluster map of carbon emissions for: (a) 2002; (b) 2011; (c) 2020. (Note: This is a schematic map, not a complete map of China, and does not include the South China Sea islands. Source: calculated and organized by the authors).
Figure 6.
Significance map of carbon emissions for: (a) 2002; (b) 2011; (c) 2020. (Note: This is a schematic map, not a complete map of China, and does not include the South China Sea islands. Source: calculated and organized by the authors).
4.3. Spatial Correlations
4.3.1. Statistical Testing of Model Selection
We further selected the best form of spatial econometric model to deeply explore the spatial spillover effect of new-type urbanization on carbon emissions from the construction industry. In Table 6, for the LM test, the results showed that the p values of LM-lag and LM-error are significant at the level of 1%, and the p-value of robust LM-error is significant at the level of 1%. This suggests that the OLS model should be rejected in order to adopt the SDM model.
Table 6.
Test results.
For the Wald test, the p-values of Wald-SAR and Wald-SEM are both significant at the 1% level, rejecting the hypothesis that SDM can degenerate into the SAR model or SEM model. The LR test results are consistent with the Wald test results.
The Hausman test was further applied and passed the 1% significance test, indicating that a fixed effects model should be used for estimation. In addition, SDM models with fixed effects are classified into three types of spatial fixed effects, time period fixed effects and spatial–temporal fixed effects. Comparing the two indicators of goodness of fit and log-likelihood values with each fixed effects model, the spatial Durbin model under spatial fixed effects was finally chosen.
4.3.2. Spatial Panel Model Regression Analysis
As shown in Table 7, based on the three different weight matrices, the spatial autoregressive coefficients of carbon emissions from the construction industry are all significantly positive at the level of 1%, indicating that there is a significant positive spillover effect on carbon emissions from the construction industry. These results suggest that adopting spatial econometric models is reasonable and necessary.
Table 7.
Model estimated results.
Since using point estimation is inaccurate for the measurement of spatial spillover effects [70], this paper therefore adopted the partial differential method for a spatial regression model to decompose the spill-over effects of new-type urbanization on carbon emissions from the construction industry into three components: direct effects, indirect effects, and total effects. The estimated results are shown in Table 8.
Table 8.
Estimation of direct, indirect, and total effects.
From the perspective of the core explanatory variable, the direct effect and indirect effect of new-type urbanization (NU) are positive, with them being significant at the levels of 5% and 10%, respectively. Moreover, the coefficient of the indirect effect is greater than the direct effect, indicating that the improvement of the new-type urbanization level in both the local and adjacent areas promotes the increase in carbon emissions from the local construction industry. For the total effect, a 1% increase in new-type urbanization will increase the carbon emissions from the construction industry by 13.5050%. And H1 was tested. Contrary to the findings of some studies in that new-type urbanization can promote carbon emission efficiency [31,62], this paper found that new-type urbanization still has a positive effect on carbon emissions from the construction industry at this stage. The reason is that the promotion of urbanization in the region has triggered the demand for residential housing, industrial upgrading and expansion, and equalization of social services, which require the gradual improvement of infrastructure to promote the rapid development of the construction industry. On the other hand, the improvement of the level of new-type urbanization in adjacent areas has promoted the flow of technology and capital to the local area to drive local economic and social development, stimulate the demand for the construction industry, and thus increase the carbon emissions from the construction industry. These results are consistent with the available literature [29,34].
The spatial effect decomposition of controlled variables is shown as follows: (1) the direct effects of labor efficiency (LE) in the construction industry is negative with a coefficient of −0.5828, and the indirect effect is positive with a coefficient of 0.4713. This means that labor efficiency improvements can improve energy efficiency, thereby reducing carbon emissions from the construction industry. (2) The direct effect of the construction industry technology level (TL) is positive and the indirect effect is negative, both of which are not statistically significant. This shows that the technical level does not have a significant impact on the carbon emissions from the construction industry in the provinces, reflecting the weaknesses in China’s technical equipment policy, construction industry technology development level, and technical equipment funding source. (3) The energy intensity (EI) characterizes the energy-saving technical factors, and the results show that the direct effect and indirect effect coefficient are significantly positive, illustrating that the energy intensity of both the local and adjacent areas will have a positive impact on the carbon emissions from the local construction industry. (4) The direct effect coefficient of the development level (CD) of the construction industry is significantly positive, and the indirect effect coefficient is negative but not significant. This shows that the improvement of the development level in the local areas will promote carbon emissions from the construction industry, and it in adjacent areas, it has no significant impact on carbon emissions. (5) The direct effect of government intervention (GOV) is positive and the indirect effect is negative, both of which are not significant. This shows that the level of fiscal expenditure in the local and adjacent areas does not have a significant impact on the carbon emissions from the construction industry. (6) Trade openness (FDI) has positive direct and indirect effects on carbon emissions from the construction industry, and the regression coefficients are 0.1171 and 1.0453, respectively. This shows that there is a “pollution haven” for carbon emissions from China’s construction industry. In other words, it is possible that in order to attract foreign investment and promote development, developing countries lower the standards of environmental regulations so that developed countries transfer highly polluting industries to the developing countries, which means that the ecological environment will worsen in those developing countries. (7) The effect of the natural population growth rate (CP) on carbon emissions from the construction industry is insignificant and does not pass the significance test. The effect of CP on carbon emissions from the construction industry is not yet captured in the model.
In addition, the indirect effects of each control variable are significantly higher than the direct effects, which further indicates that the spatial spillover effect has an important role in the carbon emissions from the construction industry in local areas.
4.4. Threshold Effect Analysis
Considering the large gap between the development level and energy intensity of the construction industry in the different provinces of China, this paper establishes a threshold model with CD and EI as threshold variables to further test for a nonlinear relationship between new-type urbanization and carbon emissions from the construction industry.
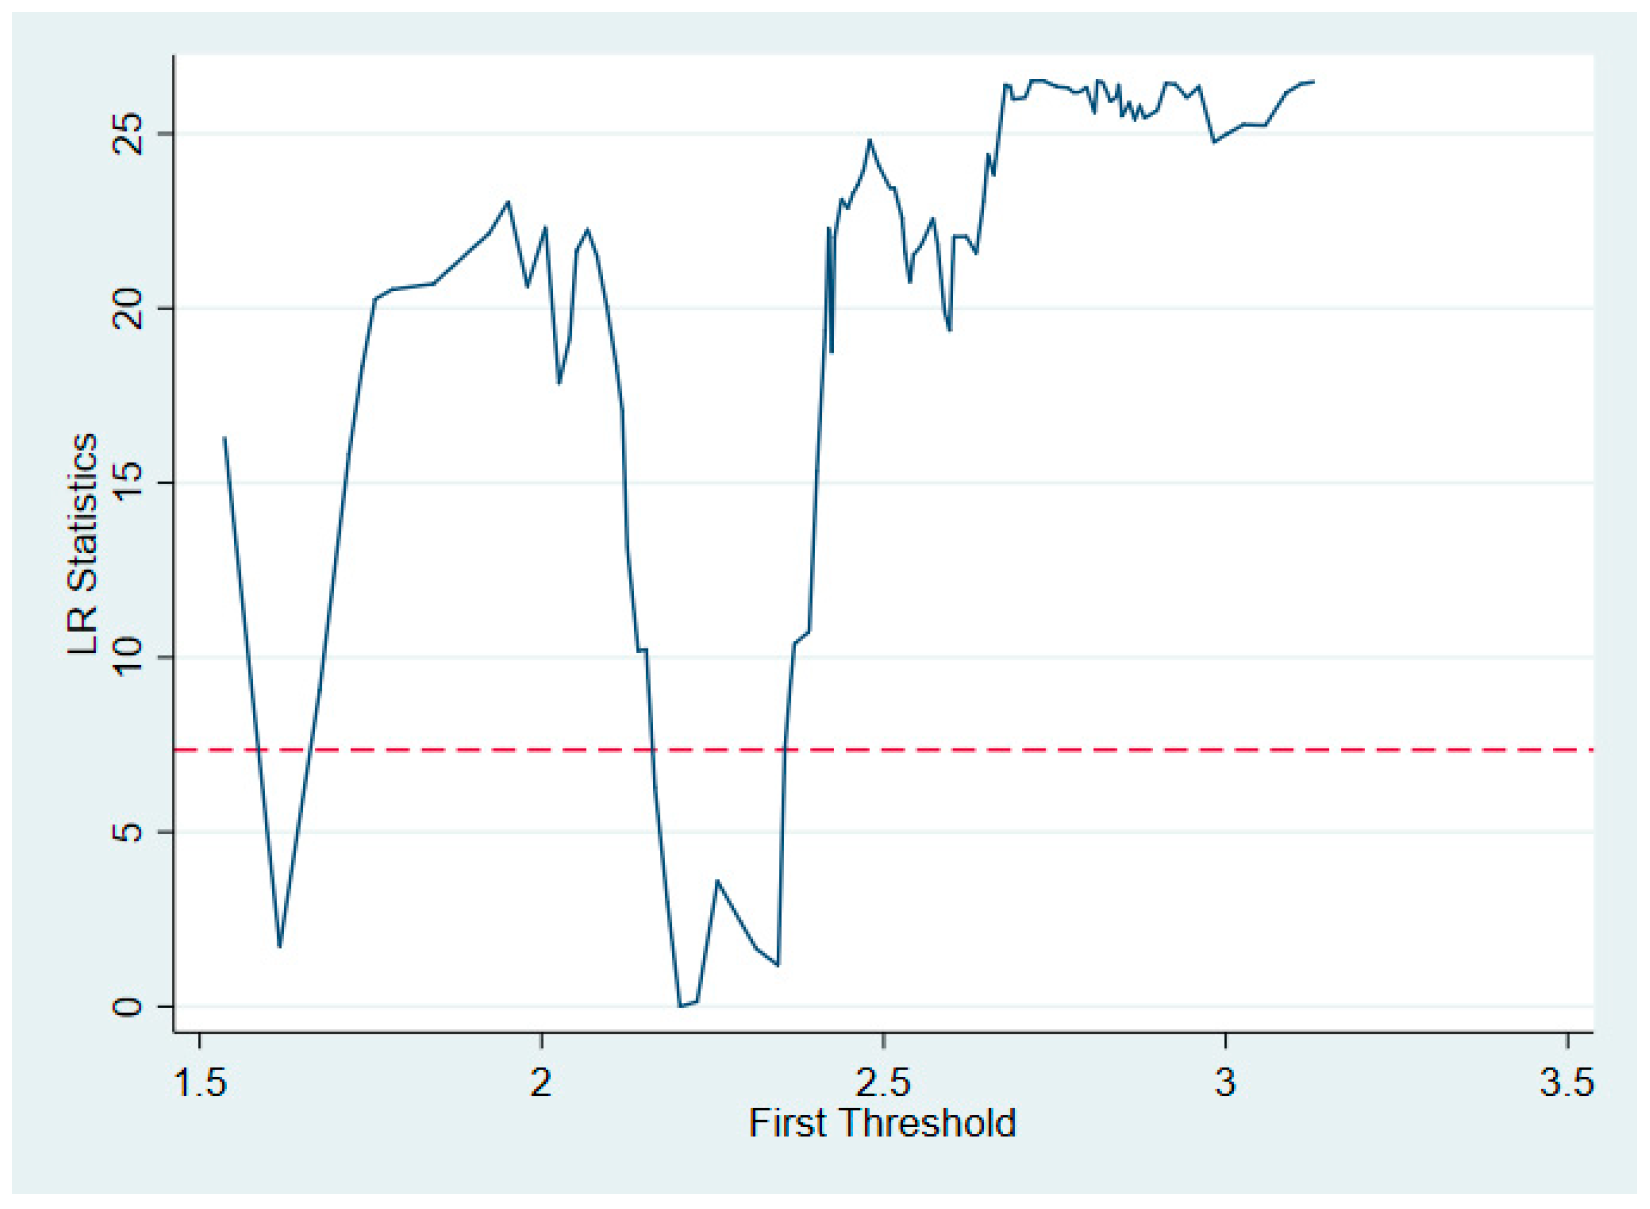
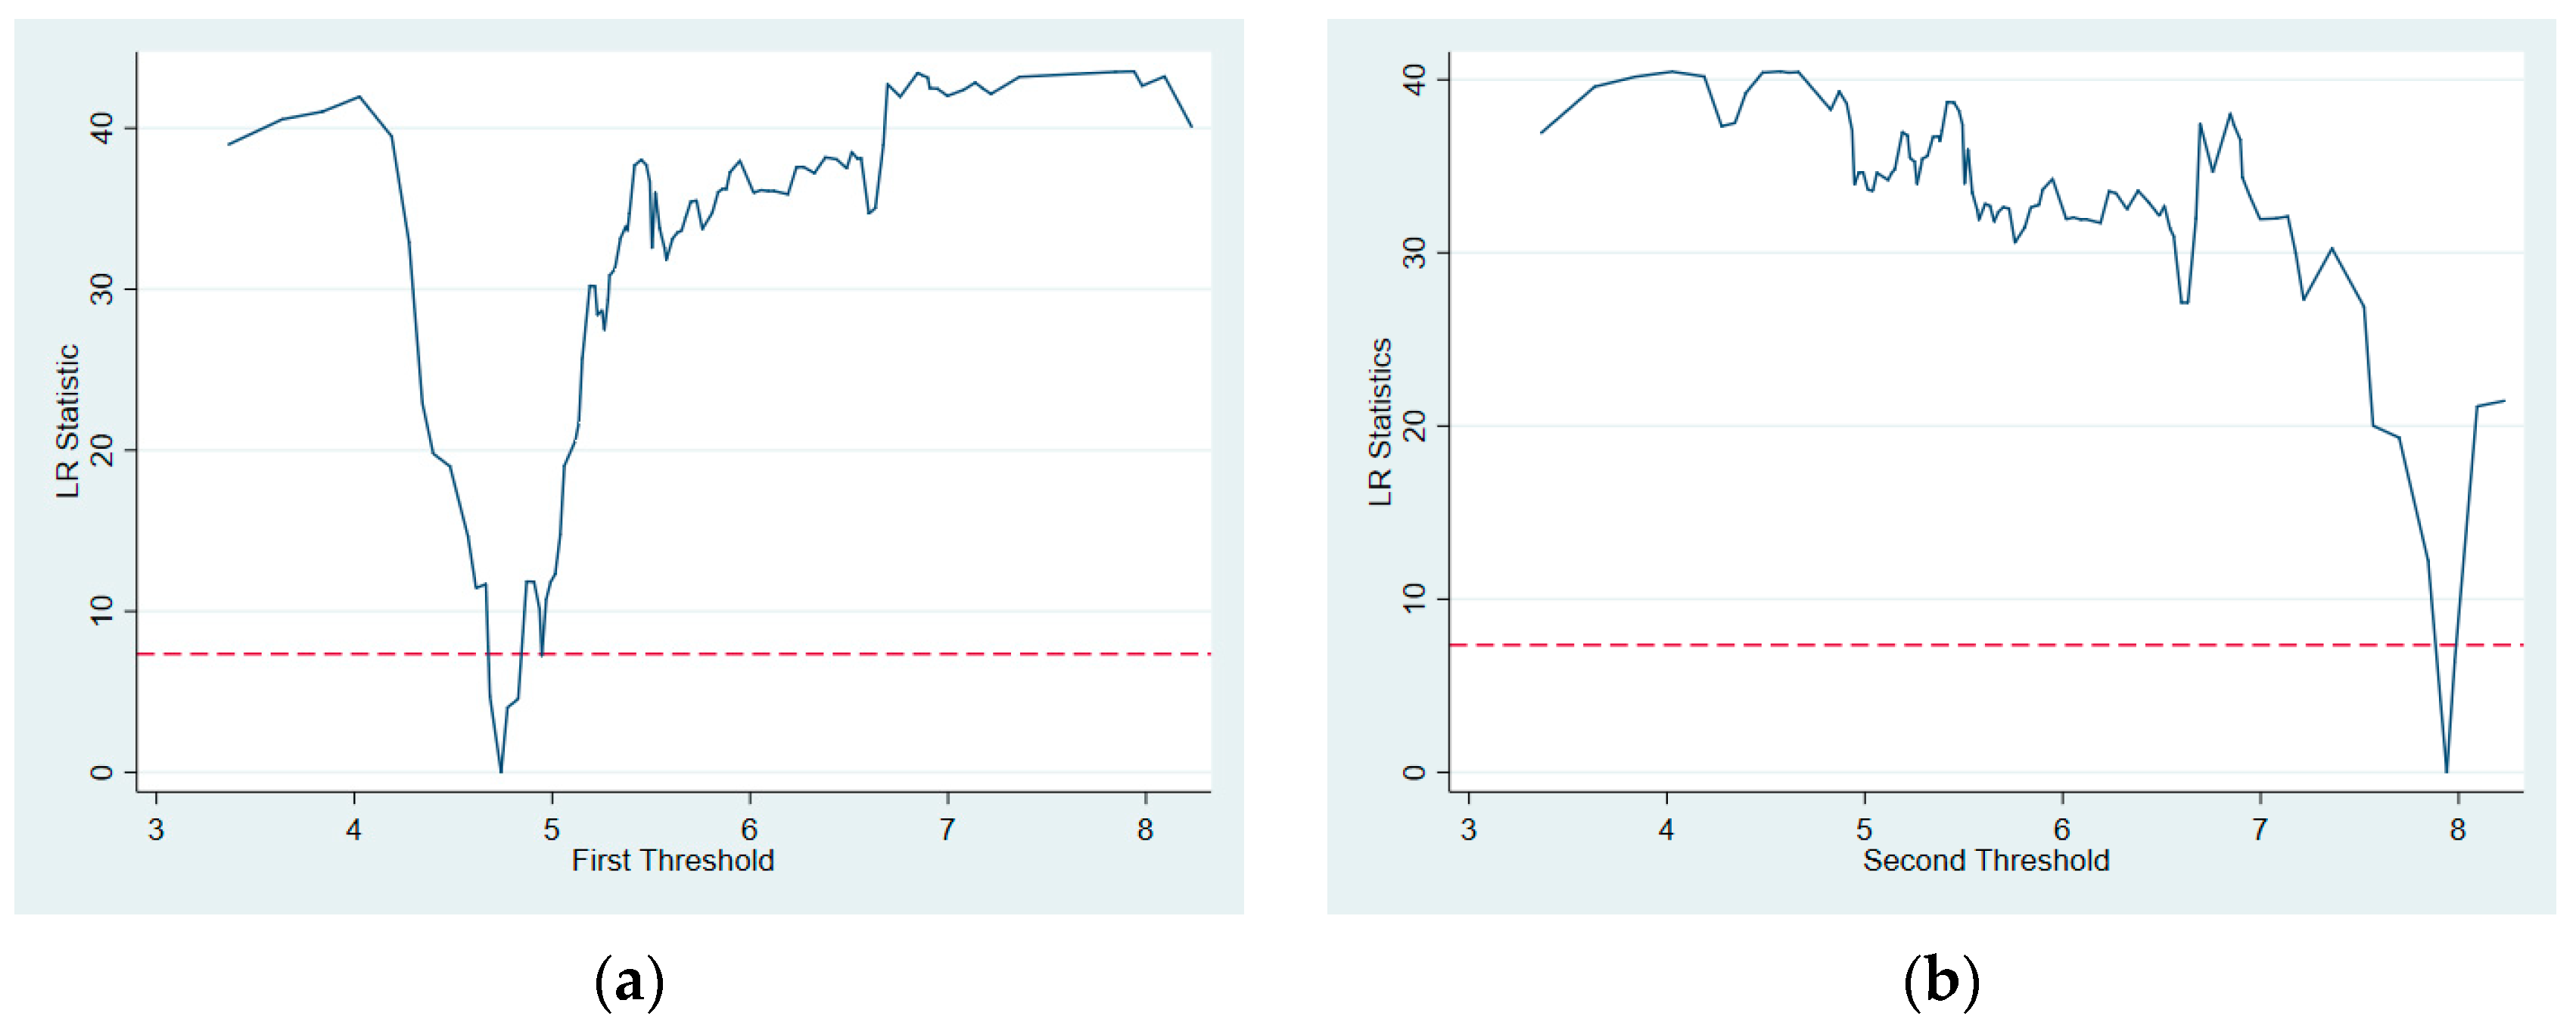
4.4.1. Threshold Effect Test and Estimation
The test results are shown in Table 9. This shows that there is a single threshold at the development level of the construction industry (CD) at a significance level of 1%, and a double threshold at the significance level of 5% in the energy intensity (EI) of the construction industry. To clearly display the threshold effect in different model settings, likelihood ratio function (LR) graphs were drawn. The LR test results are displayed in Figure 7 and Figure 8.
Table 9.
Significance test of the threshold effect.
Figure 7.
LR diagram with the threshold variable CD. (Note: The red dashed line represents a critical value of 5%. Source: calculated and organized by the authors).
Figure 8.
LR diagram with the threshold variable EI: (a) first threshold and (b) second threshold. (Note: The red dashed line represents a critical value of 5%. Source: calculated and organized by the authors).
The estimated results are shown in Table 10. Regardless of whether the threshold variable is CD or EI, the coefficients of new-type urbanization (NU) on the carbon emissions from the construction industry (CEC) are positive and significant at the 1% level, indicating that NU played a role in promoting the carbon emissions from the CEC in different sample intervals. When the CD is lower than 2.2023, the elasticity of the CD rate is 7.120, and when the CD exceeds this first threshold value, the promoting effect of the NU on the CEC will be enhanced and the positive elasticity of the urbanization will increase to 9.270. The results indicate that there exist differences in the relationship between NU and CEC owing to the different development levels of the construction industry. Thus, H2 was tested. Possible explanations for the above results are as follows. The increased level of development of the construction industry and the expansion of the scale of the construction industry will not only increase its own direct carbon emissions, but will also generate a large demand for construction materials and stimulate the carbon emissions from construction-related industries, thus increasing the total carbon emissions from the construction industry [52]. On the other hand, China’s construction industry is still in the upward phase of the inverted U-curve [14,47], and as the construction industry develops, its economic output will also grow, which will lead to an increase in carbon emissions from the construction industry.
Table 10.
Threshold effect coefficient estimation (the core explanatory variable is NU).
When taking energy intensity (EI) as the threshold variable, there exist double thresholds, and the relationship between NU and CEC can be decomposed into three stages, as displayed in Table 10. When EI is lower than 4.7418, the elasticity of the NU on the CEC is 7.657. And when EI exceeds the first and second threshold values (i.e., 4.7418 and 7.9407), the new-type urbanization rate increases and its positive correlation coefficient with the CEC is 10.267 and 14.010, respectively, both at the 1% significance level. And H3 was tested. The results imply that the influence of new-type urbanization on carbon emissions from the construction industry varies in different stages of energy intensity. There are possible explanations for the above results. The reduction in the level of building energy consumption indicates that the application of energy-saving and emission reduction technologies in the construction industry has achieved a carbon reduction effect [4]. In the process of new-type urbanization, all kinds of buildings serve as a carrier for realizing the industrial transformation and equalization of social and public services, etc. The effective application of energy-saving and emission reduction technologies has contributed to a reduction in carbon emissions in the construction process of buildings.
4.4.2. Statistical Analysis of Regional Differences in Threshold Effects
This study uses data from 2020 to classify China’s provinces into different groups based on the threshold values, as shown in Table 11. When CD is used as the threshold variable, two groups of high value areas and low value areas are divided; when using EI as the threshold variable, two groups are divided into medium value and low value zones. From the viewpoint of the development level of the construction industry, most of the provinces are in high value areas, and the carbon emissions from the construction industry brought by the improvement of the new-type urbanization level in these provinces increase more compared with the low value areas. From the perspective of energy intensity, most of the provinces are in the medium value areas, and the promotion effect of new-type urbanization development on carbon emissions from the construction industry in these provinces is more significant than the low value areas, and a few provinces are in the high value areas of energy consumption intensity.
Table 11.
Different threshold ranges and their provinces in 2020.
5. Conclusions and Policy Implications
Based on the panel data of 30 provinces in China from 2002 to 2020, this paper first measures the carbon emissions of China’s construction industry and constructs a comprehensive index system of new-type urbanization, uses a spatial econometric model and a panel threshold regression model, and empirically analyzes the impact of new-type urbanization on carbon emissions from the construction industry from both linear and nonlinear perspectives. The main conclusions are as follows:
- (1)
- The carbon emissions from China’s construction industry exhibit a significant positive spatial correlation, with more than half of provinces distributed as H-H and L-L types. High-carbon emission provinces tend to concentrate in the east and central regions, while low-carbon emission provinces are primarily located in the northwest and northeast of China.
- (2)
- New-type urbanization not only increases carbon emissions from the construction industry in local regions, but also has a spatial spillover effect on neighboring regions. This indirect effect is greater than the direct effect. Additionally, factors such as labor efficiency, energy intensity, industrial structure, and trade openness also significantly impact carbon emissions from the construction industry, with the indirect effect being greater than the direct effect.
- (3)
- There is a multi-threshold nonlinear relationship between new-type urbanization and carbon emissions from the construction industry. The estimated coefficients of new-type urbanization increase to different degrees when the development level and the energy consumption intensity of the construction industry cross the threshold values.
This paper is complementary to research on the impact of new-type urbanization on carbon emissions from the construction industry, which considers the spatial effect and threshold effect on the impact of new-type urbanization on carbon emissions from the construction industry. However, there remains scope for improvement. Firstly, this paper conducted a preliminary empirical study on the impact of new-type urbanization on carbon emissions from the construction industry, and the relationship between the two needs further research. Secondly, considering the availability of data, the dynamic effect is not taken into account when exploring the impact of new-type urbanization on carbon emissions from the construction industry.
The policy implications of this study are as follows:
- (1)
- Due to the significant spatial correlation between carbon emissions from the construction industry and the various aggregation types present in different regions, it is crucial to enhance collaboration and exchange between provinces for low-carbon development in the construction industry based on local circumstances. For instance, H-H type regions of carbon emissions such as the middle and lower reaches of the Yangtze River and the Pearl River Delta can establish a stable and effective industry linkage mechanism with L-L type regions in the west. This can entail signing contracts between the eastern provinces, which have a sizeable construction industry economic volume, and the western provinces, which are driving the development of new energy. Such collaboration can strengthen resource sharing and facilitate the flow of technology, capital and clean energy to jointly promote the low-carbon development of the construction industry.
- (2)
- The promotion of new-type urbanization processes is an important factor affecting the carbon emissions from the construction industry. The development of new-type urbanization requires the integration of urban and rural areas, as well as equitable access to public services, which rely on the construction industry to realize the extension of infrastructure and public services to the countryside [10], which will bring a large amount of carbon emissions to the construction industry; on the other hand, new-type urbanization is at the initial stage of the transition to a low-carbon economy, and the construction industry is still suffering from the problem of the crude mode of production, which results in significant energy consumption [78]. Hence, in the process of new-type urbanization, the government should pay more attention to the coordinated development of society and the environment, promote the development of green building and enhance the ability of construction enterprises to implement green construction, encourage technological innovation in building construction, and seize the opportunity to promote the further development of the low-carbonization, industrialization, and informatization of the construction industry.
- (3)
- The specific impact of new-type urbanization on carbon emissions from the construction industry is also subject to factors such as the level of development and the intensity of energy consumption in the construction industry. The level of development of the construction industry has a significant impact on carbon emissions. Thus, the government should deepen the supply-side reform of the construction industry, accelerate the pace of industrial restructuring, pay attention to moderate scale control, break through the existing shackles of industrial development, eliminate backward high-energy-consuming enterprises, and strongly support the development of energy-saving, innovative, and eco-friendly high-tech enterprises.
Reducing the energy intensity of the construction industry will help China’s provinces improve carbon emission efficiency. Construction industry stakeholders should enhance the construction capacity of green buildings and improve the recycling and reuse capacity of construction waste by improving the production process level of building materials such as recyclable timber structures and steel structures. In addition, technological innovation should be valued and encouraged, especially green low-carbon technologies, such as introducing low-carbon technical talents and capital, incubating low-carbon green projects, and enhancing the innovation vitality and initiative of talents and construction enterprises through innovation subsidies, so as to improve the carbon emission efficiency of the construction industry.
Author Contributions
Conceptualization, C.L. and H.C.; data curation, C.L.; formal analysis, C.L. and H.C.; methodology, C.L. and H.C.; resources, C.L. and H.C.; software, C.L.; validation, C.L. and H.C.; visualization, C.L.; writing—original draft, C.L.; writing—review and editing, C.L. and H.C. All authors have read and agreed to the published version of the manuscript.
Funding
This research received no external funding.
Institutional Review Board Statement
Not applicable.
Informed Consent Statement
Informed consent was obtained from all subjects involved in the study.
Data Availability Statement
The case analysis data used to support the findings of this study are available from the corresponding author upon request.
Conflicts of Interest
The authors declare no conflict of interest.
References
- IPCC. Climate Change 2021: The Physical Science Basis; IPCC: Geneva, Switzerland, 2021. [Google Scholar]
- IPCC. Climate Change 2022: Impacts, Adaptation and Vulnerability; IPCC: Geneva, Switzerland, 2022. [Google Scholar]
- Energy & Climate Intelligence Unit. Net Zero Scorecard. Available online: https://eciu.net/netzerotracker (accessed on 3 June 2023).
- Zhang, S.; Li, Z.; Ning, X.; Li, L. Gauging the Impacts of Urbanization on CO2 Emissions from the Construction Industry: Evidence from China. J. Environ. Manag. 2021, 288, 112440. [Google Scholar] [CrossRef] [PubMed]
- Sun Xiuyan to Reduce Carbon Dioxide Emissions, China Press the Fast Forward Button! Available online: http://env.people.com.cn/n1/2020/0930/c1010-31881043.html (accessed on 29 June 2023).
- Verisk Maplecroft. Home. Available online: https://www.maplecroft.com/ (accessed on 3 June 2023).
- Huo, T.; Li, X.; Cai, W.; Zuo, J.; Jia, F.; Wei, H. Exploring the Impact of Urbanization on Urban Building Carbon Emissions in China: Evidence from a Provincial Panel Data Model. Sustain. Cities Soc. 2020, 56, 102068. [Google Scholar] [CrossRef]
- Guan, X.; Wei, H.; Lu, S.; Dai, Q.; Su, H. Assessment on the Urbanization Strategy in China: Achievements, Challenges and Reflections. Habitat Int. 2018, 71, 97–109. [Google Scholar] [CrossRef]
- Full Text: Report on the Work of the Government. Available online: http://english.www.gov.cn/premier/speeches/2014/08/23/content_281474983012988.htm (accessed on 29 June 2023).
- Ma, S.; Li, Z.; Li, L.; Yuan, M. Coupling Coordination Degree Spatiotemporal Characteristics and Driving Factors between New Urbanization and Construction Industry: Evidence from China. Eng. Constr. Arch. Manag. 2022. [Google Scholar] [CrossRef]
- Kelly, S.; Shipworth, M.; Shipworth, D.; Gentry, M.; Wright, A.; Pollitt, M.; Crawford-Brown, D.; Lomas, K. Predicting the Diversity of Internal Temperatures from the English Residential Sector Using Panel Methods. Appl. Energy 2013, 102, 601–621. [Google Scholar] [CrossRef]
- Huo, T.; Ma, Y.; Cai, W.; Liu, B.; Mu, L. Will the Urbanization Process Influence the Peak of Carbon Emissions in the Building Sector? A Dynamic Scenario Simulation. Energy Build. 2021, 232, 110590. [Google Scholar] [CrossRef]
- Li, B.; Han, S.; Wang, Y.; Wang, Y.; Li, J.; Wang, Y. Feasibility Assessment of the Carbon Emissions Peak in China’s Construction Industry: Factor Decomposition and Peak Forecast. Sci. Total Environ. 2020, 706, 135716. [Google Scholar] [CrossRef]
- Chi, Y.; Liu, Z.; Wang, X.; Zhang, Y.; Wei, F. Provincial CO2 Emission Measurement and Analysis of the Construction Industry under China’s Carbon Neutrality Target. Sustainability 2021, 13, 1876. [Google Scholar] [CrossRef]
- Pu, X.; Yao, J.; Zheng, R. Forecast of Energy Consumption and Carbon Emissions in China’s Building Sector to 2060. Energies 2022, 15, 4950. [Google Scholar] [CrossRef]
- Zhang, Y.; Hu, S.; Guo, F.; Mastrucci, A.; Zhang, S.; Yang, Z.; Yan, D. Assessing the Potential of Decarbonizing China’s Building Construction by 2060 and Synergy with Industry Sector. J. Clean. Prod. 2022, 359, 132086. [Google Scholar] [CrossRef]
- XINHUANET. The Central Economic Work Conference First Mentioned “Actively and Steadily Promote Urbanization”. Available online: http://www.xinhuanet.com/politics/2012-12/17/c_124104403.htm (accessed on 23 August 2023).
- Gao, R.; Song, Y.; Zhang, X. Research on the Connotation Characteristics, Level Measurement and Promotion Path of China’s New-Type Urbanization. Ningxia Soc. Sci. 2022, 5, 102–110. [Google Scholar]
- Conceptual Discernment: Urbanization, Urbanization and New Urbanization. Available online: https://www.ndrc.gov.cn/xwdt/ztzl/xxczhjs/ghzc/201608/t20160824_972008.html (accessed on 23 August 2023).
- Zhang, R.; Jiao, H. A Review on New Urbanization Research in China. World Reg. Stud. 2016, 25, 8. [Google Scholar]
- Dong, X.; Yang, C.; Liu, X. The Exploration of China New Urbanization Theory. Urban Dev. Stud. 2017, 24, 26–34. [Google Scholar]
- Shan, Z.; Huang, Y. An Analysis of the Concept, Goals, Contents, Planning Strategies and Misunderstandings of New Urbanization. Urban Plan. Forum 2013, 2, 16–22. [Google Scholar]
- National New-Type Urbanization Plan (2014–2020). Available online: https://www.gov.cn/zhengce/2014-03/16/content_2640075.htm (accessed on 24 August 2023).
- Wang, W.-Z.; Liu, L.-C.; Liao, H.; Wei, Y.-M. Impacts of Urbanization on Carbon Emissions: An Empirical Analysis from OECD Countries. Energy Policy 2021, 151, 112171. [Google Scholar] [CrossRef]
- Liang, X.; Fan, M.; Xiao, Y.; Yao, J. Temporal-Spatial Characteristics of Energy-Based Carbon Dioxide Emissions and Driving Factors during 2004–2019, China. Energy 2022, 261, 124965. [Google Scholar] [CrossRef]
- Nathaniel, S.; Khan, S.A.R. The Nexus between Urbanization, Renewable Energy, Trade, and Ecological Footprint in ASEAN Countries. J. Clean. Prod. 2020, 272, 122709. [Google Scholar] [CrossRef]
- Huo, T.; Cao, R.; Du, H.; Zhang, J.; Cai, W.; Liu, B. Nonlinear Influence of Urbanization on China’s Urban Residential Building Carbon Emissions: New Evidence from Panel Threshold Model. Sci. Total Environ. 2021, 772, 145058. [Google Scholar] [CrossRef]
- Yao, F.; Zhu, H.; Wang, M. The Impact of Multiple Dimensions of Urbanization on CO2 Emissions: A Spatial and Threshold Analysis of Panel Data on China’s Prefecture-Level Cities. Sustain. Cities Soc. 2021, 73, 103113. [Google Scholar] [CrossRef]
- Guo, R.; Li, N.; Mu, H.; Zhang, M.; Yang, X.; Han, Y.; Yao, R.; Shao, Z. Study on the Impact of Comprehensive Urbanization on Urban Civil Building CO2 Emissions in China. Environ. Sci. Pollut. Res. 2022, 29, 17709–17722. [Google Scholar] [CrossRef]
- Wang, Z.; Sun, Y.; Wang, B. How Does the New-Type Urbanisation Affect CO2 Emissions in China? An Empirical Analysis from the Perspective of Technological Progress. Energy Econ. 2019, 80, 917–927. [Google Scholar] [CrossRef]
- Liu, Y.; Xiao, H.; Lv, Y.; Zhang, N. The Effect of New-Type Urbanization on Energy Consumption in China: A Spatial Econometric Analysis. J. Clean. Prod. 2017, 163, S299–S305. [Google Scholar] [CrossRef]
- Zhang, W.; Xu, Y.; Jiang, L.; Streets, D.G.; Wang, C. Direct and Spillover Effects of New-Type Urbanization on CO2 Emissions from Central Heating Sector and EKC Analyses: Evidence from 144 Cities in China. Resour. Conserv. Recycl. 2023, 192, 106913. [Google Scholar] [CrossRef]
- Li, W.; Sun, W.; Li, G.; Cui, P.; Wu, W.; Jin, B. Temporal and Spatial Heterogeneity of Carbon Intensity in China’s Construction Industry. Resour. Conserv. Recycl. 2017, 126, 162–173. [Google Scholar] [CrossRef]
- Xiao, Y.; Huang, H.; Qian, X.-M.; Zhang, L.-Y.; An, B.-W. Can New-Type Urbanization Reduce Urban Building Carbon Emissions? New Evidence from China. Sustain. Cities Soc. 2023, 90, 104410. [Google Scholar] [CrossRef]
- Wang, Z.; Zhou, Y.; Zhao, N.; Wang, T.; Zhang, Z. Spatial Correlation Network and Driving Effect of Carbon Emission Intensity in China’s Construction Industry. Buildings 2022, 12, 201. [Google Scholar] [CrossRef]
- Nässén, J.; Holmberg, J.; Wadeskog, A.; Nyman, M. Direct and Indirect Energy Use and Carbon Emissions in the Production Phase of Buildings: An Input–Output Analysis. Energy 2007, 32, 1593–1602. [Google Scholar] [CrossRef]
- Acquaye, A.A.; Duffy, A.P. Input–Output Analysis of Irish Construction Sector Greenhouse Gas Emissions. Build. Environ. 2010, 45, 784–791. [Google Scholar] [CrossRef]
- Zhang, Z.; Liu, R. Carbon Emissions in the Construction Sector Based on Input-Output Analyses. Tslnghua Sci. Technol. 2013, 53, 53–57. [Google Scholar]
- Chen, J.; Shen, L.; Song, X.; Shi, Q.; Li, S. An Empirical Study on the CO2 Emissions in the Chinese Construction Industry. J. Clean. Prod. 2017, 168, 645–654. [Google Scholar] [CrossRef]
- Bastos, J.; Batterman, S.A.; Freire, F. Life-Cycle Energy and Greenhouse Gas Analysis of Three Building Types in a Residential Area in Lisbon. Energy Build. 2014, 69, 344–353. [Google Scholar] [CrossRef]
- Chau, C.K.; Leung, T.M.; Ng, W.Y. A Review on Life Cycle Assessment, Life Cycle Energy Assessment and Life Cycle Carbon Emissions Assessment on Buildings. Appl. Energy 2015, 143, 395–413. [Google Scholar] [CrossRef]
- Zhang, Z.; Wang, B. Research on the Life-Cycle CO2 Emission of China’s Construction Sector. Energy Build. 2016, 112, 244–255. [Google Scholar] [CrossRef]
- Liu, B.; Tian, C.; Li, Y.; Song, H.; Ma, Z. Research on the Effects of Urbanization on Carbon Emissions Efficiency of Urban Agglomerations in China. J. Clean. Prod. 2018, 197, 1374–1381. [Google Scholar] [CrossRef]
- Bai, Y.; Deng, X.; Gibson, J.; Zhao, Z.; Xu, H. How Does Urbanization Affect Residential CO2 Emissions? An Analysis on Urban Agglomerations of China. J. Clean. Prod. 2019, 209, 876–885. [Google Scholar] [CrossRef]
- Fan, J.; Wang, J.; Qiu, J.; Li, N. Stage Effects of Energy Consumption and Carbon Emissions in the Process of Urbanization: Evidence from 30 Provinces in China. Energy 2023, 276, 127655. [Google Scholar] [CrossRef]
- Lu, N.; Feng, S.; Liu, Z.; Wang, W.; Lu, H.; Wang, M. The Determinants of Carbon Emissions in the Chinese Construction Industry: A Spatial Analysis. Sustainability 2020, 12, 1428. [Google Scholar] [CrossRef]
- Wen, Q.; Chen, Y.; Hong, J.; Chen, Y.; Ni, D.; Shen, Q. Spillover Effect of Technological Innovation on CO2 Emissions in China’s Construction Industry. Build. Environ. 2020, 171, 106653. [Google Scholar] [CrossRef]
- Chen, J.; Gao, M.; Mangla, S.K.; Song, M.; Wen, J. Effects of Technological Changes on China’s Carbon Emissions. Technol. Forecast. Soc. Chang. 2020, 153, 119938. [Google Scholar] [CrossRef]
- Li, L.; Li, Y. The Spatial Relationship between CO2 Emissions and Economic Growth in the Construction Industry: Based on the Tapio Decoupling Model and STIRPAT Model. Sustainability 2022, 15, 528. [Google Scholar] [CrossRef]
- Yao, X.; Kou, D.; Shao, S.; Li, X.; Wang, W.; Zhang, C. Can Urbanization Process and Carbon Emission Abatement Be Harmonious? New Evidence from China. Environ. Impact Assess. Rev. 2018, 71, 70–83. [Google Scholar] [CrossRef]
- Wu, P.; Song, Y.; Zhu, J.; Chang, R. Analyzing the Influence Factors of the Carbon Emissions from China’s Building and Construction Industry from 2000 to 2015. J. Clean. Prod. 2019, 221, 552–566. [Google Scholar] [CrossRef]
- Zhu, C.; Chang, Y.; Li, X.; Shan, M. Factors Influencing Embodied Carbon Emissions of China’s Building Sector: An Analysis Based on Extended STIRPAT Modeling. Energy Build. 2022, 255, 111607. [Google Scholar] [CrossRef]
- Chen, H.; Du, Q.; Huo, T.; Liu, P.; Cai, W.; Liu, B. Spatiotemporal Patterns and Driving Mechanism of Carbon Emissions in China’s Urban Residential Building Sector. Energy 2023, 263, 126102. [Google Scholar] [CrossRef]
- Yang, X.; Jia, Z.; Yang, Z.; Yuan, X. The Effects of Technological Factors on Carbon Emissions from Various Sectors in China—A Spatial Perspective. J. Clean. Prod. 2021, 301, 126949. [Google Scholar] [CrossRef]
- Sun, Y.; Hao, S.; Long, X. A Study on the Measurement and Influencing Factors of Carbon Emissions in China’s Construction Sector. Build. Environ. 2023, 229, 109912. [Google Scholar] [CrossRef]
- Al-mulali, U.; Binti Che Sab, C.N.; Fereidouni, H.G. Exploring the Bi-Directional Long Run Relationship between Urbanization, Energy Consumption, and Carbon Dioxide Emission. Energy 2012, 46, 156–167. [Google Scholar] [CrossRef]
- Zhang, T.; Yang, J.; Sheng, P. The Impacts and Channels of Urbanization on Carbon Dioxide Emissions in China. China Popul. Resour. Environ. 2016, 26, 47–57. [Google Scholar]
- Sharma, S.S. Determinants of Carbon Dioxide Emissions: Empirical Evidence from 69 Countries. Appl. Energy 2011, 88, 376–382. [Google Scholar] [CrossRef]
- Xu, B.; Lin, B. How Industrialization and Urbanization Process Impacts on CO2 Emissions in China: Evidence from Nonparametric Additive Regression Models. Energy Econ. 2015, 48, 188–202. [Google Scholar] [CrossRef]
- Zhou, C.; Wang, S.; Wang, J. Examining the Influences of Urbanization on Carbon Dioxide Emissions in the Yangtze River Delta, China: Kuznets Curve Relationship. Sci. Total Environ. 2019, 675, 472–482. [Google Scholar] [CrossRef] [PubMed]
- Chen, C.; Qin, Y.; Gao, Y. Does New Urbanization Affect CO2 Emissions in China: A Spatial Econometric Analysis. Sustain. Cities Soc. 2023, 96, 104687. [Google Scholar] [CrossRef]
- Chen, W.; Wang, G.; Xu, N.; Ji, M.; Zeng, J. Promoting or Inhibiting? New-Type Urbanization and Urban Carbon Emissions Efficiency in China. Cities 2023, 140, 104429. [Google Scholar] [CrossRef]
- Zhang, Y.; Chen, X. Spatial and Nonlinear Effects of New-Type Urbanization and Technological Innovation on Industrial Carbon Dioxide Emission in the Yangtze River Delta. Environ. Sci. Pollut. Res. Int. 2023, 30, 29243–29257. [Google Scholar] [CrossRef] [PubMed]
- Tang, L.; Hu, Z.; Su, J.; Xiao, P. Threshold Effects and Area Differences: The Impacts of Urbanization on Residential Carbon Missions. Chin. J. Manag. 2015, 12, 291–298. [Google Scholar]
- Taylor, J.R. The China Dream Is an Urban Dream: Assessing the CPC’s National New-Type Urbanization Plan. J. Chin. Political Sci. 2015, 20, 107–120. [Google Scholar] [CrossRef]
- Cheshmehzangi, A. China’s New-Type Urbanisation Plan (NUP) and the Foreseeing Challenges for Decarbonization of Cities: A Review. Energy Procedia 2016, 104, 146–152. [Google Scholar] [CrossRef]
- QI, S.; ZHANG, Y. Research on the Influencing Factors and Reduction Strategies of Carbon Emission of Construction Industry in China. Soft Sci. 2013, 27, 39–43. [Google Scholar]
- Wang, Y.; Shi, H.; Hao, Z.; Yan, H.; Huang, W. Analysis of Carbon Emission Intensity Distribution and Spatial Effect of China’s Construction Industry Based on the Spatial Durbin Model. J. Eng. Manag. 2021, 35, 1–6. [Google Scholar]
- Anselin, L. Lagrange Multiplier Test Diagnostics for Spatial Dependence and Spatial Heterogeneity. Geogr. Anal. 1988, 20, 1–17. [Google Scholar] [CrossRef]
- Pace, J.L.; Kelley, R. Introduction to Spatial Econometrics; Chapman and Hall/CRC: New York, NY, USA, 2009; ISBN 978-0-429-13808-9. [Google Scholar]
- Hansen, B.E. Threshold Efects in Non-Dynamic Panels: Estimation, Testing, and Inference. J. Econom. 1999, 93, 345–368. [Google Scholar] [CrossRef]
- Fan, J.; Zhou, L. Spatiotemporal Distribution and Provincial Contribution Decomposition of Carbon Emissions for the Construction Industry in China. Resour. Sci. 2019, 41, 897–907. [Google Scholar] [CrossRef]
- Yu, B. Ecological Effects of New-Type Urbanization in China. Renew. Sustain. Energy Rev. 2021, 135, 110239. [Google Scholar] [CrossRef]
- Chen, M.; Liu, W.; Lu, D.; Chen, H.; Ye, C. Progress of China’s New-Type Urbanization Construction since 2014: A Preliminary Assessment. Cities 2018, 78, 180–193. [Google Scholar] [CrossRef]
- Wang, Y.; Luo, X.; Chen, W.; Zhao, M.; Wang, B. Exploring the Spatial Effect of Urbanization on Multi-Sectoral CO2 Emissions in China. Atmos. Pollut. Res. 2019, 10, 1610–1620. [Google Scholar] [CrossRef]
- Du, Q.; Wu, M.; Wang, N.; Bai, L. Spatiotemporal Characteristics and Influencing Factors of China’s Construction Industry Carbon Intensity. Pol. J. Environ. Stud. 2017, 26, 2507–2521. [Google Scholar] [CrossRef]
- LeSage, J.P.; Pace, R.K. Spatial Econometric Models. In Handbook of Applied Spatial Analysis: Software Tools, Methods and Applications; Fischer, M.M., Getis, A., Eds.; Springer: Berlin/Heidelberg, Germany, 2010; pp. 355–376. ISBN 978-3-642-03647-7. [Google Scholar]
- Zhu, H.; Ren, L.; Cai, M. Influencing Factors and Prevention and Control of Quality in the Components Production and Transportation Process of Prefabricated Building. Eng. Adv. 2023, 3, 101–104. [Google Scholar] [CrossRef]
Disclaimer/Publisher’s Note: The statements, opinions and data contained in all publications are solely those of the individual author(s) and contributor(s) and not of MDPI and/or the editor(s). MDPI and/or the editor(s) disclaim responsibility for any injury to people or property resulting from any ideas, methods, instructions or products referred to in the content. |
© 2023 by the authors. Licensee MDPI, Basel, Switzerland. This article is an open access article distributed under the terms and conditions of the Creative Commons Attribution (CC BY) license (https://creativecommons.org/licenses/by/4.0/).