Abstract
Reducing net carbon emissions is of great significance for sustainability. Carbon capture, utilization, and storage (CCUS) technology is regarded as one of the most effective approaches to reducing net carbon emissions. A prerequisite for the implementation of the CO2 geological storage project is the assessment of the storage potential of the storage site. In this study, a calculation method of storage potential was proposed to estimate the CO2 storage potential of the Yanchang shale gas reservoir in the Ordos Basin, China. In this method, the CO2 sealing capability of the caprock is taken into account, which determines the maximum CO2 storage pressure of the reservoir. The overall CO2 storage potential consists of four types of storage states (free-state, adsorption, dissolution, and mineralization). The maximum CO2 storage pressure of the Yanchang shale gas reservoir is 13.4 MPa via breakthrough pressure experiments, and the corresponding theoretical storage potential is 7.59 × 10¹¹ t. The potential for free-state, adsorption, dissolution, and mineralization sequestration are 8.42 × 10¹⁰ t, 6.88 × 10¹⁰ t, 2.45 × 10⁹ t, and 6.05 × 10¹¹ t, respectively. Due to the difficulty in completing mineralization within the engineering time scale, the mineralization potential should not be taken into account when estimating the available CO2 storage potential. The available CO2 potential (including free-state, adsorption, and dissolution) of the Yanchang shale gas reservoir is 1.54 × 10¹¹ t, which is a considerable amount. The Yanchang shale gas formation will be able to accommodate 41.49% of global annual CO2 emissions (according to the data in 2021) if the available CO2 storage potential of the Yanchang shale gas reservoir is fully exploited.
1. Introduction
The global warming effect caused by exceeded carbon emissions has attracted worldwide attention. Reducing net carbon emissions is of great significance for sustainability. Carbon capture, utilization, and storage (CCUS) technology is considered to be one of the most effective approaches to reduce net carbon emissions [,,,]. The International Energy Agency (IEA) estimated that CCUS technology will undertake 19% of the global carbon emission reduction task and become the single technology with the largest share of carbon emission reduction by 2050 [].
The available formations for CO2 geological storage include deep saline aquifers, developed oil and gas reservoirs, and non-minable coal seams [,,,,,,]. However, some recent studies show that shale gas reservoirs are also candidates for CO2 geological storage due to the following reasons: (1) Widely distributed shale gas reservoirs can provide huge storage space. (2) Millions of years of shale gas preservation history can confirm the validity of the trap. (3) The geological data and wellbore retained during the shale gas development process can be reused to lower the costs. (4) The injection of CO2 can improve the recovery of CH4, which brings additional economic benefit [,,,,,,,,]. In an earlier field experiment, CO2 was injected into the Yanchang shale gas formation with the aim of increasing production. The gas composition monitoring results showed that the concentration of CO2 in the reverse exhaust gas was equivalent to the original CO2 concentration of the gas reservoir, which indicated that CO2 could be effectively sequestrated in the Yanchang shale gas reservoir [,]. Shale formations, especially depleted shale units previously used for gas extraction, have good economics and reliability when used for CO2 geological storage.
A prerequisite for the implementation of geological storage of CO2 is the assessment of the storage potential of the storage site. Several methods have been proposed to estimate the CO2 storage potential in different types of formations. The Carbon Sequestration Leaders Forum (CSLF) and the United States Department of Energy (DOE) proposed estimating methods of CO2 storage potential for deep saline aquifers and non-minable coal seams, respectively [,]. Shen et al. proposed an estimation method for oil reservoirs [,]. Recently, the CO2 storage potential of shale formations has also been a concern [,]. Godec et al. estimated that the CO2 storage potential of Marcellus shale formation could reach 55 Gt []. Nuttall et al. estimated that 28 Gt CO2 could be sequestered in the Devonian shales underlying Kentucky []. CO2 will be sequestrated in shale gas reservoirs in four states, i.e., free-state, adsorption, dissolution, and mineralization. The aforementioned methods for estimating CO2 sequestration potential do not fully consider the contribution of each sequestration state. Furthermore, these methods do not consider the sealing capacity of the caprock, which may result in an overestimation of the potential beyond safe sequestration limits.
The contribution of each storage state to the overall CO2 storage potential (OCSP) is affected by temperature, pressure, petrology, mineralogy, and hydrogeological conditions. A large amount of CO2 injection will lead to increased pressure in shale reservoirs, and leakage will occur when the reservoir pressure exceeds the sealing capability of the overlying caprock. Thus, the assessment of CO2 sequestration potential must take into account the sealing capability of caprock. A caprock is usually with low permeability, low porosity, and high brine saturation []. Caprock’s key sealing mechanism has been identified as capillary sealing, which takes place at the CO2–brine interface and prevents CO2 from migrating upward [,]. Capillary sealing efficiency is controlled by the gas-liquid interfacial tension (IFT), the water wettability of the caprock mineral, and the pore size distribution within the caprock. Breakthrough pressure (BP) is the parameter that best reflects the capillary sealing efficiency of caprocks, which is defined as the minimum gas pressure required to overcome the capillary pressure in the largest pore channels [,,,]. From an experimental perspective, BP refers to the pressure difference between the inlet and outlet when the gas flow is formed in a brine-saturated sample [,,]. The BP of caprock determines the upper limit of CO2 storage pressure, which in turn controls the storage potential. It is necessary to determine the maximum storage pressure before evaluating the CO2 storage potential of the shale gas reservoir. Due to the differences between CO2–brine IFT and CH4-brine IFT, there may be significant differences in the sealing efficiency of the same caprock for CO2 and CH4 [,]. Therefore, the idea that the maximum CO2 storage pressure in depleted shale gas reservoirs can reach the original pressure of gas reservoirs may lead to wrong estimates. The maximum storage pressure should be determined by the experimental method.
The upper Triassic Yanchang formation (Chang7 member) is a typical continental shale gas reservoir located in the Ordos Basin, China. The reasons for choosing the Yanchang Shale Formation in this study include the following: (1) The Yanchang Shale Formation is widely distributed, which can provide a huge storage capacity for CO2; (2) There are many concentrated sources of CO2 emissions (chemical factory, power plants) within the Ordos Basin, providing a good match for CO2 source and sink when choosing Yanchang Shale Formation as a storage site; (3) Preliminary field-scale CO2 injection experiments have already been conducted in the Yanchang Shale Formation, proving the feasibility of CO2 sequestration in this stratum. These favorable conditions make the Yanchang Shale Formation a possibility of becoming the target formation for large-scale CO2 geological storage.
In this study, a calculation method for CO2 storage potential considering the sealing capability of caprock was proposed. A series of experiments, including breakthrough pressure tests, nuclear magnetic resonance (NMR), CO2 isothermal adsorption, and X-ray diffraction, were conducted to determine the sealing capability, pore structure, adsorption capability, and mineralogy of Yanchang shale. The CO2 storage potential of Yanchang shale formation was estimated according to the results. The innovation of this study lies in proposing a model for estimating CO2 storage potential that takes into account the capillary sealing capacity of the caprock and the different storage states of CO2 in shale and, for the first time, estimating the available sequestration potential of the Yanchang Shale Formation. The results of this study provide a theoretical basis for the feasibility assessment of large-scale CO2 geological sequestration in the Yanchang Shale Formation, which has positive implications for global sustainability.
2. Geological Settings
The Ordos Basin is located at the tectonic joint of the eastern and western domains in China, which can be divided into six secondary tectonic units (termed as Western Margin Thrust Belt, Tianhuan Depression, Yishaan Slope, Jinxi Flexural Fold, Yimeng Uplift, and Weibei Uplift) according to the present structural morphology and evolution history of the basin (Figure 1a) []. The Yanchang Formation was formed during the Late Triassic and can be divided into 10 sections from top to bottom [,]. The Chang7 member is the main shale gas-bearing formation, whose thickness distribution is shown in Figure 1b []. The burial depth of the Chang 7 reservoir is between 1200 m and 1800 m, with an average reservoir temperature of 50 °C. The Chang7 member can be further divided into three sub-members: Chang71, Chang72, and Chang73. The Chang71 and Chang72, located in the middle and lower sections, are gas-bearing formations. The electric logging results show that the resistivity of the Chang71 section is much lower than that of the Chang72 section and Chang73 section, indicating that it is highly water-saturated and can be regarded as the direct caprock of Chang7 shale gas formation (Figure 1c) [].
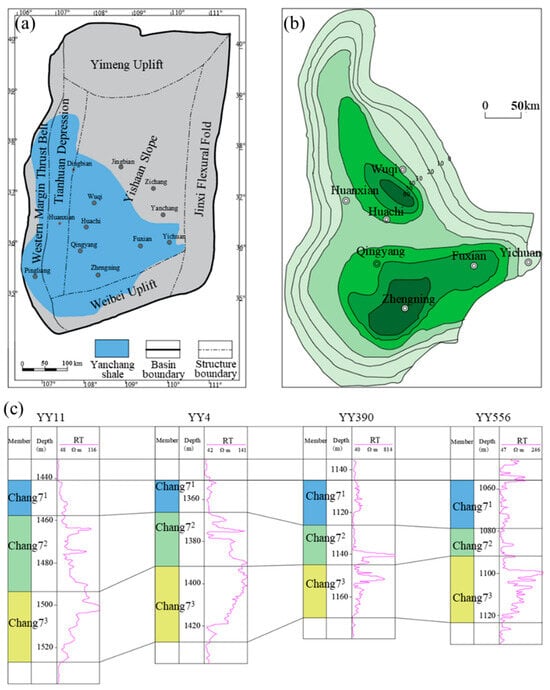
Figure 1.
(a) Tectonic of Ordos Basin and distribution of Yanchang shale. (b) The thickness distribution of Chang7 members. (c) The electric logging results of Chang7 member, which indicate that the upper section of Chang7 member is highly water-saturated (modified from [,]).
3. Methodology
3.1. Storage Potential Evaluation
The conceptual model shown in Figure 2 illustrates the sealing and storage mechanism of CO2 in Yanchang shale gas formation. The highly water-saturated layer located at the upper section of the Chang 7 member forms a capillary sealing mechanism that prevents the upward migration of CO2. The original gas-bearing layer provides storage space for CO2. CO2 will be stored in the states of free-state, adsorption, dissolution, and mineralization. The upper limit of capillary sealing capability can be expressed as follows [,]:
where is the maximum storage pressure, MPa; is the breakthrough pressure of caprock; and is the overlying hydrostatic pressure, MPa.
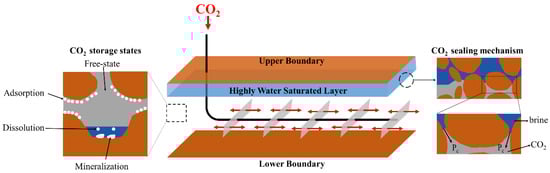
Figure 2.
Conceptual model of CO2 geological storage in Yanchang shale gas formation. The high water saturation layer seals CO2 via capillary sealing mechanism. CO2 stored in the states of free-state, adsorption, dissolution, and mineralization.
The middle and lower sections of the Chang7 member provide CO2 storage space, where CO2 is stored in free, adsorbed, dissolved, and mineralized states. The total storage potential is equal to the sum of the four states of CO2. The storage potential of free CO2 can be calculated as
where is the storage potential of free CO2 in unit volume shale, kg/m3; is the porosity of shale, %; is the molar mass of CO2, 0.044 kg/mol; is the water saturation of shale reservoir, %; is the volume of adsorption phase in unit volume shale, dimensionless; is the average reservoir temperature, K; is the compressibility factor of CO2; and R is the universal gas constant, 8.314 J/(mol·K).
There are many classical models to describe the adsorption behavior of CO2 in shale, including the Langmuir model, Dubinin–Radushkevich (D-R) model, Dubinin-Astakhov (D-A) model, etc. The Langmuir model, despite its simplicity and computational convenience, maintains an excellent fit and is thus widely employed. Consequently, we opted to use the Langmuir model for the calculation of the adsorption storage potential, which can be expressed as
where is the amount of CO2 absorbed in unit mass shale, m3/kg; and are the Langmuir volume and the Langmuir pressure, respectively, which can be obtained via isothermal adsorption experiment. Considering the pore space occupied by the adsorbed phase, excess adsorption was used to calculate the sequestration potential as follows:
where is the storage potential of absorbed CO2 in unit volume shale, kg/m3. is the density of shale, 2700 kg/m3; and is the density of CO2 at standard condition, 1.96 kg/m3. is the density of adsorbed phase, 1180 kg/m3.
The storage potential of dissolved CO2 can be calculated as
where is the storage potential of dissolved CO2 in unit volume shale, kg/m3; and is the solubility of CO2, kg/m3, which can be calculated according to the Duan model [].
When CO2 dissolves in water, a carbonate ion is generated and can react with divalent cations and lead to carbonate precipitation. CaCO3, MgCO3, and FeCO3 are regarded as the main mineral trapping types. Those non-carbonate minerals that release Ca2+, Mg2+, and Fe2+ via dissolution reactions are considered minerals with carbon trapping potential. The carbon trapping potential of minerals can be estimated by calculating the amount of CO2 consumed when all the Ca2+, Mg2+, and Fe2+ in non-carbonate minerals in a unit volume of rock are transferred to carbonate precipitations. The storage potential of mineralized CO2 can be calculated as [,]
where is the storage potential of dissolved CO2 in unit volume shale, kg/m3; is the mineral content (illite and montmorillonite) favorable for mineralization, kg/m3; and is the trapping potential of the minerals (ri = 0.41, rm = 0.03).
The overall CO2 storage potential of the Yanchang shale gas formation can be calculated as
where is the total CO2 storage potential of the Yanchang shale gas formation, kg/m3; is the area of ith block, m2; and is the thickness of ith block, m.
3.2. Breakthrough Pressure Experiment
The Step-by-Step (SBS) method was employed to measure the CO2 breakthrough pressure (BP) of the shale samples [,]. The testing system of BP is shown in Figure 3a. The shale core plugs fully saturated with brine were put into the core holder, and then the net confining pressure and temperature were set according to the formation situation (12 MPa, 50 °C for Chang7 member). Next, the injection pressure of CO2 at the inlet was increased gradually until continuous and uniform bubbles appeared at the outlet. At this moment, the pressure difference between upstream and downstream was considered to be the breakout pressure. The pressure was maintained for a specific duration after each boost. The magnitude of each boost and the duration of pressure retention were set strictly in accordance with the Chinese Oil and Gas Industry Standard (No. SY/T 5748–2020) []. The brine is configured according to the Yanchang formation water (Cacl 2%wt, NaCl 1.5%wt, KCl 1.5%wt). The BP experiments were conducted on 11 samples from the Chang7 member.
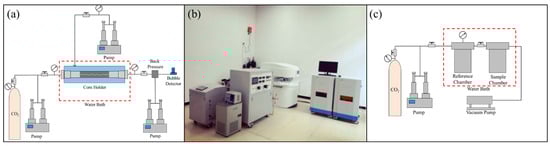
Figure 3.
The experiment apparatus. (a) The BP experiment system. (b) NMR experiment system. (c) The isothermal adsorption experiment system.
3.3. NMR Experiment
NMR tests were carried out on the shale samples to characterize their pore structure. Prior to conducting the NMR test, each core sample was saturated under negative pressure. Once a core sample was saturated with water, it was placed within a high-intensity magnetic field, prompting the hydrogen nuclei in the pore water to align with the magnetic field. These aligned hydrogen nuclei were then excited into a non-equilibrium state via the application of radio frequency pulses. When the radio frequency pulse was turned off, these nuclei returned to their equilibrium state, emitting detectable electromagnetic signals during this process. The strength of these signals correlates directly with the number of hydrogen atoms present, which allows for the determination of pore water volume and, subsequently, the porosity of the core. The time taken for the hydrogen nuclei to return from a non-equilibrium state to an equilibrium state is referred to as the transverse relaxation time (T2). The relationship between T2 and pore size r can be expressed as []
where is the transverse relaxation time in ms; is the intensity of transverse surface relaxation in μm/ms; S is the pore surface area in cm2; V is the pore volume in cm3; is the shape factor of the pores; and r is the pore size.
The MacroMR12-150H-I system was employed to characterize the pore structure of the samples (Figure 3b). The main magnetic field of this system is 0.3 T, the RF pulse is 1–42 MHz, the control precision is 0.01 Hz, and the peak output is greater than 300 W.
3.4. Isothermal Adsorption Experiment
The isothermal adsorption curves of CO2 on the Yanchang shale were obtained using the volumetric method. The experiment system is shown in Figure 3c, which consists of a sample chamber, a reference chamber, a pressure sensor, a temperature sensor, a water bath, and a set of valves. The details of the experimental procedure can be found in our previous research.
3.5. XRD Experiment
The rest of the sample was crushed into 60–80 mesh powder for XRD analysis to quantitatively analyze the mineral composition of shale samples. XRD analysis was performed on Bruker D8 ADVANCE (Bruker Corporation, Karlsruhe, Germany) following the Chinese Oil and Gas Industry Standard SY/T 5163-2018 [].
4. Result
4.1. Pore Structure of Yanchang Shale
The NMR experiments were conducted on shale samples taken from the Chang7 member. The aperture distribution and cumulative porosity of shale samples are shown in Figure 4. The aperture distribution of all samples exhibits a bimodal pattern. The dividing point of the two peaks is 0.15 μm. Pores with apertures less than 0.15 μm dominate, and all pores have apertures less than 10 μm. The NMR porosity of shale samples is between 6.77% and 8.02%, with an average value of 7.19%.
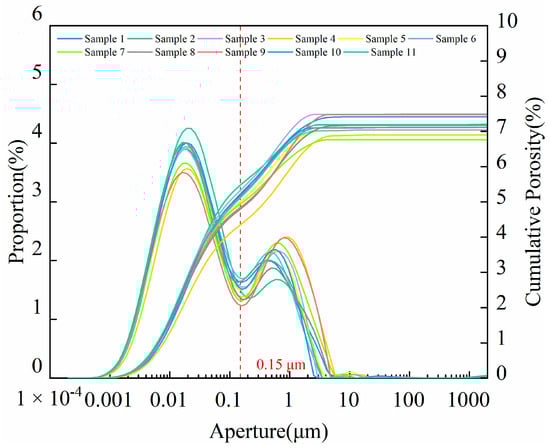
Figure 4.
Aperture distribution and cumulative porosity of Yanchang shale samples.
4.2. CO2 Breakthrough Pressure of Yanchang Shale
The breakthrough pressure experiments were carried out on 11 samples. The BP values are displayed from 1.4 MPa to 3.5 MPa, with an average of 1.97 MPa (Figure 5). BP is the most intuitive and important parameter to characterize the capillary sealing capability of caprock. The upper limit of CO2 pressure in the reservoir is determined by the BP of the overlying caprock, which is numerically equal to the sum of BP and the hydrostatic pressure of the overlying brine (Equation (1)). To maximize storage safety, the minimum breakthrough pressure is adopted to characterize the capillary sealing capacity of the Chang7 shale. The maximum CO2 storage pressure for Chang7 shale gas formation is estimated to be 13.4 MPa (the average hydrostatic pressure of overlying brine is assumed to be 12 MPa according to the geological condition).
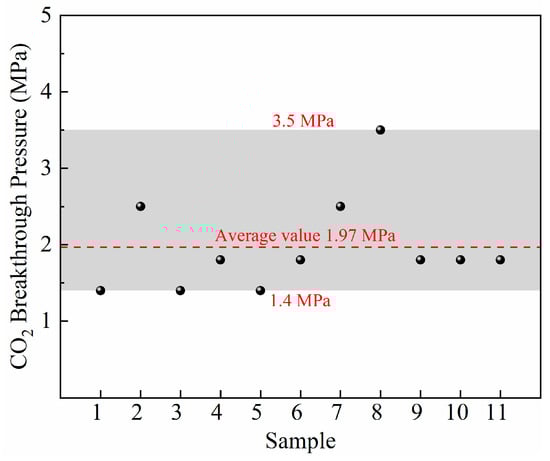
Figure 5.
The BP result of Yanchang shale samples.
4.3. CO2 Isothermal Adsorption
The CO2 isothermal adsorption experiment was conducted at 50 °C. The adsorption capacity obtained directly from the volumetric method is called the excess adsorption capacity (), which ignores the pore space occupied by the adsorption phase. The excess adsorption capacity should be corrected to absolute adsorption capacity () via Equation (9). The excess adsorption and absolute adsorption are shown in Figure 6. It can be found that the absolute adsorption capacity increases with pressure. The Langmuir model was used to fit the absolute adsorption capacity. The fitting correlation coefficient (R2) is 0.97192, which indicates that the Langmuir model can well describe the adsorption behavior of CO2 on Yanchang shale. The values of the Langmuir volume (VL) and the Langmuir pressure (PL) are 0.00648 m3/kg and 8.41662 MPa, respectively.
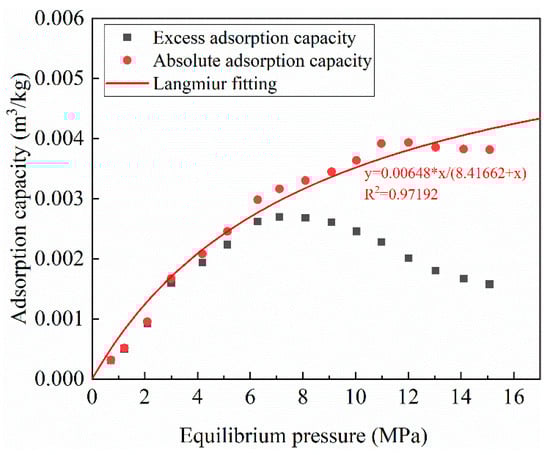
Figure 6.
The result of isothermal adsorption experiment.
4.4. Mineralogy of Yanchang Shale
The mineral content of Yanchang shale is shown in Table 1. The main brittle minerals of Yanchang shale are Quartz and Albite. The total clay mineral content is 41.8%. Montmorillonite and illite are regarded as the main minerals favorable for mineralization, whose content are 1.7% and 16.6%, respectively. The contents of montmorillonite and illite in unit volume shale are 45.9 kg/m3 and 448.2 kg/m3. The XRD diffraction spectra are shown in Figure 7.

Table 1.
The mineral content of Yanchang shale.
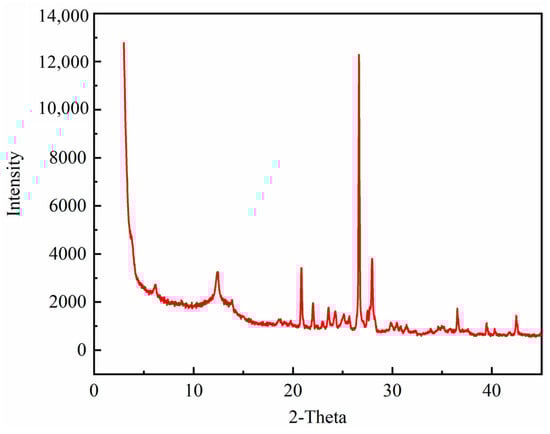
Figure 7.
The XRD diffraction spectra.
4.5. CO2 Geological Storage Potential of Yanchang Shale
The CO2 geological storage potential can be estimated via the experimental results and Equations (2)–(8). The reservoir porosity is assumed to be 7.19%, according to the NMR result. The water saturation of the reservoir is assumed to be 0.2. The CO2 geological storage potential in unit volume shale is shown in Figure 8. For a specific reservoir, mineralization potential is certain as it is only related to mineral content favorable for mineralization. The mineralization potential of the Yanchang shale gas reservoir is estimated to be 139.135 kg/m3. The storage potential of free-state, adsorption, and dissolution increases with the CO2 storage pressure. It is obvious that the total storage potential is a function of the CO2 storage pressure, which is determined by the sealing capacity of the caprock. The maximum CO2 storage pressure of the Yanchang shale gas reservoir is estimated to be 13.4 MPa, at which point the CO2 storage potential in the unit volume of the shale is 232.16 kg/m3 (free-state 25.21 kg/m3, adsorption 21.06 kg/m3, dissolution 0.75 kg/m3, mineralization 185.14 kg/m3).
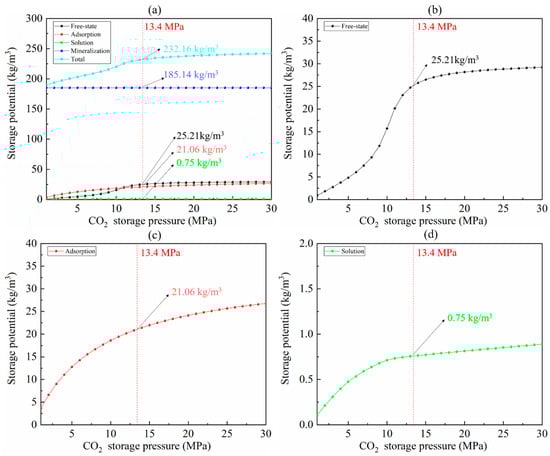
Figure 8.
The CO2 geological storage potential in unit volume shale vs. CO2 pressure. (a) Total storage potential. (b) Free-state storage potential. (c) Adsorption storage potential. (d) Dissolution storage potential.
Based on the thickness distribution of the Chang7 shale gas formation, the study area was divided into 10 blocks (Figure 1b). The area and thickness of each block are listed in Table 2. The overall CO2 storage potential (OCSP) of the Chang7 shale gas reservoir is shown in Figure 9. OCSP increases with the increase in CO2 storage pressure. When the CO2 storage pressure reaches the upper limit of the capillary sealing capacity of the caprock (13.4 MPa), the OCSP reaches 7.59 × 10¹¹ t. This shows that the CO2 geological storage potential of the Chang 7 shale gas reservoir is huge.
Table 2.
The area and average thickness of blocks.
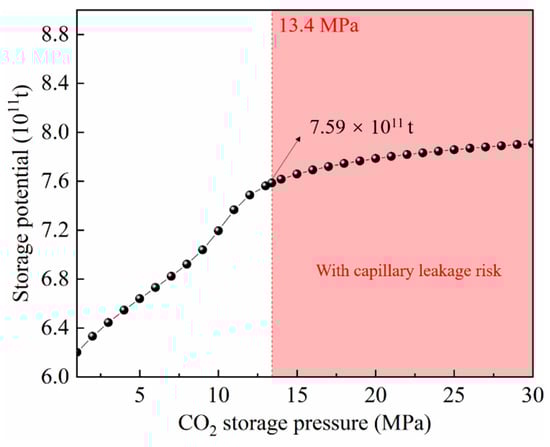
Figure 9.
The overall CO2 storage potential of Chang7 shale gas formation. When the CO2 storage pressure reaches the upper limit of the capillary sealing capacity of the caprock (13.4 MPa), the OCSP reaches 7.59 × 10¹¹ t.
5. Discussion
5.1. The Effect of Sealing Capability of Caprock on the Storage Potential
In previous research on the potential of CO2 geological storage, the sealing capability of the caprock was rarely considered. Obviously, the CO2 storage potential is a function of storage pressure. The maximum storage pressure of CO2 is determined by the capillary sealing capability of the caprock, which is equal to the sum of the breakthrough pressure and the pore pressure of the overlying brine. The idea that the maximum storage pressure of CO2 can reach the pressure of the original gas reservoir may lead to erroneous estimates. The capillary sealing capability of the caprock is determined by its pore structure, wettability, and gas-liquid interfacial tension (IFT). When hydrocarbons are replaced by carbon dioxide, changes in IFT and wettability can lead to significant changes in the sealing capability of a specific cap layer. It is incorrect for a given cap rock to be able to maintain carbon dioxide below or slightly below the original pressure due to its successful sealing of hydrocarbons during geological periods. The sealing capacity of the cap rock should be determined before the start of CO2 geological storage engineering to enhance confidence in the safety of CO2 geological storage.
5.2. Theoretical Potential and Available Potential
In the Yanchang shale gas reservoir, the amount and proportion of free-state storage potential, adsorption storage potential, dissolution storage potential, and mineralization storage potential are shown in Figure 10. The ranking from large to small is mineralization storage potential, free-state storage potential, adsorption storage potential, and dissolution storage potential, wherein the mineralization storage potential is 6.05 × 10¹¹ t, accounting for 79.75% of the OCSP. The potential for dissolution and storage is 2.45 × 10⁹ t, accounting for only 0.32% of the OCSP. The free-state storage potential and adsorption storage potential are 8.24 × 10¹⁰ t and 6.88 × 10¹⁰ t, respectively, accounting for 10.86% and 9.07%, respectively.
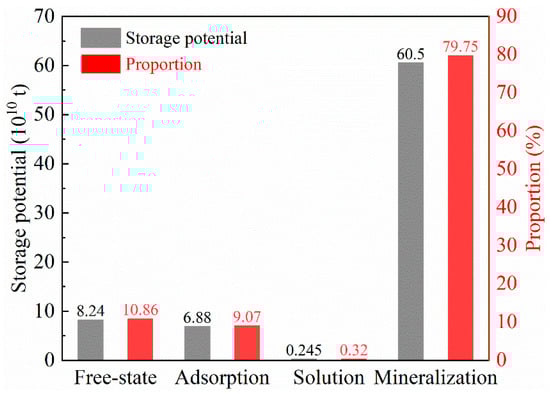
Figure 10.
The amount and proportion of free-state storage potential, adsorption storage potential, dissolution storage potential, and mineralization storage potential.
In a CCUS project, CO2 will be injected into the underground formation in a free state. Afterward, adsorption and dissolution will rapidly occur. Adsorption and dissolution will reach equilibrium within months to years, depending on field engineering parameters and the physicochemical properties of the storage formation. After CO2 is dissolved in formation water, it will combine with cations to form inorganic salt precipitation, i.e., mineralization. According to prior studies, the time scale of mineralization processes ranges from hundreds to thousands of years. For a CO2 geological storage project, the time required for mineralization far exceeds the engineering time scale. Therefore, the mineralization potential should be subtracted from the theoretical potential to obtain the available potential. The available CO2 storage potential of the shale gas reservoir in the Yanchang Formation is 1.54 × 10¹¹ t, which is still a large amount (Figure 11). If the CO2 storage potential of the Yanchang shale gas reservoir is fully exploited, it will be able to accommodate 41.49% of global annual CO2 emissions (according to data in 2021) []
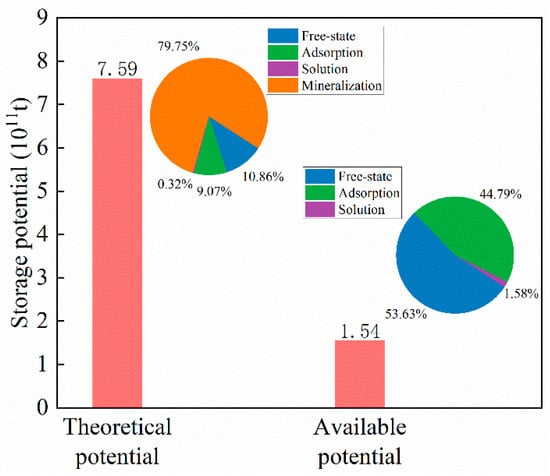
Figure 11.
The theoretical CO2 storage potential and available CO2 storage potential of Yanchang shale gas formation.
6. Conclusions
In this study, a CO2 storage potential estimation model considering the sealing capacity of caprock was proposed to evaluate the CO2 storage potential of the Yanchang shale gas reservoir in the Ordos Basin, China. Four types of CO2 storage states, including free-state, adsorption, dissolution, and mineralization, were considered. The maximum CO2 storage pressure for the Yanchang shale gas reservoir was estimated to be 13.4 MPa based on the results of breakthrough pressure experiments, which corresponds to a theoretical CO2 storage potential of 7.59 × 10¹¹ t. Due to the difficulty in completing mineralization within the engineering time scale, the mineralization potential should not be taken into account when estimating the available CO2 storage potential. The available CO2 potential of the Yanchang shale gas reservoir is 1.54 × 10¹¹ t. If the available CO2 storage potential of the Yanchang shale gas reservoir is fully exploited, it will be able to accommodate 41.49% of global annual CO2 emissions.
Author Contributions
Conceptualization, X.S. and J.T.; Methodology, X.S. and J.T.; Formal analysis, Y.J.; Investigation, Q.C., X.G., J.M., G.Z. and Y.L.; Writing—original draft, Q.C.; Funding acquisition, J.T. All authors have read and agreed to the published version of the manuscript.
Funding
This work is financially supported by the National Natural Science Foundation of China (No. 52274074), the Fundamental Research Funds for the Central Universities (2022CDJCGJ004), and the National Key Research and Development Program of China under grant (2022YFE0206700), which are gratefully acknowledged.
Data Availability Statement
For detailed data, please contact the corresponding author.
Acknowledgments
Authors thank the financial supported by the National Natural Science Foundation of China (No. 52274074), the Fundamental Research Funds for the Central Universities (2022CDJCGJ004), and the National Key Research and Development Program of China under grant (2022YFE0206700), which are gratefully acknowledged.
Conflicts of Interest
The authors declare no conflict of interest.
References
- Ma, J.; Li, L.; Wang, H.; Du, Y.; Ma, J.; Zhang, X.; Wang, Z. Carbon Capture and Storage: History and the Road Ahead. Engineering 2022, 14, 33–43. [Google Scholar] [CrossRef]
- Chu, S. Carbon Capture and Sequestration. Science 2009, 325, 1599. [Google Scholar] [CrossRef] [PubMed]
- Cuéllar-Franca, R.M.; Azapagic, A. Carbon capture, storage and utilisation technologies: A critical analysis and comparison of their life cycle environmental impacts. J. CO2 Util. 2015, 9, 82–102. [Google Scholar] [CrossRef]
- Jiang, L.; Gonzalez-Diaz, A.; Ling-Chin, J.; Roskilly, A.P.; Smallbone, A.J. Post-combustion CO2 capture from a natural gas combined cycle power plant using activated carbon adsorption. Appl. Energy 2019, 245, 1–15. [Google Scholar] [CrossRef]
- Hou, L.; Yu, Z.; Luo, X.; Wu, S. Self-sealing of caprocks during CO2 geological sequestration. Energy 2022, 252, 124064. [Google Scholar] [CrossRef]
- Bachu, S.; Gunter, W.D.; Perkins, E.H. Aquifer disposal of CO2: Hydrodynamic and mineral trapping. Energy Convers. Manag. 1994, 35, 269–279. [Google Scholar] [CrossRef]
- Celia, M.A.; Bachu, S.; Nordbotten, J.M.; Bandilla, K.W. Status of CO2 storage in deep saline aquifers with emphasis on modeling approaches and practical simulations. Water Resour. Res. 2015, 51, 6846–6892. [Google Scholar] [CrossRef]
- De Silva, P.N.K.; Ranjith, P.G.; Choi, S.K. A study of methodologies for CO2 storage capacity estimation of coal. Fuel 2012, 91, 1–15. [Google Scholar] [CrossRef]
- Li, D.; Ren, S.; Rui, H. CO2 Leakage Behaviors in Typical Caprock–Aquifer System during Geological Storage Process. ACS Omega 2019, 4, 17874–17879. [Google Scholar] [CrossRef]
- Abidoye, L.; Khudaida, K.; Das, D.B. Technology, Geological Carbon Sequestration in the Context of Two-Phase Flow in Porous Media: A Review. Crit. Rev. Environ. Sci. Technol. 2015, 45, 1105–1147. [Google Scholar] [CrossRef]
- Paluszny, A.; Graham, C.C.; Daniels, K.A.; Tsaparli, V.; Xenias, D.; Salimzadeh, S.; Whitmarsh, L.; Harrington, J.F.; Zimmerman, R.W. Caprock integrity and public perception studies of carbon storage in depleted hydrocarbon reservoirs. Int. J. Greenh. Gas Control 2020, 98, 103057. [Google Scholar] [CrossRef]
- Tian, S.; Zhou, J.; Xian, X.; Gan, Q.; Yang, K.; Zheng, Y.; Deng, G.; Zhang, F. Impact of supercritical CO2 exposure time on the porosity and permeability of dry and wet shale: The influence of chemo-mechanical coupling effects. Energy 2023, 270, 126905. [Google Scholar] [CrossRef]
- Qin, C.; Jiang, Y.; Zhou, J.; Zuo, S.; Chen, S.; Liu, Z.; Yin, H.; Li, Y. Influence of supercritical CO2 exposure on water wettability of shale: Implications for CO2 sequestration and shale gas recovery. Energy 2022, 242, 122551. [Google Scholar] [CrossRef]
- Levine, J.S.; Fukai, I.; Soeder, D.J.; Bromhal, G.; Dilmore, R.M.; Guthrie, G.D.; Rodosta, T.; Sanguinito, S.; Frailey, S.; Gorecki, C.; et al. U.S. DOE NETL methodology for estimating the prospective CO2 storage resource of shales at the national and regional scale. Int. J. Greenh. Gas Control 2016, 51, 81–94. [Google Scholar] [CrossRef]
- Jia, B.; Tsau, J.-S.; Barati, R. A review of the current progress of CO2 injection EOR and carbon storage in shale oil reservoirs. Fuel 2019, 236, 404–427. [Google Scholar] [CrossRef]
- Rani, S.; Padmanabhan, E.; Prusty, B.K. Review of gas adsorption in shales for enhanced methane recovery and CO2 storage. J. Pet. Sci. Eng. 2019, 175, 634–643. [Google Scholar] [CrossRef]
- Sharma, S.; Agrawal, V.; McGrath, S.; Hakala, J.A.; Lopano, C.; Goodman, A. Geochemical controls on CO2 interactions with deep subsurface shales: Implications for geologic carbon sequestration. Environ. Sci. Process. Impacts 2021, 23, 1278–1300. [Google Scholar] [CrossRef] [PubMed]
- Yekeen, N.; Khan, J.A.; Ali, M.A.; Elraies, K.A.; Okunade, O.A.; Ridha, S.; Al-Yaseri, A. Impact of nanoparticles–surfactant solutions on carbon dioxide and methane wettabilities of organic-rich shale and CO2/brine interfacial tension: Implication for carbon geosequestration. Energy Rep. 2022, 8, 15669–15685. [Google Scholar] [CrossRef]
- Bhutto, D.K.; Shar, A.M.; Abbasi, G.R.; Ansari, U. Shale Wettability Characteristics via Air/Brines and Air/Oil Contact Angles and Influence of Controlling Factors: A Case Study of Lower Indus Basin, Pakistan. ACS Omega 2023, 8, 688–701. [Google Scholar] [CrossRef]
- Eyinla, D.S.; Leggett, S.; Badrouchi, F.; Emadi, H.; Adamolekun, O.J.; Akinsanpe, O.T. A comprehensive review of the potential of rock properties alteration during CO2 injection for EOR and storage. Fuel 2023, 353, 129219. [Google Scholar] [CrossRef]
- Yiyu, L.; Junping, Z.; Xuefu, X.; Jiren, T.; Lei, Z.; Yongdong, J.; Binwei, X.; Xiangzeng, W.; Yong, K. Research progress and prospect of the integrated supercritical CO2 enhanced shale gas recovery and geological sequestration. Natrual Gas Ind. 2021, 41, 60–73. [Google Scholar]
- Iddphonce, R.; Wang, J.; Zhao, L. Review of CO2 injection techniques for enhanced shale gas recovery: Prospect and challenges. J. Nat. Gas Sci. Eng. 2020, 77, 103240. [Google Scholar] [CrossRef]
- White, C.M.; Smith, D.H.; Jones, K.L.; Goodman, A.L.; Jikich, S.A.; LaCount, R.B.; DuBose, S.B.; Ozdemir, E.; Morsi, B.I.; Schroeder, K.T. Sequestration of Carbon Dioxide in Coal with Enhanced Coalbed Methane RecoveryA Review. Energy Fuels 2005, 19, 659–724. [Google Scholar] [CrossRef]
- Pingping, S.; Xinwei, L.; Qiujie, L. Methodology for estimation of CO2 storage capacity in reservoirs. Pet. Explor. Dev. 2009, 36, 216–220. [Google Scholar] [CrossRef]
- Edwards, R.W.J.; Celia, M.A.; Bandilla, K.W.; Doster, F.; Kanno, C.M. A Model To Estimate Carbon Dioxide Injectivity and Storage Capacity for Geological Sequestration in Shale Gas Wells. Environ. Sci. Technol. 2015, 49, 9222–9229. [Google Scholar] [CrossRef] [PubMed]
- Tao, Z.; Clarens, A. Estimating the Carbon Sequestration Capacity of Shale Formations Using Methane Production Rates. Environ. Sci. Technol. 2013, 47, 11318–11325. [Google Scholar] [CrossRef] [PubMed]
- Godec, M.; Koperna, G.; Petrusak, R.; Oudinot, A. Potential for enhanced gas recovery and CO2 storage in the Marcellus Shale in the Eastern United States. Int. J. Coal Geol. 2013, 118, 95–104. [Google Scholar] [CrossRef]
- Nuttal, B.C.; Eble, C.; Bustin, R.M.; Drahovzal, J.A. Analysis of Devonian Black Shales in Kentucky for Potential Carbon Dioxide Sequestration and Enhanced Natural Gas Production. In Proceedings of the 7th International Conference on Greenhouse Gas Control Technologies, Vancouver, BC, Canada, 5–9 September 2004. [Google Scholar]
- Chiquet, P.; Broseta, D.; Thibeau, S.J.G. Wettability alteration of caprock minerals by carbon dioxide. Geofluids 2007, 7, 112–122. [Google Scholar] [CrossRef]
- Song, J.; Zhang, D.J.E.s. Technology, Comprehensive review of caprock-sealing mechanisms for geologic carbon sequestration. Environ. Sci. Technol. 2013, 47, 9–22. [Google Scholar] [CrossRef]
- Vafaie, A.; Cama, J.; Soler, J.M.; Kivi, I.R.; Vilarrasa, V. Chemo-hydro-mechanical effects of CO2 injection on reservoir and seal rocks: A review on laboratory experiments. Renew. Sustain. Energy Rev. 2023, 178, 113270. [Google Scholar] [CrossRef]
- Zhou, X.; Lü, X.; Quan, H.; Qian, W.; Mu, X.; Chen, K.; Wang, Z.; Bai, Z. Influence factors and an evaluation method about breakthrough pressure of carbonate rocks: An experimental study on the Ordovician of carbonate rock from the Kalpin area, Tarim Basin, China. Mar. Pet. Geol. 2019, 104, 313–330. [Google Scholar] [CrossRef]
- Rezaeyan, A.; Tabatabaei-Nejad, S.A.; Khodapanah, E.; Kamari, M. A laboratory study on capillary sealing efficiency of Iranian shale and anhydrite caprocks. Mar. Pet. Geol. 2015, 66, 817–828. [Google Scholar] [CrossRef]
- Wu, T.; Pan, Z.; Connell, L.D.; Liu, B.; Fu, X.; Xue, Z. Gas breakthrough pressure of tight rocks: A review of experimental methods and data. J. Nat. Gas Sci. Eng. 2020, 81, 103408. [Google Scholar] [CrossRef]
- Iglauer, S.; Pentland, C.H.; Busch, A. CO2 wettability of seal and reservoir rocks and the implications for carbon geo-sequestration. Water Resour. Res. 2015, 51, 729–774. [Google Scholar] [CrossRef]
- Zhang, C.; Wang, M. A critical review of breakthrough pressure for tight rocks and relevant factors. J. Nat. Gas Sci. Eng. 2022, 100, 104456. [Google Scholar] [CrossRef]
- Shojai Kaveh, N.; Barnhoorn, A.; Wolf, K.H. Wettability evaluation of silty shale caprocks for CO2 storage. Int. J. Greenh. Gas Control 2016, 49, 425–435. [Google Scholar] [CrossRef]
- Massarweh, O.; Abushaikha, A.S. A review of recent developments in CO2 mobility control in enhanced oil recovery. Petroleum 2022, 8, 291–317. [Google Scholar] [CrossRef]
- Li, Z.; Dong, M.; Li, S.; Huang, S. CO2 sequestration in depleted oil and gas reservoirs—Caprock characterization and storage capacity. Energy Convers. Manag. 2006, 47, 1372–1382. [Google Scholar] [CrossRef]
- Shukla, R.; Ranjith, P.; Haque, A.; Choi, X. A review of studies on CO2 sequestration and caprock integrity. Fuel 2010, 89, 2651–2664. [Google Scholar] [CrossRef]
- Fu, J.; Li, S.; Niu, X.; Deng, X.; Zhou, X. Geological characteristics and exploration of shale oil in Chang 7 Member of Triassic Yanchang Formation, Ordos Basin, NW China. Pet. Explor. Dev. 2020, 47, 931–945. [Google Scholar] [CrossRef]
- Wang, P.; Zhang, C.; Li, X.; Zhang, K.; Yuan, Y.; Zang, X.; Cui, W.; Liu, S.; Jiang, Z. Organic matter pores structure and evolution in shales based on the he ion microscopy (HIM): A case study from the Triassic Yanchang, Lower Silurian Longmaxi and Lower Cambrian Niutitang shales in China. J. Nat. Gas Sci. Eng. 2020, 84, 103682. [Google Scholar] [CrossRef]
- Zhang, K.; Liu, R.; Liu, Z. Sedimentary sequence evolution and organic matter accumulation characteristics of the Chang 8–Chang 7 members in the Upper Triassic Yanchang Formation, southwest Ordos Basin, central China. J. Pet. Sci. Eng. 2021, 196, 107751. [Google Scholar] [CrossRef]
- Liu, D. Study on the CO2 Enhanced Shale Gas Recovery Technology in Ordos Basin, China; China University of Geosciences: Wuhan, Chian, 2017. [Google Scholar]
- Wu, Y. The Shale Reservoir Characteristics of Chang 7 Member in the Yanchang Formation and Its Controlling Factors on Gas-Bearing, the Southeastern Part; Ordos Basin Northwest University: Shenyang, Chian, 2018. [Google Scholar]
- Heath, J.E.; Dewers, T.A.; McPherson, B.J.O.L.; Nemer, M.B.; Kotula, P.G. Pore-lining phases and capillary breakthrough pressure of mudstone caprocks: Sealing efficiency of geologic CO2 storage sites. Int. J. Greenh. Gas Control 2012, 11, 204–220. [Google Scholar] [CrossRef]
- Duan, Z.; Sun, R.; Zhu, C.; Chou, I.M. An improved model for the calculation of CO2 solubility in aqueous solutions containing Na+, K+, Ca2+, Mg2+, Cl−, and SO42−. Mar. Chem. 2006, 98, 131–139. [Google Scholar] [CrossRef]
- Dai, X.; Wei, C.; Wang, M.; Ma, R.; Song, Y.; Zhang, J.; Wang, X.; Shi, X.; Vandeginste, V. Interaction mechanism of supercritical CO2 with shales and a new quantitative storage capacity evaluation method. Energy 2023, 264, 126424. [Google Scholar] [CrossRef]
- Zhang, L.; Li, X.; Ren, B.; Cui, G.; Zhang, Y.; Ren, S.; Chen, G.; Zhang, H. CO2 storage potential and trapping mechanisms in the H-59 block of Jilin oilfield China. Int. J. Greenh. Gas Control 2016, 49, 267–280. [Google Scholar] [CrossRef]
- Thomas, L.K.; Katz, D.L.; Tek, M.R. Threshold Pressure Phenomena in Porous Media. Soc. Pet. Eng. J. 1968, 8, 174–184. [Google Scholar] [CrossRef]
- Zhang, C.; Yu, Q. Breakthrough pressure and permeability in partially water-saturated shales using methane–carbon dioxide gas mixtures: An experimental study of Carboniferous shales from the eastern Qaidam Basin, China. AAPG Bull. 2019, 103, 273–301. [Google Scholar] [CrossRef]
- SY/T 5748–2020; Rock Gas Breakthrough Pressure Measurement Method. Oil & Gas Industry Standard: Beijing, China, 2018.
- Su, E.; Liang, Y.; Chang, X.; Zou, Q.; Xu, M.; Sasmito, A.P. Effects of cyclic saturation of supercritical CO2 on the pore structures and mechanical properties of bituminous coal: An experimental study. J. CO2 Util. 2020, 40, 101208. [Google Scholar] [CrossRef]
- SY/T 5163-2018; Analysis Method for Clay Minerals and Ordinary Non-Clay Minerals in Sedimentary Rocks by the X-ray Diffraction. Oil & Gas Industry Standard: Beijing, China, 2018.
- CO2 and Greenhouse Gas Emissions. Available online: https://ourworldindata.org/co2-and-greenhouse-gas-emissions (accessed on 15 March 2023).
Disclaimer/Publisher’s Note: The statements, opinions and data contained in all publications are solely those of the individual author(s) and contributor(s) and not of MDPI and/or the editor(s). MDPI and/or the editor(s) disclaim responsibility for any injury to people or property resulting from any ideas, methods, instructions or products referred to in the content. |
© 2023 by the authors. Licensee MDPI, Basel, Switzerland. This article is an open access article distributed under the terms and conditions of the Creative Commons Attribution (CC BY) license (https://creativecommons.org/licenses/by/4.0/).