Abstract
This study investigated the impact of spatial configuration on tourist movement patterns and its role in managing cultural heritage destinations in the city of Madaba. Understanding tourist movement patterns is important for the development of sustainable tourism practices in cultural heritage destinations, as it can help to identify attractions of high tourist impact and inform the development of strategies to mitigate the negative impacts on site preservation and management. Madaba is one of the largest homes to ancient mosaics and is one of Jordan’s most important cultural heritage tourism destinations. This study was carried out using a variety of methods, including observation, site exploration, tourist diaries, questionnaires, and interviews. Space syntax was one of the spatial analytical tools used to assess connectivity and integration. The study found that the arrangement of attraction points and routes, physical and visual connectivity, accessibility, and the location of tourist activities all influenced the spatial behavior of tourists. The findings of this study can be used to guide management and development policies such as redistributing tourist flow, managing and developing tourism resources, and promoting the adaptation of sustainable tourism.
1. Introduction
Global tourism has rapidly grown over the last few years. With an estimated 1.2 billion visitors in 2016, this number is expected to rise to 1.8 billion by 2030 [1]. The Middle East has become the fastest-growing region in terms of foreign tourism arrivals, rising to nearly double the global average (+8%) in 2019 [2]. Jordan’s National Tourism Strategy 2021–2025 [3] locates tourism at the heart of the Jordanian social and economic systems, especially after the consequences of COVID-19 were most noticeable in 2020, when the Jordanian tourism sector witnessed a significant decrease in performance, with most KPIs declining by 75% [3]. The strategy’s main goal is “to create inclusive economic growth through authentic and sustainable tourism products & experiences and eliminate the impact of COVID-19” [3] (p. 11). It is expected that Jordan will have a promising forecast for upcoming years, especially after the Jordanian city of As-Salt was included on the World Heritage List by the UNESCO Committee [2] and Madaba City was selected as the Arab Tourism Capital for the year 2022 after reaching the criteria and terms of reference set forth by the Arab Tourism Organization [4].
Cultural and heritage tourism is considered one of the most fundamental components of the tourism sector, which represents 39% of total tourism worldwide [5,6]. Around 85% of overseas tourists come to Jordan for culture and heritage destinations [3]. Thus, over the next three years, major financial investments are intended in Jordan for conservation and preservation purposes, including making significant upgrades to 15 main cultural and heritage attractions, including Madaba (2022–2024) [3]. As interest in urban heritage and cultural tourism grew, it became increasingly important to adapt the notion of “sustainable tourism” to protect, develop, and promote cultural heritage assets [7,8,9].
Sustainability in tourism is a multidimensional concept that may create a challenge in terms of measuring and achieving its primary goals and objectives [10]. The environmental, economic, and socio-cultural aspects of tourism development are referred to as the principles of sustainability, and a proper balance must be founded between these three aspects to reinforce its long-term objectives [11]. According to the World Tourism Organization, this can be achieved through a set of indicators that measure and evaluate the principles of sustainable tourism [12]. These indicators are widely regarded as an essential component of any tourism development strategy that is set out by planners and managers of tourist destinations [12,13]. In terms of the economic aspect, to ensure long-term economic viability, we need to provide equitable socio-economic benefits to all stakeholders in a tourist destination [11]. This means tourist expenditures should be equitably distributed within a destination. The movement of tourists throughout a city has the greatest impact on distribution, as spending patterns are influenced by movement patterns [10,11,12]. As a result, encouraging tourists to explore the whole destination should be one of the goals of tourist managers. All of the aspects that may encourage or constrain the movement of tourists, such as the spatial configuration, should be studied. UNWTO identifies that sustainable tourism must also ensure a high level of visitor satisfaction as well as provide tourists a memorable experience. However, tourists’ desire to explore a city can be frustrated by constraints in information, wayfinding systems, and public transportation, or by the built environment and disconnectivity of spaces that do not encourage a wider discovery of a city [10]. Several tourism studies focused on how to achieve sustainable tourism through the development of cultural and heritage places only in terms of maintaining and preserving their physical characteristics [14]. However, many researchers demonstrated that implementing any sustainable tourism plan without considering those who “consume” the place in order to deliver a pleasant tourist spatial experience is insufficient [12,15,16], and it is essential for managers and tourism planners who engage in strategic planning and decision-making to investigate tourist spatial behavior [17]. This has increased the importance of recognizing the role of the spatial configuration of urban cultural and heritage places in terms of tourists’ spatial behavior [18,19,20]. Therefore, this research aims to study the impact of the spatial configuration of the historical core of Madaba on shaping the behavioral patterns and distribution of tourists by examining different spatial variables such as accessibility, attractiveness, activities, connectivity, and integration.
Two main research questions were raised in this study:
- RQ.1: What are the spatial behavioral patterns of tourists in the historical core of Madaba?
- RQ.2: In which ways does spatial configuration features, such as accessibility, attractiveness, activities, and connectivity, affect tourist movement in the city?
Based on syntactical and analytical data analysis, this study of tourists’ spatial behavior within Madaba’s historical core considered tourist movement, route choices, and on-site behavior. The findings of the study can be used as a guide for local authorities that manage cultural heritage destinations in Madaba city to redistribute tourist flows, protect and preserve heritage sites, and enhance the tourist experience for a better adaptation of the concept of sustainable tourism.
2. Literature Background
The Effect of Spatial Configuration on Tourist Movement Patterns and Behaviour
The term “spatial configuration” indicates the way that different spaces relate to each other and how their spatial elements and features are located in these spaces within a specific built environment [21,22].
Many tourism organizations, including the UNWTO, have stressed the importance of investigating and evaluating the spatial configurations of tourist destinations and their effect on tourist satisfaction [12,23]. Arrangements and interventions of the built environment, such as visual accessibility, signage systems, streetscapes, and the distribution of activities, may improve or prevent the ability of tourists to explore tourist destinations and create movement patterns [10]. This necessitated the investigation of spatial movement constraints and the development of novel approaches to improve the quality of the spatial experience within destinations [10,12,23]. Therefore, studies on tourist movement and patterns by researchers and city planners have increased as of late [16]. The primary focus of such research is on the tourist movement patterns and spatial characteristics that impact them. The research results can have many implications for destination development and management.
Gospodini [24], who studied the effect of spatial morphology on urban tourism, mentioned that more integrated and connected touristic places tend to be more visited by tourists. Southwell [25] conducted a study in the old town of Edinburgh; after intensive observation, Southwell concluded that addressing the effect of spatial configuration on the behavioral patterns of tourists was a useful tool for generating new spatial interventions and an indicator of poor legibility in tourist historic places. Millonig and Schechtner [26] defined landmarks as places or objects that were significantly remembered and helped tourists navigate destinations in both Vienna and Austria; they also found that the quality of routes (connection to safety, availability of facilities, convenience, and attractiveness) affects tourists’ cognition and spatial behavior. A study by van Der Spek [27] tracked visitors in three different historical cities: Koblenz in Germany, Rouen in France, and Norwich in the United Kingdom. The study provided important reflections that address some of the spatial issues such as safety, accessibility, attractiveness, connectivity, orientation, and legibility, which resulted in a series of developments within these cities with respect to networks, streetscapes, information technology, mapping, lighting systems, landmarks, and other pedestrian services. In 2010, van Der Spek [28] conducted another study in the historical core of Delft city. This time, the main goal was to analyze the movement of visitors and the effectiveness of the spatial developments. The discontinuity between the northern and southern routes led to an obvious loss of identity and legibility of the city. This resulted in new spatial and behavioral patterns, such as finding alternate routes around the blocks to reach the desired destinations. Shoval et al. [29] studied the hotel location and tourist activity in Hong Kong as well as the geomorphological constraints of tourists’ spatial movement. They concluded that visitors’ movements were affected by the distance from the hotels and that the tourist activities were selective. Kubat et al. [30] investigated the effect of the spatial configuration of the built environment layout and land use on shaping visitors’ movement performance in the historical core of Istanbul; they focused their study on three basic spatial themes from the perspective of visitors: street connectivity, visibility, and land use. Kubat et al. found that the visibility of the built environment has a powerful influence on the spatial behavior of visitors and their perception of place. They concluded that emphasizing only specific features as the main touristic facilities and signage and not taking into consideration the ways that tourists move and understand the spatial configuration of destinations can affect tourists’ wayfinding and behavioral patterns.
Edwards and Griffin [10] investigated the tracks of tourists throughout the two Australian cities of Sydney and Melbourne; they primarily aimed to achieve sustainability in tourism by providing information and diagnostic tools related to spatial issues such as spatial integration and connectivity in the two cities. Aranburu et al. [31] discovered that spatial configuration and accessibility were critical in attracting tourists to the city of Bilbao and influencing the economic aspect of sustainable tourism. They also found a significant relationship between spatial movement and the implications of tourism resources. In a study conducted on the city center of Kuala Lumpur, Safari and Moridani [32] found that the most significant variables in developing a viable cognitive map and ease of navigation are the arrangements of an urban plan, thus ensuring accessibility and sociability. Liu et al. [33] emphasized the importance of space layout in the spatial choices that users make. Khairi et al. [20] found that tourist behavior visiting the Melaka World Heritage Site can be studied by combining the behavioral pattern with the aspects of space, time, and money to provide a new perspective for planners or tourism managers. The study concluded that understanding the spatial patterns of tourists within heritage sites can be an effective tool for establishing better management and preservation plans [20]. Sugimoto et al. [16] concluded that physical factors in the Ueno district, such as major transit, topography, and commercial concentration, influenced tourist behavior and divided the markets into various main zones. These findings could help shape policies for destination management and planning.
In terms of the methodological aspect, there are different approaches that can be used to study tourist spatial patterns, such as tourist surveys, tracking technologies, and social media and blog analyses. Some studies have claimed that qualitative methods emphasize human significance in order to achieve understanding through the expression of actual human behavior and thinking [34]. Recent studies were focused on mostly examining tourist behavior using tracking technologies such as GPS, GIS, and GNSS [10,16,35] and measured the tourist duration [36], the different variables that affected tourist dispersal, and how to predict crowding and over-tourism [37]. Other studies used social media platforms [17,38,39] and blogs [40,41] to trace tourist travel diaries.
Despite the fact that online travel diaries have steadily grown to be one of the most popular data sources for studies on tourists’ digital footprint and tourist movement, researchers have attempted to examine the patterns of tourist flows and centrality; however, up until now, they have tended to primarily concentrate on the movement of tourists between attractions [42].
Some studies have combined tracking technologies and surveys to trace the movements of tourists and collect data on sociodemographic characteristics and human factors [16,43] or, to make comparisons, have segmented visitors into different sections [44] (East et al., 2017). Liu et al. [33] combined the survey and online website data to compare the distribution of actual space with the attention of tourists in cyberspace. However, it is appropriate for the determination of actual tourist movement and the investigation of the role of spatial configuration on tourist spatial behavior to be studied from a tourist perspective through survey and interviews [45,46]. Therefore, in this study, the authors have proposed a research methodology based on using more interactive tools of tourists, such as trip diaries and observation, for studying the spatial patterns of tourist flows and the factors that influence their movement patterns. This research investigates the patterns of tourist movement by following the simplified sketch methods from previous studies and describing the tourists’ spatial movement, starting point, and ending point [47]. Many studies have investigated the factors that may affect spatial tourist behavior and have categorized them into aspects related to the type of individual, motivations, and familiarity (first-time or repeat tourist), referred to as sociodemographic data [16,27,34,47,48]. Previous studies concluded that first-time visitors walked more broadly throughout cities, whereas repeat visitors were more selective. Therefore, unstructured interviews and surveys were used to review tourist satisfaction and tourist profiles.
3. Research Case and Methods
3.1. A Scope on Study Context
Madaba is a Jordanian city and the administrative center of the Governorate of Madaba. Madaba, known as “the City of Mosaics”, is situated 33 km southwest of Amman, the capital of Jordan. Recently, Madaba was named the Arab Tourism Capital for the year of 2022 [4]. The city has rich historical attributes due to the succession of different civilizations. These historical sequences can be easily noticed in the city’s veritable and unique urban form, heritage buildings, and religious monuments (Figure 1). According to several historical studies, life in Madaba started in the Bronze Age (3200-2100 B.C.) [49]. After that period, Madaba has witnessed several civilizations (e.g., Moabites, Assyrians, and Babylonians). Some civilizations have left a clearer imprint on the city than others, such as the Nabateans in the 2nd century B.C., the Romans in the 1st century A.D., the Byzantines until the 6th century A.D., and the advent of Islam through the first half of the 7th century A.D. [49,50,51].
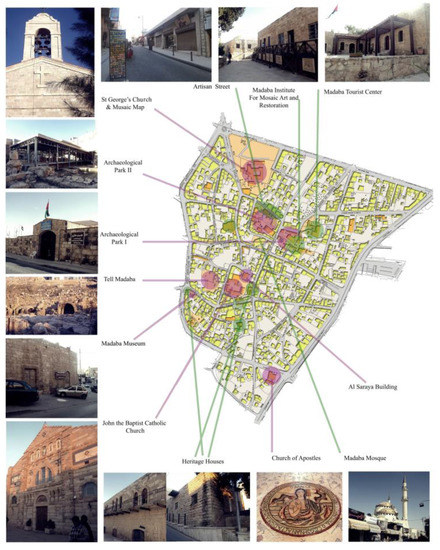
Figure 1.
The cultural and heritage attractions of the historical core of Madaba. Source map: GMM, as modified by the researchers.
The Roman period was an important milestone for Madaba. It was regarded as one of the Moab–Kerak Plateau’s commercial centers (Ibid.). In the 4th century, particularly after the liberation of Christians from Roman oppression, Madaba became an essential center that flourished in trades and crafts, especially mosaic art. Many of them are still in their original places (e.g., churches and houses) and are considered some of the world’s greatest examples of Byzantine mosaics [52]. Inevitably, these morphological changes were accompanied by a series of road network developments and interventions, which occurred in different directions around the core of the city to align with urban expansion, forming a ring road that connects the inner core of the city with the outer districts and regions [53]. The study is confined to the historical core of Madaba city (Figure 2). The physical fabric of the city evokes the old architectural characteristics of the old Ottoman villages in the period between the late 19th century and the early 20th century. Most Madaba buildings are composed of one to two stories. Madaba combines different architectural styles: the cultural and heritage places are associated with the 6th and 7th centuries’ mosaics and churches; the vernacular style, which is clearly represented in its traditional old houses that date back more than a hundred and fifty years; and the recent widespread modern architectural style.
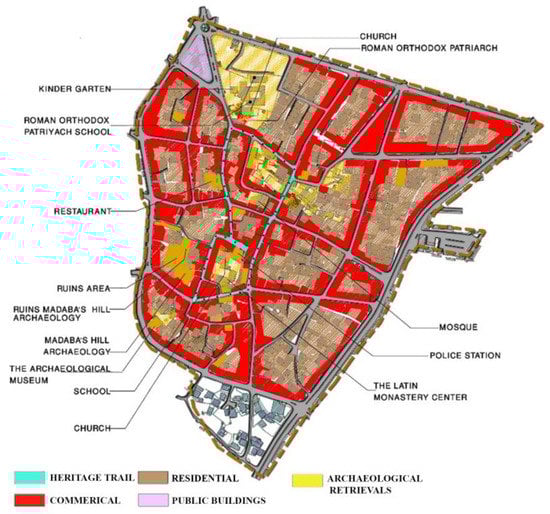
Figure 2.
Land uses of the historical core of Madaba city, Source: (GMM, 2008).
3.2. Data Collection and Analysis
To investigate the correlation between spatial configurations and tourists’ spatial behavioral patterns in the historical core of Madaba, both descriptive and spatial analysis tools were used. (Figure 3). Observations, site exploration, tourist diaries, questionnaires, and interviews were used to investigate the spatial configurations and movement patterns. The dataset was completed in July 2020.
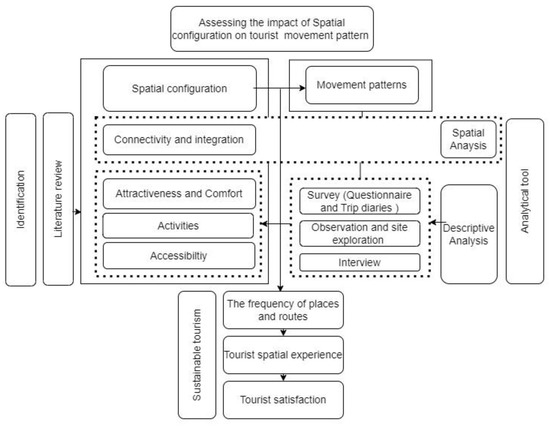
Figure 3.
Flow chart of the research method.
A face-to-face questionnaire was used in this study to analyze tourist satisfaction and the participants’ tourist profiles (age, residential area, familiarity, and motivation). The questionnaire was distributed to tourists at the hotels, tourist attractions, and visitor center. The number of hotels that participated in the study was 13, which were all located in the city’s historical core. The chosen hotels were based on their location and tourist flow. All six hotels in the study area were selected, and the remaining seven are the ones closest to the survey locations. The research members at the chosen locations asked the participants to only fill out the questionnaire if they finished visiting the city at one of the surveys locations. A total of 221 out of 488 distributed questionnaires were returned, representing a response rate of 45.3%; some filled-out questionnaires were mostly incomplete or contained insufficient data, and these copies were excluded. We included 207 questionnaires in the study for analysis.
A questionnaire was composed of two sections of multiple-choice and Likert scale questions. The first section was a set of open- and closed-ended questions related to the tourist profile to investigate their role in shaping tourists’ spatial behavior. The second section included closed questions related to the spatial variables. Two measurement scales were used for the survey in this study. The nominal scale was used to investigate the tourist profile, such as age, familiarity, and motivation. The 5-Point Likert scale (ordinal) was used to evaluate the tourists’ perspective and satisfaction. The Statistical Package for Social Sciences software was used to code the survey data (SPSS). Descriptive statistics were used to analyze the data. Unstructured interviews were conducted with the tourists after they completed the questionnaire to shed light on the points that needed further discussion. The tourist spatial behavioral patterns and the frequency of the places and routes were investigated through trip diaries and observations. Tourists were asked to sketch their trips and record the visited places and activities along with the distributed questionnaire. Four main attraction points were placed as a reference to help tourists draw their own trips. The trip diaries provided the needed data for the spatial behavior analysis, which included the movement of tourists, their paths, route choices, and the most frequented attraction points, which shaped their spatial patterns. A total of 87 trip diaries were returned, and 83 of them were analyzed, with the rest being excluded due to the inefficiency of their contents. The 83 trips were separately redrawn in AutoCAD software by using color-coded layers, and they were individually analyzed. The movement patterns were then identified through simplified sketches.
An unstructured observation of the spatial behavior of tourists while they were navigating the study context was also one of the methods used in this research. Various points were randomly chosen to observe at different times depending on both tourists’ existence and the opening hours of the attraction points. The observation was carried out in the study to investigate the actual tourist behavior during their visit. Space Syntax was one of the spatial analysis tools that was used to measure the level of connectivity and integration of the study area. The axial map for syntactical analysis was prepared from the layout of the study context using AutoCAD software. DepthmapX software was used in this research to measure integration, connectivity, and step depth. The correlation between the local and global integration measurements was investigated using the scatter diagram to measure syntactic intelligibility.
The procedure for analyzing the spatial patterns consisted of four main steps: first, the investigation of the trip diaries; second, the extraction of tourist movement patterns; third, the simplification of patterns into spatial styles; and fourth, the statistical analysis of the spatial movement pattern, routes, and attraction points. After analyzing the spatial movement pattern, spatial configurations were assessed to study the impact of their variables on forming tourist spatial movement and behavior.
4. Results
4.1. Tourist Characteristics
Tourists who visited the historical core of Madaba came from all over the world, mostly from the West (72%). The majority of them were originally from France (15.5%), Italy (14.5%), the USA (8.7%), and the UK (7.2%). Over half of the respondents (51.2%) were between the ages of 20 and 30 years. Additionally, 36.2% of the total sample were between the ages of 40 and 59 years. Meanwhile, only 7.7% of respondents were above the age of 60 years, and 4.8% were under the age of 20 years (Table 1). Studying the familiarity of tourists with the destination showed that 88.4% of them were at Madaba for the first time, and 75.9% of participants stressed that they were culturally and socially motivated to visit the city, which has significant cultural and social characteristics (Table 1).

Table 1.
Tourist characteristics.
As shown in Table 1, Approximately 42.7% of the 131 respondents indicated that they spent most of their time walking throughout the city. Moreover, 50.5% of participants mentioned that archeological sites, old churches, and museums were their main destination (Figure 4).
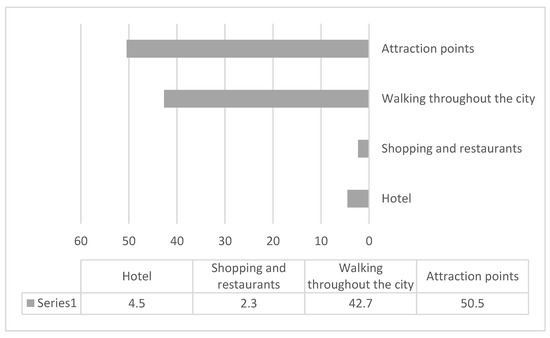
Figure 4.
The percentage of respondents’ time spent at the historical core of Madaba.
The mean tourist’s duration of stay in Madaba was 1.8 days and ranged from a maximum stay of four days to a minimum stay of just half a day, as shown in Table 1. (Table 2).
Table 2.
The mean, median, standard deviation, and range of tourists’ length of stay using the SPSS tool.
4.2. Tourist Spatial Movement Patterns
4.2.1. Classification of Spatial Movement Patterns
In total, 26 spatial styles of tourists were found in the study area. These styles, which were derived from tourist diaries and observations, were simplified into symbolic illustrations, as shown in Figure 5. The attraction points were presented as points, and the connecting routes between these points were symbolized as straight lines. Accordingly, the illustrations were grouped again based on specific movement characteristics into four spatial patterns (P): axial routes (A), radial routes (R), partial loop (PL), and full loop (FL) (Figure 5).
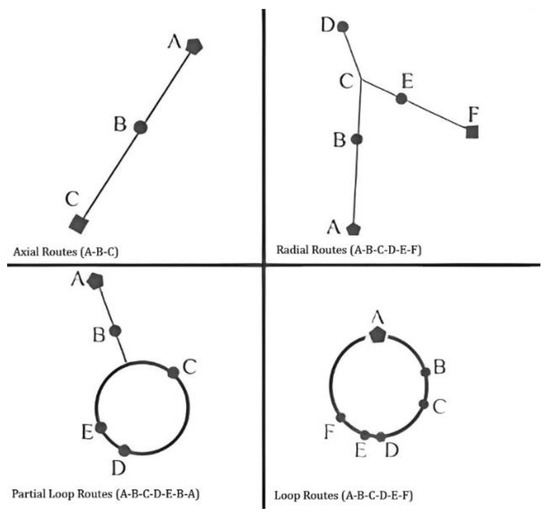
Figure 5.
The four main spatial patterns found in the study area. Starting point: Pentagonal; attraction points: Circle; ending point: Square.
The spatial movement behavior within the context of the study ranges from axial movement to a full circuitous trip (Figure 6). Tourists in the first group, “Axial routes” (A1–A5), take a direct route from their starting point to their primary attraction points without deviation from their path of movement. Subsequently, tourists return to their hotels or the main street, taking the same route without exploring the city. Tourists in the second category of “Radial Routes” (R1–R7), move radially between the attraction points in various ways. Although this pattern of movement is similar to the first, where tourists move in direct paths to reach their destinations, some routes within the trip are repeated back and forth by tourists to reach the next point. In this group, tourists move back to hotels or to other tourist attractions outside the city by taking the shortest and most direct routes. Tourists in the first and second categories do not visit all attraction points in the historical core. The third category of spatial patterns is the “partial loop” (PL1–PL10). Tourists in this group move partially over the axial route to reach their destinations, then start a circuitous path to visit the other attraction points. The last category is the “full loop” (FL1–FL3), where tourists move in a closed loop to reach most of the attraction points of the city without any repetition of the routes. In the third and fourth categories, tourists tend to freely move within the city. Most of the time, they want to live the spatial experience of the new destination, interact with the local community, and show a strong desire to explore.
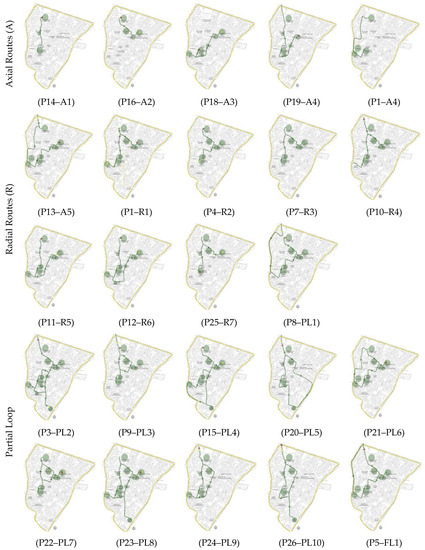
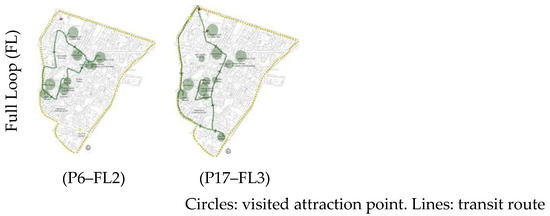
Figure 6.
The spatial styles of tourists that were found in the study area.
4.2.2. Spatial Movement Patterns and Tourist Routes
The most frequent styles of spatial movement were (P1–R1) 14.6%, (P8–PL1) 12.2%, (P14–A1) 11%, (P13–A5) 7.3%, and (P4–R2) 6.1%, respectively (Figure 6). The total frequency of the five most used patterns reached only 51.5% of all 26 patterns that were presented by the visiting respondents.
The routes used by tourists to move between the attraction points and the activities are coded from R1 to R12 (Figure 7). These routes were arranged from having the highest to the lowest tourist frequency. The total frequency of the four most used routes reached 57.2% out of all 384 routes visited by respondents.
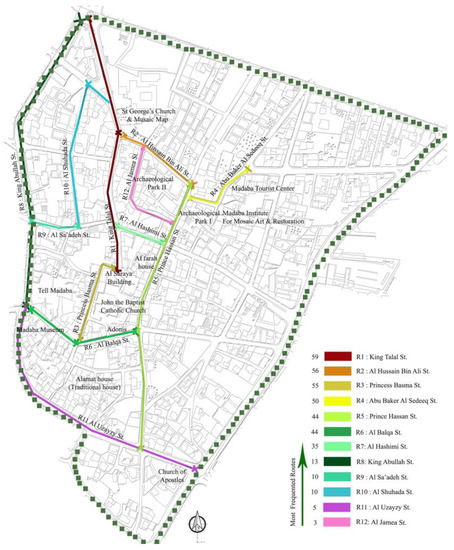
Figure 7.
The frequency of the visited routes in the study area.
The tourists visited 19 attraction points. These points varied from the cultural heritage sites to social activities, craft shops, restaurants, and café shops. Cultural attraction points alone were visited a total of 426 times (Table 3). Over half of the visits occurred in only three places out of the nine main cultural attraction points in the city, as illustrated in Figure 8.
Table 3.
Most visited cultural heritage attraction points using SPSS.
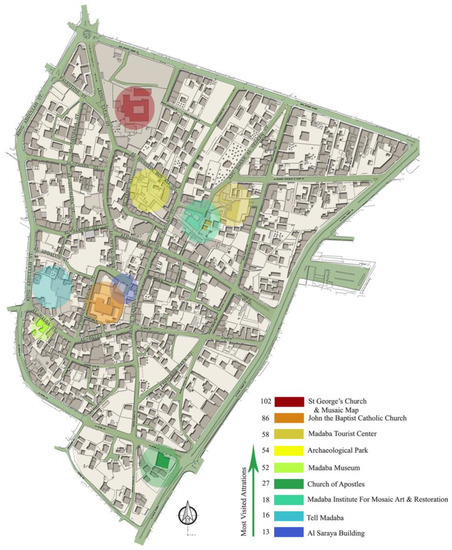
Figure 8.
The frequency of visited cultural attractions in the study area.
4.3. The Impact of Spatial Configuration on Tourist Spatial Movement Patterns and Behavior
4.3.1. Accessibility and Attractiveness
The two routes with the highest tourist spatial concentration in Madaba’s historical core were King Talal Street (R1) and Al Hussain Bin Ali Street (R2). (Figure 7). These two routes were the main parts of revitalization projects by the Ministry of Tourism and Antiquities (MOTA) [53]. Apart from the fact that it is considered the most accessible route to hotels and connects the most visited places (St. George’s Church and John the Baptist Catholic Church), as illustrated in Figure 8, it is recognized as the main commercial spine of the historic center, where a lot of tourist services and handicraft shops are located along the street as part of the MOTA’s revitalization projects [53]. Thus, most of the rehabilitative actions and maintenance are concentrated there.
Although King Talal Street is considered a relatively narrow route and one of the main arteries for vehicle traffic in the city, a paved sidewalk was allocated along it (Figure 9). Conversely, Al Hussain Bin Ali Street is the only well-designed artisan pedestrian route in the study context (Figure 10). It contains the largest number of handicraft shops. Tourists can stop and inspect the crafts freely without fear of vehicular traffic. Princess Basma Street (R3) and Abu Baker Al Seddeeq Street (R4) were the third and fourth most frequented routes, respectively. R3 recorded a higher movement density than R4, despite the fact that R3 does not have a decent sidewalk for pedestrians like R4 does (Figure 11), where tourists can walk on a relatively wide and well-designed paved sidewalk. In this case, the movement density in R3 can be related to another spatial factor, which is the connectivity of this route with the most visited route, King Talal Street.
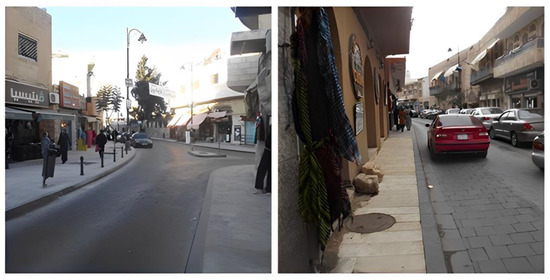
Figure 9.
King Talal Street, the historical core of Madaba.
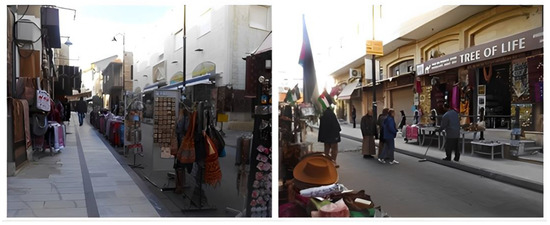
Figure 10.
Al Hussain Bin Ali Street, the historical core of Madaba.
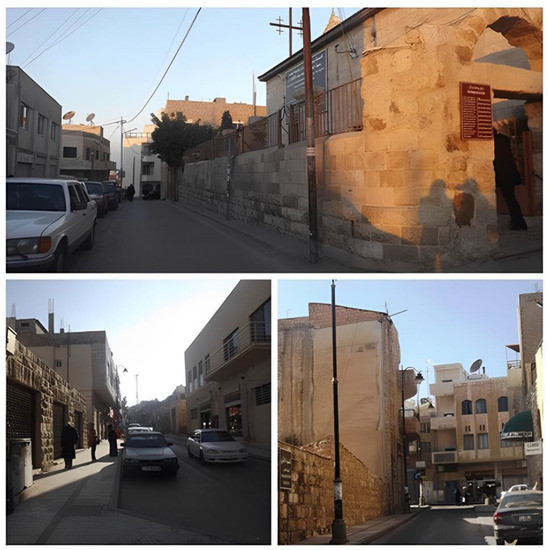
Figure 11.
(Top) Princess Basma Street; (Left) Prince Hassan Street; and (Right) Abu Baker Al Seddeeq Street. The historical core of Madaba.
The fifth most frequented route was Prince Hassan Street (R5) (Figure 11). The route is considered one of the main commercial axes, and it connects many attraction points in the study context. Despite this importance, which would be comparable with the King Talal route, the revitalization project of Madaba gave more attention to the King Talal and Al Hussain Bin Ali routes. This may reflect in the tourist spatial density in Prince Hassan Street, where an additional improvement has been created in King Talal and Al Hussain routes, such as well-designed stone-tiled road pavement, which was not the case for Prince Hassan Street. The Al Balqa and Al Hashimi routes were ranked sixth and seventh most used by tourists. Although the two routes have sidewalks for tourists and locals alike, it was observed that there are some clear physical obstacles such as cars and garbage on both routes. Furthermore, the sidewalks and vehicle lanes were designed with less aesthetic quality materials than the other routes mentioned.
Furthermore, the lanes for vehicles are narrow in some areas, so sometimes vehicles stop and wait for the passing of pedestrians or another vehicle to avoid a collision. In contrast, King Abdullah Street (R8) has a wide sidewalk and a two-way lane for vehicles. However, the tourist movement density on R8 was lower than on the other routes. This route is relatively far from the city’s attraction points, and it was mostly used by tourists only to return to their hotels. The rest of the routes that were used by some tourists to reach their destinations, such as Al Sa’adeh St. (R9), Al Shuhada St. (R10), Al Uzayzy St. (R11), and Al James St. (R12), witnessed the lowest tourist movement density among all of the routes. These routes are less connected with the other routes, and they are relatively far from the main attraction points. Many tourists stressed that it was not easy to reach the individual attraction points due to the absence of decent and clear signs in adequate places. In this research, tourists were asked about the clarity of signage on routes. In this regard, 42.5% of the respondents disagreed that all routes were clearly signposted, 25.6% of them were neutral, and 31.4% agreed that the routes were clear. Many tourists were observed to have asked locals for directions. Some of them stopped in the middle of the sidewalk and used their maps for a couple of minutes to figure out their next route.
Almost half of the tourists (46.1%) were satisfied with the general arrangement of the layout of the routes, 21.4% disagreed or strongly disagreed, and 32.5% were neutral about this (Table 4). This result was expected because of the effect of the various spatial factors under this variable on the overall tourists’ perception of the study context (Figure 12). The tourists were also satisfied with the arrangement of attraction points (70%), and 87% agreed to strongly agreed that the overall experience at the destination was satisfactory (Table 4).
Table 4.
Tourist satisfaction with the destination.
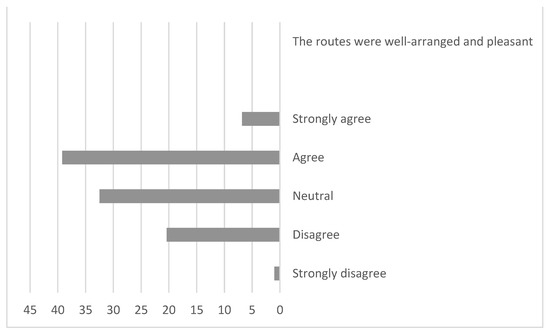
Figure 12.
The percentage of tourists’ satisfaction with the arrangement of routes.
4.3.2. Activities
Urban studies proved that people tend to move along routes where certain activities and spatial elements are concentrated, such as commercial activities, landmarks, attraction points, or cultural and social events. In this study, the density of tourist movement was concentrated more on the routes where most of the tourist activities and products are gathered. For example, it has been observed on several occasions that tourists who passed through King Talal and Al Hussain bin Ali to reach their destination returned to the same route to spend more time compared with the first time spent shopping at the various handcraft shops. Tourists enjoyed walking on the routes that had a high concentration of locals’ commercial activities. They illustrated in both the survey and interviews that meeting with the locals and identifying with their lifestyle was part of their experience in the city (Table 5). Thus, many tourists expressed special admiration for Prince Hassan Street as it showed the daily life of the locals of Madaba and their products. In fact, the direct interaction between the tourists and the locals in these popular “Souks” was convenient and pleasant from the standpoint of tourists. This is confirmed by the results of the survey, where the majority of respondents (82%) agreed or strongly agreed that the locals were very friendly and hospitable, whereas 17% of them were neutral, and only 1% disagreed with this (Figure 13).
Table 5.
Tourist satisfaction with the hospitality of and interactions with locals.
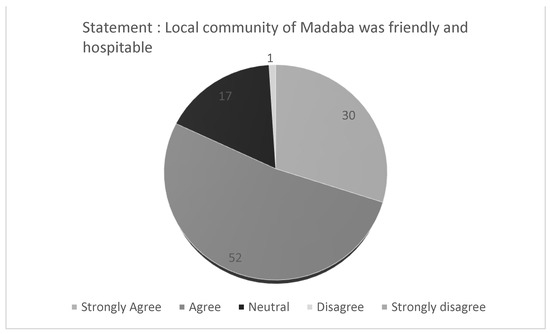
Figure 13.
The percentage of tourist satisfaction with the hospitality of and interactions with locals.
In the study, 86% of 207 participants expressed their satisfaction with the variety of cultural and attraction activities in Madaba; a number of them requested the provision of several possible activities, such as mosaic crafts for tourists, spa and massage centers, and open spaces with special night events that can enhance their next visit and encourage them to extend their length of stay in the city and experience the city broadly (Figure 14).
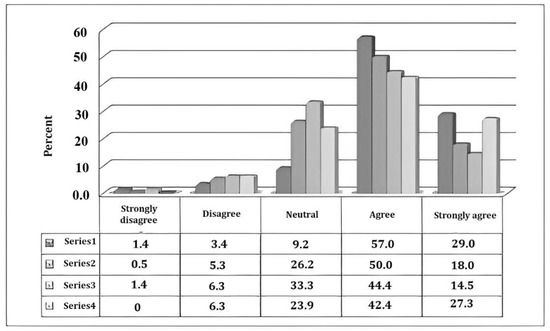
Figure 14.
The percentage of tourist satisfaction with series 1: the provision of various cultural and historical attractions; series 2: the provision of a good variety of experiences; series 3: the provision of good souvenirs and crafts; and series 4: the provision of good cuisine.
4.3.3. Connectivity and Intelligibility
After studying the actual spatial patterns of tourists, the integration, connectivity, and step depth analyses were investigated, relying on the space syntax approach to study their relationship with the current situation of tourist spatial behavior. Connectivity in the space syntax method is recognized as the number of intersections that connect a specific route with other routes [54]. Integration indicates how accessible a route is from other routes in the urban context, and depth is defined as the number of steps taken from the specific point to any other points (ibid.). The measurements from the syntactical studies were analyzed by the DepthmapX tool after preparing the axial map of the historical core of Madaba on AutoCAD software. Figure 15 illustrates the diagram of integration analysis as one of the space syntax measurements of the study area with a computation radius = 3, which is known as the local integration, and radius = n, which is known as the global integration. The term “global integration” in a space syntax analysis refers to how a route relates to all other routes in the given spatial system [54]. The degree of accessibility a route has in comparison to other routes can be estimated by considering the total number of direction changes in the urban system, while local integration is the average mean depth value of all routes within a provided syntactic radius (for example, R = 3). In this analysis, the color of the routes, which indicates the level of integration, ranged from red to blue. The routes with the red color indicate the routes with the highest integration values, while the blue ones indicate the values with the lowest integration values. After calculating the values of integration of the 101 indicated lines of the axial map and the mean value for the global and local integration of the total lines, it was found that the lines that recorded the highest rates of integration, whether at the global or local level, were mostly the routes that tourists chose to reach their destinations.
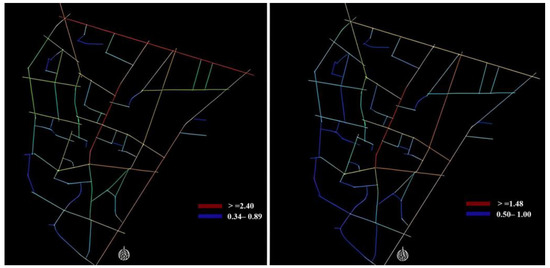
Figure 15.
(Left): Local integration analysis map (R = 3) and (Right) global integration analysis map (R = n) of the study area using DepthmapX.
Thus, the integration analysis denoted a relatively close result to the movement frequency analysis that was explained earlier. The analysis also demonstrated that the connectivity values of most investigated tourist routes are higher than the mean value of connectivity for a total of 101 lines (Table 6). It can be inferred that the level of connectivity of the routes also had a clear impact on the actual spatial patterns of tourists. Thus, the routes with a high connectivity level mostly recorded a higher density of movement. By comparing the mean values of connectivity and integration with the syntactical measurements of each tourist route, it can be concluded that the tourists of the historical core of Madaba tended to visit the attraction points that were situated on more connected and integrated routes than the ones that existed near disconnected and isolated routes. Furthermore, tourists were able to remember the destinations that were located on accessible and connected routes in the 83 sketch maps and descriptions, which also illustrated the linkage between the spatial configuration of the context area and the spatial cognition of tourists.
Table 6.
The calculated values of connectivity and integration for the tourist routes.
The level of intelligibility of the historical core of Madaba has also been investigated. Urban intelligibility is very essential in explaining how several types of spatial relations affect spatial behavior due to the fact that the level of predictability of how users move is connected to the level of intelligibility [22,54]. Syntactic intelligibility can be examined by studying the correlation between the local and global integration measurements using a scatter diagram. If the group of dots that represent the global and local integration values in the scatter diagram is tight enough and shapes a linear scatter around the regression line, then it can be said that the local context is intelligible in the global urban environment. In this case, Figure 16 shows this correlation using a scatter diagram analysis. Each line represents a dot regarding its level of global and local integration on the X- and Y-axes, respectively. The correlation (R2 = 0.875) between the two levels of integration, as shown in the scatter diagram, indicates that the spatial configuration of the study context is relatively intelligible. This intelligibility is reflected in the spatial cognition of tourists that have been represented by their sketch maps.
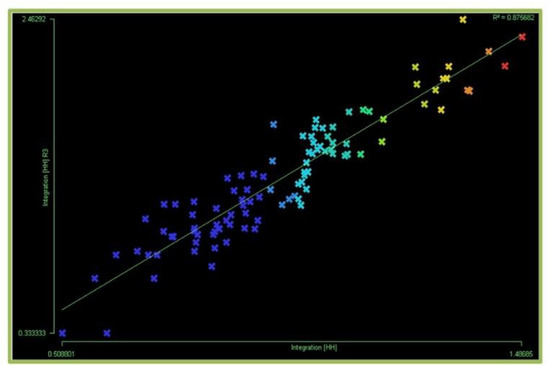
Figure 16.
The correlation between the local and global integration (ranged from red to blue) measurments in the study area using Depthmapx.
Another important syntactical analysis that shows the clear linkage between the spatial configuration and the user’s spatial behavior is the step depth analysis. The step depth is defined as the number of steps that should be taken by users to reach one point from any destination within the study context. Tourists mostly started their trip from St. George’s Church and not from the Madaba Visitor Center. The step depth may play a significant role in this fact. By calculating the mean of the step depth for both starting points, it turns out that the value of the step depth mean at St. George’s Church (Msd = 4.26) was less than the one for the visitor center (Msd = 5.15). These values indicate that tourists who began their trip from St. George’s church required fewer steps to reach the other attractions than those who began at the visitor center. This makes St. George’s church more accessible than the Madaba Visitor Center. From the tourists’ perspective, 88.4% agreed or strongly agreed that the destination was connected and integrated and that they did not face spatial obstacles while exploring the city (Table 7).
Table 7.
The tourists’ satisfaction with the destination’s connectivity.
5. Discussion
5.1. Tourist Characteristics and Movement Patterns
Tourist characteristics results, such as familiarity and motivation, support the existence of different spatial movement patterns in the historical core of the city of Madaba. The cultural and social motivations behind tourists’ visits demonstrate the high tourist concentration at cultural and heritage attraction points along social and commercial routes. The familiarity rate plays an important role in the tourist’s desire to discover the city. Most of the participants of this study were in the city for the first time. first-time tourists move between the attraction points quite differently [48], with no certain direction or trail for their movement. This may explain the time spent on walkability and attraction points which resulted in supporting the existence of various movement patterns in the city.
5.2. The Effect of Spatial Configuration
Spatial configurations such as accessibility, attractiveness, activities, and connectivity in this study strongly impact tourist flow and frequency rates at the attraction points and routes of the study area. The three routes that had the highest tourist concentration (R1, R2, and R3) are the ones that connect the main attractions in the city and are accessible from the majority of hotels, which confirms what Shoval et al. [29] and Sugimoto et al. [16] concluded on the effect of hotel location on tourist spatial behavior. Moreover, the concentration of the development and revitalization projects conducted by MOTA, from the beautification of streetscapes and facades to the creation of urban tourist attractions, was mostly concentrated on these routes. Because of the high tourist traffic along the mentioned routes, the frequency of the movement styles that used these routes (P1–R1, P8–PL1, P14–A1, P13–A5, and P4–R2) was impacted.
The tourists’ spatial behavior is also affected by the arrangement of activities and commercial accumulation. The five most frequented routes (R1, R2, R3, R4, and R5) all have the highest density of social and commercial activities in the study area, which may also explain why the three cultural and heritage attractions located along these routes are most frequented by tourists. Although MOTA gave more attention in its revitalization project to the R1 and R2 routes and injected various tourist activities such as handicraft shops, restaurants, cafés, and souvenirs, it was observed that tourists tended to explore more in local commercial areas and socialize with the locals, such as on R3, R5, and R5, which are considered to have a limited number of tourist activities compared with R1 and R2. This finding was confirmed by the tourists themselves, who said that meeting with the locals and being introduced to their lifestyle was part of their spatial experience, and the direct interaction with the community in the local markets, the souks, was very pleasant.
Syntactical analysis proves that the routes with the highest rates of integration and connectivity are the ones that tourists prefer to use to reach their destinations. The study area’s syntactic intelligibility explains tourists’ high level of spatial cognition, as evidenced by their trip diaries and their level of satisfaction with the connectivity of routes and attraction points. The step depth analysis shows the link between the location of the starting point and other attraction areas and its impact on tourists’ spatial behavior.
5.3. The Implications
The implications of the research findings could be classified into practical and methodological aspects. In terms of practice, the findings of this study can contribute to the development of tourism policies, management strategies, and preservation plans to enhance the tourist experience, increase satisfaction, and achieve economic sustainability. One of the goals of tourist managers is to encourage tourists to more broadly navigate the destination in order to achieve the ultimate goal of sustainable tourism in terms of the economic aspect and the preservation of cultural and heritage sites, which may be impacted by unintended tourist frequency. This can be managed by studying the spatial configuration and how it affects the formation of tourist movement and, as a result, creating a development plan to redistribute tourist flow. In terms of the methodological aspects, this study showed that using the following multidisciplinary methods are compatible tools for better understanding the spatial behavior and configuration of destinations: questionnaires to understand motivation and familiarity, which have a great impact on the formation of movement patterns; trip diaries to investigate tourist movement patterns, which in this study proved to be useful sources of spatial data collection, especially when innovative technologies are not available or affordable; site exploration and observation to explore spatial configurations; and space syntax to examine connectivity and integration. Moreover, observing the actual tourists’ behavior and the way that they interact with the context could be a good tool for enhancing the quality of spatial configurations and arrangements and, at the same time, for comprehending the actual needs of the tourists.
This study indicated the demand for further research to measure the real impact of tourist flow on cultural and heritage sites due to their intensive uses to expand the understanding of tourists’ satisfaction related to the spatial variable that may impact their movement in the city; the study also indicated the need further research investigating tourist spatial behavior using new tracking technologies such as GIS and GPS applications, which were one of the limitations of this study regarding the difficulties of implementing this technology in the city of Madaba.
6. Conclusions
This study investigated the relationship between spatial configuration and tourist spatial patterns and behavior. Several data collection methods and analysis techniques were used to examine the tourists’ movement patterns, tourist behavior in the study context, and spatial configuration analysis. The results of the study showed that there were various spatial movement patterns in the historical core of Madaba, and some routes and attractions were more frequented by tourists than others. The most connected and well-organized routes had a higher movement density within the study context, where the majority of tourist activities and investments were concentrated. As a result, the pressure on cultural and heritage sites along these routes increased as well. The descriptive analysis showed that the spatial configurations (attractiveness, accessibility, activities, connectivity, and integration) of the historical core of Madaba impacted tourists’ spatial patterns and behavior. Syntactical measures proved that the historical core of Madaba is a relatively intelligible destination that recorded a high level of connectivity and integration. To achieve the principles of sustainable tourism, a set of recommendations regarding the spatial issues found in Madaba can be implemented, such as creating new tourist trails that encourage tourists to navigate the city more broadly, improving the attractiveness and activity accumulation throughout the city, and redistributing tourist flows, particularly in routes with the least spatial frequency. This can prevent the wear and tear of the city’s most frequented cultural and heritage attractions and, at the same time, ensure long-term economic viability throughout the city.
This study shows that examining tourist behavioral movements could be regarded as an important component of cultural and heritage tourism destination sustainability and management, and the impact of spatial configuration, especially in forming spatial patterns, tourist flow, and frequency, should not be underestimated. Our research contributes to the current literature in a number of ways. First, this study extends the investigation of tourist movement as a tool for tourism management by attempting to link spatial behavior, configuration, and human factors. Much of the literature has tended to only examine the tourist patterns or the impact of spatial configuration from the perspective of spatial obstacles and limitations without studying the actual routes, stops, and activities, or the human factors such as visitor experience and satisfaction [10,16,17,35,38,39]. Secondly, this research proposed a multidisciplinary approach to data collection and analysis, both descriptive and syntactical to explain the actual tourist spatial behavior and patterns in urban cultural heritage destinations. The findings of such studies may aid in a better understanding of the spatial configurations and arrangements of the city. As a result, developing a comprehensive management plan for what tourists, the city, and its cultural and heritage sites need may facilitate future policies to promote sustainable tourism in the future.
Author Contributions
M.M.J., R.J.Z. and M.F.S. contributed to the conceptualization, methodology, data collection and analysis, preparation of the original draft, writing—review and editing, visualization, and supervision. All authors have read and agreed to the published version of the manuscript.
Funding
This research received no external funding.
Institutional Review Board Statement
Not applicable.
Informed Consent Statement
Not applicable.
Data Availability Statement
Data available on request due to privacy/ethical restrictions.
Conflicts of Interest
The authors declare no conflict of interest.
References
- UNWTO. International Tourism Growth Continues to Outpace the Global Economy; UNWTO: Madrid, Spain, 2020. [Google Scholar]
- UNESCO. Cultural Sites in Africa, Arab Region, Asia, Europe, and Latin America Inscribed on UNESCO’s World Heritage List; UNESCO: London, UK, 2021. [Google Scholar]
- MoTA. Jordan National Tourism Strategy. 2021–2025. Tourism Strategy That Is Fit for Purpose and Circumstance. 2021. Available online: https://www.google.com/url?sa=t&rct=j&q=&esrc=s&source=web&cd=&cad=rja&uact=8&ved=2ahUKEwjq36-UiMv8AhVsSmwGHY5SC3YQFnoECAwQAw&url=https%3A%2F%2Fprocurement-notices.undp.org%2Fview_file.cfm%3Fdoc_id%3D267337&usg=AOvVaw0PFZWWRyNvQwLvCRKbknAF (accessed on 26 November 2022).
- JNA. Jordan New Agency, Petra. 2021. Available online: https://petra.gov.jo (accessed on 26 November 2022).
- Richards, G. Cultural Tourism: A Review of Recent Research and Trends. J. Hosp. Tour. Manag. 2018, 36, 12–21. [Google Scholar] [CrossRef]
- UNWTO. World Tourism Barometer; UNWTO: Madrid, Spain, 2017; Volume 15. [Google Scholar]
- Grazuleviciute-Vileniske, I. Cultural Heritage in the Context of Sustainable Development. Environ. Res. Eng. Manag. 2006, 37, 74–79. [Google Scholar]
- UNESCO. Policy for the Integration of a Sustainable Development Perspective into the Processes of the World Heritage Convention; UNESCO: London, UK, 2015. [Google Scholar]
- Ursache, M. Tourism—Significant Driver Shaping a Destinations Heritage. Procedia-Soc. Behav. Sci. 2015, 188, 130–137. [Google Scholar] [CrossRef]
- Edwards, D.; Griffin, T. Understanding Tourists’ Spatial Behaviour: GPS Tracking as an Aid to Sustainable Destination Management. J. Sustain. Tour. 2013, 21, 580–595. [Google Scholar] [CrossRef]
- UNWTO; UNEP. Making Tourism More Sustainable—A Guide for Policy Makers; United Nations Environment Programme, Division of Technology, Industry and Economics: Paris, France, 2005. [Google Scholar]
- UNWTO. Indicators of Sustainable Development for Tourism Destinations: A Guidebook; UNWTO: Madrid, Spain, 2004. [Google Scholar]
- TEATA. Stepping towards Sustainability—A Manual for Sustainable Tourism Suppliers and Supporters. 2010. Available online: https://mekongtourism.org/stepping-towards-sustainability-a-manual-for-sustainable-tourism-suppliers-and-supporters (accessed on 26 November 2022).
- Ashworth, G.J.; Tunbridge, J.E. The Tourist-Historic City Retrospect and Prospect of Managing the Heritage City; Pergamon: Oxford, UK, 2000. [Google Scholar]
- Gonçalves, J.; Mateus, R.; Silvestre, J.D.; Roders, A.P. Going beyond Good Intentions for the Sustainable Conservation of Built Heritage: A Systematic Literature Review. Sustainability 2020, 12, 9649. [Google Scholar] [CrossRef]
- Sugimoto, K.; Ota, K.; Suzuki, S. Visitor Mobility and Spatial Structure in a Local Urban Tourism Destination: GPS Tracking and Network Analysis. Sustainability 2019, 11, 919. [Google Scholar] [CrossRef]
- Vu, H.Q.; Li, G.; Law, R.; Ye, B.H. Exploring the Travel Behaviours of Inbound Tourists to Hong Kong Using Geotagged Photos. Tour. Manag. 2015, 46, 222–232. [Google Scholar] [CrossRef]
- Caldeira, A.; Kastenholz, E. Tourists’ Spatial Behaviour in Urban Destinations: The Effect of Prior Destination Experience. J. Vacat. Mark. 2018, 24, 247–260. [Google Scholar] [CrossRef]
- Huang, X.; Li, M.; Zhang, J.; Zhang, L.; Zhang, H.; Yan, S. Tourists’ Spatial-Temporal Behavior Patterns in Theme Parks: A Case Study of Ocean Park Hong Kong. J. Destin. Mark. Manag. 2020, 15, 100411. [Google Scholar] [CrossRef]
- MD Khairi, N.D.; Ismail, H.N.; Syed Jaafar, S.M. Tourist Behaviour through Consumption in Melaka World Heritage Site. Curr. Issues Tour. 2018, 22, 582–600. [Google Scholar] [CrossRef]
- Dalton, R.; Hoelscher, C.; Wiener, J. Wayfinding and Spatial Configuration: Evidence from Street Corners. In Proceedings of the Eighth International Space Syntax Symposium, Santiago, Chile, 3–6 January 2012; Greene, M., Reyes, J., Castro, A., Emo, B., Eds.; Pontificia Universidad Católica de Chile: Santiago, Chile, 2012; pp. 1–16. [Google Scholar]
- Kim, Y. Spatial Configuration, Spatial Cognition and Spatial Behaviour: The Role of Architectural Intelligibility in Shaping Spatial Experience; Environmental Design and Planning University College: London, UK, 1999. [Google Scholar]
- Gebhard, K.; Meyer, M.; Roth, S. Criteria for Sustainable Tourism for the Three Biosphere Reserves Aggtelek, Babia Góra and Šumava; Ecological Tourism in Europe (ETE): Bonn, Germany; UNESCO: Venice, Italy, 2007. [Google Scholar]
- Gospodini, A. Urban Design, Urban Space Morphology, Urban Tourism: An Emerging New Paradigm Concerning Their Relationship. Eur. Plan. Stud. 2001, 9, 925–934. [Google Scholar] [CrossRef]
- Southwell, K. Designing with Urban Tourism in Mind: Investigating the Potential of a Proposed Method for Assessing the Environmental Quality of a Tourist-Historic Street Space; Edinburgh College of Art: Edinburgh, UK, 2004. [Google Scholar]
- Millonig, A.; Schechtner, A. City Tourism: Pedestrian Orientation Behaviour; The Access Company: Loughborough, UK, 2006. [Google Scholar]
- van der SPEK, S. Spatial Metro: Tracking Pedestrians in Historic City Centres; IOS Press: Amsterdam, The Netherlands, 2008; Volume 1. [Google Scholar]
- van der SPEK, S. Activity Patterns in Public Space; a Tool for Assessing City Centres. In Proceedings of the Walk 21, 11th Conference, The Hague, The Netherlands, 16–19 November 2010. [Google Scholar]
- Shoval, N.; McKercher, B.; Ng, E.; Birenboim, A. Hotel Location and Tourist Activity in Cities. Ann. Tour. Res 2011, 38, 1594–1612. [Google Scholar] [CrossRef]
- Kubat, A.S.; Özbil, A.; Özer, Ö.; Ekinoğlu, H. The Effect of Built Space on Wayfinding in Urban Environments: A Study of the Historical Peninsula in Istanbul. In Proceedings of the Eighth International Space Syntax Symposium, Santiago, Chile, 3–6 January 2012. [Google Scholar]
- Aranburu, I.; Plaza, B.; Esteban, M. Sustainable Cultural Tourism in Urban Destinations: Does Space Matter? Sustainability 2016, 8, 699. [Google Scholar] [CrossRef]
- Safari, H.; Moridani, F.F. Syntactical Analysis of the Accessibility and Sociability of a Square in the Kuala Lumpur City Center. Front. Archit. Res. 2017, 6, 456–468. [Google Scholar] [CrossRef]
- Liu, P.; Xiao, X.; Zhang, J.; Wu, R.; Zhang, H. Spatial Configuration and Online Attention: A Space Syntax Perspective. Sustainability 2018, 10, 221. [Google Scholar] [CrossRef]
- Macías, C.J.G.; Contreras, T.J.C. The Life Story: A Social Qualitative Research Method and Its Application in Tourism Management Studies. RITUR-Revista Iberoamericana de Turismo, 2019. pp. 59–77. Available online: https://www.seer.ufal.br/index.php/ritur/article/view/8686 (accessed on 26 November 2022).
- Shoval, N.; Ahas, R. The Use of Tracking Technologies in Tourism Research: The First Decade. Tour. Geogr. 2016, 18, 587–606. [Google Scholar] [CrossRef]
- Hardy, A.; Hyslop, S.; Booth, K.; Robards, B.; Aryal, J.; Gretzel, U.; Eccleston, R. Tracking Tourists’ Travel with Smartphone-Based GPS Technology: A Methodological Discussion. Inf. Technol. Tour. 2017, 17, 255–274. [Google Scholar] [CrossRef]
- Hardy, A.; Aryal, J. Using Innovations to Understand Tourist Mobility in National Parks. J. Sustain. Tour. 2020, 28, 263–283. [Google Scholar] [CrossRef]
- Chua, A.; Servillo, L.; Marcheggiani, E.; Vande Moere, A. Mapping Cilento: Using Geotagged Social Media Data to Characterize Tourist Flows in Southern Italy. Tour. Manag. 2016, 57, 295–310. [Google Scholar] [CrossRef]
- Heikinheimo, V.V.; Tenkanen, H.T.; Hiippala, T.; Järv, O.; Toivonen, T.K. Automated Social Media Content Analysis from Urban Green Areas—Case Helsinki. In Proceedings of the Spatial Big Data and Machine Learning in GIScience, Melbourne, Australia, 28 August 2018. [Google Scholar]
- Chung, H.; Chung, N.; Nam, Y. A Social Network Analysis of Tourist Movement Patterns in Blogs: Korean Backpackers in Europe. Sustainability 2017, 9, 2251. [Google Scholar] [CrossRef]
- Gao, Y.; Ye, C.; Zhong, X.; Wu, L.; Liu, Y. Extracting Spatial Patterns of Intercity Tourist Movements from Online Travel Blogs. Sustainability 2019, 11, 3526. [Google Scholar] [CrossRef]
- Mou, N.X.; Yuan, R.Z.; Yang, T.F.; Zhang, H.C.; Tang, J.W.; Makkonen, T. Exploring Spatio-Temporal Changes of City Inbound Tourism Flow: The Case of Shanghai, China. Tour. Manag. 2020, 76, 103955. [Google Scholar] [CrossRef]
- Bauder, M.; Freytag, T. Visitor Mobility in the City and the Effects of Travel Preparation. Tour. Geogr. 2015, 17, 682–700. [Google Scholar] [CrossRef]
- East, D.; Osborne, P.; Kemp, S.; Woodfine, T. Combining GPS & Survey Data Improves Understanding of Visitor Behaviour. Tour. Manag. 2017, 61, 307–320. [Google Scholar]
- Kim, E.-J.; Jo, Y.; Kang, Y. Are Touristic Attractions Well-Connected in an Olympic Host City? A Network Analysis Measurement of Visitor Movement Patterns in Gangneung, South Korea. Sustainability 2018, 10, 3310. [Google Scholar] [CrossRef]
- Lamine, D.; Rezzaz, M.A.; Kherrour, L. Analysis of the Reality of the Tourist Movement in Algerian Coastal Cities. Case Study of the City of Algiers. GeoJournal Tour. Geosites 2022, 41, 493–501. [Google Scholar] [CrossRef]
- Mckercher, B.; Lau, G. Movement Patterns of Tourists within a Destination. Tour. Geogr. 2008, 10, 355–374. [Google Scholar] [CrossRef]
- McKercher, B.; Shoval, N.; Ng, E.; Birenboim, A. First and Repeat Visitor Behaviour: GPS Tracking and GIS Analysis in Hong Kong. Tour. Geogr. 2012, 14, 147–161. [Google Scholar] [CrossRef]
- Piccirillo, M.; Alliata, E. The Madaba map Centenary 1897–1997: Travelling through the Byzantine Umayyad Period: Proceedings of the International Conference held in Amman, 7–9 April 1997; Franciscan Printing Press: Jerusalem, Israel, 1999. [Google Scholar]
- Bikai, P.M.; Dailey, T.A. Madaba: Cultural Heritage; American Center of Oriental Research: Amman, Jordan, 1996; ISBN 978-1-955918-01-5. [Google Scholar]
- Abu Ghanimeh, A.A.; Ghul, A.E.; Saqqa, R.A.; Nabulsi, M.A. Analysis of the Socio-Cultural Heritage of Madaba—An Approach to Conservation of Heritage Buildings: The Case Study of Dar Al Saraya in Madaba. Anthropologist 2010, 12, 27–34. [Google Scholar] [CrossRef]
- Kildani, H. Modern Christianity in the Holy Land: Development of the Structure of Churches and the Growth of Christian Institutions in Jordan and Palestine: The Jerusalem Patriarchate in the Nineteenth Century in Light of the Ottoman Firmans and the International Relations of the Ottoman Sultanate; Authorhouse: Bloomington, IN, USA, 2010; ISBN 978-1-4490-5284-3. [Google Scholar]
- MOTA. Third Tourism Development Project Secondary Cities Revitalization Study [Main Report]. 2005. Available online: https://www.google.com/url?sa=t&rct=j&q=&esrc=s&source=web&cd=&cad=rja&uact=8&ved=2ahUKEwik-fjjkMv8AhXYtVYBHbxZAp8QFnoECBUQAQ&url=https%3A%2F%2Fmota.gov.jo%2Febv4.0%2Froot_storage%2Far%2Feb_list_page%2F%25D8%25A7%25D9%2584%25D8%25AA%25D9%2582%25D8%25B1%25D9%258A%25D8%25B1_%25D8%25A7%25D9%2584%25D8%25B1%25D8%25A6%25D9%258A%25D8%25B3%25D9%258A-3.pdf&usg=AOvVaw0UHh4KKKLKeqM3Jqhje-k0 (accessed on 26 November 2022).
- van Nes, A.; Yamu, C. Introduction to Space Syntax in Urban Studies; Springer International Publishing: Berlin/Heidelberg, Germany, 2021. [Google Scholar]
Disclaimer/Publisher’s Note: The statements, opinions and data contained in all publications are solely those of the individual author(s) and contributor(s) and not of MDPI and/or the editor(s). MDPI and/or the editor(s) disclaim responsibility for any injury to people or property resulting from any ideas, methods, instructions or products referred to in the content. |
© 2023 by the authors. Licensee MDPI, Basel, Switzerland. This article is an open access article distributed under the terms and conditions of the Creative Commons Attribution (CC BY) license (https://creativecommons.org/licenses/by/4.0/).