Article

Market Developments on Chinese International Air Passenger Markets in Light of COVID-19 Policy Measures

1
School of Architecture and Cities, University of Westminster, 35 Marylebone Road, London NW1 5LS, UK
2
School of Aviation and Security, Buckinghamshire New University, Queen Alexandra Road, High Wycombe HP11 2JZ, UK
3
Centre of Aviation Research, School of Hospitality and Tourism Management, University of Surrey, Stag Hill, University Campus, Guilford GU2 7XH, UK
4
DCU Business School, Dublin City University, D09 Dublin, Ireland
5
College of Economics and Management, Civil Aviation University of China, Tianjin 300300, China
*
Author to whom correspondence should be addressed.
Sustainability 2023, 15(2), 1525; https://doi.org/10.3390/su15021525
Submission received: 21 November 2022 / Revised: 20 December 2022 / Accepted: 21 December 2022 / Published: 12 January 2023

Abstract

:
The world’s governments imposed a plethora of restrictions and quarantine rules to prevent the rapid spread of COVID-19. China was chosen for this study as it was the first market to be impacted. The overall aim of this paper was to analyse international air travel to and from China since the start of COVID-19 and to assess the impact of policy initiatives on seat capacity during this time. The key findings are that implementation of the so called Five one policy in March 2020 was associated with an almost immediate reduction in seat capacity on China to the rest of the world, partially suppressing the more typical impact of underlying GDP and air fares on capacity. It was further found that Chinese international gateways, as airports with substantial proportions of international and connecting traffic, remain the most distressed. Long haul international traffic and revenues from European and North American destinations all experienced unprecedented and sharp reductions. Traffic and revenues from other Asian markets was even more sporadic. Alarmingly, the study extracted that revenues from premium classes were deteriorating much faster than economy class, which is of imminent concern for long-haul carriers reliant on premium traffic coming into the pandemic.

1. Introduction

Sustainable aviation is based on three pillars, i.e., social, environmental, and economic. The economic pillar of sustainable aviation has been a topic of scholarly discourse, especially during times of external shocks. Air transport has exhibited little resistance to external shocks but significant resilience [1]. The COVID-19 pandemic is the first infectious disease and external shock that has been accompanied by such an extensive reaction. By 11 March 2020, the World Health Organization (WHO) declared COVID-19 as a pandemic and as of 13 October 2021 there was 238,229,951 confirmed cases of COVID-19, and 4,859,277 deaths. Travel restrictions, lockdowns and significant changes to day-to-day life were implemented to contain the virus [2]. As of 10 October 2021, a total of 6,364,021,792 vaccine doses were administered worldwide [3]. Airports and airlines reacted to the pandemic by ceasing many operations for months due to low demand and imposed restrictions. While the pandemic benefitted cargo operations due to an increase in e-commerce, passenger traffic decreased dramatically, partly due to the reluctance of people to travel during the global pandemic [4].
The aviation industry changed significantly as documented by many authors. For example, Li et al. assessed the spatiotemporal variations in global air transport networks due to COVID-19 [5] whilst Andreana et al. examined the impact on air transport at the macro-regional level [6]. Sun et al. found that over 110 papers had been published in just 2020 about air transport and COVID-19, categorising these in terms of analyses of global air transport systems, the effects on passenger-centric flight experiences, and broader long-term impacts [7].
Chinese aviation is the best example to showcase how the aviation industry has changed. Since economic reform and the country’s opening up in the 1970s, it has experienced a dramatic growth rate but was also the first market to be affected by the 2020 pandemic outbreak. As a result, the Chinese aviation market and COVID-19 has been examined by a number of scholars. Zhang and Tong (2021) examined the economic impacts of traffic consumption during the pandemic in China that can be explained by objective conditions and subjective factors [8]. Zhang et al. examined changes in airline passenger travel behaviour [9] as did Zhang et al. [10]. Warnock-Smith et al. (2021) conducted a disaggregated airline/airport analysis of Chinese aviation markets and Cui et al. (2021) analysed the COVID-19 pandemic shocks to the Chinese transport sectors [11]. Li et al. (2022) looked specifically at the Chinese domestic market [12].
Policy measures related to COVID-19 have also been studied in the aviation literature. Zhang et al. investigated the effects of policy measures in Australia, Canada, Japan, New Zealand, the UK, and the US, but with little emphasis on air transport related policies, whereas Kim and Sohn looked at the policies in the Korean aviation market [13]. Abate et al. looked into government support for airlines [14]. Zhu et al. analysed public policy in reaction to COVID-19 [15], whereas Dube et al. looked at recovery prospects [16]. Regarding China specifically, Hou et al. covered airport slot re-allocation and subsidy policy in China [17]. Li et al. studied the impact of direct flight suspension and complete entry suspension policies on international connectivity [18]. Czerny et al. provided a preliminary review of China’s market recovery and government policy [19]. Meng et al. compared the impact of COVID-19 control policies in China with the US and Singapore [20] whilst Sun et al. made comparison between China and Europe and US [21].
The paper contributes and adds significant value to this discussion by firstly estimating the impact of China’s overriding Five one policy on international seat capacity and secondly by providing longitudinal disaggregated analysis of the Chinese aviation market since COVID-19 started by considering variation in airline seats, average fares, passenger numbers and revenues within different airline classes across individual airlines, routes and airports serving Chinese international markets. This paper specifically seeks to address the following research objectives: To statistically estimate the impact of the Chinese Five one policy on international seat capacity to and from China; To evaluate changes in traffic dynamics on international markets from China by airline, route and airport; and to uncover how premium class revenues have performed in contrast to economy revenues on Chinese international markets.
One of the notable developments since COVID-19 is that the Chinese domestic market has shown some very clear signs of recovery, whereas the international market is still very much suppressed. Hence the focus of this paper is predominantly on international air services, as this is where much of the uncertainty still lies. These also tend to be more significant regarding policy implications, as it is international air travel that has been most affected by the complex web of travel restrictions and recovery initiatives introduced by numerous governments.
The remainder of this paper is organized as follows. In Section 2, with the literature review, we elaborate on policy measures related to international passenger entry and domestic travel and those focused on aviation recovery, and then detail the specific policy measures taken in China. Section 3 explains the method and data used for our analysis. The main results and discussion are presented in Section 4, and finally, Section 5 provides the conclusions, recommendations and implications of our study.

2. Literature Review

Airports worldwide experienced an estimated loss of approximately 64.6% of passenger traffic and 66.3% or over USD 125 billion airport revenues in 2020 compared to 2019. Similarly, airlines noted a 65.9% decline in revenue passenger kilometres (RPKs) in 2020 compared to 2019. Asia/Pacific and North America experienced a 20% to 25% reduction in domestic passenger traffic than international [22].
With the aim of mitigating the risk of infections brought by international air travel various policies have been practised that affected aviation. These policies related to COVID-19 can be divided into two categories: (a) policies about passenger movements, especially across international borders and domestic travel and (b) policies assisting the restart of aviation. The two categories aim to stimulate the demand for air travel safely and facilitate the delivery of the travel services via supporting the survival of the severely impacted air traffic.

2.1. Policy Measures Affecting International Passenger Entry and Domestic Travel

Yu and Chen suggest that policies against COVID-19 transmission via air travel vary from country to country due to unequal public health preparedness levels, socioeconomic and political environment differences [23]. The USA imposed entry screening at designated airports for international passengers and banned non-US citizen travellers from the EU, China and Iran. EU Member states also imposed travel restrictions, leading to a significant reduction of capacity.
According to the UNWTO (United Nations World Tourism Organization) in May 2020 at 217 destinations worldwide, 97 (45%) of them partially or completely closed their borders to tourists, 65 destinations (30%) suspended international flights partially or completely and 39 destinations (18%) banned the entry of passengers from specific countries of origin or passengers who had transited through specific destinations [24]. Thus the pandemic has caused a significant loss in city-pair connectivity, an essential element for vital economic activities.
With the scientific understanding of the pandemic gradually increasing, countries showing signs of control of its spread eased their entry restrictions. In June 2020, the European Union adopted a coordinated approach of gradually lifting the temporary restrictions on non-essential travel into the EU. Based on this approach, member states have three common criteria (i.e., notification, test positivity and testing rate) [25]. Passengers are obliged to complete a passenger’s locator form and, in some cases to undergo quarantine/self-quarantine; and/or take a test for COVID-19 infection before or after arrival. Another policy measure adopted by some countries is bilateral agreements that allow vaccinated individuals to visit the other state (e.g., Greece-Israel agreement). The EU has put in place the EU Digital COVID Certificate, which permits individuals, who have been vaccinated, received a negative test result, or recovered from COVID-19, to travel more easily and support the restart of air travel.
Vaccination roll-outs are pivotal for easing entry restrictions and restarting air travel. Sun et al. suggest that vaccination passports are required for reviving international connectivity [26]. On 22 July 2020, the COVID-19 vaccination roll-out started in China. As of 12 November 2021, a total of 2,337,700,250 vaccine doses had been administered, with 151.45 doses administered per 100 population in China. As of 18 November 2021, a total of 7,370,902,499 vaccine doses had been administered worldwide (WHO, 2021). Airlines select to fly to places with high vaccination rates. So as vaccination roll-outs have been intensified, restrictions have been easing worldwide, with the exceptions of Myanmar, Libya, Greenland, Afghanistan, Lao People’s Democratic Republic, North Korea and Papua New Guinea that still restrict travelling completely. On the other end, Mexico and Colombia do not impose any travel restrictions.
Zhang et al. suggest that the slow recovery of passenger traffic in most counties can be explained by the governments’ adoption of a “curve flattening” strategy. States would relax restrictions firstly within their territory before coordinating with other authorities to allow inter-State travel.

2.2. Policy Interventions for Aviation Recovery

Public policy interventions worldwide during COVID-19 have taken three forms, according to OECD [27]. Untargeted support schemes, including job-retention schemes, provide liquidity to firms. Sectoral schemes support a specific sector like airlines in Australia and firm-specific support measures, including partial or total nationalisation. Several countries have offered financial support to aviation, in the form of government-backed commercial loans and government guarantees; recapitalisation through state equity; flight subsidies, nationalisation; deferral and/or waiver of taxes and charges; grants; and private equity (Abate et al., 2020) [14].
The nationalisation of airlines is often implemented to save airlines from bankruptcy and protect the tourism industry [28]. Law changes are also another step followed in extreme cases of volatility. Germany, for example, to sustain airlines against insolvency and protect them from bankruptcy, at the outbreak of COVID-19, changed its insolvency law through the COVID-19 Act. This temporarily suspends the obligation to file for insolvency and limits the liability of directors where insolvency is caused by COVID-19.
According to IATA Economics, the airline industry has survived thanks to financial aid, with airlines having received $243 billion of financial aid worldwide so far (Table 1) [29]. The aid has been primarily provided to airlines in the USA, Europe, and Asia, and limited or no support has been provided for Latin American and African carriers. In 2020, over 40 commercial airlines failed or completely ceased operations (Kim and Sohn, 2021). Considering the severity of the impact and the long and winding recovery, government funds are not enough to keep airlines afloat, and external cash injections were sought by airlines (Dube et al., 2021).
The involvement of governments in the aviation recovery of private aviation companies affects the market environment and competition. Some government financial packages to individual airlines and airports have caused disputes (e.g., Ryanair’s court case against the state aid to KLM and TAP), citing unfair competition and special treatment. In their analysis of Virgin Australia bailout, Zhang and Zhang conclude that while the government should refrain from giving direct financial aid to a failing firm, if the private sale deal failed, the cost for Australian consumers and regional communities would be substantial [30].
Both national governments and international organisations support the recovery of domestic and international aviation. Kim and Sohn (2021) state that the Korean government’s support is similar to other countries and includes relaxing slot allocation rules, reducing and exemption of airports charges, airline ticket prepayments, subsidies, and loans. International organisations like ICAO, IATA, Airports Council International (ACI) and UNWTO provide support in the form of market intelligence reports, guidance documents, standards, and recommended practices.

2.3. China’s Policy Interventions

As with other countries, China has introduced policies related to control of passenger movements and the recovery of aviation. Domestic travel has been very much affected by national policies pertaining to lockdowns, strict testing and quarantine requirements with domestic outbreaks, and travel restrictions. A prime example of this is during the Chinese New Year celebrations of January/February 2021. There was not a blanket travel ban for all domestic travel, but instead, there were extensive testing and quarantine requirements. Moreover, certain states offered financial incentives to workers to stay at home, gave free admission to cultural venues/facilities or offered shopping coupons or discounted rent—all trying to encourage residents to stay local [31]. This did defer travel somewhat, but most scholars agree that the domestic market is not far off pre-COVID-19 levels (Warnock-Smith et al., 2021; Czerny, 2021).
Policies related to international passenger movements have been very different. In the early months of 2020 when COVID-19 cases in China were very high, many other countries closed borders, introduced travel restrictions and health checks with flights from China. However, as COVID-19 spread elsewhere, the Civil Aviation Administration of China (CAAC) progressively introduced a number of policies aimed at preventing and controlling the COVID-19 cases (Table 2). This began on 12 March 2022 when there was a new international flight schedule which replaced the routes and flight frequency agreed in the air service agreements and on 19 March the number of flights were only allowed to decrease rather than increase. A few days later on 22 March all passenger flights destined to Beijing were diverted to various designated first entry points in order to control the risk of importing the pandemic to the capital.
As the pandemic spread worldwide more radical policies were introduced on 26 March with the so-called ‘Five One’ rule. This limited Chinese airlines to serving one route to any specific country with no more than one flight per week, and for foreign airlines to serving one route to China with no more than one weekly flight—hence strongly influencing the range of services that could be provided (Liu et al., 2021). At the same time load factors could be not higher than 75% with the aim to prevent infection. On 4 June, some more novel policies were added, with the CAAC imposing penalties for international flights found to carry passengers testing positive for COVID-19. Airlines found to have at least five passengers testing positive were to have their operations suspended for one week. If the positive tests reached 10, their operations were to be suspended for four weeks. This policy was known as a ‘circuit breaker’ or the ‘fusing’ of flights. At the same time there were incentives when if there were zero test results for three consecutive weeks, the number of flights could be increased by one flight per week (subject to the route operation licence), up to a maximum of two flights per week. The circuit breaker policy was changed in December 2020 when airlines had to suspend their operations for two rather than one week if they had at least five passengers testing positive (the four weeks suspension for 10 infected passengers remained the same). It was further changed in April 2021, when airlines found to carry more than five COVID-19 positive passengers could choose between two types of restrictions: frequency-based, or load factor-based. For frequency-based penalties, the airline would have to suspend operating into China for two weeks, whereas for load factor restrictions, the airline would only be allowed to operate at no higher than 40% passenger load factor for four weeks. However for flights with 10 or more infections this load factor penalty was not permitted and flights had to be suspended.
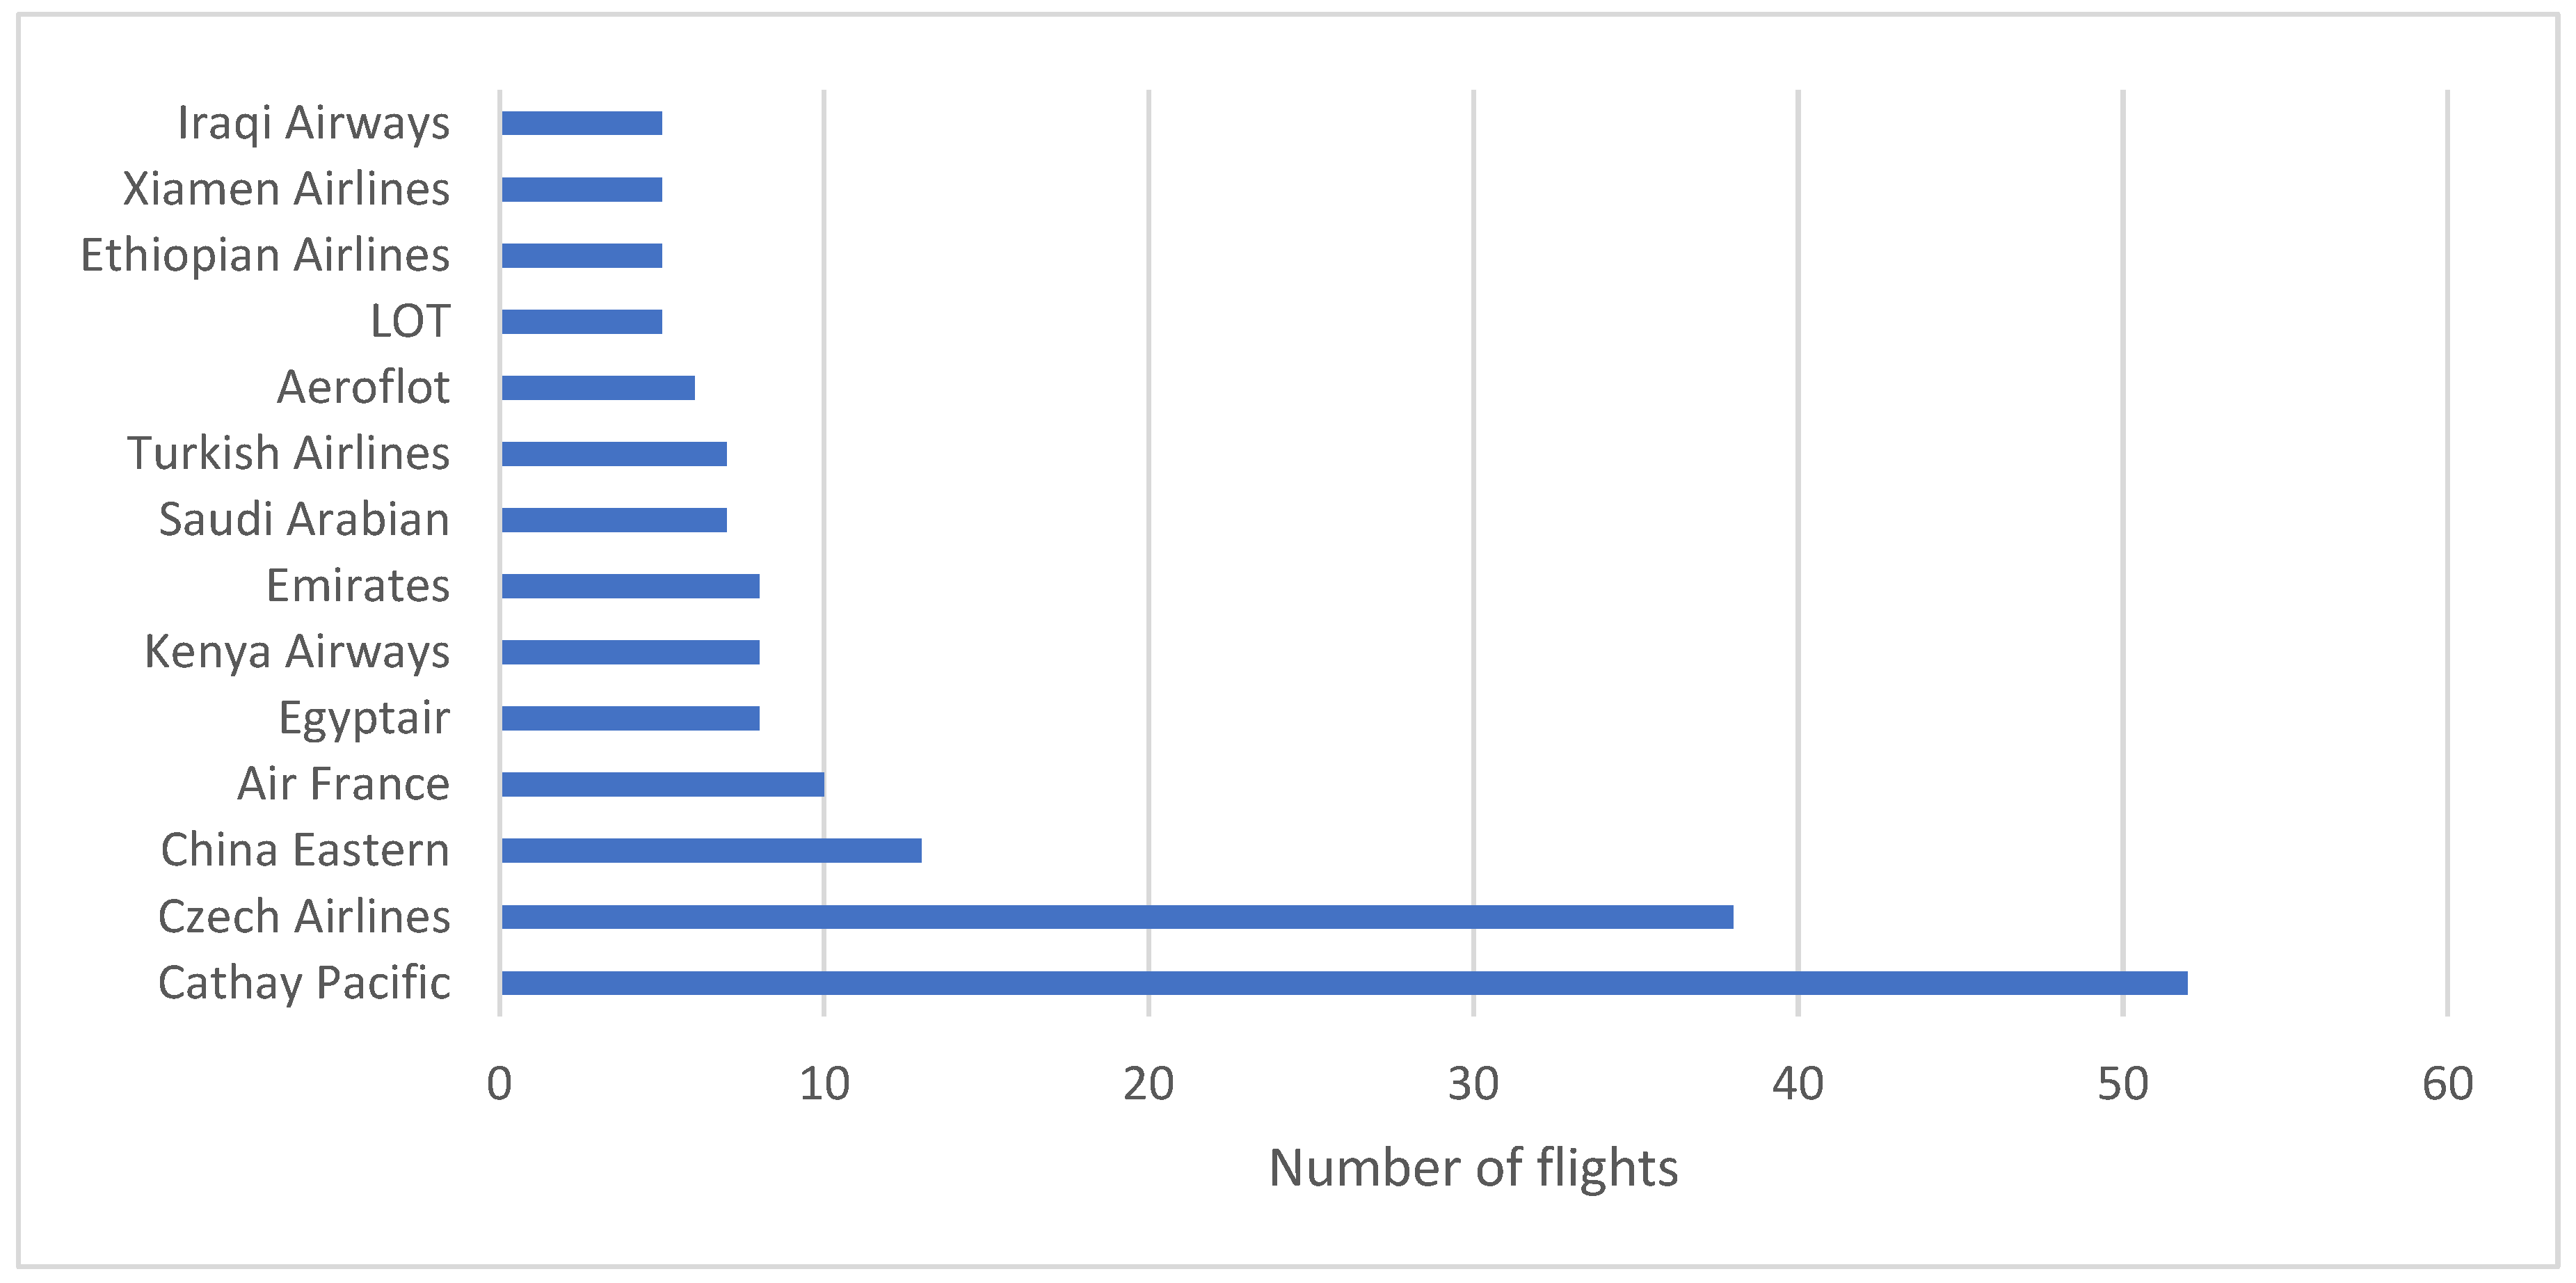
The impact of this fusing policy for individual airlines through time is shown in Figure 1 and quite clearly Cathay Pacific has been the most severely affected by this. The five one and fusing policy was described by Czerny et al. as outcome-based regulation by which the government tried to deal with improving international connectivity whilst at the same time tightly controlling the spread of COVID-19 cases. It received criticism from the US government stating that it violates the nations’ air services agreement and places undue culpability on carriers. In addition, China introduced travel bans to certain countries, stringent health checks and mandatory quarantine to limit the infection rates of the virus. It implemented a double negative tests policy, like some other countries, where all passengers flying to China needed to take both nucleic acid, IgM anti-body tests and apply for green health codes or certified health declaration forms within 48 h before boarding the flight. Yu and Chen (2021) found that the fusing policy was not effective to reduce the number of imported cases, whereas this double negative test policy was.
In the early months of 2020 when all traffic was severely depressed the Chinese government introduced various measures to provide relief to the airlines, by reducing costs and promoting growth. A payment scheme was introduced of US$0.0027 per available seat-kilometre (ASK) for flights on routes served by multiple airlines, and US$0.0081 per ASK for a route where the carrier was a sole operator to encourage the airlines to keep flying [32]. In addition, Class 1 airports (with passenger numbers >4% of total passengers) and Class 2 airports (with passengers between 1–4% of total) had their landing charges cut by 10% and parking fees waived, and there were reductions in air traffic control fees and fuel costs as well (Flightglobal, 2020). Moreover, the government waived mandated contributions from passengers and airlines to the Civil Aviation Development Fund (Czerney et al., 2021). Hong Kong airport (operated by the Hong Kong government) also introduced relief measures such as fee reductions and rental concessions/waivers targeted at airlines, retail and catering outlets, ground handling agents and others (Warnock-Smith et al., 2021) in an effort to support the industry which suffered even stricter COVID-19 measures at this airport than in mainland China [33].
There were also other efforts to specifically strengthen domestic traffic. Secondary airports were affected less by COVID-19 due to their smaller dependence on international traffic but at the same time due to their limited capital reserves were more vulnerable to external shocks [34]. Hou et al. (2021) state that this is also the case for Chinese small airports that mainly live on government subsidies. As a measure to reduce the pandemic impact on the small airports, the Chinese government launched special subsidy programs, where small airports in Southwestern and Northern regions received more subsidies due to their more adverse traffic drop and importance to local communities, though this measure was removed quite swiftly.
Moreover, further liberalisation in the form of access to new routes can support aviation recovery. The CAAC removed capacity constraints of the Beijing, Shanghai and Guangzhou hub airports and granted small airport access to hub airports enhancing, therefore, domestic traffic. According to the new rule, carriers can apply for slots in Beijing, Shanghai and Guangzhou to serve small airports with an annual passenger throughput of less than 1 million, as long as the airlines operate at least 15 routes from the hub airports (Hou et al., 2021).
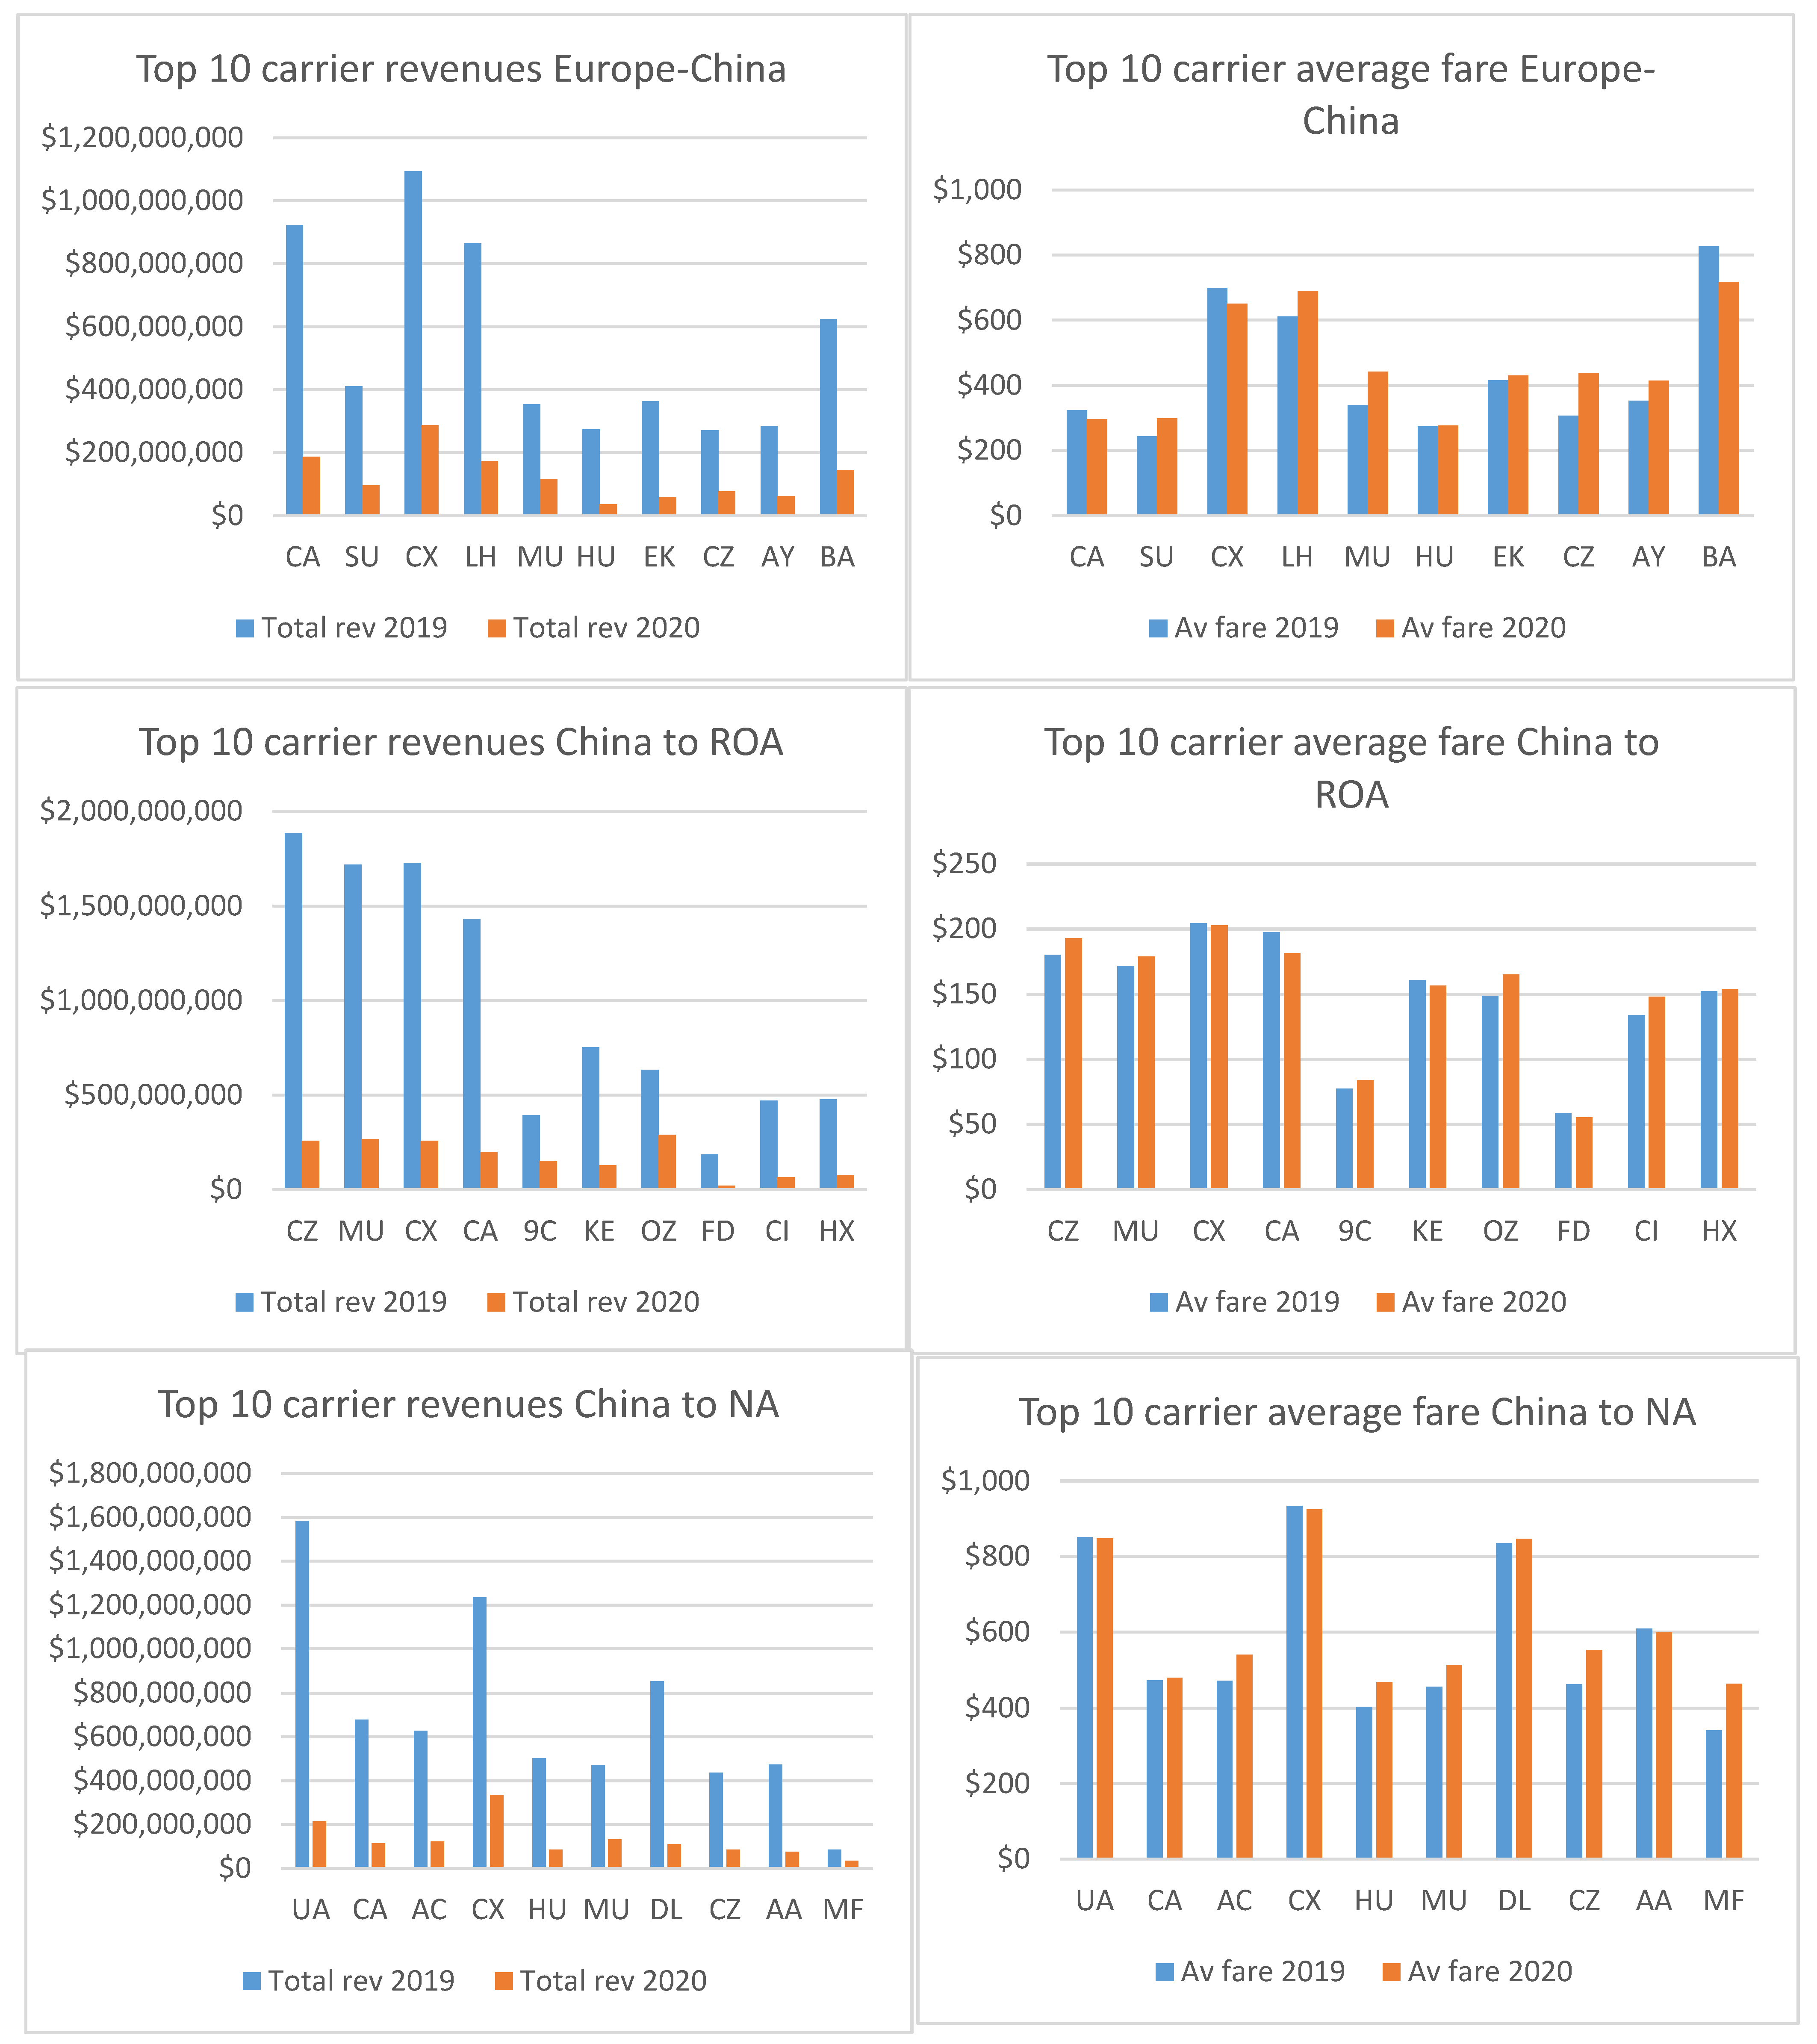
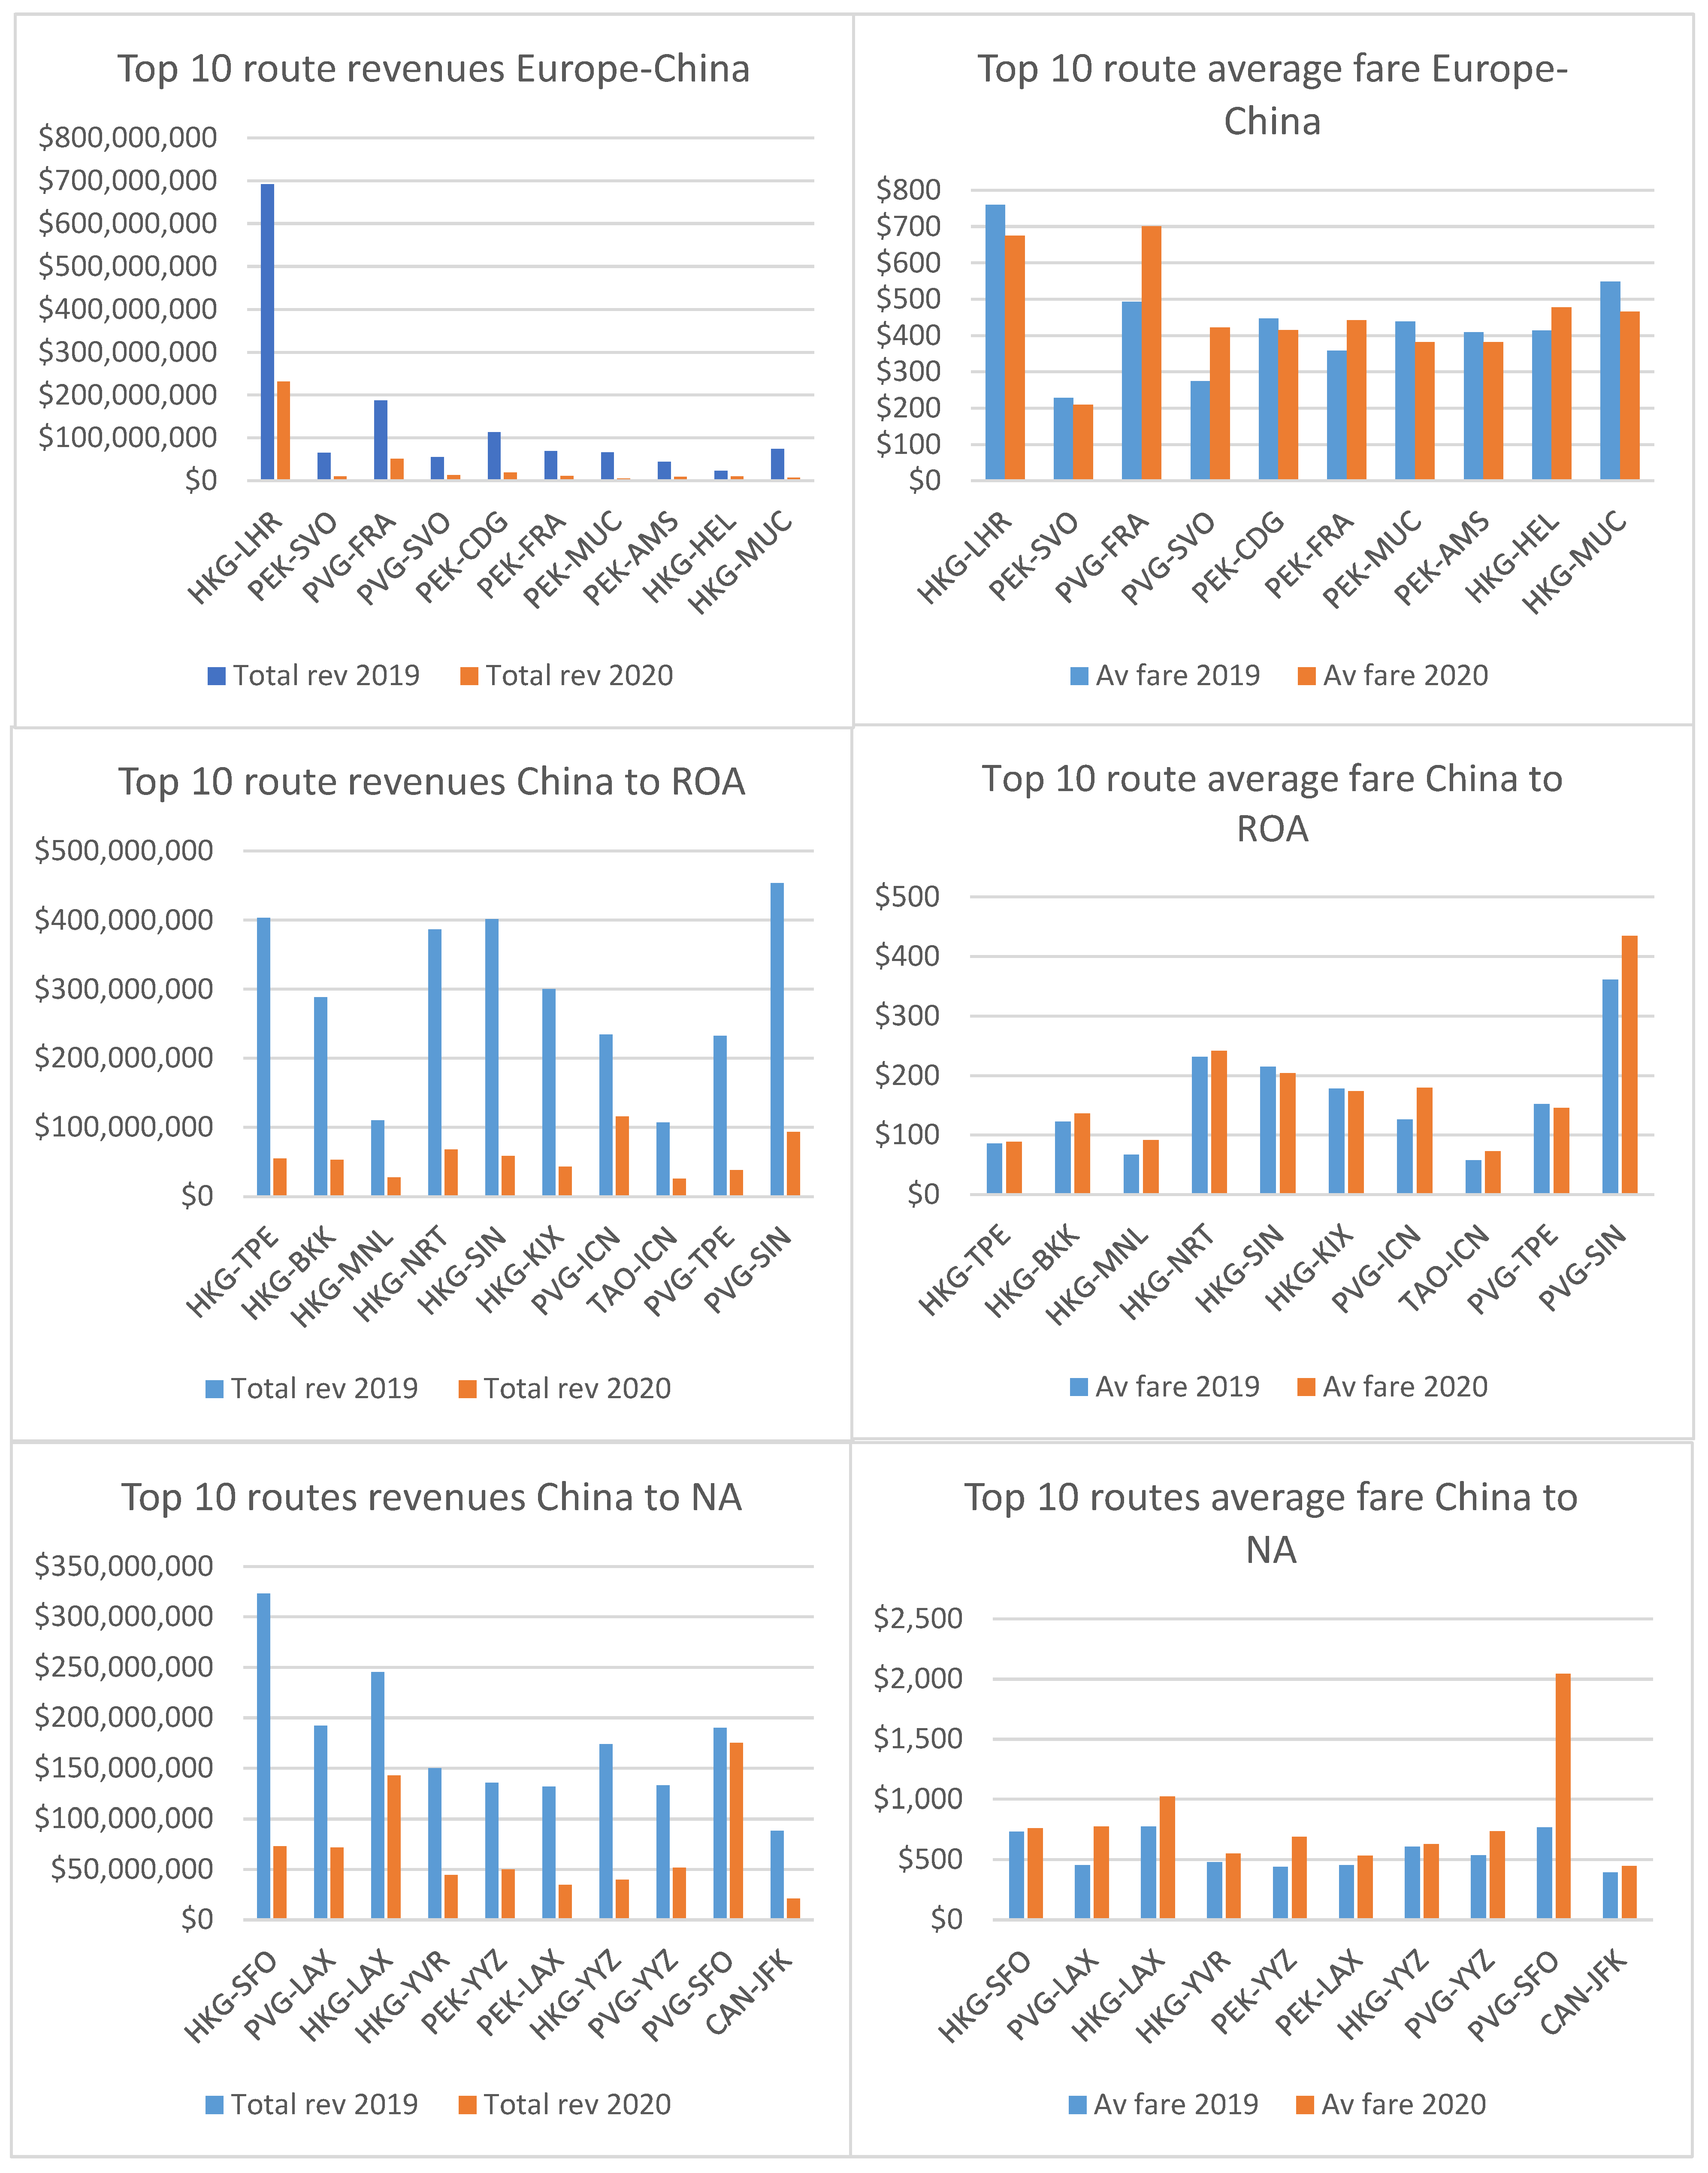
In terms of fares, press reports indicated that in May 2020 fares between China and US were up to ten times higher than those before COVID-19 [35] whereas in August 2021 they were reported to be five times more expensive that in August 2020 [36]. It was argued that much of this was due to the shortage of flight supply and many Chinese and overseas students wanting to return to China. Whilst there is also some similar evidence for a few other specific routes, there exists no systematic verification of this trend and so this is one of the aims of this research.
Meanwhile, Hong Kong which had separate COVID-19 policies maintained some of the world’s strictest border rules including blocking non-residents from entry and enforcing 21 day quarantines for travellers. It also had its own circuit breaker policies in relation to air transport. In 2020 it introduced a flight-specific mechanism which prohibited flights from serving Hong Kong for 14 days if:-
  • Five or more passengers arriving on the same flight at Hong Kong had a positive COVID-19 test; or
  • Three or more passengers on two consecutive flights with the same airline from the same place had a positive COVID-19 test; or
  • One or more passengers arriving on the same flight had a positive COVID-19 test with one or more passengers failing to comply with the requirement(s) specified under the the Prevention and Control of Disease (Regulation of Cross-boundary Conveyances and Travellers) Regulation.
This policy was tightened on 14 April 2021 by replacing ‘five or more’ with ‘three or more’ in condition 1, and ‘three or more’ with ‘two or more’ in condition 2, and then again in December 2021 when condition 2 was replaced with ‘four or more passengers on any flights of the same airline from the same place within a seven-day period had a positive COVID-19 test’. Also in April 2021, a new place-specific suspension mechanism was added. With this if five or more passengers on all flights from the same place, regardless of airline, were confirmed to be COVID-19 positive within a seven-day period, all passenger flights from that place were banned for 14 days. Various passenger restrictions and quarantine conditions were also imposed on passengers from this place which would be specified as very high-risk [37]. Since then this mechanism has been used for various countries. For example, it was first introduced in April 2020 for India, Pakistan and the Philippines. The UK was one of a number of countries that has been on this very high-risk list, with flight bans imposed in December 2020, July 2021 and then in January 2022 along with US, Australia, Canada, France, India, Pakistan and the Philippines. Most recently the Government announced that from 1 April 2022 the place-specific suspension mechanism would be lifted although the flight-specific suspension mechanism would continue with some adjustments [38]. This move was most welcomed by the airlines who have viewed the policies as being very restrictive.

3. Method and Data

The analysis uses extensive secondary data from three reliable sources. To provide an overview of the Chinese air travel market, and to track overall trends before and since COVID-19, data published by the CAAC (Statistics of Key Performance Indicators for China’s Civil Aviation Industry and Statistical Bulletin of Civil Aviation Industry Development) has been presented [39]. More detailed demand and supply data are then used, focusing primarily on the three internationally important Chinese markets: China to Europe, China to North America, and China to Asia. The supply analysis was conducted using Official Airline Guide (OAG) data. OAG is a comprehensive subscription database that records 96% of global passenger itineraries. OAG has been used in various academic papers (e.g., Corbet et al., 2019; Lei and O’Connell, 2011; Warnock-Smith et al. 2021). This database does not include charter or cargo flights. Daily capacity data reported by origin-destination (O-D) pairs from January 2019 to September 2021 were collected.
Demand and revenue analysis was conducted using Sabre AirVision Market Intelligence Data Tapes (MIDT) subscription database. MIDT collects data on passenger demand, fares and airline revenues but includes only indirect bookings such as online travel agency and global travel retailer bookings through a Global Distribution System (GDS). The provided data uses an algorithm that considers direct bookings to estimate total demand, average fares, and revenues [40]. The data was collected from January 2019 through to June 2021. To reflect market concentration levels of the three respective markets and to ensure a consistent approach, origin-destination passenger data were extracted for the top 10 carriers. This covered 70% of the total market on China to North America, 64% on China to Europe and 50% on China to the rest of Asia in the year 2020.
For the policy analysis, the description of air policy developments as detailed in Section 2.3 was expanded on through a multiple regression analysis of the impact of the China Five-one international market policy on international seat capacity developments in China to Europe, North America and Asia. Although there were a number of sub-policies, the five/one policy was selected as the most appropriate policy independent variable to use in the regression given the broader nature of the data at the international route group level, which is not specific to individual airports or routes. Five/one sets the overall level of permitted supply on Chinese international markets. The other policies starting in June 2020 such as fusing and specific permitted entry points all work within the continued and broader five/one policy and can therfore be assumed to incrementally impact specific routes/airports within what was a generally supressed market at different points during the pandemic.
Air transport supply, using seat capacity data from OAG was selected as the most appropriate dependent variable rather than traffic given the more intuitive link between the imposition of air operator restrictions and the supply of seat capacity. It is recognised that in the absence of air operator restrictions, supply would have reduced anyway as a response to reduced traveller confidence and demand for air travel. Without any data on the counterfactual, however, it was not possible to explicitly estimate this. Average fares, and combined quartely GDP growth were selected as the other explanatory variables along with the Five/one policy with the expected relationship with market capacity offered being negative, positive and negative respectively. The observed period was January 2019 to June 2021. Although time series data can lead to autocorrelation issues when estimating with OLS, on this occasion OLS was selected as there was no detectable correlation between residuals in any of the regressions. The other OLS assumptions of normality and no multicollinearity were also met. Due to the unprecendented impact of COVID-19 on the aviation market, regular assumptions related to patterns in time-series data did not hold for the observed period. The observed months themsevles were therefore set as observations in the regressions (n = 30).

4. Results and Discussion

4.1. Aggregate Picture

Overall trends between January 2019 and June 2021 in seat capacity, total passengers, and total revenues on the major China international markets (Europe-China, Rest of Asia-China and North America-China) were compiled (Figure 2, Figure 3 and Figure 4). In line with the aggregate airport trends, there has been a sustained drop in capacity offered, traffic and carrier revenues from January 2020 onwards, with very little evidence of recovery up to the latest month of available Sabre data at the time of writing (June 2021). The only variations of note are the marginal uptick in total revenues on Europe and North America to China markets from February to June 2021 and the increased seat capacity offering of carriers on North America-China markets between June and December 2020. The former was driven by a notable increase in average fares (using reported Sabre data). On Europe-China markets, average fares increased by 41% from USD844 to USD1187 over this period despite traffic and capacity indicators remaining static. From North America to China, the uptick in average fares has been less pronounced (18% from USD1506 to USD1772) and only starting in April rather than February 2021. This is supported by IATA World Air Transport Statistics (2021 p39), showing the second largest systemwide drop in passenger load factors of −28.1% in 2020 to 54.4% (second only the Europe-North America market experienced a −31.2% drop in 2020 passenger load factor) (A proportion of the observed difference between traffic (Sabre) and capacity (OAG) could also be due to some carriers over-reporting capacity to OAG during what was an uncertain period of travel restrictions). The continued presence of travel restrictions on international Chinese markets has impacted the likelihood of any short-term recovery in traffic, capacity, and revenues, despite the marginal variations observed between the major regional route markets.
The other overall trend picked up in the Sabre and IATA data (IATA World Air Transport Statistics, 2021, p39) has been variation between premium and economy traffic and revenues. Despite unanimous falls in overall international traffic and revenues, falls noted in premium classes have been even more pronounced than in economy to the tune of −0.4%, −3.1% and −0.8% on the Asia Pacific, Europe and North America markets, respectively (by RPK and region of airline domicile). Data from Sabre on Europe, Rest of Asia and North America to China markets (Figure 5) show markedly more significant drops in premium versus economy revenues between June 2021 and June 2019 levels. However, unlike the IATA data, economic traffic is slightly more depressed than premium traffic as a percentage of June 2019 levels. In all cases, revenue dropped by a lower rate than traffic, with airlines able to exploit a perceived need for essential travel throughout the pandemic. Airlines have generally been able to do this to a greater extent, however, in economy class instead of premium classes.
Having gained an appreciation of the overall impact of COVID-19 on Chinese air transport market patterns, the remaining analysis focuses on breaking down the overall Chinese international market into individual route groups and carriers to obtain some indicators of which market elements have been worst and least affected by the COVID-19 pandemic.

4.2. Carriers Serving Chinese International Markets

Representing 63%, 47% and 89% of total O&D market traffic, respectively, the top 10 carriers on three major international route markets involving China have all seen significant drops in traffic between 2019 and the first half of 2021 (Table 3). Despite universal reductions in traffic, there have been some sizeable shifts in relative market share between carriers. On Europe to China, Lufthansa (LH) was the largest carrier in the first six months of 2021 despite being the fourth largest in 2019. Air China (CA), the largest operator in 2019, fell back to second in the first six months of 2021. On Rest of Asia to China, Spring Airlines (9C) was the top carrier in 2020 despite being 5th largest in 2019, with China Southern dropping from largest to fourth-largest, though Spring Airlines saw reduced traffic in the first half of 2021. Thai AirAsia (FD) flights were temporarily suspended to China during large parts of 2020 and into 2021, with the carrier’s H1 focus being on recovering Thai domestic routes. On the North America to China market, United Airlines was largest in 2019 but dropped to third in 2020. Despite seeing a large drop in traffic like everyone else on this market, Cathay Pacific (CX) has become largest in terms of market share both in 2020 and the first half of 2021. Chinese carriers have naturally been most exposed to falls in traffic on these major Chinese international markets, with Cathay Pacific (CX), Air China (AC), China Eastern (MU) and China Southern (CZ) having large market shares on all three route markets in 2019.
Figure 6 shows developments in average fares and total revenues for the top 10 carriers on three major international markets involving China. As was the case for passengers, universal reductions in revenues can be observed for all the main carriers between 2019 and 2020. Despite being the fifth largest carrier on Rest of Asia to China markets in 2019, Asiana Airlines (OZ) became the largest carrier in terms of revenue in 2020 with almost USD 290 mn. On Europe to China, Cathay Pacific (CX) retained its status as the largest carrier in terms of revenue, though still experiencing a substantial drop in revenue from USD1,094 mn down to USD288 mn. United Airlines (UA) took a disproportionately big hit on North America to China markets, seeing a drop from USD 1.6 bn in 2019 down USD 214 million in 2020, leaving Cathay Pacific as the largest carrier on that market too with USD336 million in earnings. In terms of average fare changes between 2019 and 2020, levels were inconsistent between carriers as they grappled with how best to respond to the artificially depressed market during 2020. For instance, British Airways on Europe to China tried to respond to the demand situation with some average fare reductions between 2019 and 2020, especially given they were the highest yield operator on this market going into the pandemic. Lufthansa, on the other hand, saw an increase in average fares over the same period. A similar situation prevailed on China to Rest of Asia and China to North America markets with Cathay Pacific (CX), the highest yield operator on both international markets, attempting to marginally reduce average fares in both cases.
With the exception of Spring Airlines (9C) and Thai AirAsia (FD), airlines that do not offer a premium service configurations, all top 10 carriers on three major international markets involving China carried at least some premium traffic. In 2019 premium revenues represented only 18% of the top 10 carrier revenues on the rest of Asia to China markets. On North America and Europe to China markets, premium revenues made up as much as 52%. By the first half of 2021, overall premium revenues had plummeted, making up only 29% of top 10 carrier revenues on North America to China markets, 31% of Europe to China markets and 13% on Rest of Asia to China markets. Broken down by carrier only in two cases there was a shift between 2019 and H1 2021 from economy to premium revenues (Figure 7). There has been a shift from premium to economy revenues in all other cases with both an economy and premium class offering. Carriers serving Europe to China markets saw the biggest changes with Air China (CA) and Hainan Airlines (HU) seeing as much as a 25–35% shift. Air China (AC) also saw a similar shift between premium and economy revenues on North America to China markets, showing a consistent impact on Air China during the pandemic. Only China Airlines (CI) based in Taiwan on Rest of Asia to China routes and Xiamen Airlines (MF) on North America to China routes saw any sort of resilience in their premium classes, though in the case of CI this was partly due to particularly marked reductions in economy revenues over the observed period (USD398 mn in 2019 down to just USD12 mn in H1 2021).
British Airways (66%), Lufthansa (59%) and Cathay Pacific (57%) were the most heavily reliant of the top 10 carriers on premium revenues on Europe to China markets before the COVID-19 pandemic. In all three cases by H1 2021, premium revenues represented a minority share of total revenues. United Airlines (63%) and Cathay Pacific (61%) were similar in North America to China markets, depending on premium traffic going into the pandemic. In the case of United Airlines, by H1 2021, only 31% of total revenues were from premium classes. The worry for these carriers is the extent to which pre-pandemic business models that were reliant on premium revenues can continue into the post-pandemic period, given the well-documented shift of business practises to more virtual meetings during the pandemic. Carriers like Air Canada (only 39% in 2019) and China Southern (only 32% in 2019) on North America to China markets may benefit from a more sustained shift between business and economy revenues given that they went into the pandemic much less reliant on premium revenues. The same applies to Aeroflot (only 29% in 2019) and China Southern on Europe to China markets.

4.3. Chinese International Routes

On each of the three selected international markets involving China, the top 10 routes are reported in Table 4. Compared to the top 10 carriers, the top 10 routes naturally represent a lower share of the total O&D market given the higher number of O&D combinations compared to the number of serving air carriers. The top 10 routes represented 13%, 16% and 25% of the total market on Europe, Rest of Asia and North America to China, respectively. All observed routes have been badly impacted by the pandemic, as expected. Hong Kong to London Heathrow (HKG-LHR) remained the largest Europe to China route throughout the period despite substantial falls in traffic.
On the other hand, the Beijing Capital to Moscow Sheremetyevo (PEK-SVO) route reduced to negligible levels by H1 2021, third lowest on what was the original top 10 listing in 2019. On the Rest of Asia to China market it appears that the stricter travel restrictions in Hong Kong in comparison to the rest of China and the wider region [41] has at least temporarily reduced Hong Kong’s prominent role in serving the highly popular regional route to Taipei (HKG-TPE). By H1 2021 Shanghai Pudong to Taipei (PVG-TPE) was the largest route in this market up from eigth with just over 61,000 O&D passengers. HKG-TPE fell to sixth largest in H1 2021 with only 20,700 O&D passengers. The role of Shaghai Pudong (PVG) on North America to China markets has also increased relative to other key Chinese airport gateways, with the top 2 largest routes by H1 2021 being PVG-SFO (San Francisco) and PVG-YYZ (Toronto), although still at very low numbers in comparison to 2019. Hong Kong and Beijing Capital airports were running their previously very busy North America routes at negligible levels by H1 2021. Hong Kong (HKG) to San Francisco (SFO), the largest route in this international market in 2019, was estimated to have only 5% of 2019 traffic in 2021 (full year estimate). In contrast, PVG-SFO is estimated to have around 38% of 2019 levels in full year 2021.
Figure 8 reports route based market performance with respect to average fares and total revenues. Hong Kong to London Heathrow has dominated revenues on Europe to China both in 2019 and 2020 despite the significant drop in total revenues on that route.
On Rest of Asia to China, Shanghai Pudong to Singapore (PVG-SIN) generated the highest revenue in 2019 despite not being the largest route in terms of traffic. By 2020, however, it experienced a much bigger percentage drop than Shanghai Pudong to Seoul Incheon (PVG-ICN), which was the largest revenue generating route in 2020. Revenues on the Hong Kong to San Francisco (HKG-SFO) route collapsed to such an extent that in 2020 it was only the third largest revenue generating route amongst the top 10 North America to China routes with Shanghai Pudong to San Francisco (PVG-SFO) displaying a remarkably small drop in revenues, given the circumstances, from USD189 mn to USD174 mn, reflected by the very large increase in average fares on this route from USD744 to over USD2,000, helping to sustain revenues despite 2020 passenger volumes dropping to 35% of 2019 levels. According to Airport Technology (2021), Shanghai Pudong is positioning itself longer-term as a major international hub. Home to large China Eastern and Air China bases already, creating a new Terminal 3 will further increase its transferring capability between international and domestic routes. Regarding average fares, there has been a tendency, on top 10 North America to China routes, for average fares to increase (in particular on the PVG-SFO route as previously discussed), whereas in the other two international route groups, change in average fares has been more inconsistent between individual routes, reflecting the incongruent pricing decisions of carriers serving those markets, their respective market share on each route and competitive pricing dynamics between carriers serving the same O&D markets. To illustrate, the PVG-SVG route in August 2020 was directly served by only two carriers (United Airlines and China Eastern), each with seven flights a week, leading to limited competitive pressures, whereas the PVG-SIN market was served by four carriers in August 2020 despite traffic loses (Spring Airlines—7 weekly flights with an A320 and Singapore, China Eastern and Juneyao Airlines all with 1 flight a week with a larger B787 aircraft gauge (OAG, 2021).
In connection with the air policy review contained in Section 2.3, the relationship between the imposition of the five one policy on international routes to and from China and developments in seat capacity over the period January 2019 to June 2021 was tested through an OLS multiple regression analysis covering Europe, North America, and Rest of Asia to China markets. Equation (1) expresses the regression variate and Table 5 summarises the results.
Y i = α + β 1 A V F A R E i + β 2 G D P G i + β 3 F I V E O N E i + ε i
where Y i is aggregated monthly biderectional seat capacity as reported by OAG; A V F A R E i is average market fares per month reported in US dollars as provided by Sabre, G D P G i is the combined average quartely GDP growth rate versus the previous quarter involving China and international country groupings, F I V E O N E i is represented as a dummy variable representing China’s activation of its Covid related international travel restrictons, taking a value of zero until the month of March 2020 and a value of one from April 2020 through to June 2021 whilst the policy was activated during the observed period and ε is the error term.
The Five one policy was found to have a significant impact on seat capacity in all three markets and with the expected negative sign. It had a strong explanatory impact on both Europe to China and ROA to China markets. Though still significant, its impact magnitude was less on NA to China. This seems to be due to the very low load factors observed during the April to December 2020 period on this market.
Despite not being able to counterfactually estimate any reductions in capacity that might have occurred anyway in the absence of travel restrictions (due to reduced traveller confidence), the observed data and regression results are confirmatory of an immediate and unprecedented reduction in seat capacity from April 2020 onwards, timed exactly with the impositions of the restrictive Five/one policy at the end of March 2020 (see Table 2, Section 2.3).
The activation of the Five one policy was associated with a significant 1.14 mn, 0.47 mn and 11.3 mn reduction in seat capacity on China to Europe, North America and Asia markets respectively. This contrasts with a 1% increase in combined GDP relative to the previous quarter being associated with an atypically small increase of 0.12 mn, 0.03 mn and 0.4 mn seats in the same markets. Whilst average air fares had an unexpected sign on Asia to China markets it was not significant. For China to Europe and China to North America markets a USD $50 average fare increase was associated with an atypically small reduction of 0.07 mn and 0.02 mn seats respectively. Compared with previous studies undertaken before the pandemic, the impact of GDP and average fares on market capacity appears low. The unprecedented nature of the pandemic and the subsequent implementation of government restrictions, however, have led to a comparatively higher than normal policy impact coefficient and lower than normal average fare and GDP coefficients.

5. Conclusions

The COVID-19 pandemic has had a devastating impact on the global air transport industry as governments around the world have imposed a plethora of restrictions that have included suspending or severely limiting international flights, travel bans, lockdowns, stay-at-home directives as well as quarantine rules to prevent the rapid spread of the disease. These policies have had a negative catalytic impact as they have caused global air travel to become severely curtailed to unprecedented levels as the pandemic produced an average reduction in international traffic of around 66% in 2020 compared to the previous year, representing the largest shock to commercial air travel since World War II. However, as levels of vaccination has gained traction across the world, there has been a slow response in terms of traffic generation on international routes. This is a worrying progression as the aviation industry remains in a continuous state of financial distress. China has become the second largest air transport market globally after the US and was the first market to be impacted by the pandemic. Therefore this market became the premise of this study as it was deemed to be an excellent template to extrapolate from, because of its longevity in dealing with the virus when compared to other markets around the world. The research sought to uncover how international traffic, flight frequency, fares and revenues, including in premium and economy classes unfolded on Chinese international markets at a granular level up from the start of the pandemic until the summer of 2021.
China produced a number of policy initiatives to restrain the spread of the infection, including restricting the number of operators on a specific international route within a defined period and applying severe penalties if COVID-19 cases were detected upon arrival. Depending on the international destination, China enforced bipartisan legislation that either banned travel outright or enforced multiple negative tests before travel could be undertaken. From an international perspective, this research has also provided evidence of the impact of the Chinese policy environment on international seat capacity to and from China.
The research produced a number of insightful findings. The implementation of the so called Five one policy in March 2020 was associated with an almost immediate reduction in seat capacity on China to Europe, North America and rest of Asia markets to a high degree of statistical significance and in the process partially suppressing the more typical impact of underlying GDP and air fares in driving supply changes.
Smaller airports that traditionally had a lower number of flights when compared to the incumbents of Beijing and Shanghai recovered much faster as these airports had a much smaller proportion of international flights with Shenzhen and Guangzhou reaching 2019 flight levels by the following year. Shanghai’s second smaller airport Hongqiao followed the same pathway. However, problems in recovering the number of flights at the large Chinese hub airports that include Beijing, Shanghai Pudong and Hong Kong are highly evident as these airports are dependent on connecting traffic and are the key gateways to long-haul international destinations. Hong Kong International airport is the most severely impacted as its domiciled Cathay Pacific has significantly curtailed its long haul operations as the policy restrictions that were imposed by the Government over COVID were even stronger than in mainland China.
The study also measured changes in the number of passengers, and revenues from China to three international long-haul markets that comprised Europe, rest of Asia, and North America. All markets experienced unprecedented and sharp reductions during the early months of 2020. Still, the European and North American markets produced noticeable increments in enhanced revenues by the summer of 2021, which was underpinned by airlines charging higher airfares, as flights to Europe, for instance, had airfares that were 41% higher. A significant finding was the abrasive decline of premium classes in terms of income generated. This trend is particularly concerning as premium classes are responsible for a significant proportion of overall revenues. Alarmingly, the rate of decline in business class revenues were notably greater than in economy class. Premium traffic between China and North America and Europe accounted for 52% of total revenues pre-pandemic, but plummeted to around 30% by mid-2021. The widebody aircraft serving these markets have sizeable premium classes equipped with top-end expensive products. Many of these premium seats remained unfilled, with United Airlines, for example, generating just 31% of its income from these premium seats between the US and China in the Summer of 2021, while it garnered an impressive 61% back in 2019 from the same routes.
There was also a granular insight into the top 10 international carriers from China. An interesting observation was the sizable shifts in airline market rankings in pre- and post-pandemic periods, which took place between all three continents. Air China was the largest carrier operating between its homeland and Europe in pre-pandemic times, but it had become outmuscled by fourth placed Lufthansa by the Summer of 2021, despite a hike in fares. Similarly, United Airlines had dominated the US-China markets but was replaced by fourth placed Cathay Pacific by mid-2021. Policies offering solid financial support from respective Governments helped to change the status quo. The German Government agreed to a €9 billion bailout to stabilise its flag carrier, Lufthansa in return for a 20% stake [42]. This allowed it to retain its long haul schedule to key international markets as other carriers pulled routes.
Regarding the disaggregated city-pair analysis, the most important city pairing in the post pandemic world (summer 2021) was Hong Kong to London Heathrow despite it experiencing a heavy drop in traffic, followed by Shanghai (Pudong) to Frankfurt, whose markets retained the highest number of travellers and produced the most revenues, while Beijing to Moscow collapsed. Well-established routes operating for decades seem to have retained their rigidity, alas at a much reduced level, while thin routes and those that required passengers to connect at a hub were hit the hardest. It was a similar situation for Chinese to North American routes, but were mostly bolstered by higher fare offerings. The top 10 short to medium haul routes from China to the rest of Asia show the highest paradigm reduction in passenger traffic, when compared to Europe and North America. At the same time, the fares recorded between the city pairs were only marginally higher in the post-pandemic timeframe.
There are limitations and various future research directions. The first is that no air cargo data was captured in this analysis as the datasets did not provide this information. If cargo was captured, then the dynamics of traffic and revenues would change considerably and provide a much more holistic outlook. Future research should endeavour to incorporate this important revenue stream particularly for many Asian combination carriers. Secondly, only the top 10 routes were analysed at the disaggregate level, and although it represents a unique attempt at disaggregation, it would enhance the research further if it had a broader coverage that potentially considered the top 50 routes. The dataset pertaining to air fares was designed to mainly captured information pertaining to 2019 to 2020, however it was noted that air fares were substantially higher in the full 12 month period of 2021 compared to earlier years when extracted from the Sabre database which would have changed the outcome of the air fare data if extrapolated into 2021. Lastly, it would add value to the overall academic literature if a network analysis was applied in lieu of the COVID-19 pandemic i.e., to assess shifts in the number of direct versus connecting flights and to observe the mediating effect of average fare differences, particularly as fear of disruption on premium connecting services may now be heightened as a result of the pandemic.

Author Contributions

Conceptualization, A.G., D.W.-S., J.F.O. and M.E.; Formal analysis, A.G., D.W.-S., J.F.O., M.E. and X.Z.; Writing—original draft, A.G., D.W.-S., J.F.O., M.E. and X.Z.; Writing—review & editing, A.G., D.W.-S., J.F.O., M.E. and X.Z. All authors have read and agreed to the published version of the manuscript.

Funding

This research received no external funding.

Institutional Review Board Statement

Not applicable.

Informed Consent Statement

Not applicable.

Data Availability Statement

OAG data is unavailable due to privacy.

Conflicts of Interest

The authors declare no conflict of interest.

Appendix A

Table A1. Airlines Names for Airline Codes.
Airline CodeAirline NameAirline CodeAirline Name
9CSpring Airlines FDThai AirAsia
AYFinnairHUHainan Airlines
BABritish AirwaysHXHong Kong Airlines
CAAir ChinaKEKorean Air
CIChina AirlinesLHLufthansa
CXCathay PacificMFXiamen Airlines
CZChina SouthernMUChina Eastern
EKEmiratesOZAsiana Airlines
Table A2. Airport Names for Airport Codes.
Airport CodeAirport NameAirport CodeAirport Name
AMSAmsterdamMUCMunich International Airport
BKKBangkokNRTTokyo Narita
CANGuangzhouPEKBeijing Capital
CDGParis Charles de Gaulle PVGShanghai Pudong
FRAFrankfurt InternationalSHAShanghai Hongqiao
HELHelsinki-VantaaSINSingapore
HKGHong Kong InternationalSVOMoscow Sheremetyevo
ICNSeoul IncheonSZXShenzhen
KIXOsakaTAOQingdao
LHRLondon Heathrow TPETaipei
MNLManila

References

  1. Corbet, S.; O’Connell, J.F.; Efthymiou, M.; Guiomard, C.; Lucey, B. The impact of terrorism on European tourism. Ann. Tour. Res. 2019, 75, 1–17. [Google Scholar] [CrossRef]
  2. Liu, A.; Kim, Y.R.; O’Connell, J.F. COVID-19 and the aviation industry: The interrelationship between the spread of the COVID-19 pandemic and the frequency of flights on the EU market. Ann. Tour. Res. 2021, 91, 103298. [Google Scholar] [CrossRef]
  3. WHO. WHO Coronavirus (COVID-19) Dashboard. 2021. Available online: https://covid19.who.int/ (accessed on 19 November 2021).
  4. Warnock-Smith, D.; Graham, A.; O’Connell, J.F.; Efthymiou, M. Impact of COVID-19 on air transport passenger markets: Examining evidence from the Chinese market. J. Air Transp. Manag. 2021, 94, 102085. [Google Scholar] [CrossRef] [PubMed]
  5. Li, S.; Zhou, Y.; Kundu, T.; Sheu, J.-B. Spatiotemporal variation of the worldwide air transportation network induced by COVID-19 pandemic in 2020. Transp. Policy 2021, 111, 168–184. [Google Scholar] [CrossRef]
  6. Andreana, G.; Gualini, A.; Martini, G.; Porta, F.; Scotti, D. The disruptive impact of COVID-19 on air transportation: An ITS econometric analysis. Res. Transp. Econ. 2021, 90, 101042. [Google Scholar] [CrossRef]
  7. Sun, X.; Wandelt, S.; Zheng, C.; Zhang, A. COVID-19 pandemic and air transportation: Successfully navigating the paper hurricane. J. Air Transp. Manag. 2021, 94, 102062. [Google Scholar] [CrossRef]
  8. Zhang, Q.; Tong, Q. The economic impacts of traffic consumption during the COVID-19 pandemic in China: A CGE analysis. Transp. Policy 2021, 114, 330–337. [Google Scholar] [CrossRef]
  9. Zhang, J.; Zhang, R.; Ding, H.; Li, S.; Liu, R.; Ma, S.; Zhai, B.; Kashima, S.; Hayashi, Y. Effects of transport-related COVID-19 policy measures: A case study of six developed countries. Transp. Policy 2021, 110, 37–57. [Google Scholar] [CrossRef]
  10. Zhang, L.; Yang, H.; Wang, K.; Bian, L.; Zhang, X. The impact of COVID-19 on airline passenger travel behavior: An exploratory analysis on the Chinese aviation market. J. Air Transp. Manag. 2021, 95, 102084. [Google Scholar] [CrossRef]
  11. Cui, Q.; He, L.; Liu, Y.; Zheng, Y.; Wei, W.; Yang, B.; Zhou, M. The impacts of COVID-19 pandemic on China’s transport sectors based on the CGE model coupled with a decomposition analysis approach. Transp. Policy 2021, 103, 103–115. [Google Scholar] [CrossRef]
  12. Li, Y.; Wang, J.; Huang, J.; Chen, Z. Impact of COVID-19 on domestic air transportation in China. Transp. Policy 2022, 122, 95–103. [Google Scholar] [CrossRef]
  13. Kim, M.; Sohn, J. Passenger, airline, and policy responses to the COVID-19 crisis: The case of South Korea. J. Air Transp. Manag. 2021, 98, 102144. [Google Scholar] [CrossRef] [PubMed]
  14. Abate, M.; Christidis, P.; Purwanto, A.J. Government support to airlines in the aftermath of the COVID-19 pandemic. J. Air Transp. Manag. 2020, 89, 101931. [Google Scholar] [CrossRef] [PubMed]
  15. Zhu, C.; Wu, J.; Liu, M.; Wang, L.; Li, D.; Kouvelas, A. Recovery preparedness of global air transport influenced by COVID-19 pandemic: Policy intervention analysis. Transp. Policy 2021, 106, 54–63. [Google Scholar] [CrossRef]
  16. Dube, K.; Nhamo, G.; Chikodzi, D. COVID-19 pandemic and prospects for recovery of the global aviation industry. J. Air Transp. Manag. 2021, 92, 102022. [Google Scholar] [CrossRef] [PubMed]
  17. Hou, M.; Wang, K.; Yang, H. Hub airport slot Re-allocation and subsidy policy to speed up air traffic recovery amid COVID-19 pandemic—Case on the Chinese airline market. J. Air Transp. Manag. 2021, 93, 102047. [Google Scholar] [CrossRef] [PubMed]
  18. Li, S.; Zhou, Y.; Kundu, T.; Zhang, F. Impact of entry restriction policies on international air transport connectivity during COVID-19 pandemic. Transp. Res. Part E Logist. Transp. Rev. 2021, 152, 102411. [Google Scholar] [CrossRef]
  19. Czerny, A.I.; Fu, X.; Lei, Z.; Oum, T.H. Post pandemic aviation market recovery: Experience and lessons from China. J. Air Transp. Manag. 2021, 90, 101971. [Google Scholar] [CrossRef]
  20. Meng, F.; Gong, W.; Liang, J.; Li, X.; Zeng, Y.; Yang, L. Impact of different control policies for COVID-19 outbreak on the air transportation industry: A comparison between China, the U.S. and Singapore. PLoS ONE 2021, 16, e0248361. [Google Scholar] [CrossRef]
  21. Sun, X.; Wandelt, S.; Fricke, H.; Rosenow, J. The Impact of COVID-19 on Air Transportation Network in the United States, Europe, and China. Sustainability 2021, 13, 9656. [Google Scholar] [CrossRef]
  22. ICAO. Effects of Novel Coronavirus (COVID-19) on Civil Aviation: Economic Impact Analysis. 14 October 2021. Available online: https://www.icao.int/sustainability/Documents/COVID-19/ICAO%20COVID%202021%2010%2014%20Economic%20Impact%20TH%20Toru.pdf (accessed on 16 October 2021).
  23. Yu, M.; Chen, Z. The effect of aviation responses to the control of imported COVID-19 cases. J. Air Transp. Manag. 2021, 97, 102140. [Google Scholar] [CrossRef] [PubMed]
  24. UNWTO. COVID-19 Related Travel Restrictions: A Global Review for Tourism—Second Report as of 28 April 2020. 2020. Available online: https://webunwto.s3.eu-west-1.amazonaws.com/s3fs-public/2020-04/TravelRestrictions%20-%2028%20April.pdf (accessed on 6 May 2020).
  25. EC. A Common Approach to Travel Measures in the EU. 2021. Available online: https://ec.europa.eu/info/live-work-travel-eu/coronavirus-response/travel-during-coronavirus-pandemic/common-approach-travel-measures-eu_en (accessed on 16 October 2021).
  26. Sun, X.; Wandelt, S.; Zhang, A. Vaccination passports: Challenges for a future of air transportation. Transp. Policy 2021, 110, 394–401. [Google Scholar] [CrossRef]
  27. OECD. COVID-19 and the Aviation Industry: Impact and Policy Responses; OECD: Paris, France, 2020; Available online: https://read.oecd-ilibrary.org/view/?ref=137_137248-fyhl0sbu89&title=COVID-19-and-the-aviation-industry&_ga=2.12154036.1837380444.1634407361-664077514.1634407361 (accessed on 16 October 2021).
  28. Corbet, S.; Efthymiou, M.; Lucey, B.; O’Connell, J.F. When lightning strikes twice: The tragedy-induced demise and attempted corporate resuscitation of Malaysia airlines. Ann. Tour. Res. 2021, 87, 103109. [Google Scholar] [CrossRef]
  29. IATA Economics. COVID-19 Airline Industry Outlook. 4 October 2021. Available online: https://www.iata.org/en/iata-repository/publications/economic-reports/airline-industry-economic-performance---october-2021---presentation/ (accessed on 16 October 2021).
  30. Zhang, Y.; Zhang, A. COVID-19 and bailout policy: The case of Virgin Australia. Transp. Policy 2021, 114, 174–181. [Google Scholar] [CrossRef] [PubMed]
  31. Hospitalitynet. Despite domestic travel deterrents, Chinese New Year tourism to continue, says Global Data. 11 February 2021. Available online: https://www.hospitalitynet.org/news/4102954.html (accessed on 5 November 2021).
  32. Flightglobal. China Launches Funding Scheme to Keep Services Flying Through Coronavirus. 2020. Available online: https://www.flightglobal.com/airlines/china-announces-measures-to-give-aviation-industry-fillip/137179.article (accessed on 28 May 2020).
  33. Boseley, S. Test and Trace: Lessons from Hong Kong on Avoiding a Coronavirus Lockdown. 2020. Available online: https://www.theguardian.com/world/2020/apr/17/test-trace-lessons-hong-kong-avoiding-coronavirus-lockdown (accessed on 25 May 2020).
  34. Hiney, N.; Efthymiou, M.; Morgenroth, E. Regional airport business models: The Shannon Group as a case study. In Air Transport and Regional Development Case Studies; Graham, A., Adler, N., Niemeier, H.-M., Betancor, O., Antunes, A.P., Bilotkach, V., Calderón, E.J., Martini, G., Eds.; Taylor and Francis: Oxfordshire, UK, 2021. [Google Scholar]
  35. Chinanews. 180,000 Yuan! Why Is a Flight Back to China So Expensive? Chinanews. 17 March 2020. Available online: https://www.chinanews.com.cn/cj/2020/03-17/9128156.shtml (accessed on 15 March 2022).
  36. Wang, J.; Guo, Y. Airfare Hikes, Shortages, and International Students Waiting to Go to the U.S., Travel Daily. 7 July 2021. Available online: https://www.traveldaily.cn/article/146571 (accessed on 25 March 2022).
  37. The Government of the Hong Kong Special Administrative Region. Comprehensive Tightening of Inbound Control Measures to Prevent Spreading of Omicron Cases to Community, Press Release. 20 December 2021. Available online: https://www.info.gov.hk/gia/general/202112/20/P2021122000964.htm (accessed on 1 April 2022).
  38. The Government of the Hong Kong Special Administrative Region. Government Adjusts Boarding, Quarantine and Testing Arrangements for Inbound Travellers on Risk-Based Principle, Press Release. 27 March 2022. Available online: https://www.info.gov.hk/gia/general/202203/27/P2022032700005.htm (accessed on 1 April 2022).
  39. CAAC. Data. 2021. Available online: http://www.caac.gov.cn/en/HYYJ/SJ/ (accessed on 4 November 2021).
  40. O’Connell, J.F.; Avellana, R.M.; Warnock-Smith, D.; Efthymiou, M. Evaluating drivers of profitability for airlines in Latin America: A case study of Copa Airlines. J. Air Transp. Manag. 2020, 84, 101727. [Google Scholar] [CrossRef]
  41. Allen, M. Analysis: Hong Kong Lags Singapore in Travel Re-Opening, Cirium News. 2021. Available online: https://dashboard.cirium.com/app/#/articles/475204?context=relatedarticles (accessed on 17 November 2021).
  42. CNBC. Lufthansa and German Government Agree on $9.8 Billion Rescue Package. 25 May 2020. Available online: https://www.cnbc.com/2020/05/25/lufthansa-and-german-government-agree-9point8-billion-rescue-package.html (accessed on 16 November 2021).
Figure 1. Fused Flights by Airline (14 June 2020–25 March 2022). Note: only airlines with 5 or more fused flights are shown.
Sustainability 15 01525 g001
Figure 2. Overall trend 19 January to 21 June in Europe-China seats, passengers and total revenues. Sources: Sabre & OAG (notes: seats/traffic is reported birectional, Revenues reported on secondary axis).
Sustainability 15 01525 g002
Figure 3. Overall trend 19 January to 21 June in Rest of Asia-China seats, passengers and total revenues. Sources: Sabre & OAG (notes: seats/traffic is reported birectional, Revenues report on secondary axis).
Sustainability 15 01525 g003
Figure 4. Overall trend 19 January to 21 June in North America-China seats, passengers and total revenues. Sources: Sabre & OAG (notes: seats/traffic is reported birectional, Revenues report on secondary axis).
Sustainability 15 01525 g004
Figure 5. Overall June 2021 vs. June 2019 difference in falls on three major Chinese international markets between premium and economy traffic and revenues Source: Sabre.
Sustainability 15 01525 g005
Figure 6. Top 10 carriers total revenues and average fares 2020 and 2019 on North America, ROA and Europe to China markets.
Sustainability 15 01525 g006
Figure 7. Top 10 carriers percentage shift in premium and economy revenues as a percentage of total revenues.
Sustainability 15 01525 g007
Figure 8. Top 10 routes total revenues and average fares 2019 and 2020 on North America, ROA and Europe to China markets.
Sustainability 15 01525 g008
Table 1. Financial aid made available to airlines due to COVID-19, by type (USD billions).
Financial Aid Amount in USD bn
Wage subsidies81
Loans73
Direct aid (cash injections, equity financing)38
Loan guarantees26
Ticket taxes13
Corporate taxes12
Fuel taxes1
Blocked funds0
Total 243
Source: IATA Economics, 4 October 2021.
Table 2. Chinese International Aviation Policies related to COVID-19.
Issue TimePolicy Title
12 March 2020International Flight Schedule Information (No. 5)There were 2072 weekly flights, flying by 77 airlines (both passenger and cargo), allowed for 506 routes between China and 49 countries during 16–22 March 2020
19 March 2020 (void on 26 March 2020)Announcement on Controlling the Number of International Passenger Flights during the Epidemic Prevention and ControlTo control the number of flights they can only decrease and not increase
22 March 2020The First Entry Point for International Flights Destined for BeijingAll passenger flights destined to Beijing must enter in the designated first entry points (10 airports selected for named airlines)
23 March 2020International Flight Schedule Information (No. 6)There were 2003 weekly flights, flying by 75 airlines (both passenger and cargo), allowed for 477 routes between China and 49 countries during 23–29 March 2020
26 March 2020 (void on 04 June 2020)Announcement on the Continued Reduction of International Passenger Flights during the Epidemic Prevention and ControlChinese airlines are only allowed to maintain one route to any specific country with no more than one flight per week; each foreign airline is only allowed to maintain one route to China with no more than one weekly flight (the five one policy) and for epidemic prevention and control load factors may not be higher than 75%
3April 2020Notice on the Establishment of a ‘Green Channel’ for Approval of International Air Cargo during the Epidemic Prevention and ControlEstablishes a temporary green channel to promote the planning of international cargo flights and to shorten the processing time
25 May 2020Notice on the Establishment of a ‘Green Channel’ for the Approval of the International Passenger Charter Plan for the Resumption of Production and WorkEstablishes a temporary green channel to promote the planning of international passenger charter flights and to shorten the processing time
4 June 2020Notice on the Adjustment of International Passenger Flights by CAACMaintains the five one policy. Introduces flight incentives and circuit breaking ‘fusing’ measures
16 July 2020List of AirPort Cities with Capability to Accommodate International Passenger FlightsLists 37 cities
1 September 2020The Further Implementation of Strict Management on International Passenger Flights with High RisksLoad factors may not be higher than 75% on three types of high risk international inbound passenger flights
2 September 2020Passenger Flights to Beijing that are Diverted to the First Point of Entry will Gradually Resume Direct FlightsAllows flights from 17 countries to resume direct flights to Beijing
16 December 2020 (void on 28 April 2021)Notice on Adjusting ‘Fusing’ Measures for International Passenger FlightsIntroduces changes to the fusing measures
16 December 2020Notice on Regulating International Scheduled Passenger Flight Plans during the Normalization of the COVID-19 Epidemic Prevention and Control PeriodRelates to strengthening airline management (pandemic prevention/control, flight operations and changes) and implementing information reporting (changes, cancellations)
28 April 2021Notice on the Adjustment of ‘Fusing’ Measures for International Scheduled Passenger FlightsIntroduces further changes to the fusing measures
Source: Compiled by the authors from the CAAC website (http://www.caac.gov.cn, accessed on 25 March 2022.).
Table 3. Top 10 carriers on Europe, Rest of Asia and North America to China markets (by O&D traffic).
Europe to ChinaRest of Asia to ChinaNorth America to China
Carrier IATA CodeTotal O&D pax 2019Total O&D pax 2020Total O&D pax H1 2021Carrier IATA CodeTotal O&D pax 2019Total O&D pax 2020Total O&D pax H1 2021Carrier IATA CodeTotal O&D pax 2019Total O&D pax 2020Total O&D pax H1 2021
CA2,849,205629,32353,267CZ10,459,4661,330,444115,068UA1,859,726252,21551,093
SU1,690,955319,89316,131MU10,010,7081,492,602164,646CA1,435,746240,76921,539
CX1,566,129441,78847,897CX8,461,4161,268,99273,883AC1,335,100225,99443,535
LH1,414,686251,59369,762CA7,256,5811,096,28681,902CX1,322,240363,45259,148
MU1,043,063263,62633,2989C5,097,1801,803,20945,669HU1,246,849181,66012,158
HU997,671129,71211,382KE4,688,789821,66766,760MU1,033,924258,08837,554
EK873,462136,8873,912OZ4,259,5831,751,66464,156DL1,019,382131,19347,200
CZ885,879176,91630,571FD3,135,577371,1760CZ946,442156,58245,965
AY808,118149,71024,573CI3,508,316440,60240,631AA779,966125,59725,874
BA755,668202,40333,432HX3,130,837509,81510,842MF249,13473,99627,537
Total top 1012,884,8352,701,852324,226 60,008,45110,886,456663,557 11,228,5082,009,547371,603
% of total62.663.649.5 46.649.433.8 88.869.987.4
Source: Sabre. Note: O&D traffic is bidirectional. See Table A1 of Appendix A for the corresponding full airlines names of carrier IATA Codes.
Table 4. Top 10 routes on Europe, Rest of Asia and North America to China markets (by O&D traffic).
Europe to ChinaRest of Asia to ChinaNorth America to China
RoutesTotal O&D pax 2019Total O&D pax 2020Total O&D pax H1 2021RoutesTotal O&D pax 2019Total O&D pax 2020Total O&D pax H1 2021RoutesTotal O&D pax 2019Total O&D pax 2020Total O&D pax H1 2021
HKG-LHR909,585342,32261,439HKG-TPE4,727,238622,57520,713HKG-SFO440,83895,25612,165
PEK-SVO286,41746,8281400HKG-BKK2,362,064391,43215,823PVG-LAX423,54592,0324177
PVG-FRA381,19473,27137,176HKG-MNL1,650,547302,59638,042HKG-LAX316,992139,86222,929
PVG-SVO201,33131,60613,548HKG-NRT1,669,475281,31716,524HKG-YVR314,02580,2505671
PEK-CDG252,96045,8454668HKG-SIN1,870,253288,11355,506PEK-YYZ308,96772,14811,622
PEK-FRA194,01224,3224536HKG-KIX1,683,495246,2807988PEK-LAX290,62964,5166770
PEK-MUC150,86613,359463PVG-ICN1,863,721643,31916,690HKG-YYZ286,64362,9606309
PEK-AMS108,70623,6722036TAO-ICN1,854,431350,66929,695PVG-YYZ247,77669,89022,962
HKG-HEL56,74720,5783471PVG-TPE1,528,416263,03561,176PVG-SFO246,56085,56647,507
HKG-MUC136,27614,913661PVG-SIN1,254,255214,88731,437CAN-JFK224,18346,517629
Total top 102,678,094636,716129,398 20,463,8942,981,647272,881 3,100,159808,997140,740
% of total13.015.019.7 15.913.513.9 24.528.233.1
Source: Sabre. Note: O&D traffic is bidirectional. See Table A2 of Appendix A for the corresponding full airport names of IATA airport Codes.
Table 5. Multiple regression outputs: Seat capacity on Europe, NA and ROA to China (excluding HK).
Europe-ChinaNA-ChinaROA-China
R Square0.920.540.89
Intercept* 2,436,628* 1,367,260* 11,120,258
Av fare* −1345** −3862131
Average GDP growth (compared to previous quarter)* 123,181* 33,032** 379,956
Five/one policy* −1,139,498* −474,881* −11,326,426
Notes: * Significant at the 1% level; ** Significant at the 5% level; n = 30 months (19 January–21 June). Data sources: Seat capacity (OAG), Average fares (Sabre), GDP growth (National Bereau of Statistics of China, Eurostat, Statistics and Trading Economics), Five/one policy (CAAC.)
Disclaimer/Publisher’s Note: The statements, opinions and data contained in all publications are solely those of the individual author(s) and contributor(s) and not of MDPI and/or the editor(s). MDPI and/or the editor(s) disclaim responsibility for any injury to people or property resulting from any ideas, methods, instructions or products referred to in the content.

