Article

EU Citizens’ Twitter Discussions of the 2022–23 Energy Crisis: A Content and Sentiment Analysis on the Verge of a Daunting Winter

by
Vasiliki Vrana
1,*,
Dimitrios Kydros
2,*,
Iordanis Kotzaivazoglou
1 and
Ioanna Pechlivanaki
1
1
Department of Business Administration, School of Economics and Administration, Campus of Serres, International Hellenic University, 62124 Serres, Greece
2
Department of Economic Sciences, School of Economics and Administration, Campus of Serres, International Hellenic University, 62124 Serres, Greece
*
Authors to whom correspondence should be addressed.
Sustainability 2023, 15(2), 1322; https://doi.org/10.3390/su15021322
Submission received: 21 November 2022 / Revised: 22 December 2022 / Accepted: 30 December 2022 / Published: 10 January 2023

Abstract

:
The 2022–2023 winter period is alleged to be one of the toughest since World War II with respect to energy, especially electricity, natural gas and oil. The paper investigates the public discussions on Twitter in five widely spoken European languages and English. Networks of users are formed in order to locate possible important nodes that control the distribution of information. The networks are rather sparse and do not belong to the general class of ‘small worlds’. The communities of users seem to gather around one user; however, users also interact with others within the groups. Regarding the users’ sentiments, the negatives are definitely higher than the positive ones. Sentiments appear to be stable in their scores during the examined period and for each language; fear and sadness are dominant among them. Energy prices are frequently discussed in all languages, along with major political events. Findings may help governments to better understand public views and develop an effective strategy to communicate with and protect EU citizens.

1. Introduction

Energy is a continuous driving power for social evolution, quality of life, technological development and the sustainability of society [1]. The energy market is complex, based on a multitude of factors, such as energy resources, investments, infrastructure, transportation, technology, environment, policies, knowledge and culture [2]. Each country has its own dependencies on gas and electricity, and these factors should be balanced in a very delicate way in order for global sustainable goals to be achieved. Thus, the case of each country is unique due to the combination of such factors, and, therefore, every case results in a different outcome, and some are more successful than others [1].
Human activities of all kinds will not progress without energy sources, which are essential and vital ingredients in all human transactions [3]. Energy sources are limited, and population growth creates extra pressure and additional energy demands [3]. Although fossil fuel use has been criticized for decades, countries continue to use oil, gas and coal as the major sources of energy [4]. Renewable energy sources, such as wind, solar, wave power, geothermal, biomass and waste, are crucial for meeting a large percentage of the world’s energy needs and are essential for creating wealth in the long run [5,6].
Today’s Russian invasion of Ukraine has caused a disruption in the global energy market. EU countries, which import about 90% of their natural gas, recognized the emergency and transformed Europe’s energy system by both ending its dependence on Russian fossil fuels gradually and tackling the climate crisis [7]. Analysts believe that Europe will have trouble finding oil and gas well after the coming winter, since the Ukraine war is expected to lead to a reduced energy supply from Russia to the EU countries [8]. Natural gas is now trading at a price more than six times higher than its last year’s prices. The rising cost of living has put an additional strain on EU citizens who have been already affected by the COVID-19 pandemic [9]. Acknowledging that spikes in bill payments may be inevitable [10], the European Union has urged member states to provide relief funds [9] in an effort to minimize the impact on consumers. It is incumbent upon anyone involved in the current crisis to think forward as a way to prevent further aggravation of the crisis and transform systems to withstand shocks in the future [4]. As the EU Commission Executive Vice-President Frans Timmermans stated: ‘the quicker we increase our renewable energy sources, the quicker we can protect our citizens against price hikes in the traditional energy area’ [9].
The current energy crisis is unfolding in the era of media globalization and the dominance of the Internet and mobile communications, where millions of people have access to a large amount of information [11] and are able to share beliefs and emotions widely through social networking sites [12]. Of these, Twitter is one of the leading sites, with more than 206 million daily active users [13] who instantly share information through it [14], engage massively online in real time [15], connect with each other [16] and share their feelings [17]. Despite the multiple benefits of Twitter in daily life and situations of crisis, no study appears to have been conducted on investigating the discussions of the energy crisis. The paper aims to fill this gap by exploring the networks of Twitter users discussing the energy crisis, locating possible opinion leaders and analyzing the textual content of Twitter comments to obtain information about people’s feelings about the upcoming energy crisis. In order to meet this aim, the following groups of research questions are framed:
  • What types of users are present? Are there any suspicious accounts? Which seem to be the most important Twitter accounts?
  • Which are the major sentiments in each language? What is the trend of sentiment during the examined period?
  • Which are the most common discussions? Are there any similarities or differences between nations?
The research focuses on EU countries. However, since the EU has 24 official languages, it is extremely difficult to conduct research in such a multilingual environment, and five widespread languages are chosen, namely, German, Spanish, French, Italian and Polish. According to official data, the population which communicates in these languages covers more than 300 million out of approximately 450 million EU inhabitants [18]. Furthermore, despite the fact that the UK does not belong to the EU anymore, English is also chosen, since it is widely used by EU citizens. The key phrases EU and energy crisis (en), UE and Crisis de energia (esp), UE and Crise de l’energie (fr), EU and Energiekrise (de), Unione Europea & Crisi energetica (it) and EU and Kryzys energetyczny (pol) are chosen, since an extensive list of keywords might give many results which may overlap to a certain degree. The keyword EU is used to filter the tweets from EU citizens’ regarding the 2022–23 energy crisis, as an extremely small percentage offers geolocation information. Due to this fact, the German network may include tweets from Austria or even German-speaking Switzerland. The same may also happen in other languages, such as Spanish; however, the keywords used restrict the collection of tweets to those discussing the EU energy crisis.
The paper is structured as follow: In the next section, the energy crisis is discussed in terms of renewable energy and the 2022 crisis. The previous relevant research about social media is also provided. In Section 3, the methods and data used are presented. Section 4 provides the main analysis on network formation and identification of the most important users, common discussions and trends of sentiment. The last section presents conclusions, implications, limitations of the research and possible future threads of research.

2. Energy Crisis

2.1. Energy Crisis and Renewable Energy

“Energy is everywhere and drives everything,” claim Coyle and Simmons [19], p. 1. To sustain civilization, it is essential to have a secure and abundant supply of energy [20]. The existing power systems are mainly dependent on petroleum, coal, natural gas, power plants and nuclear energy. However, these non-renewable energy sources are limited [21]. The increase in global energy demand, the continued reliance on fossil fuels for energy production and transportation and the rising world population have all contributed to an energy crisis on Earth [21]. The excessive use of fossil fuels has also resulted in an increase in carbon dioxide emissions, an increase in average global temperature and significant climate change [19,21]. The overall balance of the environment is affected by air pollution [22]. Globally, fossil fuels contribute approximately 60% of greenhouse gas emissions, and nearly 90% of all carbon dioxide emissions, causing climate change and providing approximately 80% of global energy and 66% of electrical generation [23,24]. Greenhouse gas concentrations, ocean heat, sea level rise and ocean acidification all set new records in 2021. This is another clear sign of how human activities are affecting land, oceans and the atmosphere on a global scale with long-term consequences [24].
Energy efficiency initiatives, policies, directives and legislation aiming at reducing emissions and protecting the environment have been adopted by EU, USA and the rest of the biggest economies, including the largest consumers of fossil fuels, i.e., Russia, China, India and Brazil [25,26]. The current need to reduce dioxide emissions and protect the environment is focused on renewable energy sources such as hydroelectric, solar, tidal, wind, wave, waste, biomass and geothermal energy [27,28]. In view of the emerging global energy shortage, nuclear energy, previously undermined due to operational safety records, accidents such as that at the Fukushima Daiichi reactors in March 2011, production of radioactive waste materials and association with nuclear weaponry, can be reevaluated, as it is an ultra-concentrated source of energy [29,30].
Although many countries have already begun moving toward cleaner energy sources, renewable energy and energy efficiency technologies still need to compete with highly subsidized, carbon-intensive energy technologies, even with the rapid rate of technological innovation and cost reductions that have taken place in recent years [24]. Today, about 29% percent of electricity comes from renewable sources [31]. The United Nations Economic Commission for Europe reported that, since 1990, renewable energy has grown from a mere 7.0% share of energy consumption to 17.9% in 2000, 19.2% in 2010 and 18.2% in 2019 [32]. It would be possible to deploy renewable energy technologies more rapidly if energy policy facilitated more finance for renewable energy projects while addressing the subsidies and impacts of fossil fuels [24].

2.2. The 2022–23 Energy Crisis

The majority of the world’s inhabitants (80%) live in countries where fossil fuel imports are net. This means that 6 billion people need fossil fuels from other countries, making them vulnerable to geopolitical shocks [32]. Moriarty and Honnery [33,34] mentioned that it may become necessary for future energy exporters to limit output in order to gain political leverage or to extend the life of their reserves in order to increase export earnings or to ensure their own energy security. The Russian invasion of Ukraine in early 2022 confirmed this point of view; energy security is becoming increasingly important [32].
Governments across the world are currently dealing with an energy crisis brought on by rising gas and oil prices. Years of low prices have naturally depressed investment in fossil fuels, as has regulatory pressure on banks to reduce their exposure to brown industries. The Ukraine war, combined with a faster-than-expected recovery from the COVID-19 recession and slightly colder weather in the northern hemisphere, pushed prices to their highest levels of the decade [35]. By the end of July 2022, Russia reduced gas flows to Europe over the Nord Stream 1 pipeline to 20% capacity [36]. In September 2022, the Nord Stream 1 and Nord Stream 2 gas pipelines caught fire within hours of each other, bursting large leaks; there have been fears of deliberate sabotage [37]. In the winter of 2022–2023, Europe’s economy is expected to experience a setback as a result of the weaponization of gas deliveries, which has already led to energy shortages and high costs [36]. Natural gas prices surpassed $3100 per 1000 cubic meters in mid-August 2022, representing a 610% increase over the same period last year. Many power plants cannot afford to operate for long at this price. As a result of the increasing input fuel costs, benchmark electricity prices in Europe have risen nearly 300% in 2022, breaking consecutive records. Energy prices of this winter period are ten times higher than the previous five-year average [38]. Further supply restrictions seem to be inevitable, making the future very unpredictable [36].
High energy prices are wreaking havoc on European industry, forcing factories to cut production quickly and lay off tens of thousands of workers. The cuts, while expected to be temporary, have raised the prospect of a painful recession in Europe. Industrial production in the eurozone fell 2.3% in July from a year earlier, the largest drop in more than a couple of years [39]. As wholesale gas and electricity prices are constantly rising, data show that millions of Europeans are now spending a record proportion of their income on energy. Citizens in European countries are taking voluntary steps to reduce consumption of gas, fuel and electricity. Governments have raced to deliver aid, but statistics suggest that households have not seen much of a change as a result [40].
Germany is one of the countries that has suffered greatly as a result of its reliance on Russian gas. Robert Haback, Federal Minister for Economic Affairs and Climate Action, admitted that this was a strategic error and that the country is ready to fight the energy crisis and is looking to diversify its fossil fuel imports at breakneck speed—processes that used to take decades in the past are now taking months [41]. Ruhnau et al. [42] investigated the response of natural gas demand to rising prices using data from Germany and identified that consumers are trying to respond to the crisis by controlling temperature and electricity and gas consumption. For smaller consumers, such as households, a significant decline in demand of 6% from March onwards has been recorded, probably due to ethical and political considerations after the start of the Russian invasion of Ukraine. For industrial consumers, the slump in demand began much earlier, in August 2021, when the wholesale prices for natural gas began to rise, with an average increase of 11%.
According to estimations based on government statistics, the British are expected to spend an average of 10% of their family income this winter on gas, electricity and other heating fuels, as well as domestic vehicle fuels, primarily petrol and diesel. This is double what they spent in 2021 [40]. Energy costs—primarily gas and electricity costs—in an average Italian family increased from 3.5% in 2019 to 5% of the total household expenses by July 2022; the level in July was the highest since 1995. Compared to a year ago, the gas price in Turkey more than doubled in July, while the electricity price grew 67% [40]. In August 2022, the average price of electricity on the Spanish wholesale market reached a historic high of EUR 307.80 per megawatt hour (MWh), an increase of 19.3% in July [43]. In France, energy prices also hit all-time records in late August 2022. France’s electricity prices rose 25% to EUR 1130 per megawatt hour for the year ahead, marking the highest ever price. As the price of gas and electricity is rising, both public and private facilities are experiencing drastic increases in their operating costs [44]. Poland, in May, ceased importing coal from Russia, months before the EU as a whole imposed an embargo on 11 August due to Russian aggression. In spite of having its own coal industry, Poland has become increasingly reliant on Russian coal over recent years, since Russian coal is cheaper and of higher quality than domestic coal. In Poland, the vast majority of households are heated with coal, and this is the major reason why many Polish cities have topped the air pollution rankings in recent years [45]. The embargo displaced about 8 million tons of coal from the local market, causing prices to rise and fuel to become scarce. In June 2022, the regulations banning the lowest grade of coal were suspended [46].

2.3. The Energy Crisis through Social Media

Public discussions—which are one of the focal research points of this paper—are intensified by Internet-based platforms such as social media. Social media applications allow a growing number of people to communicate and interact with each other [47,48]. Moreover, social media can become quick and effective dissemination channels for important information [49]. Previous research investigated different aspects related to energy.
One of the first studies in the field was that of Gupta et al. [50], who studied Twitter messages about the nuclear energy policy in the USA. According to the research, advocacy organizations that have a policy preference often post messages on Twitter. The research indicated that messaging tactics differed in theoretically predicted ways; organizations that are members of winning coalitions employ social media narratives to limit the intensity of the dispute surrounding a particular topic.
Herrera et al. [51] investigated how investor sentiments affect predictions of returns and volatility for equities in the renewable energy sector. Results indicated that sentiment variables include important supplementary information that is not represented by traditional financial market indicators. Forecasts of returns and volatility for renewable energy companies were significantly improved by Twitter investor sentiment, particularly when deep learning methods were used. Wu et al. [52] tried to forecast oil price during the COVID-19 pandemic period using data from social media. Governments’ responses to the pandemic caused the oil markets to be volatile and greatly complicated oil market forecasts. The findings of the study indicate that information provided through social media contributes to the forecasting of the oil production, price and consumption. Marketers may benefit from the findings and take into account how social media information may affect the oil market or other related markets.
In a recent study, Kaur and Edalati [53] investigated Twitter users’ opinions about rising electricity prices in India and the United Kingdom. They compared different machine learning techniques for sentiment analysis, namely decision tree, naive Bayes, logistic regression and random forest and found that the logistic regression model achieves higher accuracy for sentiment classification in relation to electricity price compared to the other techniques.
In the context of sustainable energy, Wand et al. [54] tried to determine farmers’ intents to use biogas technology in Pakistan. Biogas technology satisfies the need for energy while conserving natural resources. Pakistan is an agricultural nation with significant potential for energy production using biogas technology. By using the extended norm activation model, they found that social media play a mediating role in farmers’ intentions to adopt biogas technology. Corbett and Savarimuthu [55] explored how social media analytics can be used to decipher the emotional discourse on renewable energy. They applied social media analytics to 6528 Twitter messages about 27 U.S. electricity utilities. They found that the emotional discourse varied based on utility, both in size and polarity, and they discovered four utility groups with similar emotional patterns. Joy and sadness were found to be the most common positive and negative emotions expressed. Utility followers negatively affected the emotional discourse.
The above review points out the importance of social media and particularly Twitter not only for communicating activities related to energy, but also for the way that the citizens perceive them. The studies also suggest the need for further research in the field concerning the role of social networking sites and specifically Twitter in informing the public and shaping its view on energy issues. During the period of the energy crisis, Twitter could become a very effective tool for public discussions among users, as well as a medium for expressing their opinions or sentiments related to their questions, fears or expectations. Therefore, the investigation of citizens’ discussions, views and feelings through Twitter could lead to useful conclusions and implications.

3. Methodology

In this paper we follow and expand the methodology steps followed in [17], which, in turn, relied on other references such as [12]. More specifically, the first step was the collection of relevant tweets. These tweets were subsequently filtered in order to keep only content-bearing ones. The next step was to formulate the networks of Twitter users that discussed our subject and examine these networks macroscopically and microscopically. We then continued with sentiment analysis, following well-established rules of the field and finished with the creation of networks of words (semantic networks) in order to clarify the actual content of the discussions.
In order to collect tweets relevant to our search phrases, NodeXL PRO (https://www.smrfoundation.org/nodexl/, accessed on 1 November 2021) was used [56], an Excel-based template that (among other procedures) can import tweets and create the corresponding tweeters’ social networks. The research was conducted in September 2022, traditionally a period of preparation for the forthcoming winter. In addition to this, the continuation of the Ukraine war further diminished the energy supply from Russia to the EU countries during this month. Due to limitations on time and the number of tweets derived from the Twitter API and NodeXL PRO, the data were collected on four different dates: on 6, 13, 21 and 28 September 2022, leaving a blank period of approximately seven days between the searches. Table 1 presents the volume of collected Tweets per language and date.
Not all tweets carry important messages. On the contrary, it is established that the ‘retweet’ button has played a disastrous role in the overall information circulation [57], since it does not carry any particular content. As shown in Table 2, only a small proportion of the total tweets carried authentic information (real content). In almost all languages, the proportion of real-content tweets was close to 25%, with the obvious exception of French and (to a smaller degree) Spanish, with 17% and 22% proportions, respectively. It looks like French people press the ‘retweet’ key more often than Italians or Germans, a result that might be interesting for further investigation from a sociological perspective.
In order to avoid unnecessary ‘noise’, all retweets and mentions in retweets were filtered out, and only tweets, replies to and mentions were kept in the subsequent results and discussion, a procedure commonly used in similar studies [17,58].
Following this preprocessing step, NodeXL PRO was used to create networks of interacting tweeters (users) for all languages and dates; users were represented as nodes, and two users were connected by a directed edge when a reply to or a mention tweet between these users was present in the dataset. Clusters of users were identified, and important users were located, together with discussion on their real-life status. The results, visualizations and discussions for these networks are presented in Section 4.1.
The present research continued by performing a sentiment analysis on the content-carrying tweets (this step actually expanded the methodology presented in [12,17]). To prepare the actual texts, spaCy (https://spacy.io/, accessed on 1 November 2022) was used, a Python library that facilitates natural language processing [59]. SpaCy provides tools for an extensive set of languages, including the ones used in this study. This library was utilized to remove stop words and produce lemmatized tokens, and a custom Python code was used to remove special characters (such as ‘@’) or web addresses, etc. For the actual sentiment analysis, the NRC emotion lexicon was used, assembled by Mohammad and Turney [60] at the National Research Council Canada. The results of the sentiment analysis are presented in Section 4.2.
Sentiment analysis calculates general feelings and tendencies in texts. However, to locate the exact content discussed on Twitter, the ‘word pairs’ approach was used [61,62], a methodology that utilizes the actual content of tweets and, after the removal of certain stop words, calculates the cardinality of adjacent words (word pairs) in texts. When every word is represented as a node, then each word pair corresponds to an edge between these two words. Thus, a new, semantic network is created that can be examined as a social network. In the present study, where multilingual datasets were investigated, we eliminated stop words using relevant listings [63], calculated word pairs through NodeXL PRO, dropped out word pairs with an occurrence frequency less than 10, translated all words (excluding names) in English and produced the corresponding semantic networks that are shown and discussed in Section 4.3.

4. Results

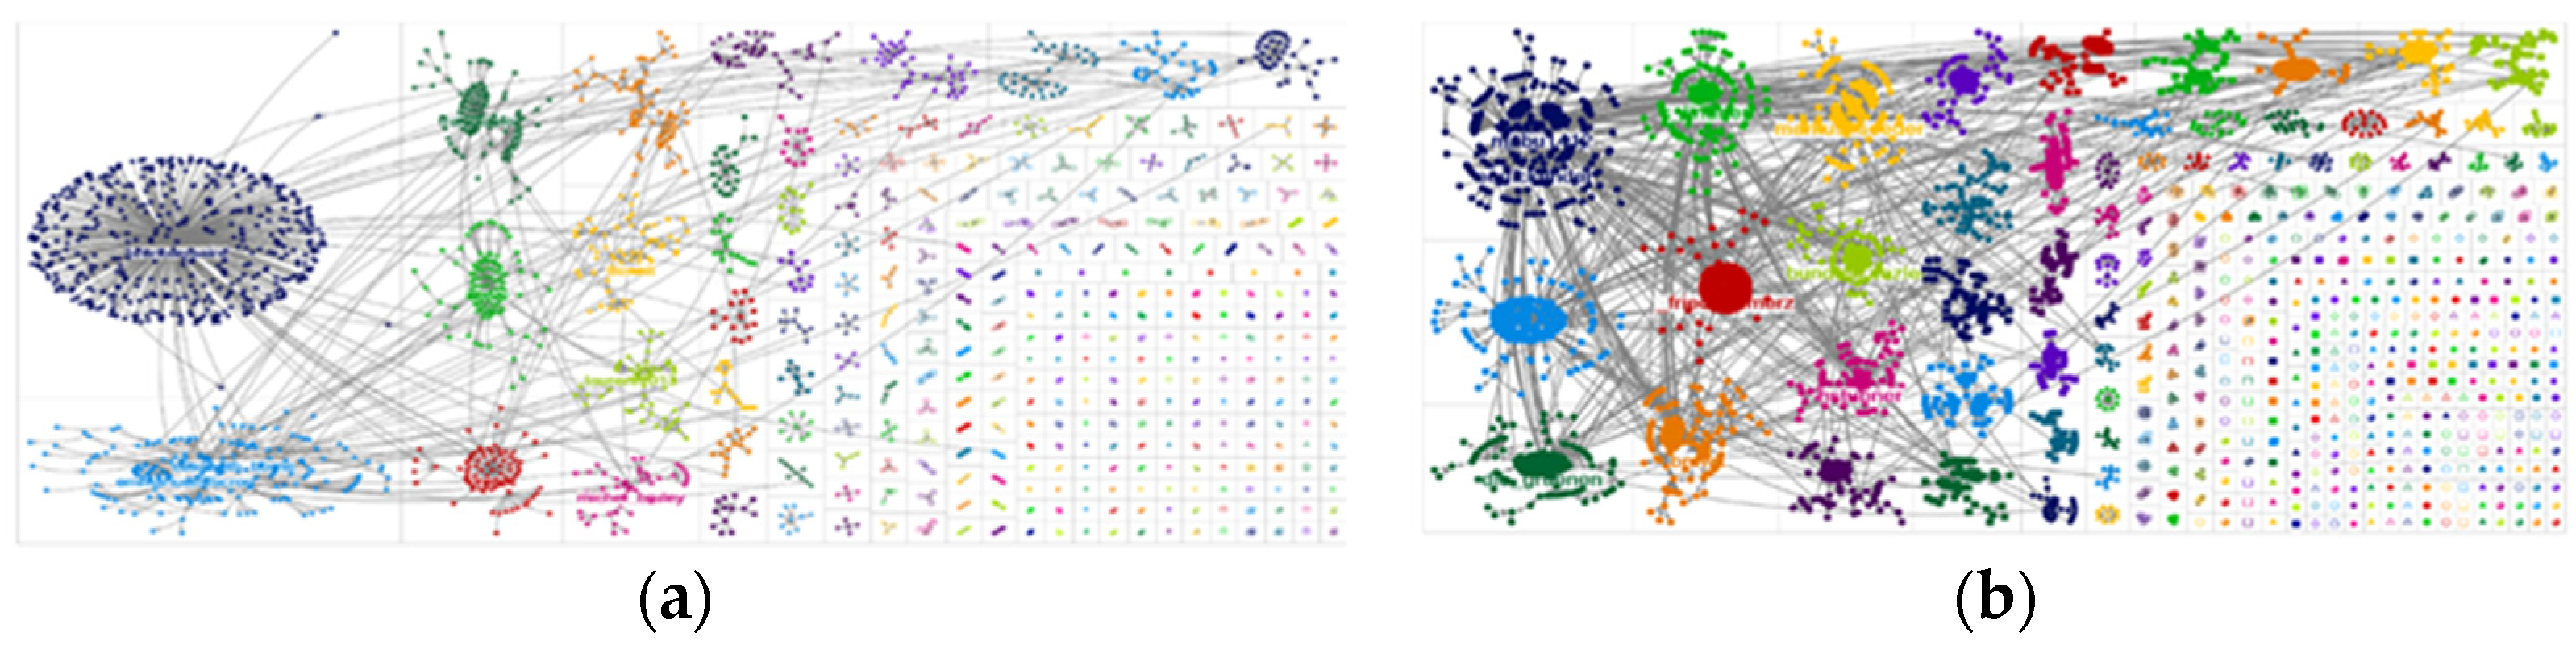
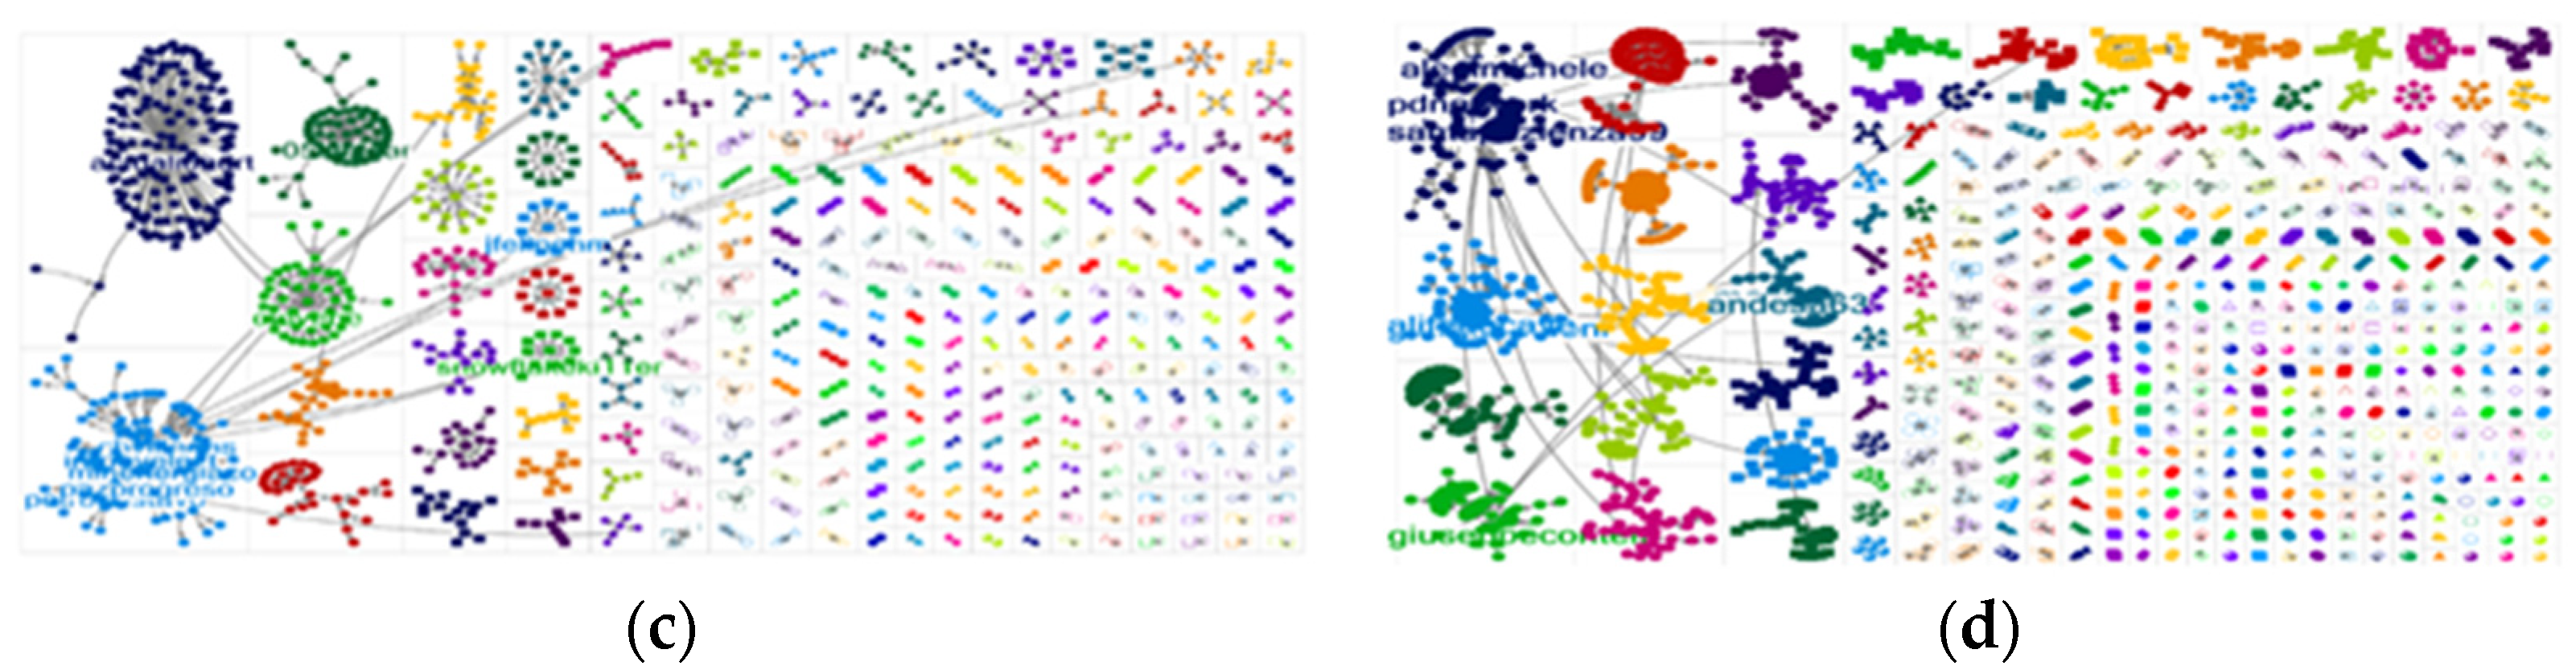
4.1. Networks of Users

4.1.1. Visualizations and Basic Metrics

Some useful insights were obtained by visualizing the users’ networks. We used NodeXL PRO to produce these visualizations for each language and date. All visualizations can be found in the Supplementary Material; however, we present four of them here, one for each date. The French, German, Spanish and Polish networks are shown in Figure 1. All rest visualizations can be found in the Supplementary Material.
In these pictures, we grouped together nodes according to the community they belong to. A community is a sub-network of the original network that contains nodes that interact to a higher degree between them than with other nodes outside of the community. Communities can be considered as a looser definition of cohesive groupings in networks and have been studied in the relevant literature [64]. All visualizations can be magnified to a certain degree.
What is interesting in such views is the fact that the networks are quite similar to each other: Some chunks (communities) of users seemed to gather around one user (who is the one who commenced the discussion with a tweet). Usually, everyone within a group pointed to the original tweet (a straight reply), although some (but not too extended) discussion was seen between users who responded to the original tweet (as in the top-left group of the German visualization or the bottom left of the Spanish one).
The users interacted with other groups, sometimes more often (German) and sometimes more sparsely (Spanish). This might be a hint that German users tend to engage in different discussions based on the same subject more often compared to Spanish users, for example, who stick to a specific tweet and discuss it thoroughly.
In Table 3, we present some basic metrics for all networks during the whole period examined. The table includes the number of nodes (i.e., the number of the Twitter users that created some content), the number of total edges (each edge shows a content-bearing discussion), the percentage of parallel edges (edges between the same nodes are parallel), the average geodesic distance (elsewhere found as the average shortest path), the average clustering coefficient (a metric within [0, 1] that shows the ability of a node to create dense neighborhoods) and the number of groups of users with more than 10 nodes, which exhibit group discussions instead of simple pairs (or small groups) of discussing users.
As seen in Table 3, the volumes of the networks were proportional to the population of each county, except in the case of the Italians, where the volume was elevated compared to the population. A plausible reason for this increased volume might be the Italian general elections held on 25 September 2022. The networks were rather sparse, since the proportion of the existing edges over the maximum possible number of edges (density) was quite small; in all cases it was computed to be close to 0.001%. This was an expected result, since there exists a vast number of tweets and not enough time for other users to comment or reply to many of them.
Parallel edges (i.e., connecting the same users) depict discussions between two users where several replies or comments are made, a somewhat prolonged discussion. In some languages, such as German and Italian, such discussions were quite frequent (almost one-third of edges are parallel), whereas, in Spanish and Polish, this proportion was close to 10%. This might imply that, in some countries, users engage in discussions as opposed to just sending a simple reply or comment.
The average shortest path and clustering coefficient columns of Table 3 were inspected simultaneously. In the vast majority of the cases, except for three Spanish cases, the average shortest path was higher than expected when compared with similar real-life networks. The corresponding clustering coefficient averages were extremely small, close to zero. This observation led to the suspicion that these networks do not belong to the general class of ‘small worlds’ [64], where a number of nodes create dense neighborhoods and act as hubs that connect many pairs of nodes with small geodesic distances. We tested all networks through NetworkX (https://networkx.org/, accessed on 21 August 2022) [65] omega calculation and verified that none of these networks is a small world.
A final interesting finding highlighted in Table 3 concerns the number of groups (communities) with a sufficient cardinality of at least ten users, a number arbitrarily chosen which, to our view, represents users engaged in major group discussions. The absolute numbers of such groups were directly proportional to the number of nodes in all networks. It seems that some Twitter users tend to form such groups, something already observed in Figure 1. However, an equal number of users are loners or engage in quite small groups, results that might be interesting from a sociological perspective.

4.1.2. Important Nodes

In this subsection, we focus on important users based on their betweenness centrality, which calculates the proportion of shortest paths passing through a node by the total number of shortest paths over all pairs of nodes. Nodes with high betweenness centrality promote discussions and create opportunities for deliberation among users. Such nodes control the distribution of information [66].
In Table 4, the ten most prominent nodes in all networks with respect to their betweenness centrality are presented. We also include a background chromatic code on their type: blue for simple users (persons, academicians, businesses or even movements), green for politicians (members of parliaments, ministries, parties, candidates, etc.) and brown for media/news persons or institutions (journalists, TV/news/radio agencies, etc.), identified after a by-hand process of visiting their actual accounts. The cells with the red background refer to ‘suspicious’ users with respect to the actual existence of the account, possible newly created accounts or false personal information. All ‘suspicious’ accounts fell into the simple user type and were located manually according to the above characteristics.
Table 4 contains real users’ names ranked according to their betweenness centrality and can be very intuitive both for native and international researchers who can most easily identify local important users. As an example, in the first column of Table 4, it is easy for the international audience to recognize users such as brunolemaire, emanuelmacron or elisabeth_borne (all politicians). However, users such as michel_bruley or 8enoit are also important; the reason for their importance is not quite clear to anyone who is not actually involved with French political and social life.
Feng et al. [67], who investigated suspicious accounts in social networks, identified 22.417 suspicious accounts among 237,628 accounts, a percentage of 9.2%. Twitter estimates that the percentage of bots is around 5% [68]. In their study, Varor et al. [69] proposed that between 9% and 15% of active Twitter accounts are bots. The stats are around 20% according to Botometer, a platform that checks bot followers [68]. In our case, in most languages and dates, none, one or at most two out of ten users were characterized as ‘suspicious’, a result that, to our view, means that such accounts do not pose an important danger in terms of distributing fake news or propaganda, since their presence in high-importance places in the networks is sparse. The Italian, English and Polish networks were the three less-infected networks for the whole investigated period. In the French and Spanish networks, four such nodes were identified.
Some interesting findings can be extracted from Figure 2. All three types of users were represented in most cases; however, this representation was neither analogous nor stable. Media were not present in all three cases, for example, in the Italian and Spanish networks in the third week and the Spanish network in the second week. Furthermore, minima were also present in the Italian case in the first and last week, in the Polish case in the second and the third week and in the second week of the German networks. Spain and Italy are both in the Mediterranean region, with lots of media-type users, so it is a surprise that the media sector was not so active within the observed period. In the Polish case, one can clearly see that, except from in the first week, the media were poorly represented in these highly ranked positions, a result that might raise questions; is this a result that proves that Twitter is not highly used by the Polish media sector or do the media have low degree of influence or even freedom of expression in this country? On the contrary, the media type was highly active in the French (first week), English, French and German (second week), French (third week) and French and German case (fourth week). Obviously, in these cases (especially in the French one), media were highly involved in discussions on the energy crisis.
With respect to the user type, no presence was only found in one case: the French one in the final week. The maximum values were present in the English networks during the first and the third week and in the Spanish network during the third week. On the contrary, the minimum values were found in the French and German networks during the third and the fourth week, respectively. In all other cases, the users were represented with values of about 30% to 40%. The dominance of the English networks in all weeks may be due to multilingual users, especially from the business sector, who prefer to tweet in English, since they may feel that, in this way, they can reach an extended audience; Twitter is Anglo-Saxon dominated after all [70].
The politician type was obviously extremely active in our results. In most cases they possess more than one-third of the top ten positions of Table 4, with minimum values in the English network in the second week and close-to-minimum values in the first and the third week. This result is probably connected to major local events that dominated local politicians’ talks, such as the death of Queen Elizabeth. Maximum values (70% and 60%) were located on the Italian networks, a result that shows that the energy crisis played a significant role in the Italian general elections of September 2022. It is also interesting that German politicians had a consistently high presence (40–50%) during the whole period, a result that shows the importance of the specific subject in political talks in Germany.

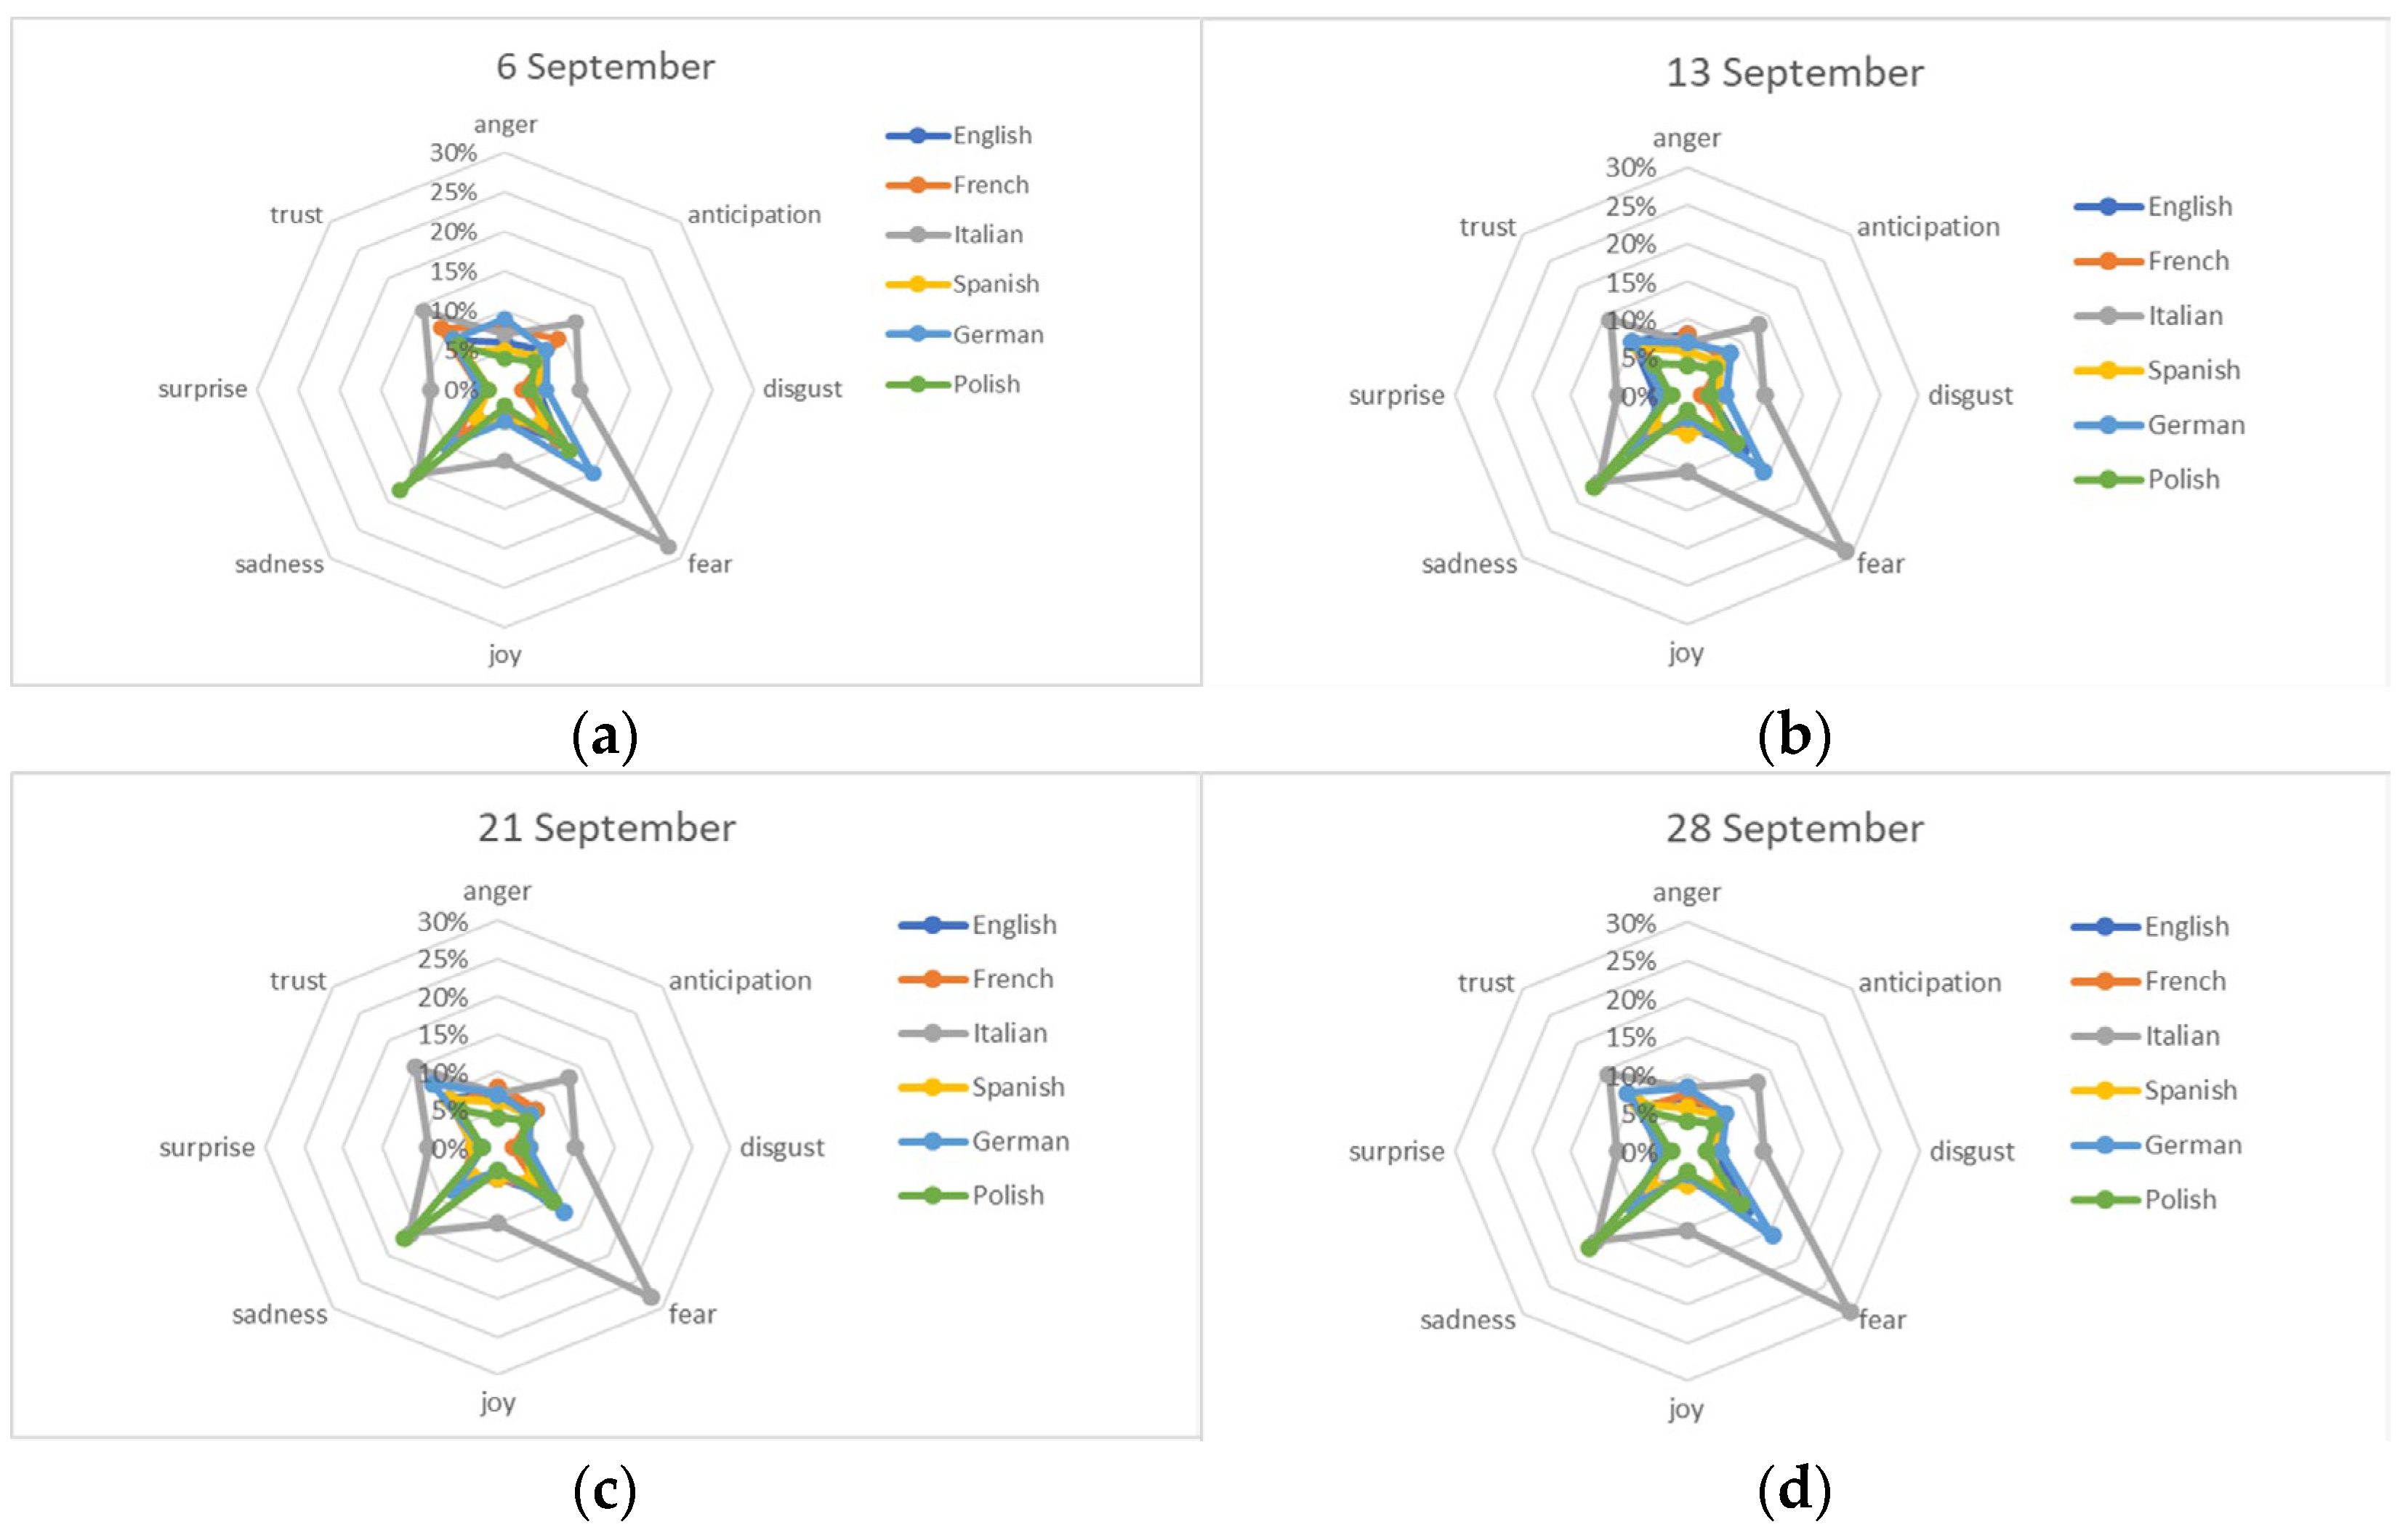
4.2. Sentiment Analysis

In Table 5, the calculated sentiments are presented for the examined period. All the percentages do not add up to 100%, since a word may convey more than one sentiment. For example, the word ‘crisis’ may convey the negative sentiments of anger, disgust and fear simultaneously.
According to the research findings, the negative sentiments were higher than the positive ones in all cases investigated. These results were similar among the examined languages, close to 25% in most languages and dates, except from French and, to a lesser degree, English, where the negative sentiments were almost twice the positive ones. This observation cannot be easily explained. In the French case, these negative sentiments may be connected to the larger percentage of the media user type in the most influential places of Table 4. It seems that the French media circulated such sentiments during September 2022. However, the English case, again, does not fit such an explanation. These negative, highly sentimental tweets that spread over the general English Twitter sphere may have been due to reasons other than the energy crisis, mainly Queen Elizabeth’s death or even the change of the UK Prime Minister.
As well as the examination of the generally positive/negative sentiments, another interesting result emanates from Table 4. In some languages, all specific sentiment scores were well below the threshold of 10%. This was clearly observed in the Spanish and, to a lesser degree, in the English case. In all the other languages, scores higher than 10% were recorded for one or two sentiments for every examined period. For the Spanish case, this result can be attributed to the government’s decision to withdraw from the common energy politics of the EU, because Spain is not interconnected to the rest of Europe through gas pipes (a similar decision was also taken by the government of Portugal). This political decision seems to have been highly appreciated by the Spanish citizens. The English case, however, cannot be explained in a similar way. Despite the fact that the general sentiment was highly negative, English-speaking users seem to have had a rather mild, even cool, approach in every recorded sentiment; this may be attributed to the general character of the English-speaking population.
Another general observation is that the expressed sentiments appeared to be stable for each language and all through the examined period. None or only small fluctuations were recorded.
Figure 3 includes all sentiments per language and time period using spider-like charts and, excluding the two first rows (i.e., positive and negative sentiments), this allows a better in-depth investigation of specific sentiments.
The charts shown in Figure 3 reveal another interesting result: Italians’ sentiments were so enhanced that they circle all other languages’ sentiments, except for sadness, where the Polish ranked first (closely followed by the Italians). Fear and sadness dominated the Italians’ Twitter regarding the energy crisis. This result could be related to the Italian general elections of 25 September 2022, the pre-election period and their outcome. The energy crisis was extensively discussed on Twitter (a result already presented in Table 1) but in a way that conveyed fear and sadness, two very negative sentiments. The reason for this cannot be clearly explained given the fact that, during the pre-election period, all polls were showing that a far-right schema would take over the government, a forecast that came true. However, the causes of fear and sadness are difficult to explain; were they a result of a pre-election populist rhetoric from the right-wing parties or did the fear and sadness come from the fact that the Italian society was shifting towards the far right? Such a question can be answered through content analysis (see the next section) and a close inspection of the dominant tweeters in this country.
The Poles’ sadness was also striking through the entire period, but the rest of the sentiments were expressed calmly, with low scores. Polish people were suffering to an extended degree during the examined period, not only due to the country’s lack of gas or oil production, but also because of its proximity to the war scene. However, no sentiments of fear or disgust were recorded.
Another interesting finding is that the dominant sentiment for the Germans was fear. This may be mainly the result of the high dependence of the country on Russian gas, as well as the sabotage on Nord Stream I and II in late September, which seemed to elevate this sentiment.
Trust was another sentiment also present in almost all cases and on all dates, even though it had no high scores. The EU citizens seem to continue, to a certain degree, to keep their hopes up and trust their governmental and EU policies regarding the energy crisis. The low percentage of trust of the Spanish people is a surprising exception, since the government of the specific country seems, as already stated above, to have found policies to diminish the consequences of the problem compared to the majority of the rest of the EU countries.

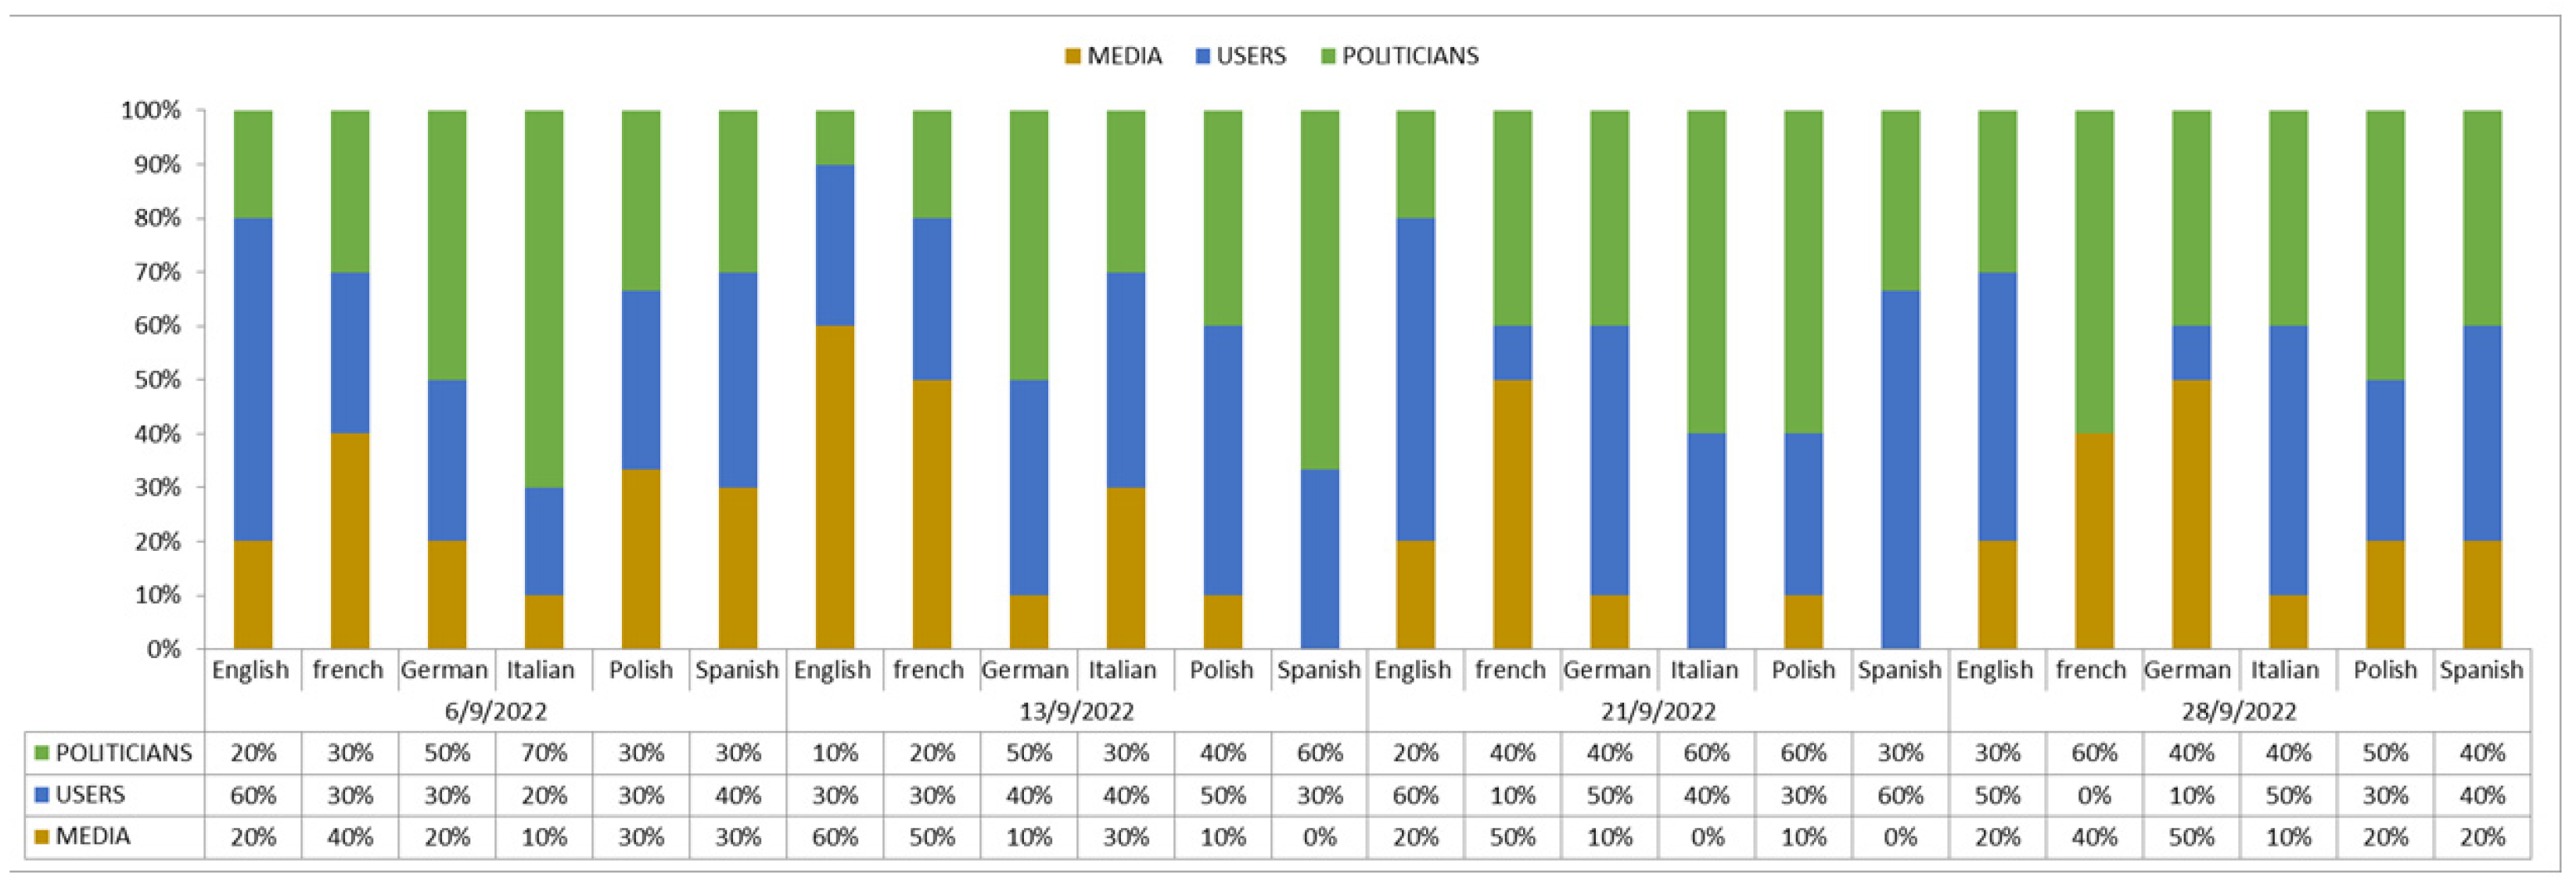
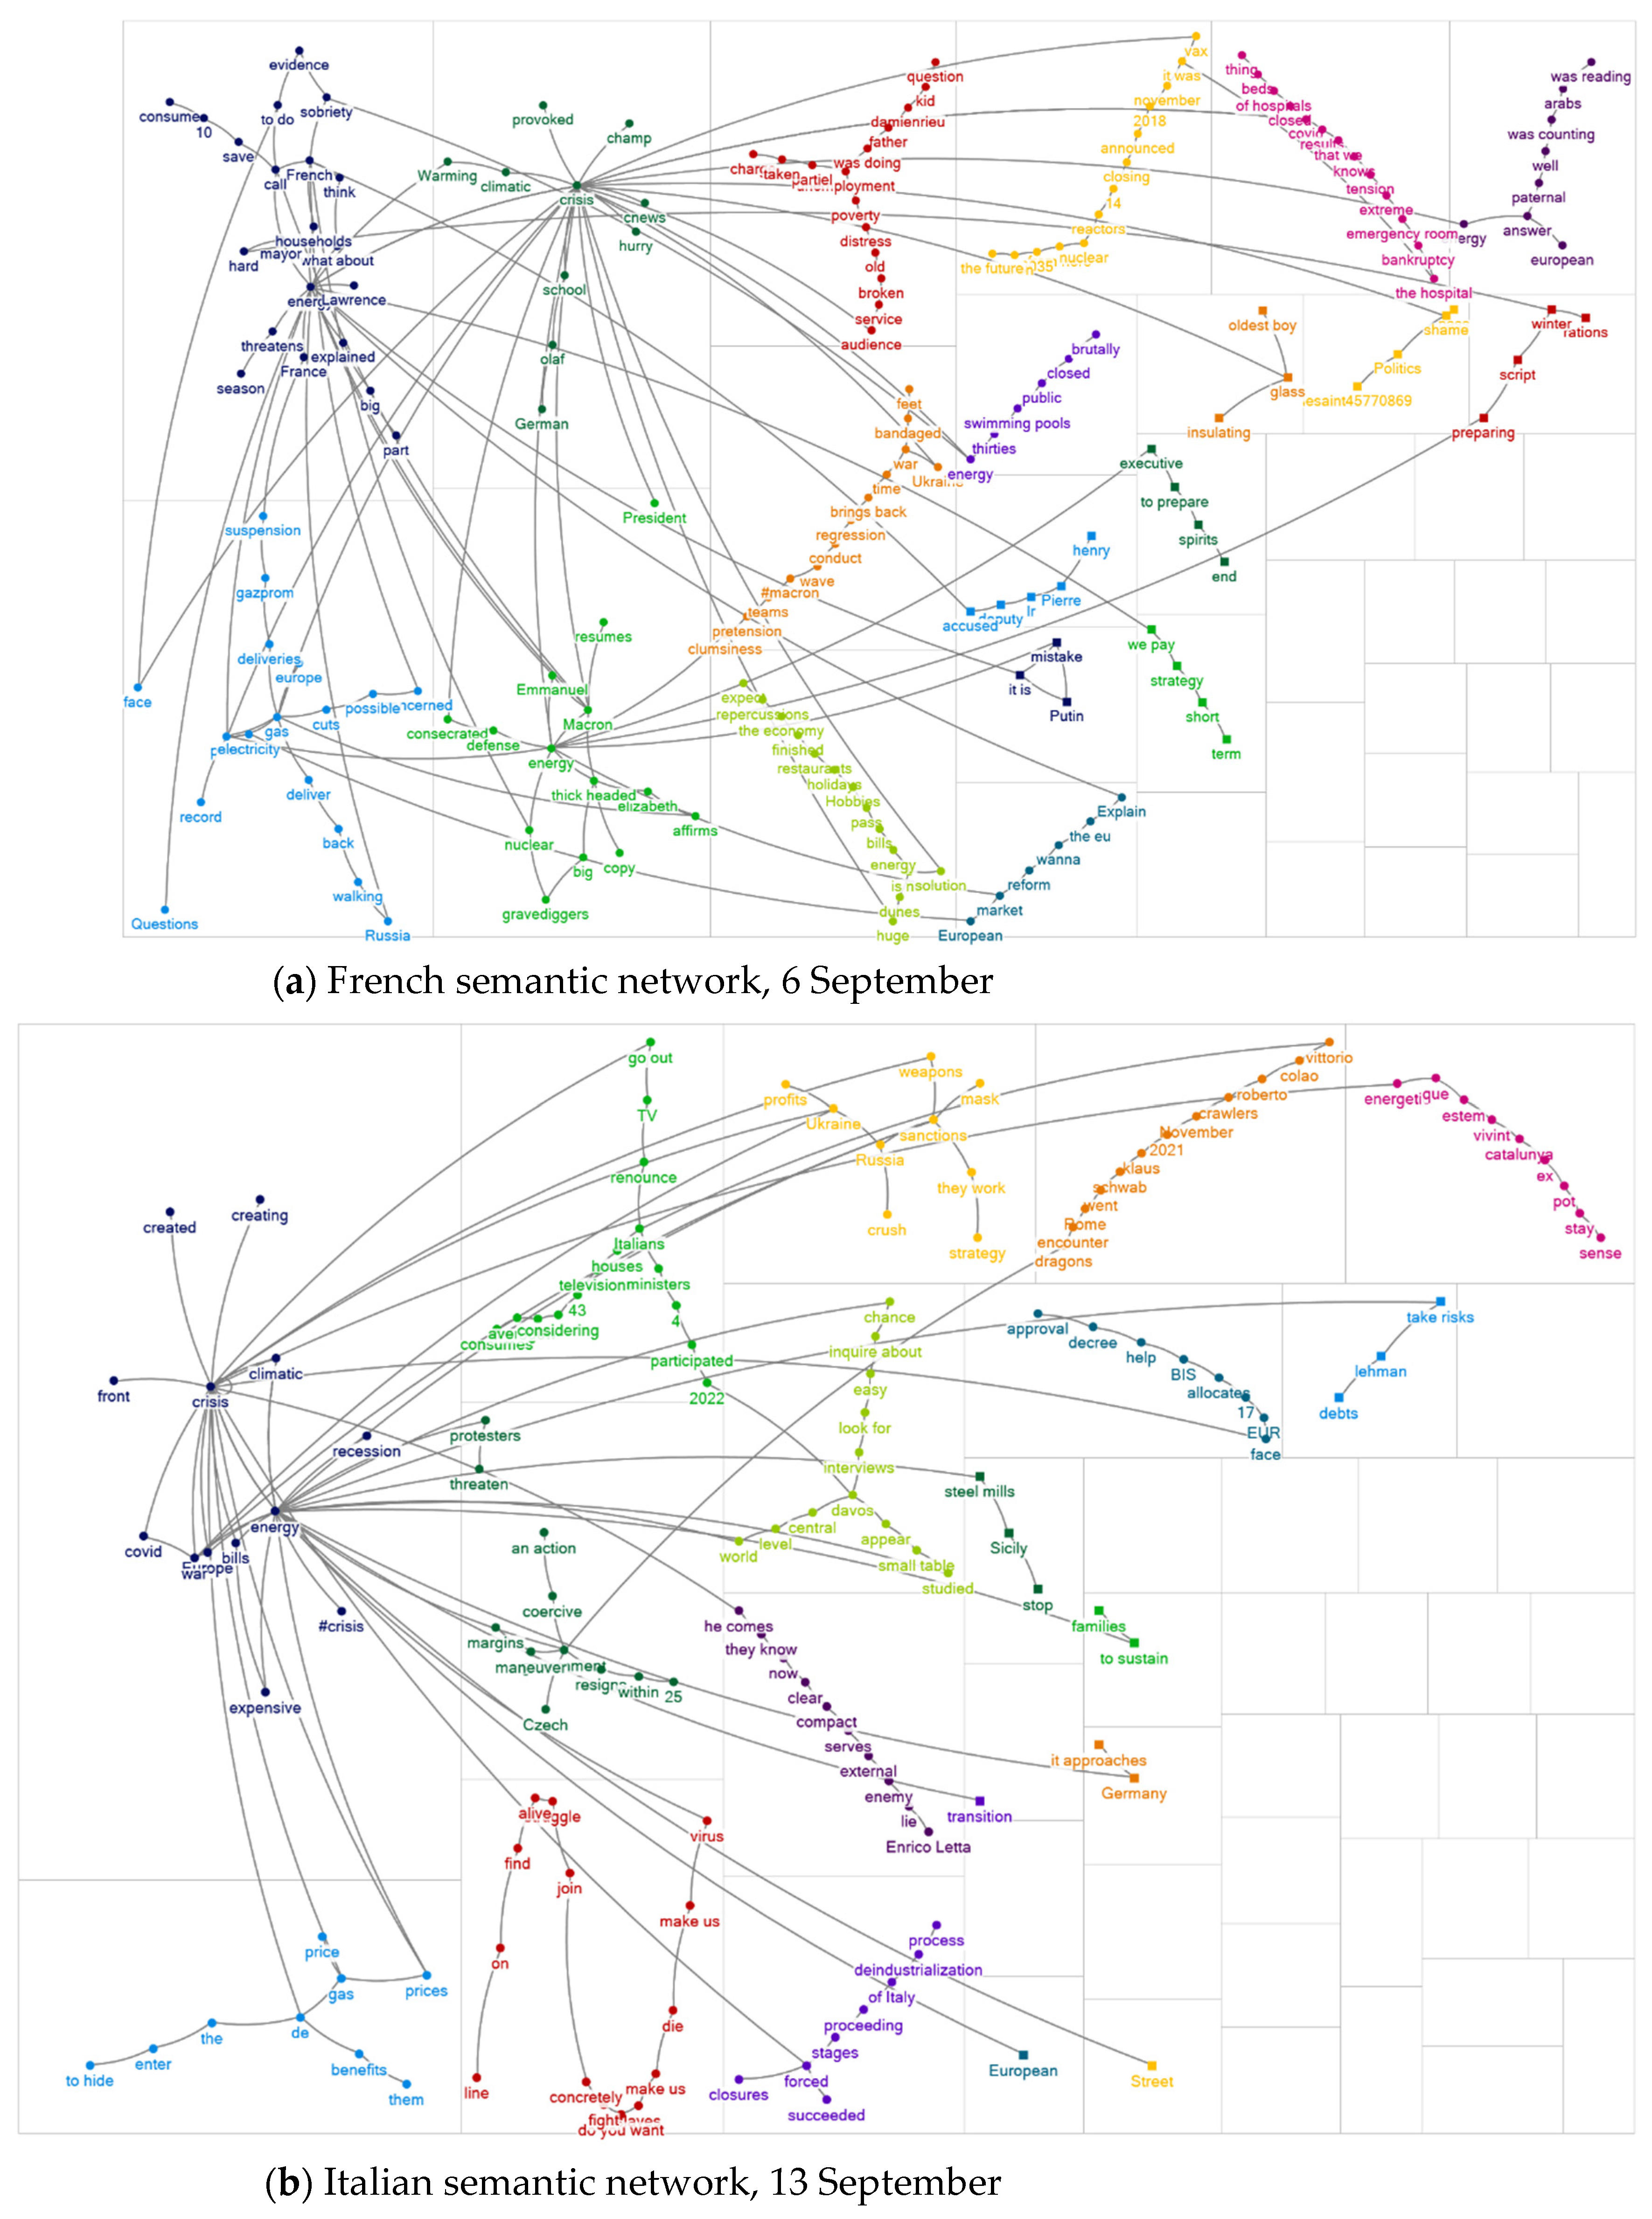
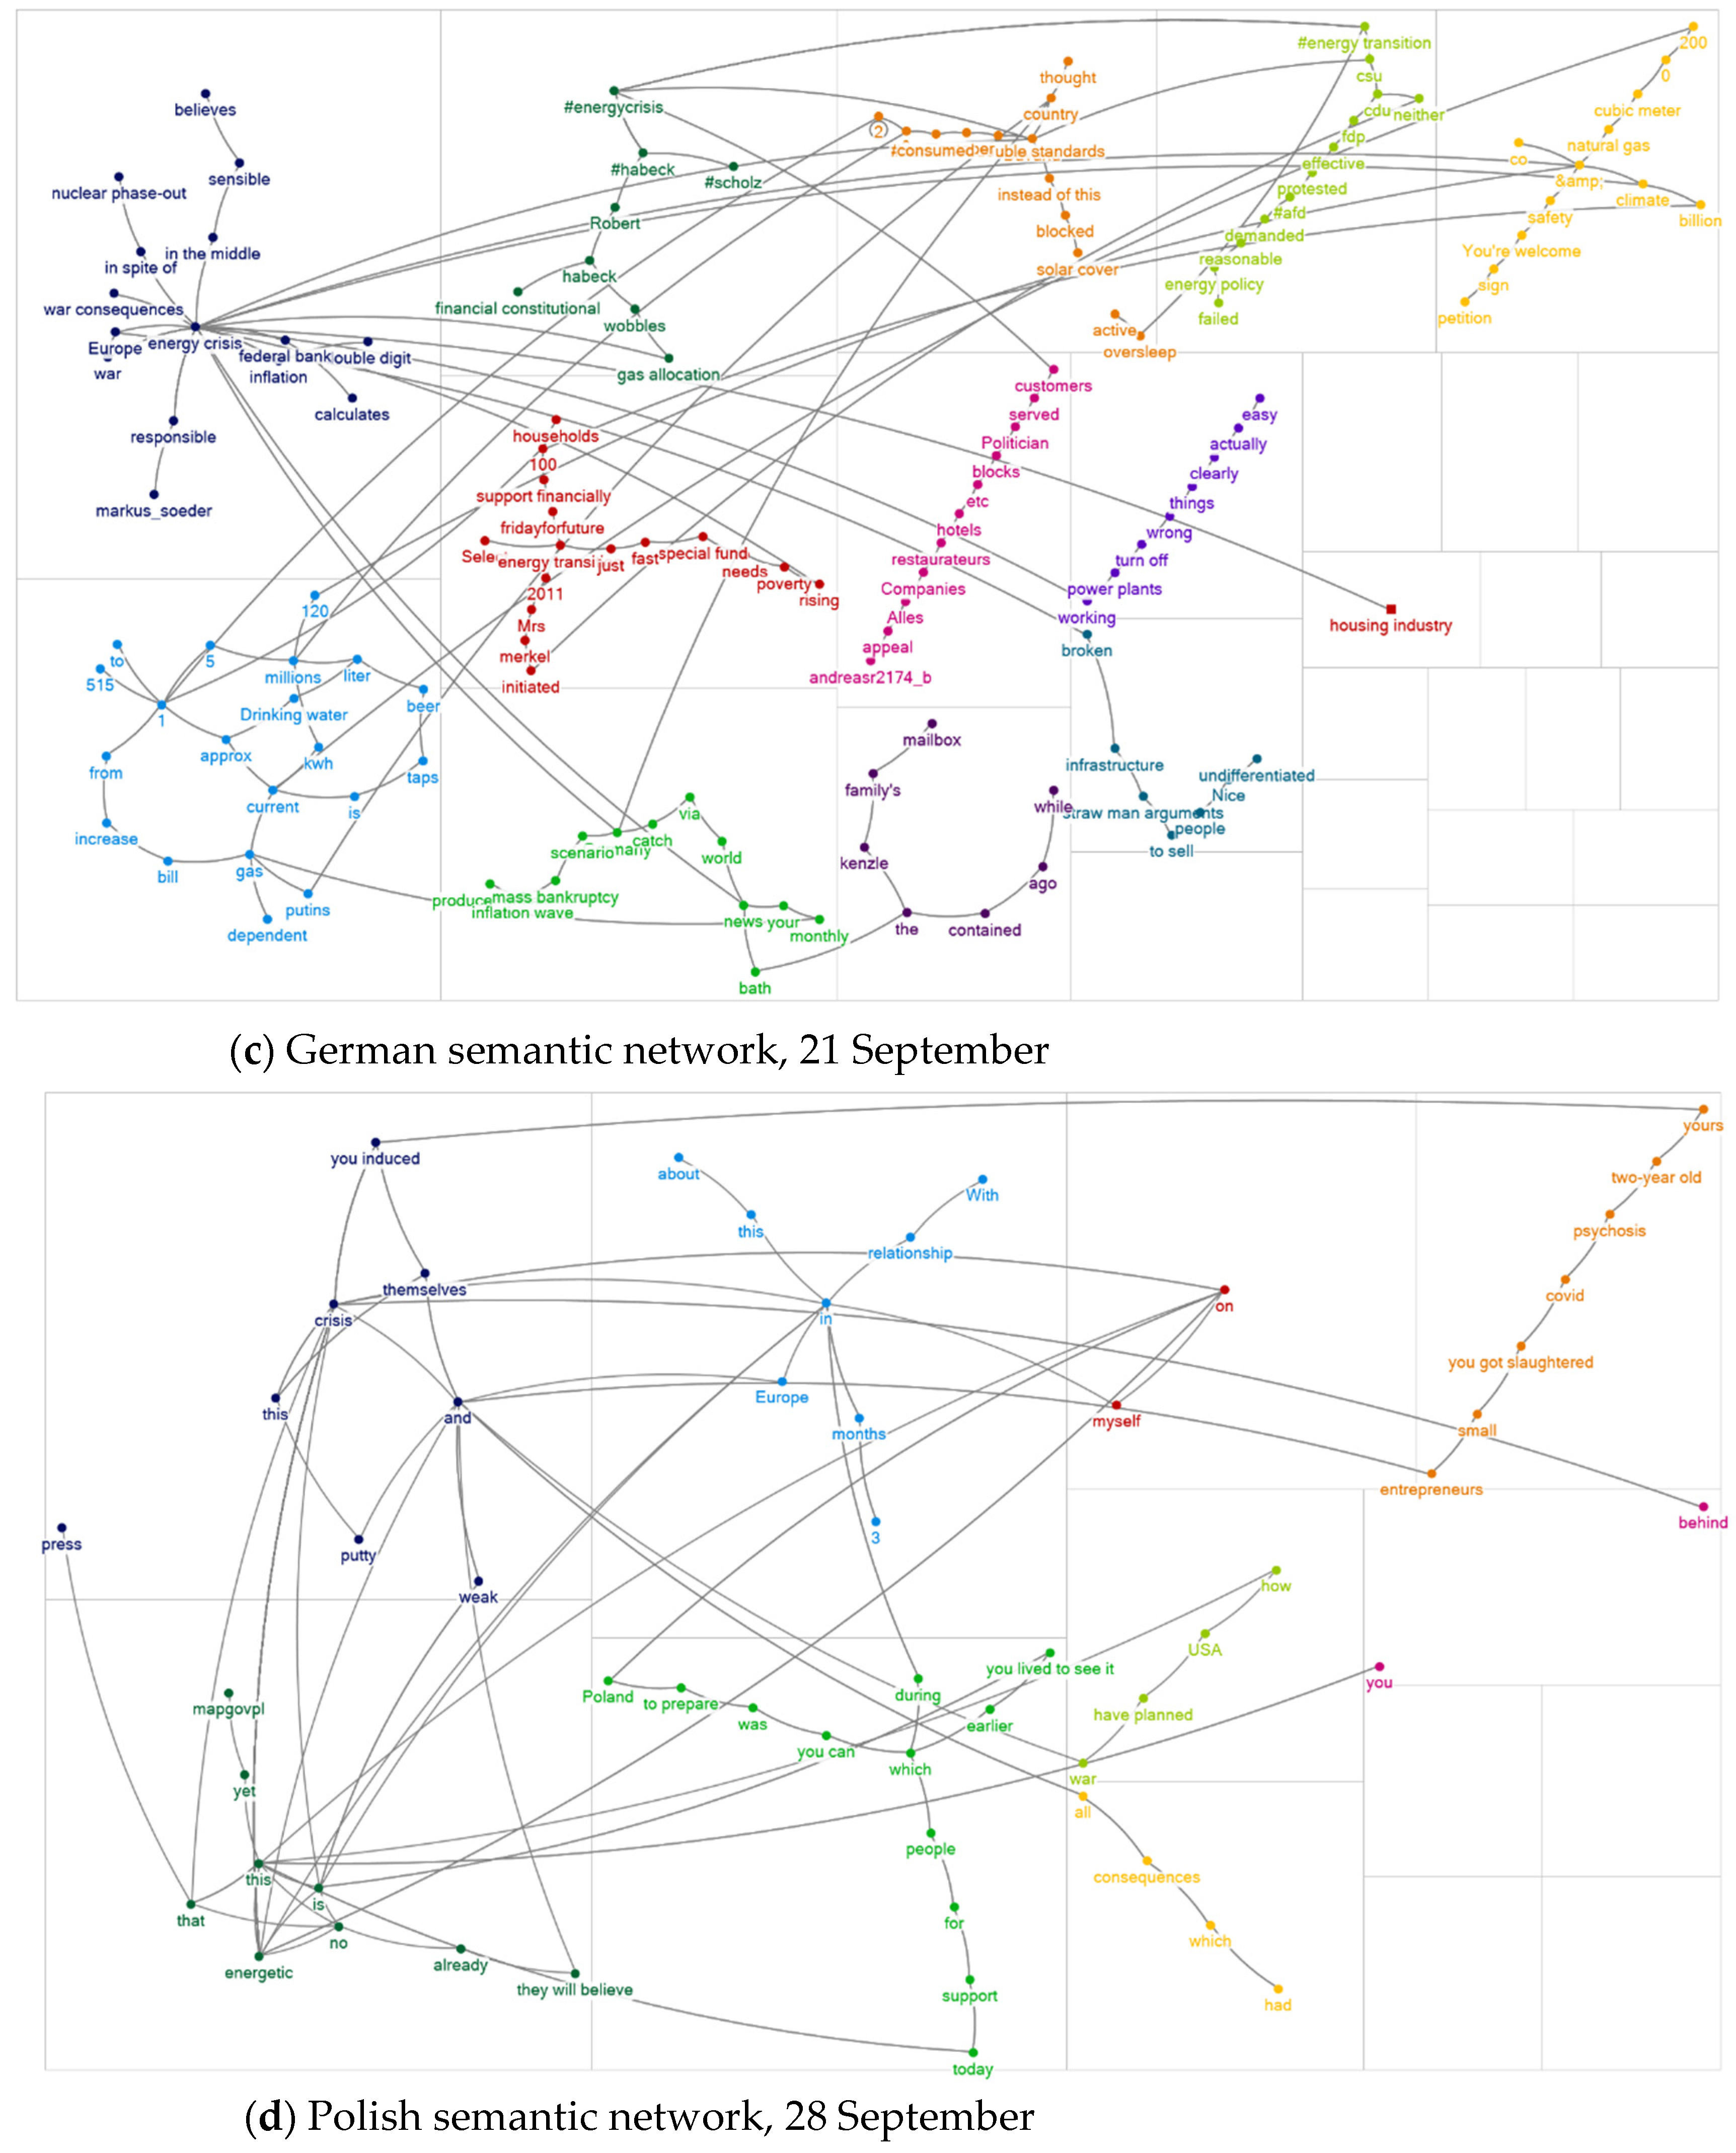
4.3. Content Analysis

Content analysis was utilized to analyze the content of actual tweets using NodeXL PRO in order to calculate subsequent words (word pairs) and their count for all languages and dates. Trying to avoid outcomes that are too dense, we filtered out word pairs that existed fewer than 10 times (a decision taken after different trials). We then used these word pairs as edges in the newly formed networks of words, where each word is a node, and an edge is drawn between the two words in a word pair. This procedure resulted in a total of 28 semantic networks (four weeks multiplied by seven languages). All these networks (apart from those in Figure 4) are presented in the Supplementary Material in high resolution. For clarity reasons, after clustering the words into communities, we filtered out less important words (words with small betweenness centrality); for this reason, some areas seem empty in the visualizations. All node labels were automatically translated into English. A close inspection of each one of these networks was not possible or useful for the purpose of this research. Instead, having our previous results in mind, we chose to analyze only four of them for different dates. The related results are presented in Figure 4.
The semantic network in the French language (taken from the first date) is an example of a semantic network with no exceptional sentiment. Indeed, discussions were held on aspects of the energy crisis, including household energy prices, the European and German politics on energy, the nuclear energy and climate change, President Macron’s talks on the subject and also—at least in one case—the short sight of the EU in general regarding energy supply. However, no highly sentimental words were easily found here.
For the second time period, we chose the highly sentimental semantic network of the Italian tweets. Discussions including energy prices were certainly dominant; however, in this network, additional talks about the sanctions and weapons, the deindustrialization of Italy, Enrico Letta’s (a democrat politician and former Prime Minister) warnings, the anxiety about recession and the future of jobs or energy consumption were also recorded.
As a third case, we chose the semantic network of the German tweets for the third time period. The excessive ‘fear’ sentiment that was detected for them in the previous section was reiterated. Such discussions were clearly present and spanned over this network, including talks on mass bankruptcies, inflation, the increase of bills and the rise of poverty. It should be noted that these data were selected on exactly 21 September, therefore, do not include the sabotage on the Nord Stream I and II gas pipes.
Finally, the semantic network of the Polish tweets of the last period conveyed sentiments of sadness rather than fear, with talks, for example, about ‘you lived to see this’, ‘psychosis’, ‘you got slaughtered’, etc., combined with some talks on energy preparation and relative EU policies.

5. Conclusions, Limitations and Suggestions for Future Research

A new global energy crisis has emerged over the past two years, intensified by Russia’s invasion of Ukraine in early 2022. EU governments and citizens have been overwhelmed by its enormous impact, and even greater impact seems to be yet to come. The energy crisis is a hot topic in social media discussions. However, to the best of our knowledge, previous studies have not investigated discussions of the energy crisis on Twitter. Thus, the purpose of this study was to locate users on Twitter discussing the ongoing energy crisis, create networks of the users, identify the most important nodes of the networks that control the distribution of information and may serve as influencers, produce a semantic analysis of the actual content of tweets and detect users’ sentiments. In order to fulfil this general purpose, we used and expanded a well-known methodology that has been used in Twitter-related research in various cases, such as in politics, in museum discussions or in the COVID-19 pandemic.
Regarding the first group of research questions of this study, the research findings showed that the volumes of the networks were, in general, analogous to the population of each county. The networks were rather sparse and did not belong to the general class of ‘small worlds’. Communities of users seemed to gather around one user, who opened the discussion with a tweet, although some discussions were seen between users who responded to the original tweet. Users also interacted with other groups, sometimes more often (German) and sometimes more sparsely (Spanish) than the average.
People who discussed the energy crisis were simple users (persons, academicians, businesses or even movements), politicians (members or candidates of parliaments, ministries, parties, etc.) and media/news (journalists, TV/news/radio agencies, etc.). ‘Suspicious’ users were also investigated with respect to the actual existence of the account, possible newly created accounts or false personal information. In this vein, they did not pose a real danger in distributing fake news or propaganda. The ten most prominent (with respect to their betweenness centrality) nodes over all networks were identified. All three types of users were represented in most cases; however, this representation was neither analogous nor stable. Media were not present in all cases, while the politician type was obviously extremely active in the results. In most cases, they possessed more than one-third of the top ten positions. This result is probably connected to major local events that dominated local politicians’ talks. ‘Suspicious’ accounts were a small fraction of users, and they all fell into the simple user type.
The important users, the users with high betweenness centrality, seemed to play an influential role in the network, opening popular discussions or spinning off existing ones. These users also acted as a kind of Twitter influencer, even as opinion leaders, through their positions and comments, especially when they neither possessed an institutional post nor represented an official governmental policy. In this way, they were presented as the voice of the anonymous citizen, expressed people’s sentiments and impacted other users’ views. Therefore, the detection and influence of these important users by governments or other institutions may have an impact on users’ attitude toward governmental policies and even lead to the public acceptance or rejection of them. Moreover, governments and policy makers may use these accounts to promote their own policies by commenting or replying to their posts. In this vein, they can add themselves to the network, announce their existence to the Twitter sphere, make known their policies and direct users to their webpages, blogs or accounts to read their policies. Governments and policy makers should take advantage of the two-way communication—listening, responding and interacting—that distinguishes social networking from earlier forms of communication.
As far as the second group of research questions is concerned, negative user sentiments were higher than the positive ones. Sentiments appeared to be stable in their scores over the whole examined time period and for each language. Fear and sadness dominated Italian Twitter on the issue of energy crisis. The Polish sadness was also striking through the entire period, probably due to the geographical proximity of the country to Russia and its dependence on Russian coal. Fear was also the dominant sentiment in the case of German-speaking countries, maybe due to their heavy dependence on Russian natural gas. Trust was also present in almost all cases and on all dates. The dominant negative sentiments among users seemed to be the result of their worries for the ongoing humanitarian drama in Ukraine and the European and even the global future and peace, as well as their concern about the EU economy, inflation and the underlying recession. It is worth mentioning, however, that, at the same time, the sentiment of trust in relation to an EU policy was dispersed among users’ tweets, a policy widely accepted and based on the maintenance of peace, the self-determination of people and the condemnation of every invasion, even if it demands financial, social or personal sacrifices. This trust may have arisen from citizens’ belief that EU leaders will finally manage to support the people who are suffering from the war and, simultaneously, find ways of diminishing the negative impacts of the emerging energy crisis without any bargains in relation to the fundamental European humanitarian and democratic principles and values. To overcome the cost-of-living dilemma, households require fair reduction and redistribution [71], and this is a crucial short-term energy policy decision that has to be taken by EU countries at a national level. The energy crises may break citizens’ emotional ties to the concept of Europe, as well as the continent’s common sense of belonging and mutual trust. Thus, any actions taken by the EU must adhere to the “fairness” standard among the member states so as to keep mutual trust across the continent [72].
Regarding the third group of examined research questions, the findings indicate that the common discussions on all networks were about energy prices, along with political issues. EU citizens seemed to be worried about prices as the cost of wholesale energy in the EU increased significantly since the second half of 2021. The combination of the increase in the global energy demand, the decrease in the amount of liquefied natural gas imported into Europe and the gas supply and low production of renewable energy justify the concerns of Europeans, as well as the extensive discussions about the energy prices. In the French network, European and German politics on energy and nuclear energy, as well as climate change, were massively discussed. Nuclear energy has always been perceived by the public as both promising and dangerous. The unique role of nuclear energy as a clean-air energy source makes it both vital and irreplaceable at such a time when energy is not abundant [73]. Climate change is inextricably linked to energy consumption and the need for renewable energy sources. Global warming is the result of a large amount of greenhouse gases released into the atmosphere by human activities worldwide, including, most importantly, the burning of fossil fuels for electricity, heating and transportation. Renewable energy is the solution to both the energy and climate challenges; therefore, stabilizing energy systems and protecting the environment are not mutually exclusive. The long-term goal must be energy independence using only renewable sources of energy for lighting, heating, industry and transportation. While this cannot be achieved quickly, there are numerous things that the governments of the EU can do swiftly to assist us in getting there [71]. In the Italian network, discussions about energy prices were also central, along with those about sanctions and weapons, the deindustrialization of Italy and anxiety about the recession and jobs, as well as energy consumption. Talks about mass bankruptcy, inflation, the increase in bills and rising poverty dominated the discussions in the German network. The Polish network conveyed fear and sadness, together with some talks on energy preparation and Europe’s positions and policies.
Public views in social media are very important. Public officials should monitor social media data in a way that enables to them to detect general talks on the energy crisis and people’s sentiments. Timely awareness of the public mood can be helpful to all governments and EU policy makers in order to effectively manage the issue of the energy crisis and create an efficient communication strategy to convey accurate and trustworthy information and engage the public in essential response activities. The spread of the energy crisis is causing fear and sadness among the population in EU countries. Honest information from governments on social media may help avoid panic about the upcoming the energy crisis. The users’ discussions on nuclear energy and climate change show the public concerns and the potential of the renewable energy sources that are available in all countries. With renewable energy, countries can gain energy security, diversify their economies and protect themselves from the unpredictable price swings of fossil fuels, thereby driving inclusive economic growth, creating jobs and reducing poverty.
The crisis serves to underline the significance of energy abundance and security for a nation and the dangers—economic, political and social—that developing nations face when they do not take strategic action on the energy front. EU countries, for decades, based their economies and growth on cheap, imported fuel from Russia. At the same time, this created an underlying disadvantage in the geopolitical chessboard, which was immediately highlighted with the outbreak of the Russo-Ukrainian war.
Even while the need for energy independence in the EU is urgent and overwhelming, it appears that it will take some time for it to be achieved because such investments require years to develop and pay off. EU countries are currently compelled to seek solutions that probably have high geopolitical, economic and social costs.
However, this crisis might also be viewed as a chance because it could spur further investment in ecologically benign types of energy and green growth. EU countries could lead the way in this area, export their expertise and show the rest of the world how respect for the environment and sustainability can coexist peacefully with economic development and social and individual well-being.
The research findings suffer from some limitations. The study gave evidence relating to a specific period of time and tweets in five languages, namely, German, Spanish, French, Italian and Polish. It also tried to record EU Twitter users’ views about the energy crisis; however, as the number of tweets that are geotagged is very limited, only 1–2% according to the recent study of Schlosser et al. [74], keywords were used to filter the tweets. This fact resulted in the inclusion of users from different countries even outside the EU, for example, in the German networks, tweets were included that may have been posted from users from Austria or German-speaking Switzerland. However, the presence of the ‘EU’ as a keyword limited this phenomenon. The EU has 24 official languages, and a future study may be conducted in this multilingual environment. Regarding content analysis, it was not the purpose to thoroughly investigate the actual content of all tweets but rather to give an essence of the general talks. However, this was also a limitation of the study. To extend the validity of the findings, future research should also focus on other social media platforms.

Supplementary Materials

The following supporting information can be downloaded at: https://www.mdpi.com/article/10.3390/su15021322/s1.

Author Contributions

Conceptualization, V.V. and D.K.; methodology, D.K. and I.P.; software, D.K. and I.P.; validation, D.K., V.V. and I.K.; writing—original draft preparation, D.K., V.V. and I.K; writing—review and editing, D.K., V.V. and I.K.; visualization, D.K. and I.P.; supervision, V.V.; project administration, I.K. All authors have read and agreed to the published version of the manuscript.

Funding

This research received no external funding.

Institutional Review Board Statement

Not applicable.

Informed Consent Statement

Not applicable.

Data Availability Statement

All data are available upon request to D. Kydros, [email protected].

Conflicts of Interest

The authors declare no conflict of interest.

References

  1. Pietrosem oli, L.; Rodríguez-Monroy, C. The Venezuelan energy crisis: Renewable energies in the transition towards sustainability. Renew. Sust. Energ. Rev. 2019, 105, 415–426. [Google Scholar] [CrossRef]
  2. Melville, G. The Current Energy Crisis has Resulted in a Dramatic, Never before Seen, Increase to the Wholesale Price of Gas and Electricity. Carbon Intelligence. Available online: https://carbon.ci/insights/energy-crisis-2022/#:~:text=16th%20March%202022%20The%20current%20energy%20crisis%20has,of%20the%20energy%20market%20in%20times%20of%20crisis (accessed on 23 September 2022).
  3. Şen, Z. Solar energy in progress and future research trends. Prog. Energy Combust. Sci. 2004, 30, 367–416. [Google Scholar] [CrossRef]
  4. Reliefweb. Understanding the Energy Crisis and its Impact on Food Security. Available online: https://reliefweb.int/report/world/understanding-energy-crisis-and-its-impact-food-security-august-2022 (accessed on 23 September 2022).
  5. Muneer, T.; Asif, M. Energy supply, its demand and security issues for developed and emerging economies. Renew. Sust. Energ. Rev. 2007, 11, 1388–1413. [Google Scholar]
  6. Holm, D. Renewable energy future for the developing world. In Transition to Renewable Energy Systems; Stolten, D., Scherer, V., Eds.; Wiley-VCH Verlag GmbH & Co.: Weinheim, Germany, 2013; pp. 137–157. [Google Scholar]
  7. European Commission. REPowerEU: A Plan to Rapidly Reduce Dependence on Russian Fossil Fuels and Fast forward the Green Transition. Available online: https://ec.europa.eu/commission/presscorner/detail/en/IP_22_3131 (accessed on 15 September 2022).
  8. Paraskova, T. Europe’s Energy Crisis Will Not Be “A One Winter Story”. Available online: https://oilprice.com/Energy/Energy-General/Europes-Energy-Crisis-Will-Not-Be-A-One-Winter-Story.html (accessed on 24 September 2022).
  9. Euronews. Europe’s Energy Crisis: EU Calls for Relief Funds to Help Consumers. Available online: https://www.euronews.com/2021/10/06/europe-s-energy-crisis-eu-calls-for-relief-funds-to-help-consumers (accessed on 24 September 2022).
  10. Horowitz, J. A Global Energy Crisis is Coming. There’s no Quick Fix. CNN Business. Available online: https://edition.cnn.com/2021/10/07/business/global-energy-crisis/index.html (accessed on 24 September 2022).
  11. Lazaridou, K.; Vrana, V.; Paschaloudis, D. Museums + Instagram. In Tourism, Culture and Heritage in a Smart Economy; Katsoni, V., Upadhya, A., Stratigea, A., Eds.; Springer Proceedings in Business and Economics: Cham, Switzerland, 2017; pp. 75–84. [Google Scholar]
  12. Kydros, D.; Vrana, V.; Kehris, E. Social Networks, Politics and Public Views: An Analysis of the Term “Macedonia” in Twitter. Soc. Netw. 2019, 8, 1–15. [Google Scholar] [CrossRef] [Green Version]
  13. Dean, B. How Many People Use Twitter in 2022? [New Twitter Stats]. Available online: https://backlinko.com/twitter-users#daily-active-users (accessed on 24 September 2022).
  14. Zafiropoulos, K.; Vrana, V.; Antoniadis, K. Use of Twitter and Facebook by Top European Museums. JTHSM 2015, 1, 16–24. [Google Scholar]
  15. Jaramillo, S. Talking with Tweets: An Exploration of Museums. Use of Twitter for Two Way Engagement. Master’s Thesis, University of Washington, Seattle, WA, USA, 2017. [Google Scholar]
  16. Theocharidis, A.I.; Nerantzaki, D.M.; Vrana, V.; Paschaloudis, D. 2 Use of the web and Social Media by Greek Museums. Int. J. Cult. Tour. Hosp. Res. 2014, 1, 8–22. [Google Scholar]
  17. Kydros, D.; Argyropoulou, M.; Vrana, V. A Content and Sentiment Analysis of Greek Tweets during the Pandemic. Sustainability 2021, 13, 6150. [Google Scholar] [CrossRef]
  18. European Union. Facts and Figures on Life in the European Union. Available online: https://european-union.europa.eu/principles-countries-history/key-facts-and-figures/life-eu_en (accessed on 4 September 2022).
  19. Coyle, E.D.; Simmons, R.A. Understanding the Global Energy Crisis; Purdue University Press: West Lafayette, IN, USA, 2014. [Google Scholar]
  20. Poudyal, R.; Loskot, P.; Nepal, R.; Parajuli, R.; Khadka, S.K. Mitigating the current energy crisis in Nepal with renewable energy sources. TIDEE: TERI Inf. Dig. Energy Environ. 2020, 19, 58–59. [Google Scholar] [CrossRef]
  21. Zafar, R.; Mahmood, A.; Razzaq, S.; Ali, W.; Naeem, U.; Shehzad, K. Prosumer based energy management and sharing in smart grid. Renew Sustain. Energy Rev. 2018, 82, 1675–1684. [Google Scholar] [CrossRef]
  22. Coyle, E.; Grimson, W.; Basu, B.; Murphy, M. Reflections on Energy, Greenhouse Gases, and Carbonaceous Fuels. In Understanding the Global Energy Crisis; Coyle, E.D., Simmons, R.A., Eds.; Purdue University Press: West Lafayette, IN, USA, 2014; pp. 11–42. [Google Scholar]
  23. United Nations. Renewable Energy. Available online: https://www.un.org/en/climatechange/raising-ambition/renewable-energy-transition?gclid=Cj0KCQjwyt-ZBhCNARIsAKH1175xuMse8AR2LD7UAMKd08aL26yvx5ZPqt7PtdNrzbDYPRtfZTsLNJEaAhVhEALw_wcB (accessed on 1 October 2022).
  24. United Nations. Five Ways to Jump-Start the Renewable Energy Transition Now. Available online: https://www.unep.org/explore-topics/energy/what-we-do/renewable-energy (accessed on 1 October 2022).
  25. Simmons, R.; Coyle, E.; Chapman, B. Global Energy Policy Perspectives. In Understanding the Global Energy Crisis; Coyle, E.D., Simmons, R.A., Eds.; Purdue University Press: West Lafayette, IN, USA, 2014; pp. 42–117. [Google Scholar]
  26. Elavarasan, R.M.; Shafiullah, G.M.; Padmanaban, S.; Kumar, N.M.; Annam, A.; Vetrichelvan, A.M.; Mihet-Popa, L.; Holm-Nielsen, J.B. A comprehensive review on renewable energy development, challenges, and policies of leading Indian states with an international perspective. IEEE Access 2020, 8, 74432–74457. [Google Scholar] [CrossRef]
  27. Coyle, E.; Basu, B.; Blackledge, J.; Grimson, W. Harnessing Nature: Wind, Hydro, Wave, Tidal, and Geothermal Energy. In Understanding the Global Energy Crisis; Coyle, E.D., Simmons, R.A., Eds.; Purdue University Press: West Lafayette, IN, USA, 2014; pp. 106–124. [Google Scholar]
  28. Hunt, J.D.; Nascimento, A.; ten Caten, C.S.; Tomé, F.M.C.; Schneider, P.S.; Thomazoni, A.L.R.; de Castro, N.J.; Brandão, R.; de Freitas, M.A.V.; Martini, J.S.C.; et al. Energy crisis in Brazil: Impact of hydropower reservoir level on the river flow. Energy 2022, 239, 121927. [Google Scholar] [CrossRef]
  29. Tsoukalas, L.; Gao, R.; Coyle, E. A Future for Nuclear Energy? In Understanding the Global Energy Crisis; Coyle, E.D., Simmons, R.A., Eds.; Purdue University Press: West Lafayette, IN, USA, 2014; pp. 167–190. [Google Scholar]
  30. Barnham, K.W.J.; Mazzer, M.; Clive, B. Resolving the energy crisis: Nuclear or photovoltaics? Nat. Mater. 2006, 5, 161–164. [Google Scholar] [CrossRef]
  31. United Nations. Renewable Energy–Powering a Safer Future. Available online: https://www.un.org/en/climatechange/raising-ambition/renewable-energy (accessed on 1 October 2022).
  32. United Nations Economic Commission for Europe. UNECE Renewable Energy Status Report 2022. Available online: https://unece.org/sustainable-energy/publications/unece-renewable-energy-status-report-2022 (accessed on 29 September 2022).
  33. Moriarty, P.; Honnery, D. Rise and Fall of the Carbon Civilisation; Springer: London, UK, 2010. [Google Scholar]
  34. Moriarty, P.; Honnery, D. What is the global potential for renewable energy? Renew. Sustain. Energy Rev. 2012, 16, 244–252. [Google Scholar] [CrossRef]
  35. Gros, D. What Europe’s Energy Crunch Reveals. Available online: https://www.project-syndicate.org/commentary/europe-energy-prices-and-future-green-transitions-by-daniel-gros-2021-11?utm_term=&utm_campaign=&utm_source=adwords&utm_mdium=ppc&hsa_acc=1220154768&hsa_cam=12374283753&hsa_grp=117511853986&hsa_ad=499567080225&hsa_src=g&hsa_tgt=dsa-19959388920&hsa_kw=&hsa_mt=&hsa_net=adwords&hsa_ver=3&gclid=Cj0KCQjwyt-ZBhCNARIsAKH1174Plky3osqkVTLzBghVcR2dwtmBikGPuq4vsjBo5aXfknjIXvoEyrgaAui8EALw_wcB (accessed on 27 September 2022).
  36. Economist Intelligence. Europe’s Bleak Midwinter. Available online: https://www.eiu.com/n/campaigns/europe-energy-crisis/?utm_source=google&utm_medium=cpc&utm_campaign=europe%27s-bleak-midwinter-sept-22&gclid=Cj0KCQjwyt-ZBhCNARIsAKH1175fiT7QIP7OGrmplARldJemjZH69aiQq94iocpnEmjKB7c5zSGL7voaAgthEALw_wcB (accessed on 1 October 2022).
  37. Sparkes, M. Russia’s Nord Stream Gas Pipelines to Europe Suffer Mysterious Leaks. Available online: https://www.newscientist.com/article/2339640-russias-nord-stream-gas-pipelines-to-europe-suffer-mysterious-leaks/ (accessed on 2 October 2022).
  38. Jayanti, S. Europe’s Energy Crisis Is Going to Get Worse. The World Will Bear the Cost. Available online: https://time.com/6209272/europes-energy-crisis-getting-worse/ (accessed on 1 October 2022).
  39. Alderman, L. ‘Crippling’ Energy Bills Force Europe’s Factories to Go Dark. Available online: https://www.nytimes.com/2022/09/19/business/europe-energy-crisis-factories.html (accessed on 27 September 2022).
  40. Sharafedin, B.; Sevgili, C. Analysis: Forget Showering, it’s Eat or Heat for Shocked Europeans Hit by Energy Crisis. Available online: https://www.reuters.com/markets/europe/forget-showering-its-eat-or-heat-shocked-europeans-hit-by-energy-crisis-2022-08-26/ (accessed on 1 October 2022).
  41. World Economic Forum. Davos 2022: We Are in the Middle of the First Global Energy Crisis. Here’s How We Can Fix It. Available online: https://www.weforum.org/agenda/2022/05/first-global-energy-crisis-how-to-fix-davos-2022/ (accessed on 1 October 2022).
  42. Ruhnau, O.; Stiewe, C.; Muessel, J.; Hirth, L. Gas Demand in Times of Crisis. The Response of German Households and Industry to the 2021/22 Energy Crisis. Preprints Econstor. Available online: http://hdl.handle.net/10419/261082 (accessed on 15 October 2022).
  43. European Council for an Energy Efficient Economy. Electricity Prices in Spain Hit Historic High. Available online: https://www.eceee.org/all-news/news/electricity-prices-in-spain-hit-historic-high/ (accessed on 3 October 2022).
  44. France 24. France’s Public and Private Sectors Race to Adapt as Winter Energy Crisis Looms. Available online: https://www.france24.com/en/france/20220911-french-industries-try-adapting-to-the-energy-crisis-ahead-of-winter (accessed on 1 October 2022).
  45. Reporting Democracy. Ukraine war Exposes Extent of Poland’s Obsolete Energy Policies. Available online: https://balkaninsight.com/2022/09/20/ukraine-war-exposes-extent-of-polands-obsolete-energy-policies/ (accessed on 20 September 2022).
  46. Reuters. Poland Allows use of Brown Coal to Heat Homes Amid Supply crisis. Available online: https://www.reuters.com/business/energy/poland-allows-use-brown-coal-heat-homes-amid-supply-crisis-2022-09-29/ (accessed on 30 September 2022).
  47. Qazi, A.; Hussain, F.; Rahim, N.A.; Hardaker, G.; Alghazzawi, D.; Shaban, K.; Haruna, K. Towards Sustainable Energy: A systematic review of renewable energy sources, technologies, and public opinions. IEEE Access 2019, 7, 63837–63851. [Google Scholar] [CrossRef]
  48. Kotzaivazoglou, I. Communicating and developing relationships through Facebook: The case of Greek organisations. Int. J. Technol. Mark. 2017, 12, 375–388. [Google Scholar] [CrossRef]
  49. Chan, A.K.; Nickson, C.P.; Rudolph, J.W.; Lee, A.; Joynt, G.M. Social media for rapid knowledge dissemination: Early experience from the COVID-19 pandemic. Anaesthesia 2020, 75, 1579–1582. [Google Scholar] [CrossRef] [PubMed]
  50. Gupta, K.; Ripberger, J.; Wehde, W. Advocacy group messaging on social media: Using the narrative policy framework to study Twitter messages about nuclear energy policy in the United States. Policy Stud. J. 2018, 46, 119–136. [Google Scholar] [CrossRef]
  51. Herrera, G.P.; Constantino, M.; Su, J.J.; Naranpanawa, A. Renewable energy stocks forecast using Twitter investor sentiment and deep learning. Energy Econ. 2022, 114, 106285. [Google Scholar] [CrossRef]
  52. Wu, B.; Wang, L.; Wang, S.; Zeng, Y.R. Forecasting the US oil markets based on social media information during the COVID-19 pandemic. Energy 2021, 226, 120403. [Google Scholar] [CrossRef]
  53. Kaur, P.; Edalati, M. Sentiment analysis on electricity twitter posts. arXiv 2022, arXiv:2206.05042. [Google Scholar]
  54. Wang, Z.; Ali, S.; Akbar, A.; Rasool, F. Determining the influencing factors of biogas technology adoption intention in Pakistan: The moderating role of social media. IJERPH 2020, 17, 2311. [Google Scholar] [CrossRef] [PubMed] [Green Version]
  55. Corbett, J.; Savarimuthu, B.T.R. From tweets to insights: A social media analysis of the emotion discourse of sustainable energy in the United States. Energy Res. Soc. Sci. 2022, 89, 102515. [Google Scholar] [CrossRef]
  56. Smith, M.; Ceni, A.; Milic-Frayling, N.; Shneiderman, B.; Mendes Rodrigues, E.; Leskovec, J.; Dunne, C. NodeXL: A Free and Open Network Overview, Discovery and Exploration Add-In for Excel 2007/2010/2013/2016; Social Media Research Foundation: Redwood City, CA, USA, 2010. [Google Scholar]
  57. Kantrowitz, A. The Man Who Built the Retweet: We Handed A Loaded Weapon To 4-Year-Olds. 2019. Available online: https://www.buzzfeednews.com/article/alexkantrowitz/how-the-retweet-ruined-the-internet (accessed on 7 October 2020).
  58. Kydros, D.; Vrana, V. A Twitter network analysis of European museums. mus. Manag. Curatorship 2021, 36, 569–589. [Google Scholar] [CrossRef]
  59. Honnibal, M.; Montani, I. spaCy 2: Natural language understanding with Bloom embeddings, convolutional neural networks and incremental parsing. Appear 2017, 7, 411–420. [Google Scholar]
  60. Mohammad, S.M.; Turney, P. NRC Word-Emotion Association Lexicon. Available online: https://saifmohammad.com/WebPages/NRC-Emotion-Lexicon.htm (accessed on 17 August 2022).
  61. Danowski, J.A.; Park, H.W. Arab spring effects on meanings for Islamist web terms and on web hyperlink networks among Muslim-majority nations: A naturalistic field experiment. J. Contemp. East. Asia 2014, 13, 15–39. [Google Scholar] [CrossRef]
  62. Danowski, J.A.; Yan, B.; Riopelle, K. A semantic network approach to measuring sentiment. Qual. Quant. 2020, 55, 221–255. [Google Scholar] [CrossRef]
  63. Stopwords ISO. Available online: https://github.com/stopwords-iso (accessed on 21 August 2022).
  64. Clauset, A.; Newman, M.; Moore, C. Finding community structure in very large networks. Phys. Rev. 2004, 70, 066111. [Google Scholar] [CrossRef] [Green Version]
  65. NetworkX. A Newwork Analysis in Python. Available online: https://networkx.org/ (accessed on 21 August 2022).
  66. Hansen, D.; Shneiderman, B.; Smith, M.A. Analyzing Social Media Networks with NodeXL: Insights from a Connected World; Morgan Kaufmann: Burlington, MA, USA, 2010. [Google Scholar]
  67. Feng, B.; Li, Q.; Pan, X.; Zhang, J.; Guo, D. Groupfound: An effective approach to detect suspicious accounts in online social networks. Int. J. Distrib. Sens. Netw. 2017, 13, 1550147717722499. [Google Scholar] [CrossRef]
  68. Maxwell, T. How Many Bots Are on Twitter and Does It Matter? Available online: https://www.makeuseof.com/how-many-bots-ontwitter/#:~:text=Officially%2C%20Twitter%20estimates%20that%20the,16.5%20million%20bots%20on%20Twitter (accessed on 26 November 2022).
  69. Varol, O.; Ferrara, E.; Davis, C.; Menczer, F.; Flammini, A. Online human-bot interactions: Detection, estimation, and characterization. In Proceedings of the international AAAI conference on web and social media 2017, Montreal, QC, Canada, 15–18 May 2017; Volume 11, pp. 280–289. [Google Scholar]
  70. PARC. Languages and Social Network Behaviors: Top 10 Languages on Twitter. Available online: https://www.parc.com/blog/languages-and-social-network-behaviors-top-10-languages-on-twitter/ (accessed on 21 October 2022).
  71. Bout, M. Four Ways Europe’s Governments must Respond to the Global Energy Crisis. Greenpeace. Available online: https://www.greenpeace.org/international/story/57193/global-energy-crisis-four-ways-europe-governments-must-respond/ (accessed on 21 October 2022).
  72. Zerka, P. Running on Empty: How Trust among EU States can Survive the Energy Crisis. European Council on Foreign relations. Available online: https://ecfr.eu/article/running-on-empty-how-trust-among-eu-states-can-survive-the-energy-crisis/ (accessed on 21 October 2022).
  73. Bisconti, A.S. Changing Public Attitudes toward NuCLEAR energy. Prog. Nucl. Energy 2018, 102, 103–113. [Google Scholar] [CrossRef]
  74. Schlosser, S.; Toninelli, D.; Cameletti, M. Comparing methods to collect and geolocate tweets in Great Britain. JOItmC 2021, 7, 44. [Google Scholar] [CrossRef]
Figure 1. A network for each week: (a) French, 6 September; (b) German, 13 September; (c) Spanish, 21 September; (d) Polish, 28 September.
Sustainability 15 01322 g001aSustainability 15 01322 g001b
Figure 2. Distribution of user types per language and date.
Sustainability 15 01322 g002
Figure 3. Charts of sentiments: (a) 6 September; (b) 13 September; (c) 21 September; (d) 28 September.
Sustainability 15 01322 g003
Figure 4. Four semantic networks: (a) French, 6 September; (b) German, 13 September; (c) Spanish, 21 September; (d) Polish, 28 September.
Sustainability 15 01322 g004aSustainability 15 01322 g004b
Table 1. Raw data (total tweets of any type) collected.
DateEnglishFrenchGermanItalianPolishSpanishTotal
6 September 202221,42924,55623,12221,13039669453103,656
13 September 202222,60923,26629,19417,178550512,845110,597
21 September 202222,05620,40522,95316,8416154929797,706
28 September 202220,54913,75724,54396785094633879,959
Total86,64381,98499,81264,82720,71937,933391,918
Table 2. Average percentage of real-content tweets (excluding retweets and mentions in retweets) per language.
Language6 September 202213 September 202221 September 202228 September 2022General Average
English23%26%29%19%24%
French16%17%16%17%17%
German32%24%25%30%28%
Italian32%32%23%32%30%
Polish30%28%22%28%27%
Spanish23%18%23%22%22%
General Average26%24%23%25%24%
Table 3. Basic metrics for all networks during the examined period.
NodesTotal Edges% of Parallel EdgesAverage DistanceAverage Clustering CoefficientGroups with ≥ 10 Nodes
6 September 2022
English4758495618%8.920.00722
German5384745127%6.440.00836
Italian5146683223%6.450.01540
French3275401722%5.160.00725
Spanish2020215517%6.100.05324
Polish1088117615%6.570.02316
13 September 2022
English5143577724%4.520.02342
German5101714827%5.770.01426
Italian4389545826%7.960.01728
French3125395628%7.020.01129
Spanish2195234120%3.380.02030
Polish1292153920%6.090.02119
21 September 2022
English5545630123%5.340.02230
German4531568022%6.030.00826
Italian3431394321%8.160.01330
French2705335126%7.470.01130
Spanish1991209619%3.000.00920
Polish1215137613%7.060.01922
28 September 2022
English3673381716%8.520.01132
German5511741827%5.850.01035
Italian2871307718%10.710.0125
French2127231418%9.60.01025
Spanish1417137213%2.60.00712
Polish1353145112%7.370.01819
Table 4. The ten most important users per date, according to their betweenness centrality. Green nodes are politicians, brown are media and blue are simple users. Red nodes are ‘suspicious’, as explained in the text.
6 September
FrenchGermanEnglishItalianSpanishPolish
brunolemaireweltnewtemplar77giuliogaiasanchezcastejonpisorgpl
emmanuelmacrondie_gruenenwaywardrabblercarlocalendaper_energiamorawieckim
lci_friedrichmerzthevivafreienricolettapsoejacek_tarnowski
bfmtvcynthior1petersweden7pdnetworknunezfeijootvp_info
laurent7013c_lindneriprotectyouorgmatteosalviniminumodenergeticomoskwa_anna
franceinfotagesschaudeleon49alanfriedmanit1973luisalbertobrajankot
cnewsdrhombachoffgridtech_netgiuseppeconteit partito 5 stelledameronfightergreenpeace_pl ngo
michel_bruleylindateutebergpotus bidenguidocrosettogmh_upsaantyputler
elisabeth_borneabaerbocktrusslizgraziano_delriord_energiajakubwiech
8enoitbundeskanzlerbusiness blumbergmatteorenzilibre_mercadobiznesalert
13 September
franceinfowelttheeconomistraffaelegianni4petrogustavotvp_info
__caac__mabu1412youtubeenricolettaactualidadrtmorawieckim
lemondefr_friedrichmerzrhjamesonguidocrosettoojoveneosowskigrzegorz
vonderleyendie_gruenenjdiazcardielpdnetworkantonio_arnaupisorgpl
lcic_lindnere_krukowskarepubblicasanchezcastejonmasawiuk
emmanuelmacronequickfindercurioiohero9004aragonigtomaldosuwart
fochferdinand2markus_soedervonderleyencarlocalendaireneveleztmkis_gov_pl
leftistreversebundeskanzlerbreitbartnewssventhecantosnunezfeijooagnieszkaj14
cnewshstubnerorgetorixlaveritawebminenergiacoomietm
bfmtvbmwkbennobatravagliatoinfopresidenciaprezydentpl
21 September
vonderleyenkonstantinnotzjustthi30117912enricolettaactualidadrtmorawieckim
franceinfoc_lindneryoutubecarlocalendaojovenerestory244
gdk_davidweltaandnoadoctorino77ireneveleztpremierrp
elisabeth_bornedie_gruenenjunksciencegiuliogaiapetrogustavopisorgpl
lechohstubner robert76907841giorgiameloniminenergiacopracodawcyrp
agnesrunacherbmwk ministervonderleyentrincherovpazprogresojakubwiech
brunolemairebundeskanzlerpotus bidengiuseppeconteit05cesgarwaldemar_buda
bfmtvsusannebaesslerjaisanspdnetworkjfelipehmmoskwa_anna
cnewswalterknepelstarkicusguidocrosettosnowflakeki11ertuja_tajos
lciakaszonandrewemcameron zanalessandrocbvillegasmhorala
28 September
elisabeth_borneverowendlandjoliefuselierenricoletta05cesgarmorawieckim
bfmtvweltvonderleyengiorgiameloniactualidadrdonaldtusk
brunolemairehstubneremmanuelmacronsantapazienza99migupelo2robertrwar
vonderleyenkathi_wolfgangbundeskanzlergiuseppeconteitpetrogustavotrzaskowski_
radioclassiquec_lindnermiamivandynyupdnetworkclaudiasheinarkadiuszkoper
manonaubryfrfdpbt politicalxieqingan111andesa63jefaxxomariusz_sta
opinionwayderspiegelwallstreetsilvalifedecavelopezobrador_rafaszczerbins
economie_gouvzdfheuteaandnoaariachetiraeu_commissionpisorgpl
ccifrancefocusonlinebusinessalegimichelecam02393629beataszydlo
ccivendeebundeskanzleranalegrande1_maxfree_bonita_radiojakubwiech
Table 5. Sentiments on energy crisis.
6 September
FrenchGermanEnglishItalianSpanishPolish
Positive15%22%14%22%17%22%
Negative30%23%24%24%22%29%
Anger8%9%6%7%5%4%
Anticipation9%7%7%12%6%5%
Disgust2%5%4%9%4%3%
Fear9%15%9%28%6%11%
Joy3%4%4%9%4%2%
Sadness8%10%5%15%5%18%
Surprise3%3%3%9%2%2%
Trust11%9%9%14%7%8%
13 September
Positive14%22%14%22%21%23%
Negative30%22%25%25%22%27%
Anger8%7%8%7%6%4%
Anticipation7%8%7%13%6%5%
Disgust2%5%3%10%4%3%
Fear8%14%10%29%6%9%
Joy4%3%4%10%5%2%
Sadness7%10%6%16%6%17%
Surprise3%3%4%9%3%2%
Trust8%10%10%14%9%6%
21 September
Positive15%25%14%23%19%23%
Negative29%21%24%23%23%27%
Anger8%7%7%7%6%4%
Anticipation7%6%7%13%6%5%
Disgust2%4%3%10%4%3%
Fear8%12%9%28%6%10%
Joy4%3%4%10%4%3%
Sadness7%8%6%16%5%17%
Surprise3%2%3%9%3%2%
Trust8%12%9%15%9%7%
28 September
Positive14%21%14%21%19%24%
Negative29%22%25%27%23%28%
Anger8%8%7%8%6%4%
Anticipation7%7%7%13%6%5%
Disgust3%4%4%10%3%3%
Fear8%16%11%30%6%10%
Joy4%3%3%10%4%3%
Sadness7%10%7%17%7%18%
Surprise3%3%4%9%3%2%
Trust8%11%8%14%9%7%
Disclaimer/Publisher’s Note: The statements, opinions and data contained in all publications are solely those of the individual author(s) and contributor(s) and not of MDPI and/or the editor(s). MDPI and/or the editor(s) disclaim responsibility for any injury to people or property resulting from any ideas, methods, instructions or products referred to in the content.

