

Puebla City Water Supply from the Perspective of Urban Water Metabolism

 ,
,  ,
, 
 , and
, and
Abstract
1. Introduction
2. Materials and Methods
2.1. UWM Conceptual Model and Its Energy and Carbon Nexus
2.2. Study Area Delimitation
- Non-metropolitan area within the PVA
- ○
- Ten municipalities outside the metropolitan area of the City of Puebla: Calpan, Cuautinchan, Nealtican, San Gregorio Atzompa, San Jerónimo Tecuanipan, San Matías Tlalancaneca, San Nicolás de Los Ranchos, Santa Isabel Cholula, Tianguismanalco, and Santa Rita Tlahuapan
- Metropolitan area outside of the central conurbation
- ○
- Ten municipalities in the metropolitan area of Puebla have urban settlements with no adjacency to the central conurbation.
- Conurbation II: San Martín Texmelucan, San Salvador el Verde
- Conurbation III: Chiautzingo, San Felipe Teotlalcingo
- Non-conurbated: Domingo Arenas, Huejotzingo, Ocoyucan, San Miguel Xoxtla, and Tlaltenango.
- Central conurbation
- ○
- Five municipalities contiguous to Puebla central city comprise our conurbation I: Amozoc, Coronango, Cuautlancingo, Juan C. Bonilla, San Andrés Cholula, and San Pedro Cholula.
- Puebla central city
- ○
- Puebla is a “historical” city located in the municipality of Puebla. Its surface area is approximately the same as the one covered by the water utility system called “Sistema Operador de Agua Potable y Alcantarillado de Puebla” (SOAPAP). SOAPAP is the acronym for Sistema Operador de los Servicios de Agua Potable y Alcantarillado del Municipio de Puebla, a decentralized public organization of the State of Puebla whose purpose is to provide drinking water, sewerage, and sanitation services. Its jurisdiction is the municipality of Puebla and part of the surrounding municipalities; however, its functions are concessioned to a private company (a water utility). This decentralized agency regulates the private concessionaire company that provides potable water service in Puebla City.
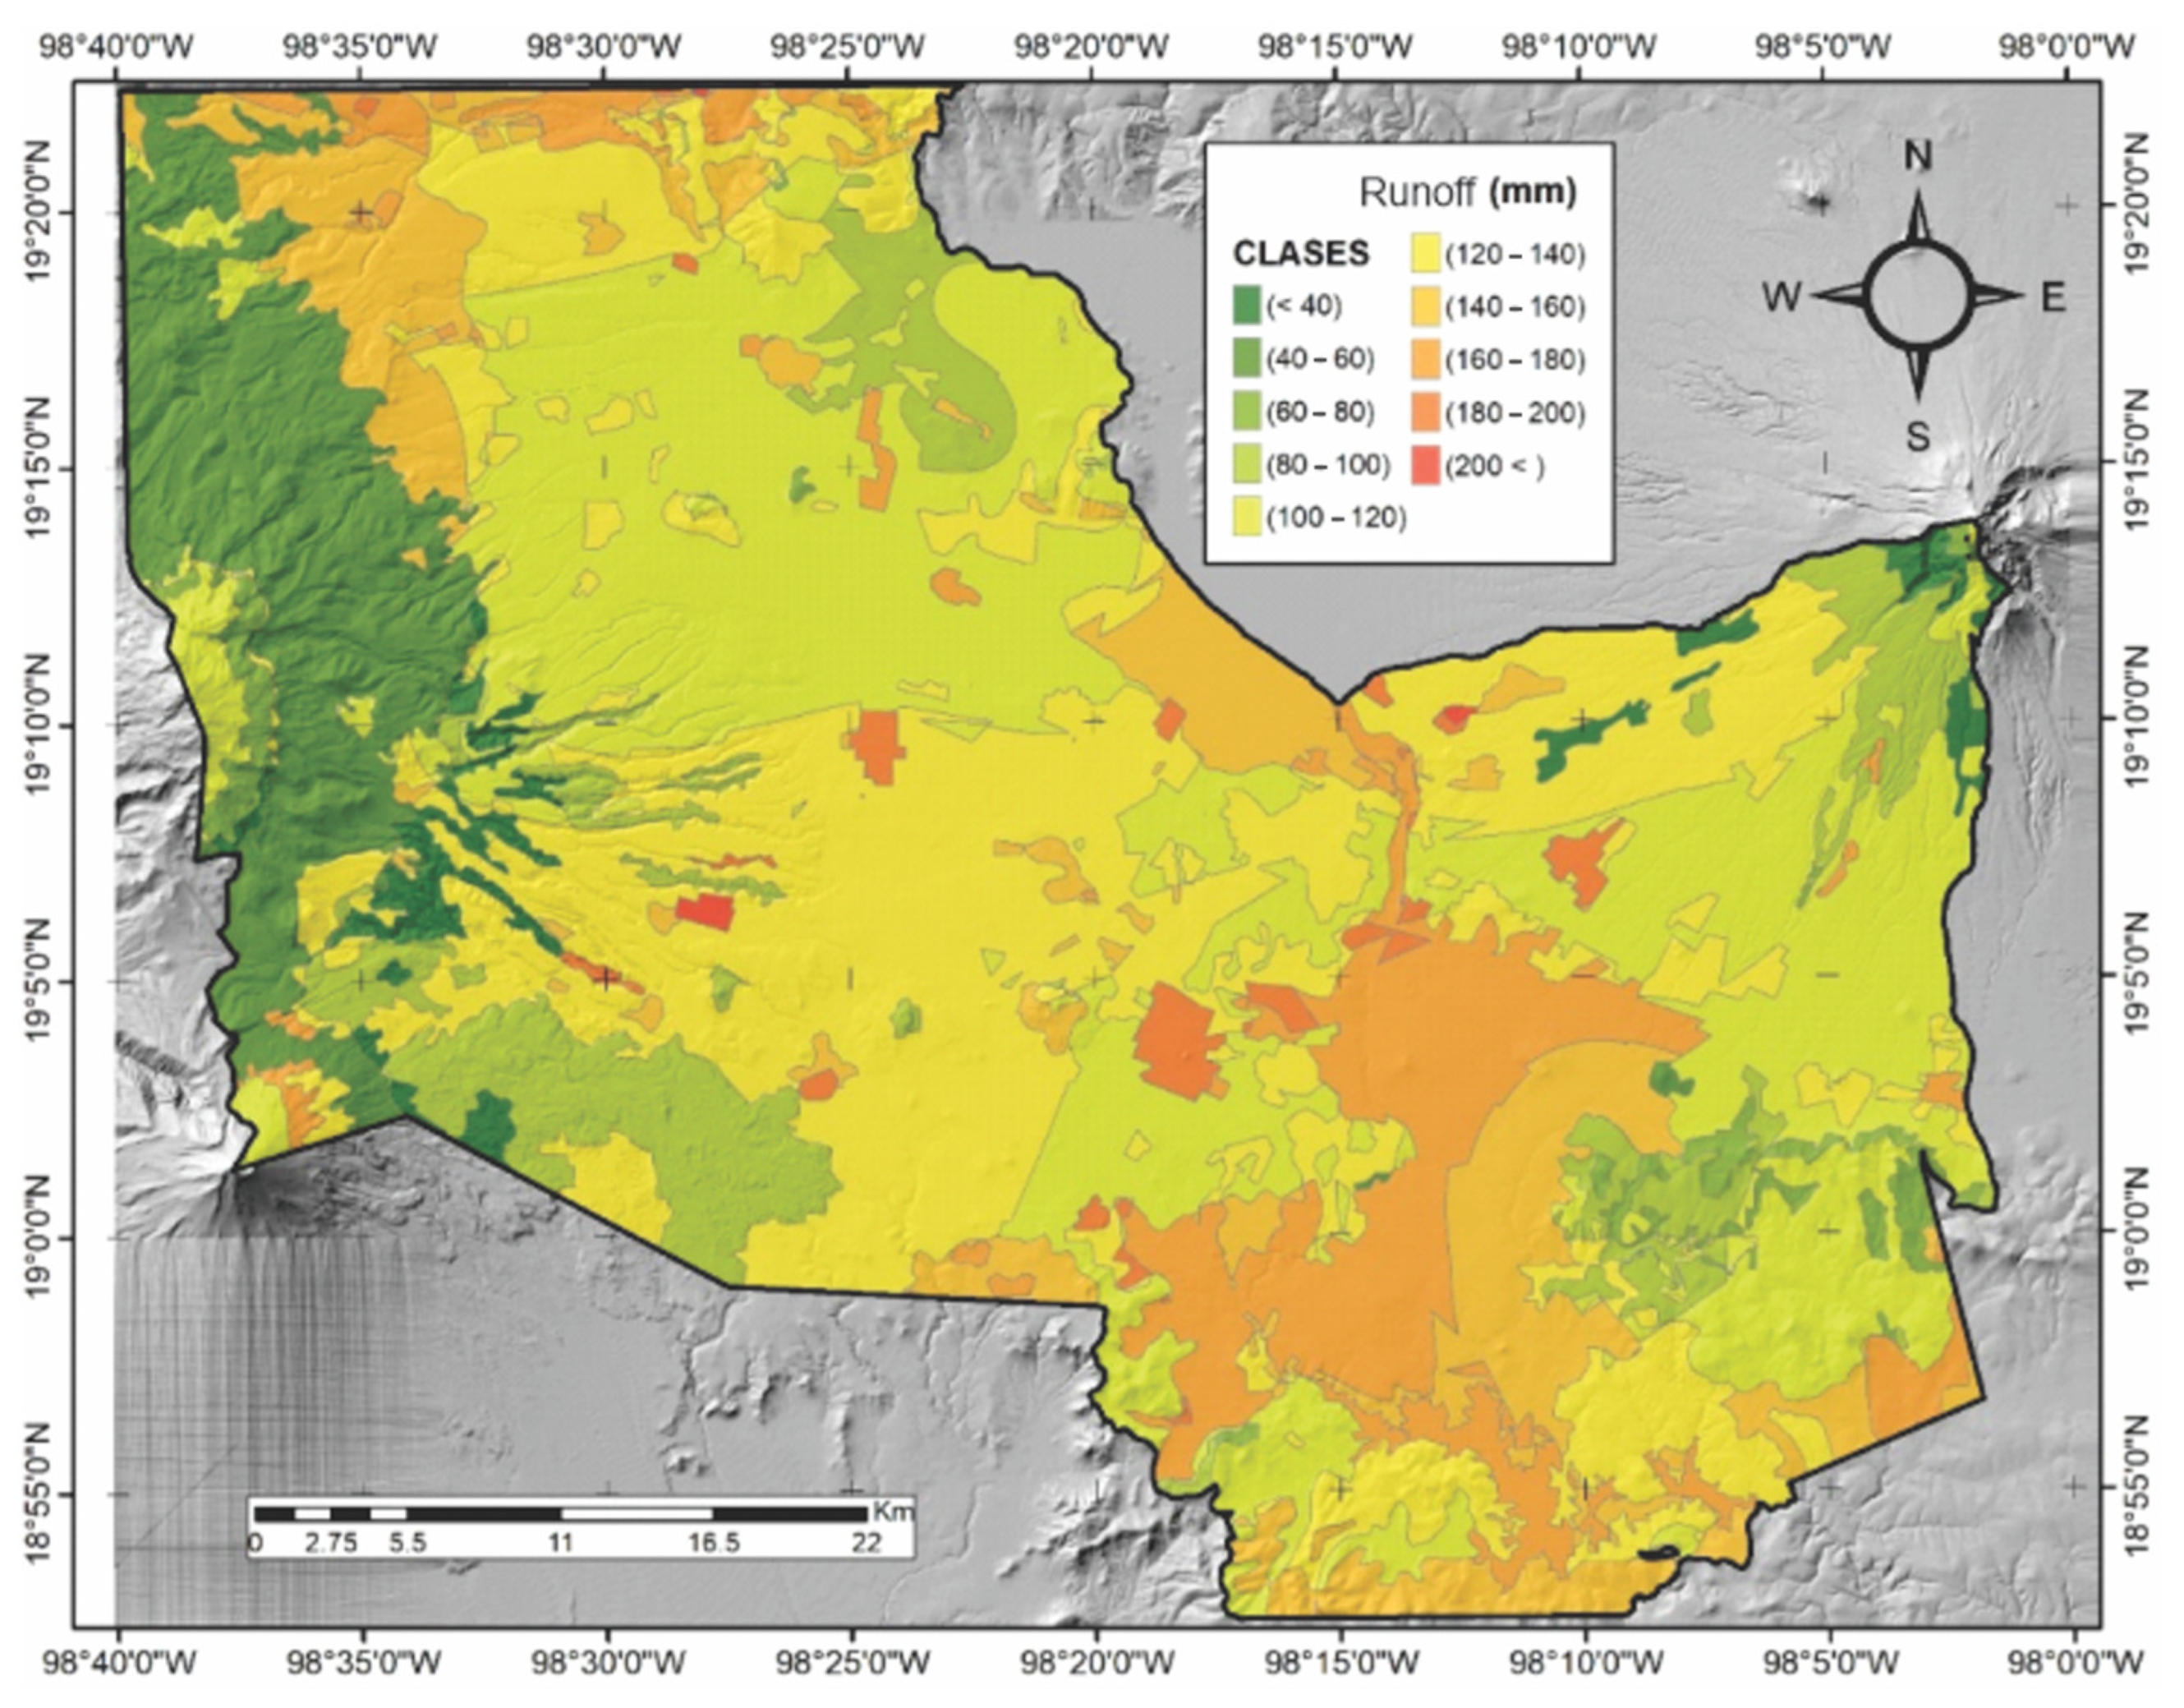
2.2.1. Estimation of the Hydrological Cycle in PVA
2.2.2. Estimating UWM in the PVA, Excluding the Central City of Puebla
2.2.3. UWM Estimation for Puebla Central City
2.3. Estimation of Water Flows without Official Records with Monte Carlo Simulation
2.3.1. Survey Data Collection
- The first survey comprised 30 questions addressed to the general public with the objective of collecting information on water service and consumption in dwellings. It was distributed online using Google Forms to informants selected using a snowball method (we acknowledge that a probabilistic sampling method is preferable to the non-probabilistic snowball sampling we used). The survey was written in colloquial language with multiple-choice answers accompanied by images to facilitate understanding by the non-specialized public. It was structured according to different thematic axes referring to information on dwelling infrastructure, water storage habits, and the intensity of water consumption obtained through tanker trucks and bottled water. In 2021, the survey was conducted on 256 residents in the context of COVID-19 pandemic preventive measures. Using this sampling method along with online tools like Google Forms helped us overcome the challenges imposed by limited research resources and pandemic health constraints. Other studies in the same context have successfully used a similar methodology [83].
- The second survey consisted of seven questions applied on-site to five LPWCs in 2021 to gather information on their purification processes and water supply areas.
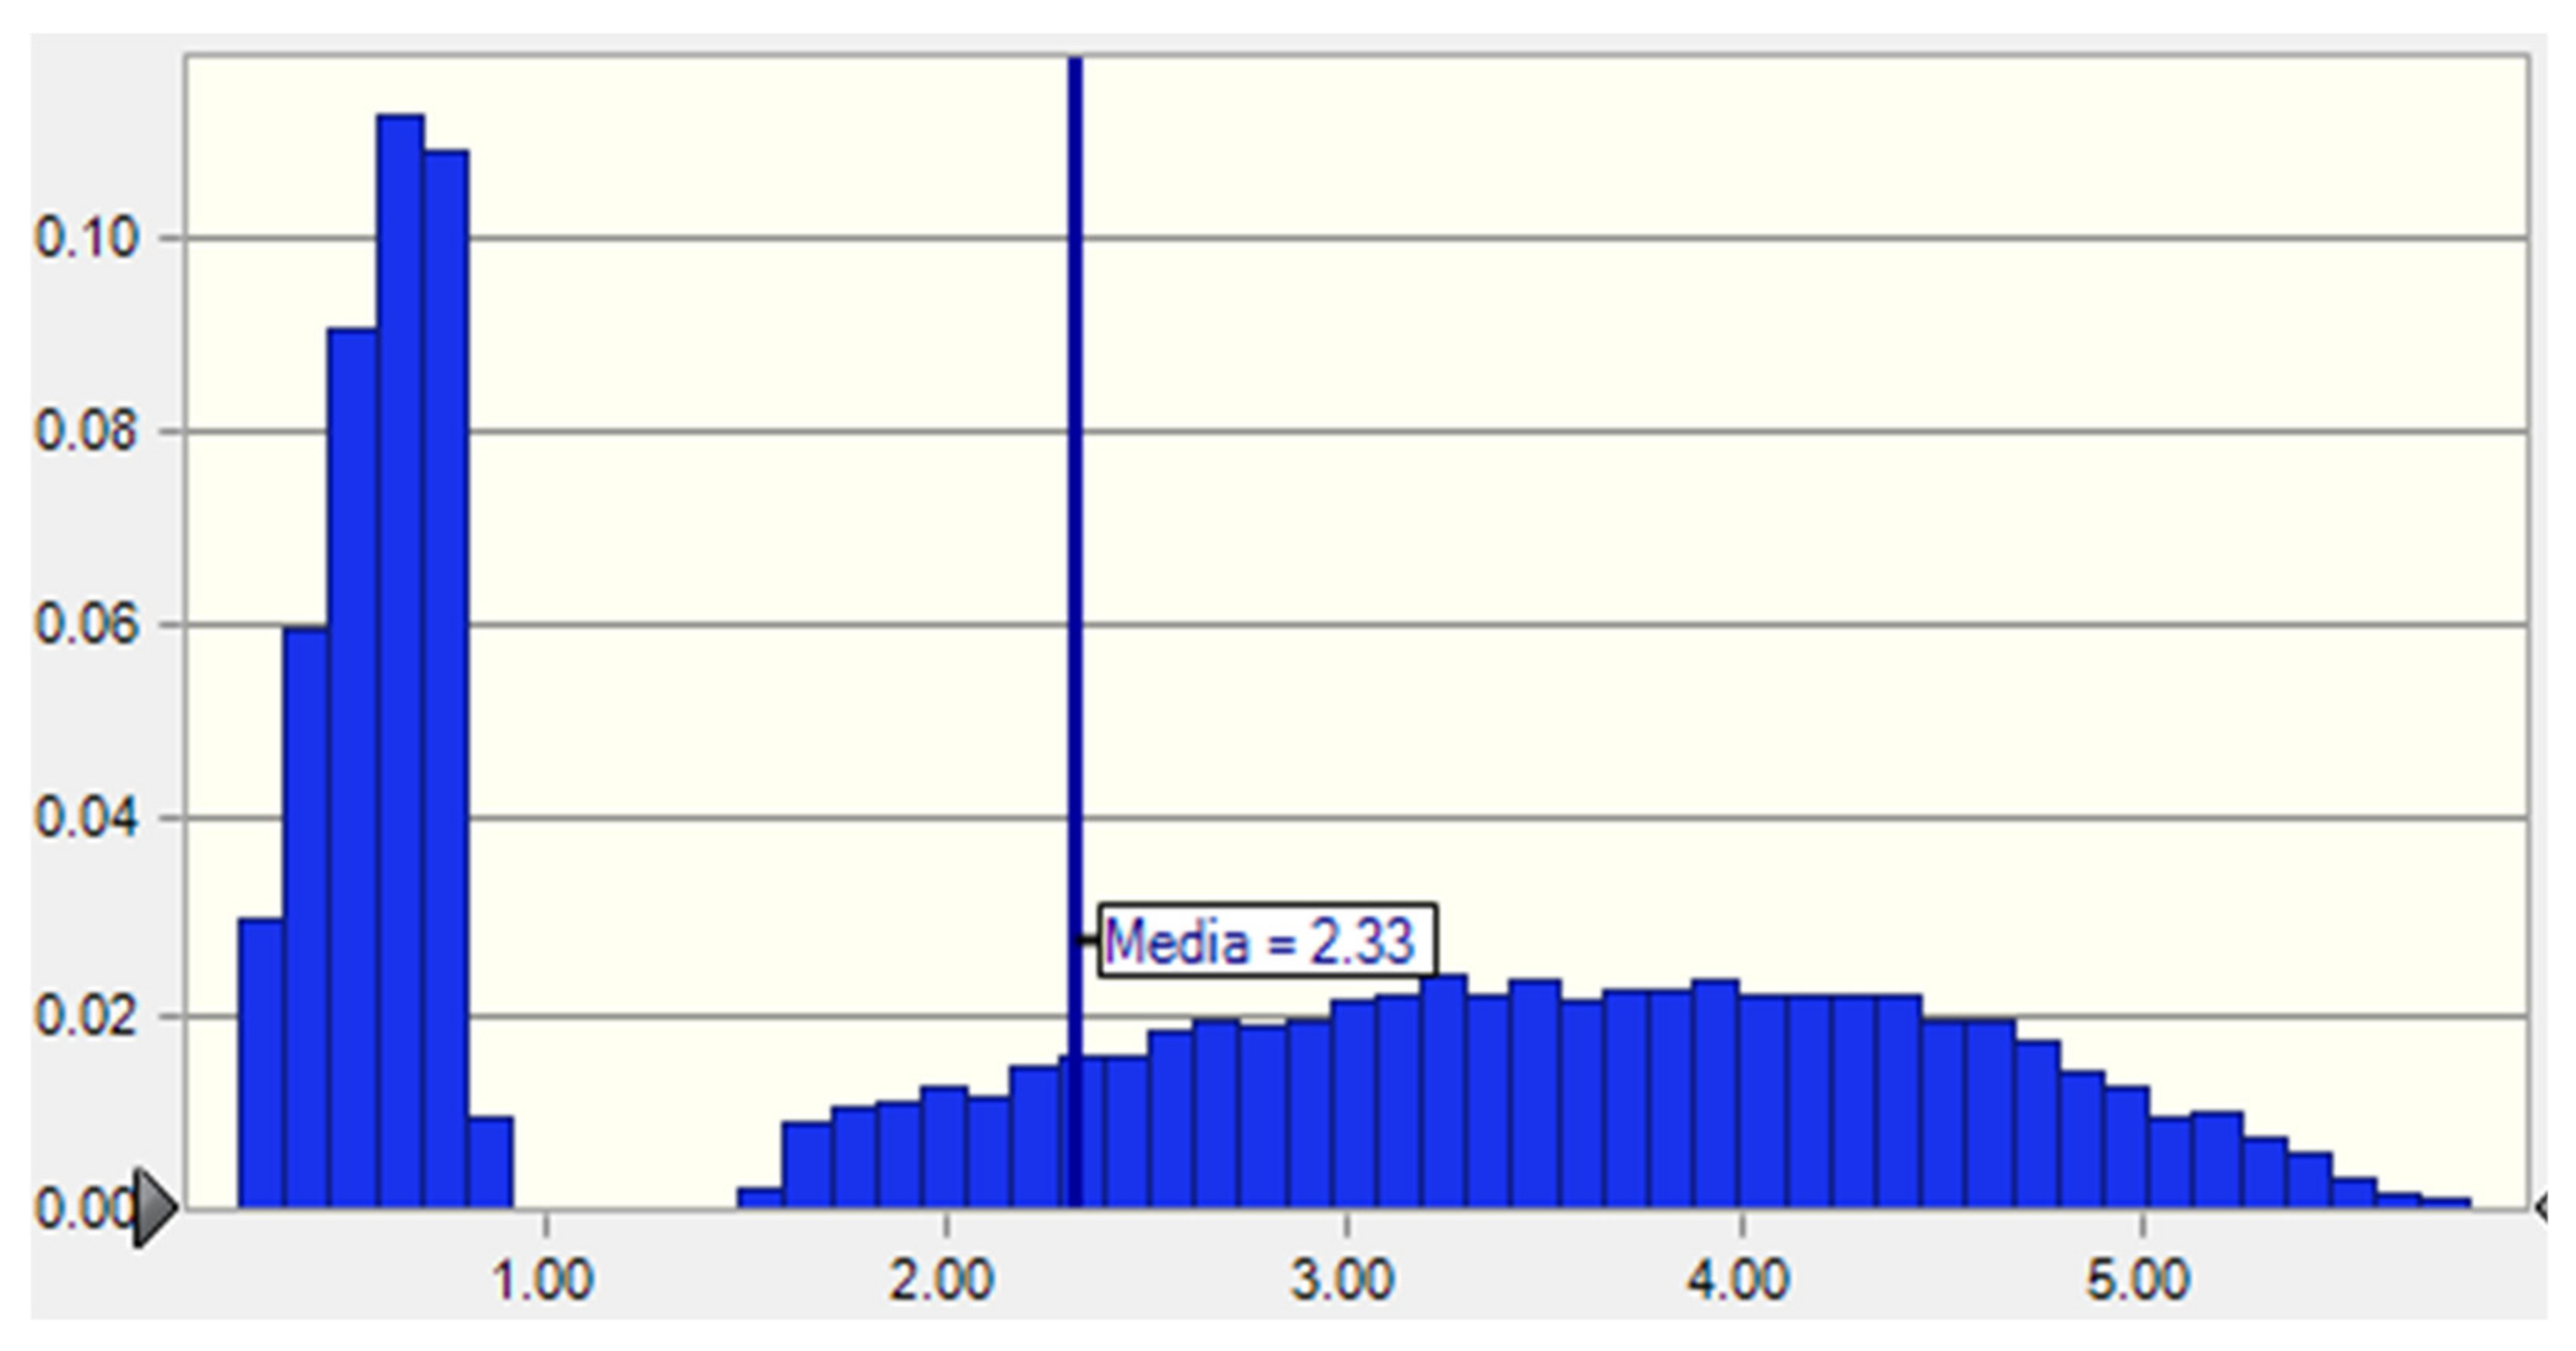
2.3.2. Monte Carlo Simulation for Water Flow Induction
2.3.3. Estimated Flow Rates Distributed by Tanker Truck in the Central City
2.3.4. Estimation of the Accumulation Capacity in City Dwellings
2.3.5. Bottled Water Flow Estimation
2.3.6. Estimating the Costs of Water Distributed in Tanker Trucks and Bottled Water
2.4. Energy Consumption and CO2e Emissions of the Water Utility
2.5. The Human Right to Water (HRW) Indicator and Efficiency (RHRW_E)
3. Results and Discussion
3.1. The UWM as an Embeded Element of the PVA Hydrological Cycle: The Biophysical Subsystem
3.2. Urban Water Metabolism in the PVA Region
3.2.1. UWM outside the Central City of Puebla
3.2.2. Water Appropriation for the Central City of Puebla
3.2.3. Water Treatment of the Water Utility in the Central City of Puebla
3.2.4. LPWCs Drinking Water Treatment in the Central City of Puebla
3.2.5. Water Distribution in Central City of Puebla
3.2.6. Tanker Trucked Transported and Bottled Water Flows in Central City of Puebla
3.2.7. Water Consumption in the Central City of Puebla
3.2.8. Water Uses in the Central City of Puebla
3.2.9. Water Excretion in the Central City of Puebla
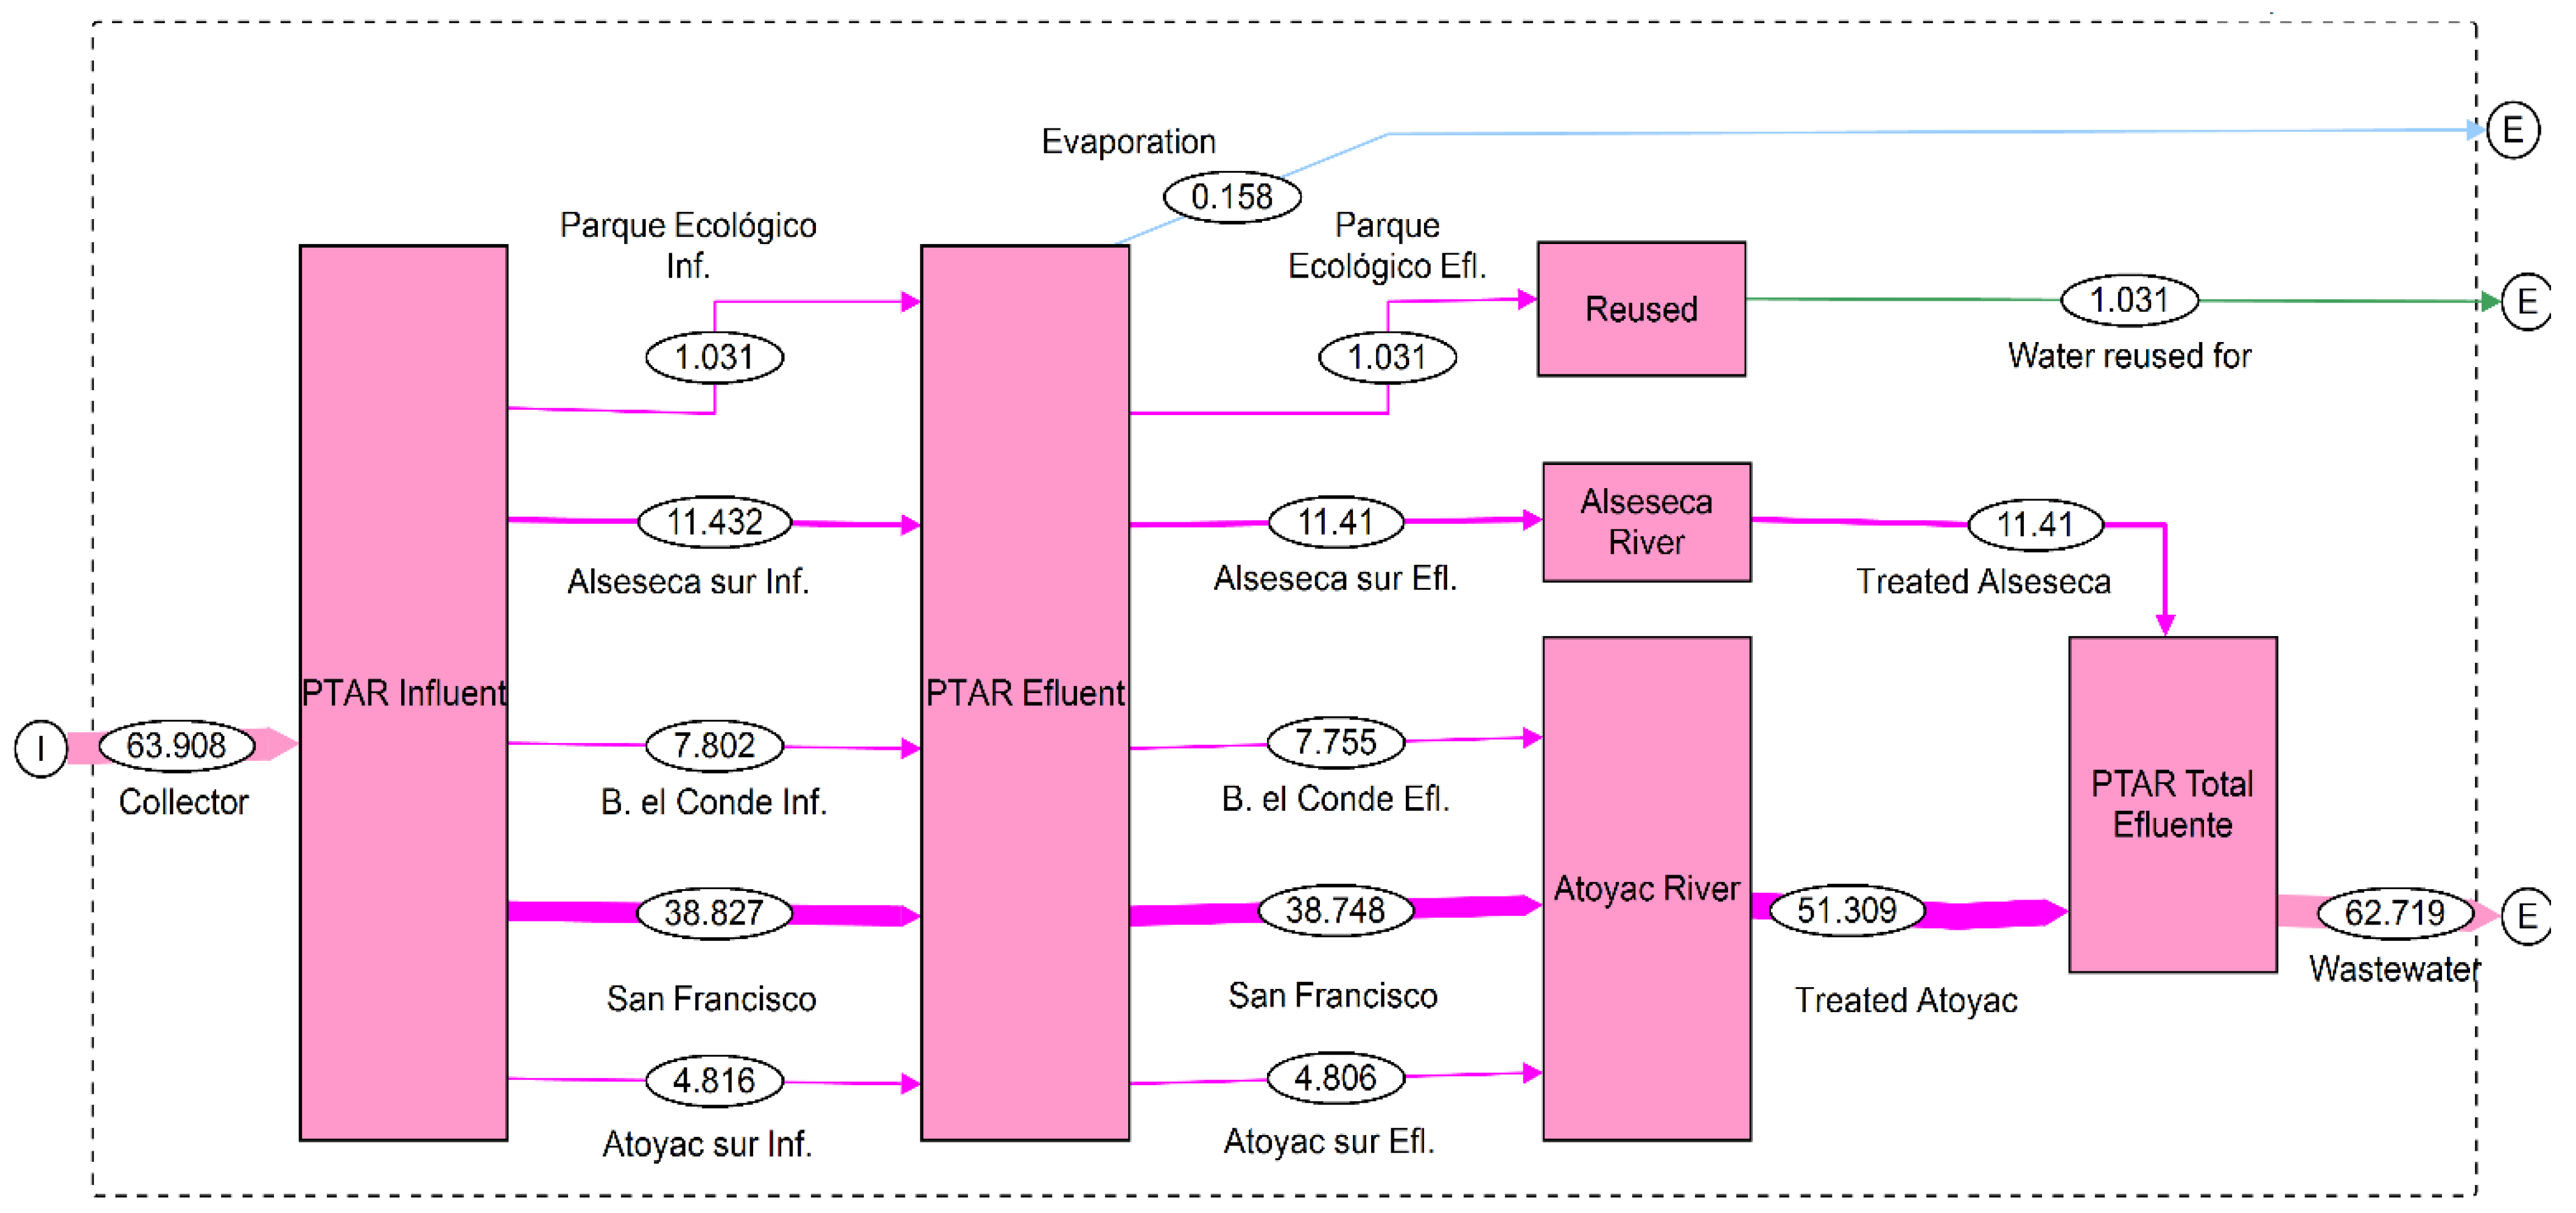
3.2.10. Wastewater Treatment in the Central City of Puebla
3.2.11. Water Evaporation in the Central City
3.3. Approximation to the Water-Energy-Carbon Nexus in the Central City of Puebla’s Utility System
3.4. Other Material Flows Related to Urban Water Metabolism in the Central City of Puebla
Water Treatment Chemicals in the Central City of Puebla Water Utility
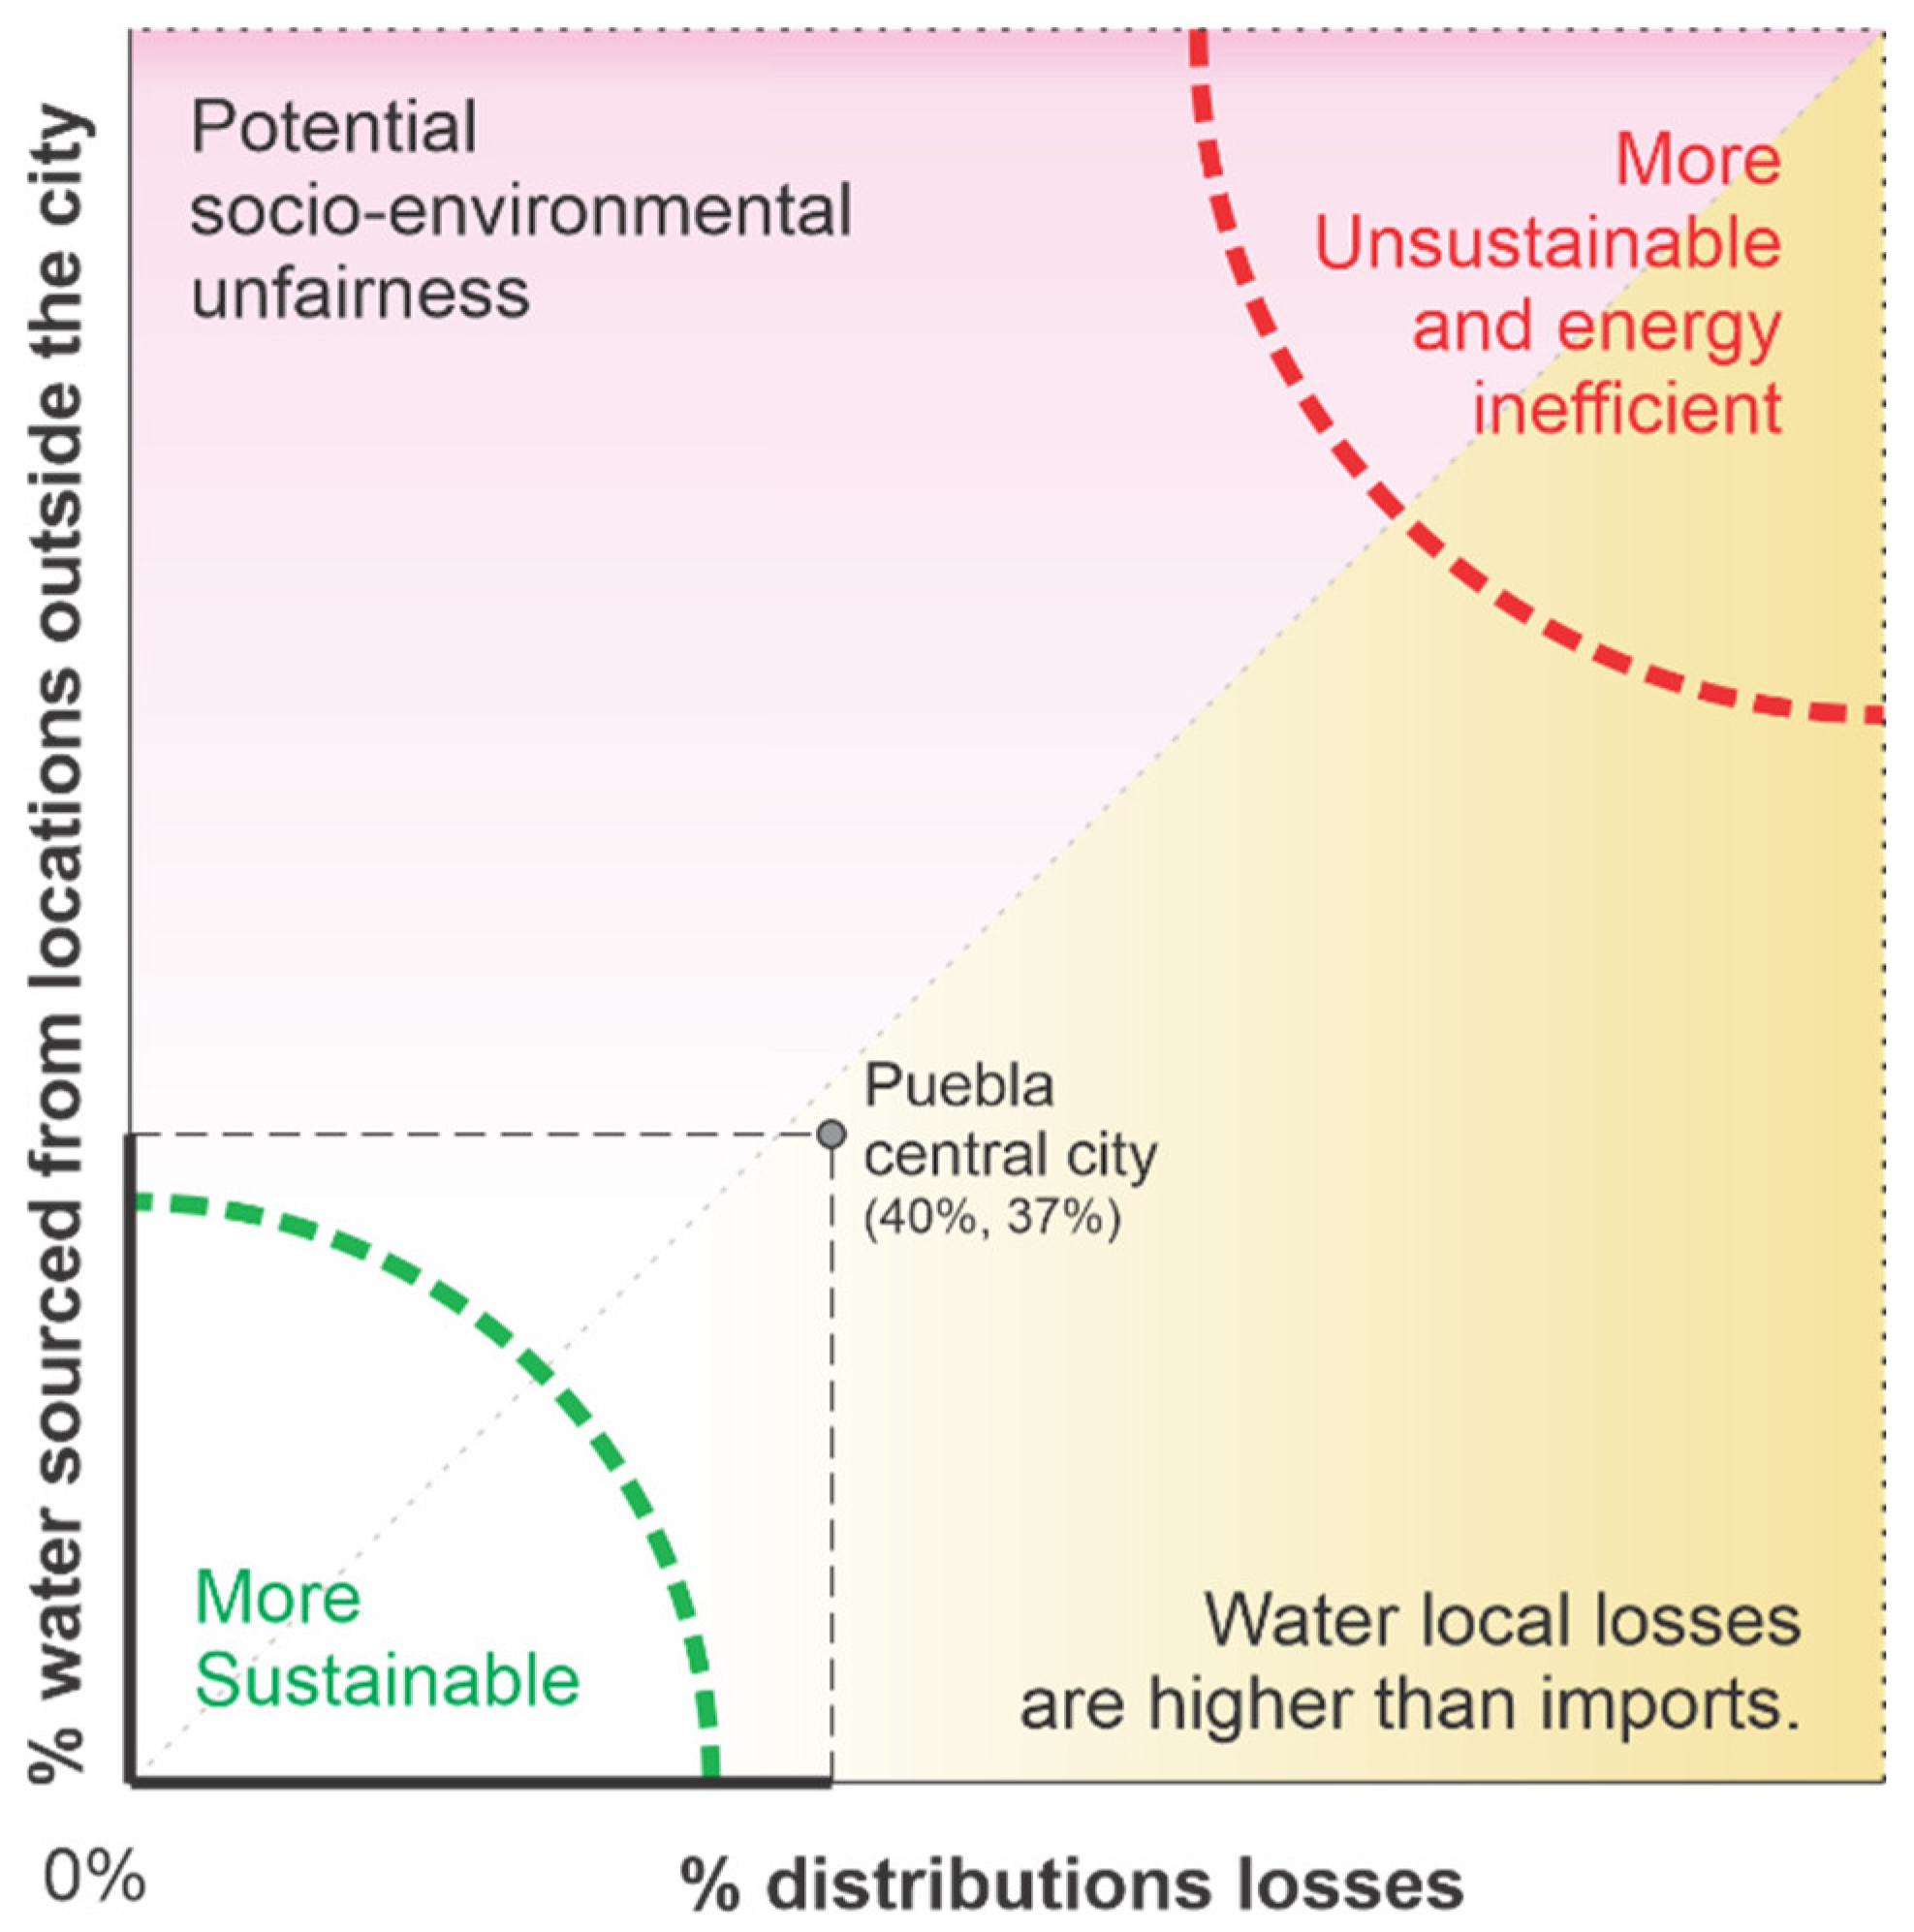
3.5. Elements of the Human Right to Water from the UWM Model in the Central City of Puebla
Accessibility, Affordability, and Accessibility of Water in the Central City of Puebla
3.6. Inconsistencies in the Data That Coincide with Water Related Problems
Comments on the Data Collected
4. Conclusions
Supplementary Materials
Author Contributions
Funding
Institutional Review Board Statement
Informed Consent Statement
Data Availability Statement
Acknowledgments
Conflicts of Interest
Appendix A

| Symbol | Variable | Unit | Source |
|---|---|---|---|
| Qtanker-t | Flow distributed by tanker truck. | Mm3/yr | Result |
| Qtanker-t,wt | Flow distributed by tanker trucks in households with water tank. | Mm3/yr | Result |
| Qtanker-t,cis | Flow distributed by tanker trucks in households with cisterns. | Mm3/yr | Result |
| Awt | Total accumulation capacity in dwellings with water tank. | Mm3 | Result |
| Acis | Total accumulation capacity in dwellings with cistern. | Mm3 | Result |
| Av | Total accumulation capacity in all dwellings. | Mm3 | Result |
| Ac | Accumulation capacity in individual homes with cisterns. | (Lt/hh) | Survey * |
| Pc | Number of tanker trucks per year supplied to dwellings with cistern. | (tt/yr) | Survey * |
| Rc | The ratio of households with a cistern to total households. | (adimensional) | 2020 census |
| Mcp | The ratio of households with cisterns using tanker trucks to total number of households with cisterns. | (adimensional) | Survey |
| At | Accumulation capacity in individual homes without a cistern. | (Lt/hh) | Survey |
| Pt | The number of annual tanker trucks that supplied homes without a cistern. | (tt/yr) | Survey * |
| Rt | The ratio of households without a cistern to total households. | (adimensional) | 2020 census |
| Mtp | The ratio of households without a cistern using a tanker truck to the total number of households without a cistern. | (adimensional) | Survey |
| V | Total housing in SOAPAP coverage. | (dwellings) | SOAPAP |
| Symbol | Variable | Unit | Source |
|---|---|---|---|
| Qe | Bottled water flow rate. | Mm3/yr | Result |
| Qem | The flow rate of gran-de brand bottled water | Mm3/yr | Result |
| Qer | The flow rate of bottled water at LPWCs | Mm3/yr | Result |
| Qem1 | Big Brand bottled water in carboy’s | Mm3/yr | Result |
| Qem2 | Big Brand bottled water in 5 L carafes | Mm3/yr | Result |
| Qem3 | Big Brand bottled water in 1.5 bottles | Mm3/yr | Result |
| Lv1 | Liters of water distributed in Big Brand carboys | (Lt/d/hh) | Survey * |
| Lv2 | Liters of water distributed in Big Brand 5 L carafes | (Lt/d/hh) | Survey * |
| Lv3 | Liters of water distributed in Big Brand 1.5 L bottles | (Lt/d/hh) | Survey * |
| Lv4 | Liters of water distributed in LPWC carboys. | (Lt/d/hh) | Survey * |
| Rba | The ratio of households consuming bottled water to total households. | (adimensional) | Survey * |
| Symbols | Variable | Unit | Source of Information |
|---|---|---|---|
| Ctanker-t, Cem1, Cem2, Cem3, Cem4 | Capacity of each type of container | Mm3/yr | Market |
| Rtanker-t, Rem1, Rem2, Rem3, Rer | Number of each type of container | Container’s | Equation result |
| Putanker-t, Puem1, Puem2, Puem3, Puer | The unit price of each type of container | $/container | Price (2021) * |
| Pttanker-t, Ptem1, Ptem2, Ptem3, Pter | The total cost of each type of container | (Lt/day/hh) | Equation result |
Appendix B
| Symbol | Minimum | Mode | Maximum | Single Value | Correlation | With the Variable | Assumed Distribution |
|---|---|---|---|---|---|---|---|
| Water supplied by tanker truck | |||||||
| Ac | 3100 | 7203 | 11,600 | - | 0.95 | Atm | Beta PERT |
| Pc | 1 | 2.836 | 24 | - | - | - | Beta PERT |
| Rc | - | - | - | 0.590 | −1 | Rc | Yes-No |
| Mcp | - | - | - | 0.307 | - | - | Yes-No |
| At | 450 | 1346 | 1600 | - | 0.95 | Acm | Beta PERT |
| Pt | 1 | 3.322 | 24 | - | - | - | Beta PERT |
| Rt | - | - | - | 0.410 | −1 | Rt | Yes-No |
| Mtp | - | - | - | 0.230 | - | - | Yes-No |
| Vt | - | - | - | 506,019 | - | - | Unique value |
| Bottled water supply | |||||||
| Ladr | 0 | 2.389 | 31.429 | - | −0.562 | Qem | Triangular |
| Lad1 | 0 | 0.570 | 20 | - | 0.106 | Lad3 | Beta PERT |
| Lad2 | 0 | 0.008 | 2.143 | - | −0.000 | Lad1 | Beta PERT |
| Lad3 | 0 | 0.059 | 2.357 | - | 0.290 | Lad2 | Beta PERT |
| Rba | - | - | - | 0.902 | - | - | Yes-No |
Appendix C

References
- Ferrao, P.; Fernández, J.E. Sustainable Urban Metabolism; MIT Press: London, UK, 2013; ISBN 978-0-262-01936-1. [Google Scholar]
- United Nation. World Urbanization Prospects: The 2018 Revision; United Nation: New York, NY, USA, 2018; Volume 12. [Google Scholar]
- PNUMA. El Peso de Las Ciudades En América Latina y El Caribe: Requerimientos Futuros de Recursos y Potenciales Rutas de Actuación; PNUMA: Clayton, NC, USA, 2021; ISBN 9789280739022. [Google Scholar]
- Kennedy, C.; Cuddihy, J.; Engel-Yan, J. The Changing Metabolism of Cities. J. Ind. Ecol. 2007, 11, 43–59. [Google Scholar] [CrossRef]
- Mankin, J.S.; Seager, R.; Smerdon, J.E.; Cook, B.I.; Williams, A.P. Mid-Latitude Freshwater Availability Reduced by Projected Vegetation Responses to Climate Change. Nat. Geosci. 2019, 12, 983–988. [Google Scholar] [CrossRef]
- IPCC. Climate Change 2022—Impacts, Adaptation and Vulnerability—Summary for Policymakers; Hans-Otto, P., Roberts, D., M.B. Tignor, M., Poloczanska, E., Mintenbelck, K., Alegría, A., Craig, M., Langsdorf, S., Löschke, S., et al., Eds.; Springer: Cham, Switzerland, 2022. [Google Scholar]
- WHO; UNEP; IPCC; WGI. Interactive Atlas. Available online: https://interactive-atlas.ipcc.ch/ (accessed on 30 June 2023).
- Granados, H.D. Climate Change vs. Volcanic Activity: Forcing Mexican Glaciers to Extinguish and Related Hazards. In Proceedings of the First International Conference on the Impact of Climate Change: On High-Mountain Systems, Bogota, Colombia, 21–23 November 2005; Available online: https://www.researchgate.net/publication/266573352_Climate_change_vs_Volcanic_activity_Forcing_Mexican_glaciers_to_extinguish_and_related_hazards (accessed on 30 June 2023).
- Necoechea, R.R.; Meraz, I.V.; Ramirez, J.F.H. Mexico’s Glaciers and Their Close Disappearance: A Precise Thermometer of the Global Warming Advance on a Global Scale. Curr. World Environ. 2013, 8, 391–394. [Google Scholar] [CrossRef]
- INECC. Programa de Gestión Federal Para Mejorar La Calidad Del Aire de La Megalópolis. 2016, Volume 15. Available online: https://www.gob.mx/comisionambiental/documentos/acciones-estrategicas-para-mejorar-la-calidad-del-aire-de-la-megalopolis-aecam-2017-2030 (accessed on 20 November 2021).
- SEDATU; SEGIB; CONAPO. Sistema Urbano Nacional 2018. 2018. Available online: https://www.gob.mx/conapo/documentos/sistema-urbano-nacional-2018 (accessed on 20 May 2022).
- CONAGUA. Actualización de La Disponibilidad Media Anual de Agua En El Acuífero Vallde De Puebla (2104); CONAGUA: Puebla, Mexico, 2015. [Google Scholar]
- CONAGUA. Actualización de La Disponibilidad Media Anual de Agua En El Acuífero Valle de Puebla (2104); Estado de Puebla; CONAGUA: Puebla, Mexico, 2020. [Google Scholar]
- Delgado-Ramos, G.C.; Maryke van, S.; Franco Villaseñor, E. Diálogo Mexicano de Talanoa; Primera, Ed.; CEIICH: Mexico City, Mexico, 2018; Volume 39, ISBN 9786073009461. [Google Scholar]
- Zhang, Y. Urban Metabolism: A Review of Research Methodologies. Environ. Pollut. 2013, 178, 463–473. [Google Scholar] [CrossRef] [PubMed]
- Kenway, S.J. The Water-Energy Nexus and Urban Metabolism—Connections in Cities; University of Queensland: Brisbane, Australia, 2013; pp. 1–62. [Google Scholar]
- Wolman, A. The Metabolism of Cities. Sci. Am. 1965, 213, 178–193. [Google Scholar] [CrossRef]
- Un-Habitat. Global Environment for Cities-GEO for Cities: Towards Green and Just Cities; UN: New York, NY, USA, 2021. [Google Scholar]
- Delgado-Ramos, G.C. Complejidad e Interdisciplina En Las Nuevas Perspectivas Socio-Ecológicas: El Caso de La Ecología Política Urbana Anclada En Nociones Metabólicas. Let. Verdes. Rev. Latinoam. De Estud. Socioambientales 2015, 17, 108–130. [Google Scholar] [CrossRef]
- Broto, V.C.; Allen, A.; Rapoport, E. Interdisciplinary Perspectives on Urban Metabolism. J. Ind. Ecol. 2012, 16, 851–861. [Google Scholar] [CrossRef]
- Renouf, M.A.; Serrao-Neumann, S.; Kenway, S.J.; Morgan, E.A.; Low Choy, D. Urban Water Metabolism Indicators Derived from a Water Mass Balance—Bridging the Gap between Visions and Performance Assessment of Urban Water Resource Management. Water Res. 2017, 122, 669–677. [Google Scholar] [CrossRef]
- Kenway, S.; Gregory, A.; McMahon, J. Urban Water Mass Balance Analysis. J. Ind. Ecol. 2011, 15, 693–706. [Google Scholar] [CrossRef]
- Paul, R.; Kenway, S.; McIntosh, B.; Mukheibir, P. Urban Metabolism of Bangalore City: A Water Mass Balance Analysis. J. Ind. Ecol. 2018, 22, 1413–1424. [Google Scholar] [CrossRef]
- Huang, C.L.; Vause, J.; Ma, H.W.; Yu, C.P. Urban Water Metabolism Efficiency Assessment: Integrated Analysis of Available and Virtual Water. Sci. Total Environ. 2013, 452–453, 19–27. [Google Scholar] [CrossRef]
- Fan, J.-L.; Kong, L.-S.; Wang, H.; Zhang, X. A Water-Energy Nexus Review from the Perspective of Urban Metabolism. Ecol. Modell. 2019, 392, 128–136. [Google Scholar] [CrossRef]
- Meng, F.; Liu, G.; Liang, S.; Su, M.; Yang, Z. Critical Review of the Energy-Water-Carbon Nexus in Cities. Energy 2019, 171, 1017–1032. [Google Scholar] [CrossRef]
- Lee, M.; Keller, A.A.; Chiang, P.C.; Den, W.; Wang, H.; Hou, C.H.; Wu, J.; Wang, X.; Yan, J. Water-Energy Nexus for Urban Water Systems: A Comparative Review on Energy Intensity and Environmental Impacts in Relation to Global Water Risks. Appl. Energy 2017, 205, 589–601. [Google Scholar] [CrossRef]
- Venkatesh, G.; Chan, A.; Brattebø, H. Understanding the Water-Energy-Carbon Nexus in Urban Water Utilities: Comparison of Four City Case Studies and the Relevant Influencing Factors. Energy 2014, 75, 153–166. [Google Scholar] [CrossRef]
- Kumar, P.; Saroj, D.P. Water-Energy-Pollution Nexus for Growing Cities. Urban. Clim. 2014, 10, 846–853. [Google Scholar] [CrossRef]
- Landa-Cansigno, O.; Behzadian, K.; Davila-Cano, D.I.; Campos, L.C. Performance Assessment of Water Reuse Strategies Using Integrated Framework of Urban Water Metabolism and Water-Energy-Pollution Nexus. Environ. Sci. Pollut. Res. 2020, 27, 4582–4597. [Google Scholar] [CrossRef]
- Scott, C.A. The Water-Energy-Climate Nexus: Resources and Policy Outlook for Aquifers in Mexico. Water Resour. Res. 2011, 47, 6. [Google Scholar] [CrossRef]
- Arora, M.; Yeow, L.W.; Cheah, L.; Derrible, S. Assessing Water Circularity in Cities: Methodological Framework with a Case Study. Resour. Conserv. Recycl. 2022, 178, 106042. [Google Scholar] [CrossRef]
- Baldassarre, B.; Schepers, M.; Bocken, N.; Cuppen, E.; Korevaar, G.; Calabretta, G. Industrial Symbiosis: Towards a Design Process for Eco-Industrial Clusters by Integrating Circular Economy and Industrial Ecology Perspectives. J. Clean. Prod. 2019, 216, 446–460. [Google Scholar] [CrossRef]
- Hong, Y.; Park, J. Exploring Circular Water Options for a Water-Stressed City: Water Metabolism Analysis for Paju City, South Korea. Sustain. Cities Soc. 2023, 89, 104355. [Google Scholar] [CrossRef]
- Chigeza, P. Water-Energy-Carbon Systems: Transitioning Fron Linear to Circular Economy, 1st ed.; Austing Maculey Publishers LLC: New York, NY, USA, 2019; ISBN 9781645360155. [Google Scholar]
- Gandy, M. Rethinking Urban Metabolism: Water, Space and the Modern City. City 2004, 8, 363–379. [Google Scholar] [CrossRef]
- Ernstson, H.; Swyngedouw, E. Urban Political, Ecology in the Anthropo-Obscene: Interruptions and Possibilities; Routledge: London, UK, 2018; pp. 1–272. [Google Scholar] [CrossRef]
- De López Zamora, R.J. La Privatización de Los Servicios de Agua Potable y Saneamiento En La Ciudad de Puebla y Zona Conurbada: Gestión y Movimiento Social Por El Agua En México; Montiel & Soriano, Ed.: Puebla City, Mexico, 2022; Volume 21, ISBN 9789896540821. [Google Scholar]
- De López Zamora, R.J. Sujetos Sociales, Conflictos y Gestión de Los Servicios de Agua Potable, Alcantarillado y Saneamiento En El “Espacio Social-Natural” de La Ciudad de Puebla 1984–2010. 2013. Available online: http://www.eco.buap.mx/posgrado/index.php/publicaciones/tesis/item/sujetos-sociales-pequenas-obras-hidraulicas-procesos-productivos-y-desarrollo-el-caso-de-los-jagueeyes-y-la-acuacultura-rural-en-tlaxcala (accessed on 20 November 2022).
- Zamora, R.d.J.L. Gestión Del Agua Urbana e Industrialización En La Ciudad de Puebla. Desarrollo Local. Sostenible 2013, 6, 1–14. [Google Scholar]
- Delgado-Ramos Gian Carlo Sobre La Ecología Política Urbana: Una Revisión Panorámica. In Ecología Política Urbana Ante el Cambio Climático; FLACSO: Quito, Ecuador, 2021; pp. 23–36.
- Luna-Nemecio, J. Sustentabilidad y Economía Política Del Agua En Morelos: Relaciones de Poder, Problemas e Inconsistencias En La Contabilidad Hídrica Oficial Por Parte Del Estado Mexicano; Religación Press: Quito, Ecuador, 2021; ISBN 9788490225370. [Google Scholar]
- Luna Nemecio, J. El Metabolismo Urbano-Rural Del Agua, Actores Sociales y Gestión de Los Recursos Hídricos Público Urbano de La Ciudad de Cuatla, Morelos (2006–2013). Rev. Geogr. Espac. 2015, 5, 43–62. [Google Scholar] [CrossRef]
- Napoletano, B.M.; Paneque-Gálvez, J.; Méndez-Lemus, Y.; Vieyra, A. Geographic Rift in the Urban Periphery, and Its Concrete Manifestations in Morelia, Mexico. J. Lat. Am. Geogr. 2019, 18, 38–64. [Google Scholar] [CrossRef]
- McCulligh, C.; Fregoso, G.V. Defiance from Down River: Deflection and Dispute in the Urban-Industrial Metabolism of Pollution in Guadalajara. Sustainability 2019, 11, 6294. [Google Scholar] [CrossRef]
- Salazar, R.; Rojano, A.; López, I. Energy and Environmental Costs Related to Water Supply in Mexico City. Water Sci. Technol. Water Supply 2012, 12, 768–772. [Google Scholar] [CrossRef]
- García-Serna, M.; Morales-Pinzón, T.; Guerrero Erazo, J. Análisis de Flujos de Agua En Áreas Metropolitanas Desde La Perspectiva Del Metabolismo Urbano. Luna Azul 2014, 39, 234–249. [Google Scholar] [CrossRef]
- Landa-cansigno, O.; Behzadian, K.; Cano, D.D. Water-Energy-Pollutant Nexus Assessment of Water Reuse Strategies in Urban Water Systems Using Metabolism Based Approach. In Proceedings of the Water Efficiency Conference 2018, Aveiro, Portugal, 5–7 September 2018; Volume 44. [Google Scholar]
- Delgado-Ramos, G.C. Climate-Environmental Governance in the Mexico Valley Metropolitan Area: Assessing Local Institutional Capacities in the Face of Current and Future Urban Metabolic Dynamics. World 2021, 2, 32–48. [Google Scholar] [CrossRef]
- Townsend, D.A.; Sušnik, J.; van der Zaag, P. Domestic Water Supply Vulnerability to Climate Change and the Role of Alternative Water Sources in Kingston, Jamaica. Atmosphere 2020, 11, 1314. [Google Scholar] [CrossRef]
- Gutiérrez-Espinosa, G.M. Material Flow Analysis of the Urban Water System in Tepic Mexico: Integral Evaluation and Improvement Options. Ph.D. Thesis, Technische Universität Hamburg, Hamburg, Germany, 2016. [Google Scholar]
- Delgado-Ramos, G.C.; Blanco, H. La Transformación de La Infraestructura de Agua Ante El Cambio Climático. In Ciudades Sensibles al Cambio Climático; Universidad Nacional Autónoma de México: Mexico City, Mexico, 2018; pp. 265–320. [Google Scholar]
- Loreto-López, R. Escasez, Guerras y Desigualdad Social. El Proyecto Modernizador Del Sistema de Abasto Hídrico de Una Ciudad Mexicana: Puebla, Siglos XVII-XX. Agua Territ. 2016, 7, 75. [Google Scholar] [CrossRef][Green Version]
- Juárez Flores, J.J. Entre Fulgores de Ángeles y Máculas de Tizne: Energía, Metabolismo y Degradación Ecológica En El Valle de Puebla-Tlaxcala, 1530–1820. Hist. Caribe 2015, 10, 175–210. [Google Scholar] [CrossRef]
- Castresana, G.P.; Flores, V.T.; Reyes, L.L.; Aldana, F.H.; Vega, R.C.; Perales, J.L.M.; Suastegui, W.A.G.; Fonseca, A.D.; Silva, A.H. Atoyac River Pollution in the Metropolitan Area of Puebla, México. Water 2018, 10, 267. [Google Scholar] [CrossRef]
- Castresana, G.P.; Roldán, E.C.; Suastegui, W.A.G.; Perales, J.L.M.; Montalvo, A.C.; Silva, A.H. Evaluation of Health Risks Due to Heavy Metals in a Rural Population Exposed to Atoyac River Pollution in Puebla, Mexico. Water 2019, 11, 277. [Google Scholar] [CrossRef]
- Estrada, A.; García, W.A.; Chavez, E.; Castelan, R.; Zayas, M.T.; Treviño, S.; Diaz, A.; Handal, A. Mixture of Toxic Metals and Volatile Organic Compounds in a River Induces Cytotoxicity. J. Chem. 2022, 2022, 1285826. [Google Scholar] [CrossRef]
- Estrada-Rivera, A.; Díaz Fonseca, A.; Treviño Mora, S.; García Suastegui, W.A.; Chávez Bravo, E.; Castelán Vega, R.; Morán Perales, J.L.; Handal-Silva, A. The Impact of Urbanization on Water Quality: Case Study on the Alto Atoyac Basin in Puebla, Mexico. Sustainability 2022, 14, 667. [Google Scholar] [CrossRef]
- Hernández, J.H.C. Historical Origin of Water Pollution and Legal Analysis of the Atoyac River. Tecnologia y Ciencias del Agua 2021, 12, 133–191. [Google Scholar] [CrossRef]
- Ibarrán, M.E.; Saldaña-Vázquez, R.A.; Pérez-García, T. The Cost of Pollution in the Upper Atoyac River Basin: A Systematic Review. arXiv 2021, arXiv:2103.00095. [Google Scholar]
- Shruti, V.C.; Jonathan, M.P.; Rodriguez-Espinosa, P.F.; Rodríguez-González, F. Microplastics in Freshwater Sediments of Atoyac River Basin, Puebla City, Mexico. Sci. Total Environ. 2019, 654, 154–163. [Google Scholar] [CrossRef]
- Martinez-Tavera, E.; Rodriguez-Espinosa, P.F.; Shruti, V.C.; Sujitha, S.B.; Morales-Garcia, S.S.; Muñoz-Sevilla, N.P. Monitoring the Seasonal Dynamics of Physicochemical Parameters from Atoyac River Basin (Puebla), Central Mexico: Multivariate Approach. Environ. Earth Sci. 2017, 76, 95. [Google Scholar] [CrossRef]
- Mora, A.; García-Gamboa, M.; Sánchez-Luna, M.S.; Gloria-García, L.; Cervantes-Avilés, P.; Mahlknecht, J. A Review of the Current Environmental Status and Human Health Implications of One of the Most Polluted Rivers of Mexico: The Atoyac River, Puebla. Sci. Total Environ. 2021, 782, 146788. [Google Scholar] [CrossRef]
- Rodríguez-Espinoza, P.F.; Morales-García, S.S.; Jonathan, M.P.; Navarrete-Lopez, M.; Bernal-Campos, A.A.; Gonzales, C.; Muñoz-Sevilla, N.P. Servicio Ambiental de La Presa Valsequillo Para Las Cuencas de Los Ríos Del Atoyac-Sahuapan y Alseseca, Puebla, Tlaxcala, México. In Instituto Nacional de Ecología y Cambio Climatico (INECC). Secretaria de medio Ambiente y Recursos Naturales (SEMARNAT). 2011, pp. 1–10. Available online: http://www.inecc.gob.mx/descargas/cuencas/2011_cnch2_mon_prodriguez.pdf (accessed on 14 July 2022).
- Salcedo-Sánchez, E.R.; Esteller, M.V.; Garrido Hoyos, S.E.; Martínez-Morales, M. Groundwater Optimization Model for Sustainable Management of the Valley of Puebla Aquifer, Mexico. Environ. Earth Sci. 2013, 70, 337–351. [Google Scholar] [CrossRef]
- Salcedo-Sánchez, E.R.; Ocampo-Astudillo, A.; Garrido-Hoyos, S.E.; Otazo-Sánchez, E.M. Effects on Groundwater Quality of the Urban Area of Puebla Aquifer. In Water Availability and Management in Meico; Otazo-Sánchez, E.M., Ed.; Springer: Cham, Switzerland, 2020; pp. 201–214. ISBN 978-3-030-24962-5. [Google Scholar]
- Gárfias, J.; Arroyo, N.; Aravena, R. Hydrochemistry and Origins of Mineralized Waters in the Puebla Aquifer System, Mexico. Environ. Earth Sci. 2010, 59, 1789–1805. [Google Scholar] [CrossRef]
- Salcedo Sánchez, E.R.; Garrido Hoyos, S.E.; Esteller, M.V.; Martínez Morales, M.; Ocampo Astudillo, A. Hydrogeochemistry and Water-Rock Interactions in the Urban Area of Puebla Valley Aquifer (Mexico). J. Geochem. Explor. 2017, 181, 219–235. [Google Scholar] [CrossRef]
- Flores-Márquez, E.L.; Jiménez-Suárez, G.; Matínez-Serrano, R.G.; Chávez, R.E.; Silva-Pérez, D. Study of Geothermal Water Intrusion Due to Groundwater Exploitation in the Puebla Valley Aquifer System, Mexico. Hydrogeol. J. 2006, 14, 1216–1230. [Google Scholar] [CrossRef]
- Martínez Morales, M.; Salcedo, E.R.; Hoyos, S.G.; Esteller, M.V. Simulación de Diferentes Alternativas de Gestión de Los Hídricos Del Acuífero de Puebla-Atoyac. Ing. Rev. Académica Fac. Ing. Autónoma Yucatán 2015, 19, 62–72. [Google Scholar]
- Martínez-Austria, P.F.; Vargas-Hidalgo, A. Modelo Dinámico Adaptativo Para La Gestión Del Agua En El Medio Urbano. Tecnol. Cienc. Del Agua 2016, VII, 139–154. [Google Scholar]
- Astudillo Ocampo, A. Impactos En La Calidad Del Agua Que Abastece a La Ciudad de Puebla Por Efecto de La Explotación Del Acuífero. Master’s Thesis, Instituto Mexicano de Tecnología del Agua, Mexico City, Mexico, 2017. [Google Scholar]
- Castro, D.A.V.; Romero, A.L.; Cuanal, D.D.C.D.; Vargas, L.V.C.L. Discriminación de Precios En Las Tarifas de Agua Potable En La Ciudad de Puebla. Aqua-LAC 2021, 13, 58–80. [Google Scholar] [CrossRef]
- Morales-García, S.S.; Rodríguez-Espinosa, P.F.; Shruti, V.C.; Jonathan, M.P.; Martínez-Tavera, E. Metal Concentrations in Aquatic Environments of Puebla River Basin, Mexico: Natural and Industrial Influences. Environ. Sci. Pollut. Res. 2017, 24, 2589–2604. [Google Scholar] [CrossRef]
- Brenes, R.; Cadena, A.; Ruiz-Guerrero, R. Monitoreo de La Concentración de Nitrato En El Acuífero Del Valle de Puebla. Rev. Int. De Contam. Ambient. 2011, 27, 323–332. [Google Scholar]
- Covarrubias-López, A.C.; García-Suastegui, W.A.; Valencia-Quintana, R.; Avelino-Flores, F.; Méndez-Bermúdez, A.; Handal-Silva, A. Human Impact in the Watershed of the Atoyac River in the Metropolitan Area of Puebla, Mexico. Sustainability 2023, 15, 10565. [Google Scholar] [CrossRef]
- Vargas Castro, D.A. Gestión y Análisis de Conflictos Por Agua En Puebla. Master’s Thesis, BUAP, Puebla, Mexico, 2017. [Google Scholar]
- NOM-001-CONAGUA-2015; Conservación del Recurso Agua, que Establece las Especificaciones y el Método para Determinar la Disponibilidad Media Anual de las Aguas Nacionales. CONAGUA: Mexico City, Mexico, 2015.
- UN HABITAT. The Right to the City: Bridging the Urban Divide. Available online: https://unhabitat.org/sites/default/files/documents/2019-05/wuf-5.pdf (accessed on 30 June 2023).
- Brunner, P.H.; Helmut, R. Practical Handbook of Material Flow Analysis; CRC Press: Boca Raton, FL, USA, 2005; ISBN 00203507207. [Google Scholar]
- González de Molina, M.; Toledo, V.M. The Social Metabolism: A Socio-Ecological Theory of Historical Change; Springer: Firenze, Italy, 2014; Volume 3, ISBN 978-3-319-06357-7. [Google Scholar]
- Venegas, B.; Tello-Hernández, M.A.; Cepeda-Cornejo, V.; Molina-Romero, D. Calidad Microbiológica: Detección de Aeromonas Sp y Pseudomonas Sp En Garrafones Provenientes de Pequeñas Plantas Purificadoras de Agua. Ciencia UAT 2022, 17, 146–164. [Google Scholar] [CrossRef]
- Obersteg, A.; Arlati, A.; Acke, A.; Berruti, G.; Czapiewski, K.; Dąbrowski, M.; Heurkens, E.; Mezei, C.; Palestino, M.F.; Varjú, V.; et al. Urban Regions Shifting to Circular Economy: Understanding Challenges for New Ways of Governance. Urban. Plan. 2019, 4, 19–31. [Google Scholar] [CrossRef]
- CONAGUA; SEMARNAT. Manual de Agua Potable, Alcantarillado y Saneamiento: Eficiencia Energética; Uso Eficiente y Ahorro de La Energía; Comisión Nacional del Agua; Naturales, Secretaría de Medio Ambiente y Recursos: Mexico City, Mexico, 2016; ISBN 978-607-626-024-1. [Google Scholar]
- SENER. Factor de Emisión Del Sistema Eléctrico Nacional, 2018. 2019. Available online: https://www.gob.mx/cms/uploads/attachment/file/538473/Factor_emision_electrico_2019.pdf (accessed on 30 June 2023).
- Raworth, K. A Safe and Just Space For Humanity: Can we Live within the Doughnut? Discussion paper; Oxam: Oxford, UK, 2012; Volume 461, pp. 1–26. [Google Scholar] [CrossRef]
- Delgado-Ramos, G.C. Water and the Political Ecology of Urban Metabolism: The Case of Mexico City. J. Polit. Ecol. 2015, 22, 98–114. [Google Scholar] [CrossRef]
- Gold Coast City Council. MUSIC Modelling Guidelines; Gold Coast City Council: Gold Coast, Australia, 2006. [Google Scholar]
- Fleming, N.S. An Investigation into Rainfall-Runoff Relationships; Department of Civil and Environmental Engineering, University of Adelaide: Adelaide, Australia, 1994. [Google Scholar]
- Rodríguez-Espinosa, P.F.; Ochoa-Guerrero, K.M.; Milan-Valdes, S.; Teran-Cuevas, A.R.; Hernandez-Silva, M.G.; San Miguel-Gutierrez, J.C.; Diaz, S.C. Origin of a Recent Sinkhole (Socavón) in an Agricultural Field Central Mexico. Concurrence of Natural and Anthropogenic Conditions. SSRN Electron. J. 2022, 1–15. [Google Scholar] [CrossRef]
- CONAGUA. Actualización de La Disponibilidad Media Anual de Agua En El Acuífero Valle De Puebla (2104); CONAGUA: Puebla, Mexico, 2018; Volume 3, Available online: https://agua.org.mx/wp-content/uploads/2020/02/Actualizaci%C3%B3n-de-la-disponibilidad-media-anual-de-agua-en-el-acu%C3%ADfero-Valle-de-Puebla.pdf (accessed on 5 August 2021).
- Núñez, E. Urge Una Nueva Ley Del Agua; Con La Actual Legislación Las Empresas Privadas Tienen El Control Del Líquido: Conagua. 2022, pp. 6–7. Available online: https://aguaparatodos.org.mx/urge-una-nueva-ley-del-agua-con-la-actual-legislacion-empresas-privadas-tienen-el-control-del-liquido-conagua-puebla/ (accessed on 30 June 2023).
- Villaseñor, A. Veredicto de Conagua No Permite Tener Ideas Conclusivas Del Origen Del Socavón: Cupreder. 2021. Available online: https://www.lajornadadeoriente.com.mx/puebla/veredicto-de-conagua-cupreder/ (accessed on 30 June 2023).
- Tinsa Research Reporte Industrial Puebla 2016. 2016. Available online: https://docplayer.es/79482617-Reporte-industrial-puebla-2016.html (accessed on 30 June 2023).
- Cabrera Montiel, L.; Delgado, J. Sector Inmobiliario y Estructura Urbana En La Ciudad de Puebla 1900–2010. Secuencia 2019, 103, 37. [Google Scholar] [CrossRef]
- Martínez Olivarez, P.; Espacios Urbanos, A.D.E.; Diseño, C.Y. La Política de Suelo Del Megaproyecto Urbano Angelópolis y Sus Efectos En La Periferia Poniente de Puebla. Anu. Espac. Urbanos 2015, 22, 73–97. [Google Scholar] [CrossRef]
- La mudi. Reporte de Bienes Raíces Puebla; Puebla, Mexico. 2023. Available online: https://www.lamudi.com.mx/journal/wp-content/uploads/2023/05/reporte-inmobiliario-puebla-2022.pdf (accessed on 30 June 2023).
- Rangel, J. Canadevi y Autoridades Construirán Más de Tres Mil Viviendas En Puebla. Available online: https://inmobiliare.com/canadevi-y-autoridades-construiran-mas-de-tres-mil-viviendas-en-puebla/ (accessed on 30 June 2023).
- McDonald, R.I.; Weber, K.F.; Padowskic, J.; Boucher, T.; Shemie, D. Estimating Watershed Degradation over the Last Century and Its Impact on Water-Treatment Costs for the World’s Large Cities. Proc. Natl. Acad. Sci. USA 2016, 113, 9117–9122. [Google Scholar] [CrossRef] [PubMed]
- IBERO; Puebla, N. Los Otros Costos Del Deterioro En El Atoyac. Available online: https://www.iberopuebla.mx/noticias_y_eventos/noticias/los-otros-costos-del-deterioro-en-el-atoyac (accessed on 4 May 2022).
- Rivera González, B. Sarro En Suministro de Agua de Puebla Tapa Tuberías de Santa Catarina, Acusan. Ángulo7 2020. Available online: https://www.angulo7.com.mx/2020/05/06/acusan-sarro-en-tuberias-de-santa-catarina-causado-por-agua-de-puebla/ (accessed on 6 May 2020).
- Ramírez, J.P. Crisis Del Agua En Monterrey, Guadalajara, San Luis Potosí, León y La Ciudad de México: (1950–2010), NED-New edition, 1; Universidad Nacional Autónoma de México: Mexico City, Mexico, 2012; ISBN 9786070238413. [Google Scholar]
- Reyes Sánchez, I. Detectan Más de 100 Mil Tomas Clandestinas de Agua En Puebla. Ambas Manos 2023. Available online: https://www.ambasmanos.mx/puebla/detectan-mas-de-100-mil-tomas-clandestinas-de-agua-en-puebla/99116/ (accessed on 30 June 2023).
- Núñez, E. 15 Mil Habitantes de Cuatro Colonias No Tienen Servicio de Agua, Señalan Que Concesiones Integrales Les Ha Cortado El Servicio. Jorn. Oriente 2022. Available online: https://www.lajornadadeoriente.com.mx/puebla/concesiones-agua-colonias-del-sur/ (accessed on 30 June 2023).
- CONAGUA; SEMARNAT; IMTA. Programa de Indicadores de Gestión de Organismo Operadores. Available online: http://www.pigoo.gob.mx/organismosoperadores.jsp (accessed on 8 May 2022).
- Valeria, G. Medidores de Agua de Puebla Significan Otro Sangrado Más a La Población: ASA. D. Cambio Puebla 2019. Available online: https://www.diariocambio.com.mx/2019/secciones/metropolis/item/27684-medidores-de-agua-de-puebla-significan-otro-sangrado-mas-a-la-poblacion-asa (accessed on 30 June 2023).
- Castillo Jorge Agua de Puebla Pretende Imponer Medidores. Promete Servicio 24 Horas al Día. Intolerancia D. 2022. Available online: https://intoleranciadiario.com/articles/especiales/2022/06/16/997607-agua-depuebla-pretende-imponer-medidores-promete-servicio-24-horas-al-dia.html (accessed on 30 June 2023).
- Castillo Jorge Pierde Agua de Puebla Amparo Por Cobros Excesivos. Intolerancia D. 2022. Available online: https://intoleranciadiario.com/articles/especiales/2022/08/03/999793-pierde-agua-depuebla-amparo-por-cobros-excesivos.html (accessed on 30 June 2023).
- Macuitl Paola Agua de Puebla Manda a Buró de Crédito Por No Pagar Servicio, Acusan. Ángulo 7 2022. Available online: https://www.angulo7.com.mx/2022/06/07/agua-de-puebla-manda-a-buro-de-credito-por-falta-de-pago-acusan/ (accessed on 30 June 2023).
- Vera Cortés, S. Se Niega Agua de Puebla a Levantar Reportes Tras Crecientes Cortes de Agua En San Manuel. Megalópolis 2019. Available online: https://megalopolismx.com/noticia/52016/se-niega-agua-de-puebla-a-levantar-reportes-tras-crecientes-cortes-de-agua-en-san-manuel (accessed on 30 June 2023).
- Martha Cuaya Siete Colonias de Puebla Han Reportado Mas de Mil Cortes de Agua: Activista. Sol Puebla 2023. Available online: https://www.elsoldepuebla.com.mx/local/siete-colonias-de-puebla-han-reportado-mas-de-mil-cortes-de-agua-activista-10186286.html (accessed on 30 June 2023).
- ASA. Asamblea Social Del Agua. Available online: http://asambleasocialdelagua.org/ (accessed on 19 June 2023).
- Staff Admiten Demanda Colectiva Contra Agua de Puebla Por Falta de Saneamiento 2023. Available online: https://www.poblanerias.com/2023/03/demanda-colectiva-vs-agua-de-puebla/ (accessed on 26 June 2023).
- Camacho Mónica Reforma de Merino y Biestro No Frenó Cortes de Agua; Suman 2 Mil Esde Su Aprobación: Omar Jiménez. Jorn. Oriente 2021. Available online: https://www.lajornadadeoriente.com.mx/puebla/reforma-cortes-de-agua-omar-jimenez/ (accessed on 30 June 2023).
- Camacho Mónica Autorizar Aumento a Las Tarifas Del Agua Sería Solapar El Fracaso de Agua de Puebla: Francisco Castillo. Jorn. Oriente 2022. Available online: https://www.lajornadadeoriente.com.mx/puebla/tarifas-el-fracaso-de-agua-de-puebla-castillo/ (accessed on 30 June 2023).
- Hernández Gabriela Puebla: Permiten a Concesionaria Que Aumente La Tarifa Del Agua Sin Pasar Por El Congreso. Proceso 2022. Available online: https://www.proceso.com.mx/nacional/2022/8/5/puebla-permiten-concesionaria-que-aumente-la-tarifa-del-agua-sin-pasar-por-el-congreso-290990.html (accessed on 30 June 2023).
- Martínez Berenice Integrantes de La ASA Exigen Desprivatizar El Agua En Puebla. Retodiario 2023. Available online: https://retodiario.com/politica/2023/05/24/integrantes-de-la-asa-exigen-desprivatizar-el-agua-en-puebla/ (accessed on 30 June 2023).
- Castro-Pastrana, L.I.; Cerro-López, M.; Toledo-Wall, M.L.; Gómez-Oliván, L.M.; Saldívar-Santiago, M.D. Análisis de Fármacos En Aguas Residuales de Tres Hospitales de La Ciudad de Puebla, México. Ing. Agua 2021, 25, 59. [Google Scholar] [CrossRef]
- Stefano, P.H.P.; Roisenberg, A.; Santos, M.R.; Dias, M.A.; Montagner, C.C. Unraveling the Occurrence of Contaminants of Emerging Concern in Groundwater from Urban Setting: A Combined Multidisciplinary Approach and Self-Organizing Maps. Chemosphere 2022, 299, 134395. [Google Scholar] [CrossRef] [PubMed]
- WWAP (Programa Mundial de Evaluación de los Recursos Hídricos de las Naciones Unidas). Informe Mundial de Las Naciones Unidas Sobre El Desarrollo de Los Recursos Hídricos 2017; Agua Residuales: El Recurso Desaprovechado; WWAP: Paris, France, 2017. [Google Scholar]
- Ellis, J.B.; Revitt, D.M. Sewer Losses and Interactions with Groundwater Quality. Water Sci. Technol. 2002, 45, 195–202. [Google Scholar] [CrossRef] [PubMed]
- CONAGUA. SEMARNAT Estadísticas Del Agua En México 2018; CONAGUA: Mexico City, Mexico, 2018. [Google Scholar]
- Domínguez-Mariani, E.; Carrillo-Chávez, A.; Ortega, A.; Orozco-Esquivel, M.T. Wastewater Reuse in Valsequillo Agricultural Area, Mexico: Environmental Impact on Groundwater. Water Air Soil Pollut. 2004, 155, 251–267. [Google Scholar] [CrossRef]
- Mancilla-Villa, Ó.R.; Ortega-Escobar, H.M.; Ramírez-Ayala, C.; Uscanga-Mortera, E.; Ramos-Bello, R.; Reyes-Ortigoza, A.L. Metales Pesados Totales y Arsénico En El Agua Para Riego de Puebla y Veracruz, México. Rev. Int. Contam. Ambient. 2011, 28, 39–48. [Google Scholar]
- López-Vargas, R.; Méndez-Serrano, A.; Albores-Medina, A.; Oropeza-Hernández, F.; Hernández-Cadena, L.; Mercado-Calderón, F.; Alvarado-Toledo, E.; Herrera-Morales, S.; Arellano-Aguilar, O.; García-Vargas, G.; et al. Oxidative Stress Index Is Increased in Children Exposed to Industrial Discharges and Is Inversely Correlated with Metabolite Excretion of Voc. Environ. Mol. Mutagen. 2018, 59, 639–652. [Google Scholar] [CrossRef] [PubMed]
- Castillo, K. Saneamiento de Agua de Puebla, Fraude; Daño Alcanzaría a Los 6 Mmdp: Activista. e-Consulta 2023. Available online: https://www.e-consulta.com/nota/2023-04-20/medio-ambiente/saneamiento-de-agua-de-puebla-fraude-dano-alcanzaria-los-6-mmdp (accessed on 30 June 2023).
- Daniela, H. Activistas Buscan Demanda Colectiva Contra Agua de Puebla Por Servicio de Mala Calidad. Sol Puebla 2022. Available online: https://www.elsoldepuebla.com.mx/local/activistas-buscan-demanda-colectiva-contra-agua-de-puebla-por-servicio-de-mala-calidad-8352378.html (accessed on 30 June 2023).
- EJAtlas Río Atoyac (Tlaxcala-Puebla), Infierno Ambiental. México. Available online: https://ejatlas.org/conflict/rio-atoyac-tlaxcala-puebla-an-environmental-hell-mexico (accessed on 24 July 2023).
- CONAGUA; SEMARNAT. Manual de Agua Potable, Alcantarillado y Saneamiento: Estructuras Tarifarias Municipales; CONAGUA: Mexico City, Mexico, 2015; ISBN 978-607-8246-89-2. [Google Scholar]
- Hall, R.P.; Van Koppen, B.; Van Houweling, E. The Human Right to Water: The Importance of Domestic and Productive Water Rights. Sci. Eng. Ethics 2014, 20, 849–868. [Google Scholar] [CrossRef]
- Dessu, S.B.; Melesse, A.M.; Bhat, M.G.; McClain, M.E. Assessment of Water Resources Availability and Demand in the Mara River Basin. Catena 2014, 115, 104–114. [Google Scholar] [CrossRef]
- Díaz Paulina Colonias En Puebla, Con Desabasto de Agua y Piperos Se Aprovechan. Ángulo 7 2023. Available online: https://www.angulo7.com.mx/2023/06/25/colonias-en-puebla-sin-abasto-de-agua-y-piperos-se-aprovechan/ (accessed on 26 June 2023).
- Serrao-Neumann, S.; Renouf, M.A.; Morgan, E.; Kenway, S.J.; Low Choy, D. Urban Water Metabolism Information for Planning Water Sensitive City-Regions. Land Use Policy 2019, 88, 104144. [Google Scholar] [CrossRef]


| Municipality Where Water Was Extracted | Annual Flow Extracted by the Water Utility (Mm3/yr) | Percentage (%) |
|---|---|---|
| Puebla | 78.657 | 63.4% |
| Cuautlancingo | 11.622 | 9.4% |
| Coronango | 9.988 | 8.1% |
| Nealtican | 9.472 | 7.6% |
| San Pedro Cholula | 4.944 | 4.0% |
| San Andrés Cholula | 4.605 | 3.7% |
| Tlaltenango | 4.222 | 3.4% |
| Juan C. Bonilla | 0.339 | 0.3% |
| Amozoc | 0.214 | 0.2% |
| Water Softener Plant | Annual Softened Flow (Mm3/a) | Percentage (%) | Amount of Chemicals (Kton/a) | Consumption of Chemicals (Kg/m3) |
|---|---|---|---|---|
| Quetzatcoatl | 5.77 | 60.3% | 2.77 | 0.481 |
| Sulfurosa | 2.51 | 26.2% | 5.99 | 2.388 |
| Jint | 1.29 | 13.5% | 0 | Inconsistent data |
| Paseo del Río | 0 | 0% | 0.07 | Inconsistent data |
| Flow | Calculated Magnitude | Total |
|---|---|---|
| Distributed by tanker truck | 7.561 Mm3/yr | |
| In homes with a water tank | 0.526 Mm3/yr | |
| In homes with a water tank and cistern | 7.035 Mm3/yr | |
| Big Brand bottled water | 0.753 Mm3/yr | |
| 20 L carboys | 0.687 Mm3/yr | |
| 5 L carafes | 0.066 Mm3/yr | |
| 1.5 L bottle | 0.072 Mm3/yr | |
| LPWC bottled water | 1.879 Mm3/yr |
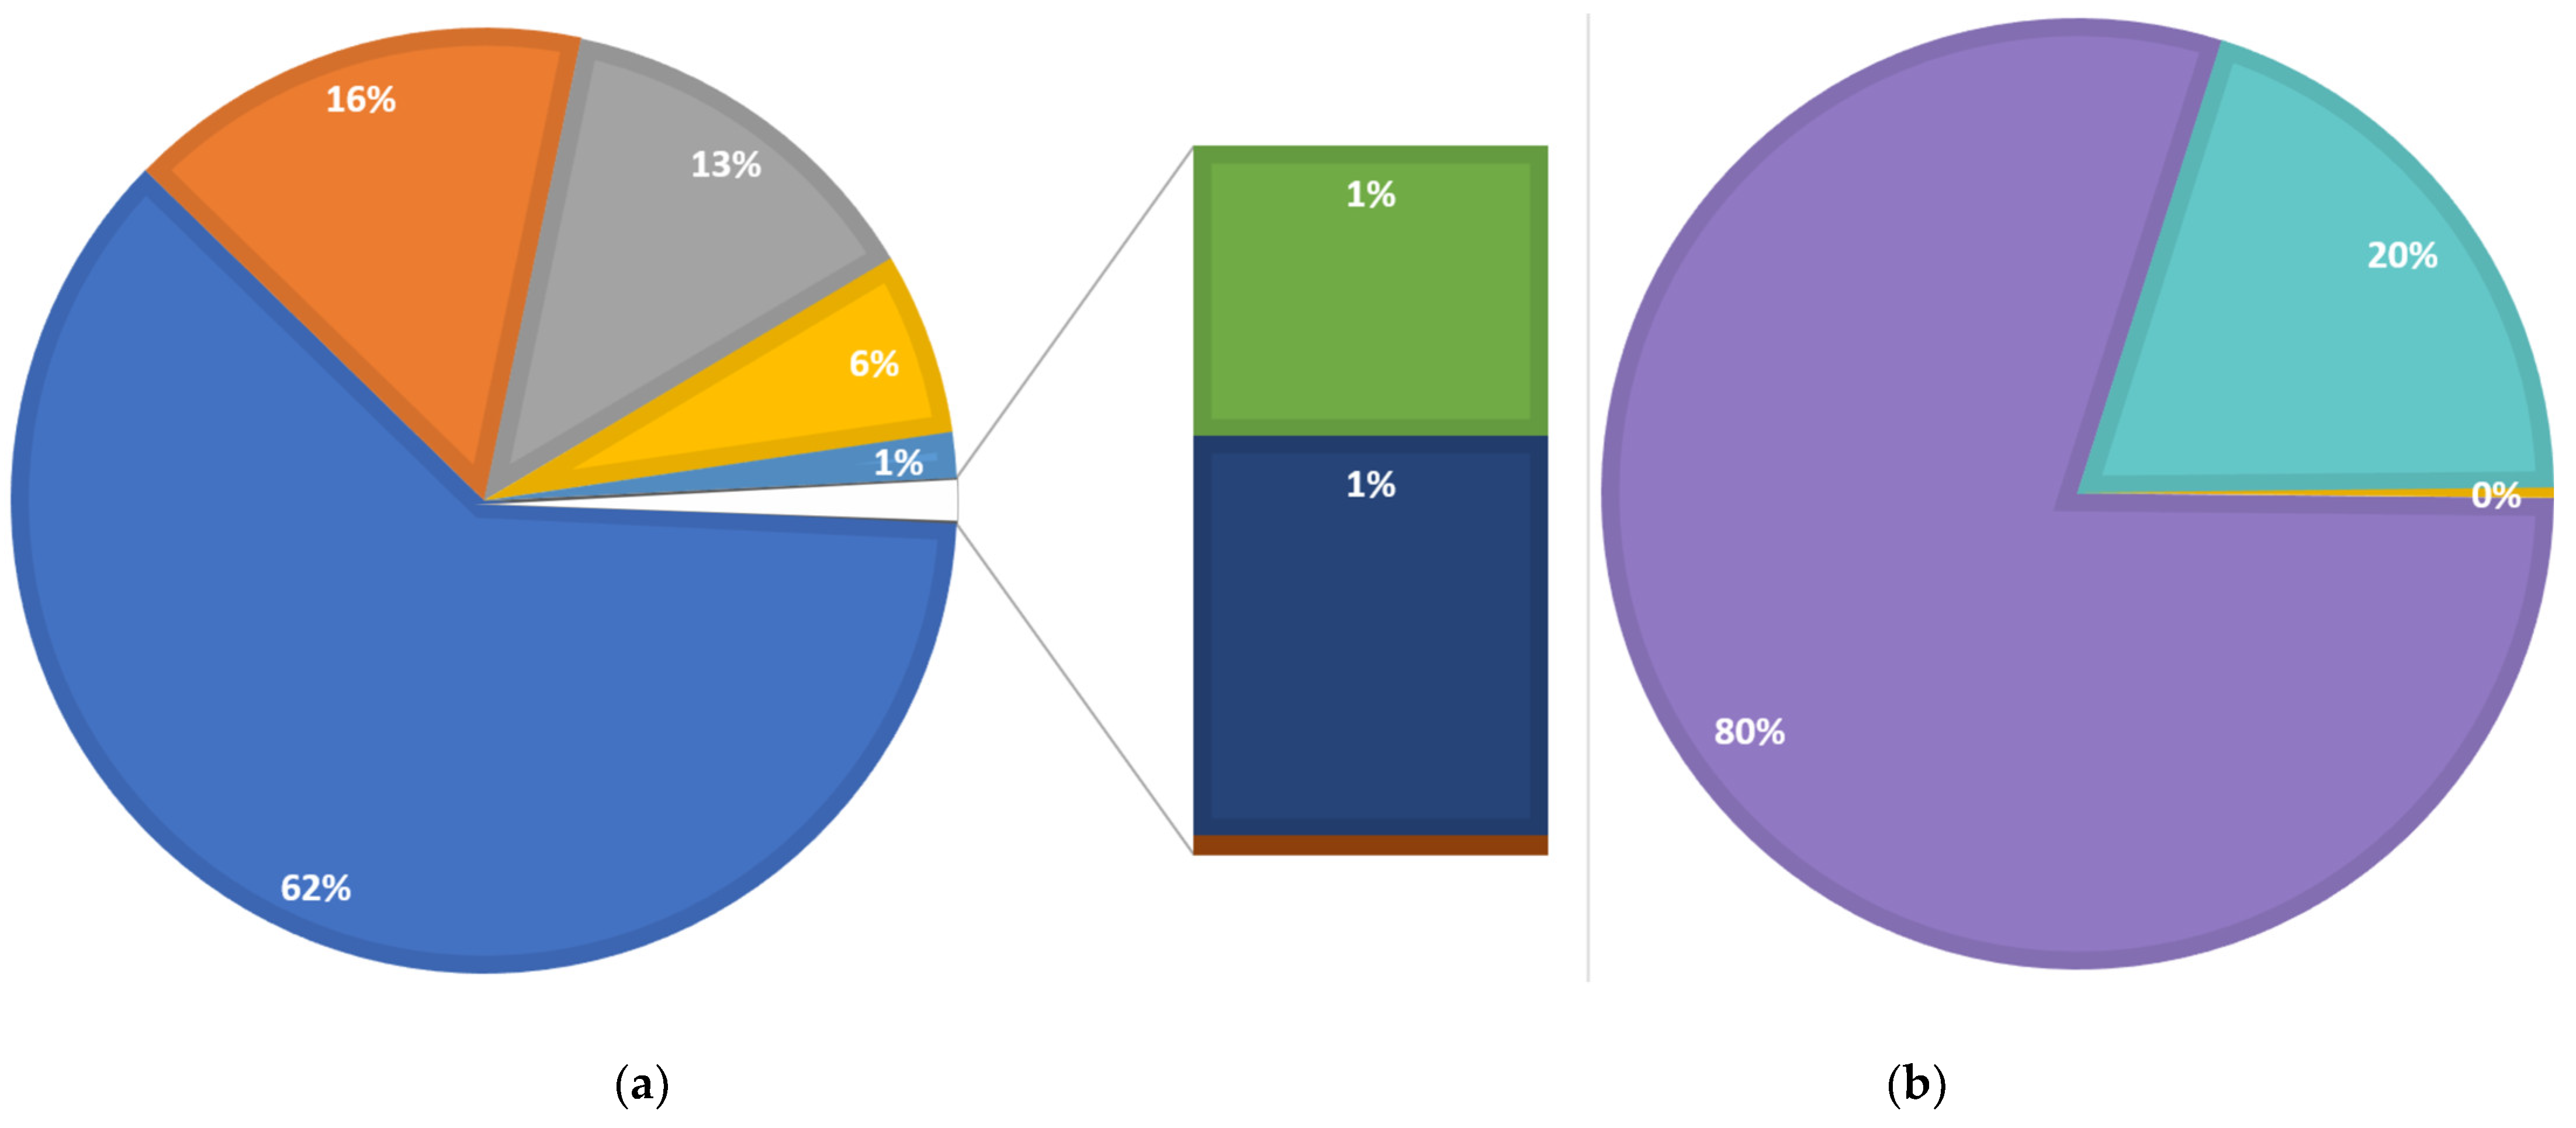
| Influent of Water Consumed | Colors in Figure 8a | Flow Mm3/a | Percentage of Total (%) |
|---|---|---|---|
| Water Utility | ■ | 74.59 | 61.55 |
| Surface water not withdrawn by the water utility | ■ | 19.36 | 15.97 |
| Groundwater not withdrawn by water utility | ■ | 15.96 | 13.17 |
| Water distributed by tanker truck to households | ■ | 7.56 | 6.25 |
| LPWC bottled water | ■ | 1.88 | 1.56 |
| Big Brand bottled water | ■ | 0.75 | 0.69 |
| Recycled water from WWTPs | ■ | 1.03 | 0.85 |
| Rainwater harvesting in homes | ■ | 0.05 | 0.04 |
| Total | 121.17 | ||
| Consumed water effluent | Colors in Figure 8b | Flow Mm3/a | Percentage of total (%) |
| Discharges to sewers or water bodies | ■ | 97.24 | 80.25 |
| Evaporation in water uses | ■ | 24.31 | 20.06 |
| Discharge of the water treatment process at LPWC | ■ | −0.38 * | −0.31 |
| Total | 121.17 |
| Consumption | Annual Flow (Mm3/yr) | Percentage of Total |
|---|---|---|
| Domestic | 71.45 | (58.96%) |
| Public | 17.75 | (14.65%) |
| Commercial | 13.05 | (10.77%) |
| Industrial ** | 10.44 | (8.61%) |
| Services | 5.99 | (4.92%) |
| Aquaculture | 0.596 | (0.49%) |
| Different Uses | 0.514 | (0.42%) |
| Domestic not supplied by SOAPAP | 0.050 | (0.04%) |
| Livestock | 0.032 | (0.03%) |
| Bottled water in non-domestic uses | 0.263 | (0.22%) |
| Recycled water for irrigation of municipal gardens | 1.03 | (0.85%) |
| Electric power generation | 114.00 * |
| Processes | Percentage | Consumption of Energy GWh | Mm3/a (hm3/yr) | KWh/m3 | KtCO2e | KgCO2e/m3 |
|---|---|---|---|---|---|---|
| Extraction | 68.78% | 71.09 | 124.06 | 0.5730 | 37.47 | 0.3020 |
| Water treatment | 4.69% | 4.85 | 9.57 | 0.5066 | 2.55 | 0.2670 |
| Pumping | 17.71% | 18.31 | 124.06 | 0.1476 | 9.65 | 0.0778 |
| Sewage | 0.62% | 0.64 | 97.25 | 0.0065 | 0.34 | 0.0034 |
| Wastewater treatment | 7.77% | 8.03 | 63.91 | 0.1257 | 4.23 | 0.0662 |
| General services | 0.43% | 0.44 | 124.06 | 0.0036 | 0.23 | 0.0019 |
| Water Utility | 103.36 | 124.06 | 0.8331 | 54.47 | 0.4391 |
Disclaimer/Publisher’s Note: The statements, opinions and data contained in all publications are solely those of the individual author(s) and contributor(s) and not of MDPI and/or the editor(s). MDPI and/or the editor(s) disclaim responsibility for any injury to people or property resulting from any ideas, methods, instructions or products referred to in the content. |
© 2023 by the authors. Licensee MDPI, Basel, Switzerland. This article is an open access article distributed under the terms and conditions of the Creative Commons Attribution (CC BY) license (https://creativecommons.org/licenses/by/4.0/).
Share and Cite
Pérez-González, D.; Delgado-Ramos, G.C.; Cedillo Ramírez, L.; Loreto López, R.; Ramos Cassellis, M.E.; Tamariz Flores, J.V.R.; Peña Moreno, R.D. Puebla City Water Supply from the Perspective of Urban Water Metabolism. Sustainability 2023, 15, 14549. https://doi.org/10.3390/su151914549
Pérez-González D, Delgado-Ramos GC, Cedillo Ramírez L, Loreto López R, Ramos Cassellis ME, Tamariz Flores JVR, Peña Moreno RD. Puebla City Water Supply from the Perspective of Urban Water Metabolism. Sustainability. 2023; 15(19):14549. https://doi.org/10.3390/su151914549
Chicago/Turabian StylePérez-González, David, Gian Carlo Delgado-Ramos, Lilia Cedillo Ramírez, Rosalva Loreto López, María Elena Ramos Cassellis, José Víctor Rosendo Tamariz Flores, and Ricardo Darío Peña Moreno. 2023. "Puebla City Water Supply from the Perspective of Urban Water Metabolism" Sustainability 15, no. 19: 14549. https://doi.org/10.3390/su151914549
APA StylePérez-González, D., Delgado-Ramos, G. C., Cedillo Ramírez, L., Loreto López, R., Ramos Cassellis, M. E., Tamariz Flores, J. V. R., & Peña Moreno, R. D. (2023). Puebla City Water Supply from the Perspective of Urban Water Metabolism. Sustainability, 15(19), 14549. https://doi.org/10.3390/su151914549