Abstract
Decarbonization is the most urgent task for the shipping industry. The International Maritime Organization, which makes the rules for shipping companies, has strengthened their carbon emissions regulation in order to reduce emissions to 70% of 2008’s carbon emissions by 2050. However, 75% of the existing fleet cannot satisfy this carbon emission regulation. The building of new vessels makes it possible to reduce carbon emissions and satisfy this regulation through adopting eco-friendly propulsion methods, such as LNG, ammonia, and methanol propulsion. However, the existing vessels on the sea find it difficult to dock and change their propulsion equipment. This research aims to propose a novel voyage operation method—a just-in-time arrival policy—that converts vessels’ waiting time into voyage time. The proposed method can reduce carbon emissions without propulsion system alteration and expand a vessel’s lifespan, thus satisfying carbon regulations. The carbon intensity indicator, invented by the IMO to regulate vessel carbonization, assesses the quantity of reduced carbon emissions. This research investigated the variation in the carbon intensity indicators of vessels when the just-in-time arrival policy was applied through studying an actual vessel’s arrival and departure dates at the Pusan International container terminal. According to the results of our analysis, ship carbon emissions decreased by an average of 45.8%, and by a maximum of 91%, compared to the levels before applying the proposed method. In addition, 87.0% of vessels obtained a carbon intensity indicator rank improvement and expanded the period that can satisfy the carbon intensity regulation by an average of eleven years and a maximum of twenty-seven years through applying the proposed just-in-time arrival policy. Additionally, the improvement effect of the carbon intensity rank positively correlates with ship size and waiting time at the port.
1. Introduction
Maritime shipping is a vital component of global trade, accounting for over 80% of the world’s trade volume. However, it is also a significant contributor to greenhouse gas emissions, which are a major driver of climate change. According to the IMO (International Maritime Organization), shipping accounted for approximately 2.89% of global greenhouse gas emissions in 2018 [1]. This amount can be interpreted as a billion tons of carbon dioxide per year, which is larger than Germany’s total carbon emissions [1]. As the demand for maritime shipping continues to grow, so do the emissions associated with it. This presents a significant challenge for the shipping industry, which must find ways to reduce emissions while maintaining its critical role in global trade.
The requirement set in MARPOL (Marine Pollution treaty) Annex VI by the International Maritime Organization (IMO) has been in effect since November 2008. The carbon intensity indicator (CII) is an index that was developed by the IMO in order to evaluate the quantity of carbon emissions produced by a vessel per year. The CII is also the standard used to impose the CO2 emission charge on shipping companies. CII (Carbon Intensity Indicator) measurement and reporting have become mandatory as of January 2023. The IMO plans to reduce carbon dioxide (CO2) emissions by at least 40% by 2030 and 70% by 2050 compared to the baseline year of 2008. Meanwhile, only 25% of existing vessels satisfy this CII regulation, and the rest, 75%, cannot satisfy the CII regulation. According to the 80th conference of the MEPC (Marine Environment Protection Committee), even the new goal for maritime CO2 emissions was set at net-zero in the maritime shipping chain. Therefore, it is very clear that CO2 emissions are an urgent challenge for the maritime sector. Joung et al. [1] reviewed the emissions policy trend of the IMO. It was found that the IMO will tighten the carbon emissions regulation standards in order to reduce GHG production [1]. DNV (Det Norske Veritas), NK (Nippon Kaiji), and KR (Korean Reister) are the representative classification societies that provide the service that calculates the CII online.
Serra [2] reviewed possible CO2 emissions reduction technologies. Hull design, speed, and propulsion fuel change were found to be the representative CO2 emissions solutions. As a consequence, CO2 reduction is the prime goal of the maritime shipping chain holders, i.e., shipping companies, vessels, terminals, and hinterland transporters. Port areas are CO2-concentrated areas due to ship congestion. The COVID-19 pandemic created the worst congestion in history [3]. Multiple researchers [3,4] have focused on predicting the CO2 emissions in port areas. CO2 is emitted by the various dynamic port subjects, such as ships, cranes, yard tractors, and container trailers. These CO2 emissions can be reduced by operating these dynamic machines efficiently.
Therefore, it is natural that the stakeholders in the maritime shipping chain have turned their attention to the CII ratings of their vessels. Many researchers [5,6,7] have studied CII quantification based on ship type and voyage operation data. Giannia et al. [5] and Briadotti [6] reviewed CII variation due to fuel oil changes and the corresponding revision scenarios. Another carbon performance index for a vessel’s voyage, which regulates the CO2 emissions of a vessel, is the energy efficiency existing ship index, EEXI. EEXI is designed to measure how much CO2 a vessel generates during a voyage, specifically considering its cargo capacity. Bayraktar [7] quantified CII and EEXI (energy efficiency existing ship index) according to different scenarios depending on the ship type, i.e., container ship, LNG, and bulk carrier.
Just-in-time arrival is a ship speed optimization system that converts the waiting time of the vessels at a port into voyage speed. The just-in-time arrival system is realized using the smart infrastructure of vessels and the terminal in which they operate. Yu [8] studied the effects of JITA on the berth allocation and quay crane assignment problems. Alexander [9] analyzed the just-in-time arrival vessel system’s viability at a dry bulk carrier’s terminal. Mudzzaffar [10] proposed a ship route optimization system that adopts the just-in-time arrival policy. Vermeulen [11] analyzed the possible improvement of port call processes using JITA. Kim [12] proposed a speed optimization method for autonomous vessels, and Yoon et al. [13] analyzed the ETA (Estimated Time of Arrival) effects of the interaction between ships and ports.
Many researchers [9,14,15] have implied that the just-in-time arrival operation can be a direct solution to the decarbonization problem in the shipping industry [14]. This stance is aligned with the authors’ hypothesis in this paper. Senss et al. [9] proposed the just-in-time arrival system for a dry bulk system. They confirmed that the just-in-time arrival system led to a reduction in CO2 for a dry bulker. According to de Andres Conzalez et al. [15], the just-in-time arrival system can be realized through digital infrastructure for the exchange of data between ports and ships.
Despite extensive research having been conducted on vessel CIIs, there is a notable lack of studies investigating the effects of the just-in-time arrival policy on the CIIs of container vessels. Considering that just-in-time arrival (JITA) offers a direct solution for reducing CO2 emissions, further exploration of its impact is warranted. This study aims to fill this research gap by quantifying the variation in CII resulting from the adoption of the just-in-time arrival vessel speed optimization policy, considering the interaction between ships and ports. The powerful potential of just-in-time arrival is based on its ability to lower CO2 emissions without requiring significant equipment modifications, thus enabling its immediate adoption across most vessels.
Multiple studies have focused on the CII of vessels; however, the effects of JITA on CII have not yet been studied. The JITA operation is a direct solution used to reduce CO2 emissions; therefore, it is highly worthy of investigation. The results of this study provide insight into the possibilities for policy change for policymakers, regulators, and industry stakeholders, who are all working to address the challenges associated with reducing emissions while maintaining the efficiency and competitiveness of the shipping industry.
The key objective of this study is to propose an approach for the quantification of the Carbon Intensity Indicator when vessels adopt the just-in-time arrival policy. We present a data-modeling approach that can be utilized to calculate CII; in particular, data from a ship’s Automatic Identification System (AIS), Terminal Operating System (TOS), and vessel specifications are evaluated to determine the CII. Vessel arrival and departure data obtained from Pusan International Terminal for September 2022 are utilized to assess the change in CII due to the adoption of JITA.
This study’s findings are expected to provide valuable insights and policy change recommendations for policymakers, regulators, and industry stakeholders who are committed to addressing the challenges of reducing emissions while enhancing the shipping industry’s efficiency and competitiveness. By quantifying the variation in the CII resulting from the adoption of the just-in-time arrival policy, this research contributes to understanding the potential of this policy as a powerful solution for reducing CO2 emissions without the need for extensive vessel equipment revisions. Through the integration of smart infrastructure, the maritime sector can promptly embrace just-in-time arrival, leading to significant reductions in CO2 emissions and fostering a more sustainable shipping industry.
The remainder of this paper is organized as follows. In Section 2, the research problem is defined, which involves evaluating the potential effects that the just-in-time arrival policy has on the carbon emissions of ships. The designed experimental process for a decarbonized voyage without waiting time—which is the aim of this research—is described in Section 2.1.1. The novel aspects of this research are presented in Section 2.1.2, in which they are compared with aspects from previous research related to the carbon quantification and just-in-time arrival of the vessels. In Section 2.2, the data-modeling approach utilized to calculate the CII is explained. First, CII modeling is explained in detail in Section 2.2.1. Exemplary models of the fuel oil consumption of a ship’s AIS (Automatic Identification System), the engine characteristics of vessels, and route modeling are described in Section 2.2.2, Section 2.2.3 and Section 2.2.4. Modeling of the DWT (Deadweight) and CF (Carbon Factor) is detailed in Section 2.2.2. The change in the amount of CO2 is calculated by combining the waiting time and the change in voyage speed, as described in Section 2.2.3. The distance parameter of the carbon intensity indicator is obtained from the route modeling of each vessel, which is described in Section 2.2.4.
In Section 3, the results of the analysis quantifying the CO2 and CII when the just-in-time arrival is used (or not) are provided. Real berth arrival and departure data generated by the Pusan new international terminal in the period from 22–30 September 2022 are utilized to assess the just-in-time arrival strategy’s effect on voyage performance. Section 3.1, Section 3.2 and Section 3.3 quantify waiting time, which is the difference between the estimated time of arrival and the actual time of arrival at every berth of the Pusan new international terminal. Furthermore, the reductions in CII and EEXI are evaluated when the JITA method is adopted (or not) for vessel voyage planning.
In Section 4, the results of the analysis given in Section 3 are discussed, the statistics regarding the changes in the vessel’s CII and EEXI are reviewed, and the grade of CII and the reduction in the carbon emission values of the target vessels are detailed. Future directions for relevant research are also included in Section 4.
2. Materials and Methods
2.1. Research Problem Formulation
2.1.1. Problem Formulation
The goal of this study is to test the hypothesis that the use of the just-in-time operation can reduce CO2 emissions of vessels instantaneously. To prove this hypothesis, the following experimental methods were designed:
- Step 1. Quantification of the waiting time of the vessel at the port by subtracting the actual time of arrival from the estimated time of arrival.
- Step 2. Conversion of the waiting time to the extra voyage time needed to realize just-in-time arrival.
- Step 3. Optimization of the speed that can minimize the CO2 emissions based on the vessel’s route information.
- Step 4. Calculation of the CO2 emissions and the corresponding carbon intensity indicator estimate, as shown in Equation (1).
The overall research methodology is presented in Figure 1.
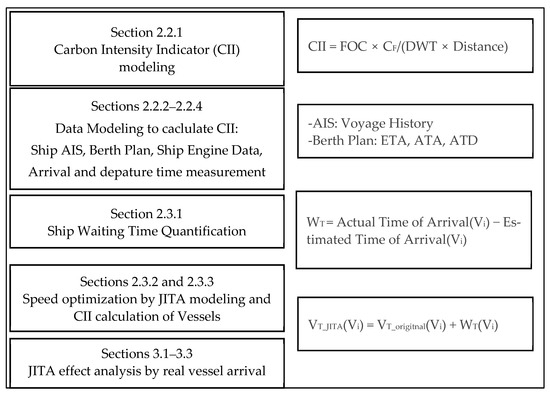
Figure 1.
Schematic diagram of research.
2.1.2. Novelty of the Research
The novel aspects of this research are elaborated in the following. First, time stamps for exchanges between the ship and the terminal are designed and applied to enhance the vessel’s voyage efficiency. Second, the just-in-time arrival policy, which transforms the waiting time at the port into extra voyage time, is applied to the voyage policy, and its effects on the carbon emissions and the carbon intensity indicator are analyzed. Previous research has analyzed the variation in the carbon emissions of a vessel based on a given scenario or its past voyage history. Meanwhile, in this research, we adopt the real ship arrival and departure schedule of a terminal from the digital twin infrastructure of the Pusan new international terminal. Finally, we draw on previous references adopting scenario-based route modeling to calculate the vessel’s carbon emissions; however, the method used in our research considers the novel AIS route modeling approach, which can measure distance and voyage speed (i.e., the parameters of CII). The novel aspects of the proposed research are summarized in Table 1.

Table 1.
Novel aspects of the proposed research.
2.2. Used Data
2.2.1. Carbon Intensity Indicator Modeling
The IMO aims to reduce carbon emissions. In 2023, the IMO set the goal of reducing the carbon emissions of seaborne trade by as much as 70% by 2050 in comparison to 2008 [16,17,17,18,19,20,21,22]. The Carbon Intensity Indicator was recently proposed for the quantification of the carbon emissions of vessels. It was invented based on the deadweight of a vessel. According to [14], the reference CII for container vessels can be defined as follows:
where, for a container ship, a = 1984, and c = 0.489 [16]. CIIref is the reference value of CII.
CIIreference = 1984 Deadweight (DWT)−0.489,
Each vessel’s CII can be attained as follows:
where CF is the carbon factor, and D is the distance sailed. CF is the carbon factor associated with a certain fuel type. The fuel type of a vessel can be obtained from its engine data.
Table 2 summarizes the carbon factors for different fuel types. In this study, we use the specific CF value of each vessel. In our calculations, MDO (Marine Diesel Oil) and HFO (Heavy Fuel Oil) engines covered all the vessels considered in the case study.
Table 2.
Carbon factors CF [16].
2.2.2. Ship Capacity and Engine Information
Table 3 presents the vessel-specific information table for the CII values detailed in Section 3. The vessel MSSI values are concealed and thus coded as V1–V15. The data were obtained via web-crawling. Fuel type, max speed, and SFOC were obtained from the engine manuals of each vessel (Vi). These data are parameters that are necessary for the calculation of the CII.
Table 3.
Ship capacity and engine information [17,23,24,25,26,27,28,29,30,31,32].
2.2.3. Ship Arrival and Departure Data
The main idea of the JITA policy is to convert a vessel’s waiting time in a port into additional voyage time, thus reducing the voyage speed and, therefore, carbon emissions. Therefore, the waiting time at the port needs to be quantified to calculate the additional voyage time for the JITA. To evaluate the effect of just-in-time arrival for a ship, the digital twin infrastructure of Pusan was considered; that is, the digital twin infrastructure was used as the platform to gather all of the data from vessels and terminal objects needed for the evaluation of the effect of JITA. Figure 2 depicts the digital twin infrastructure of the target terminal in Pusan new port.
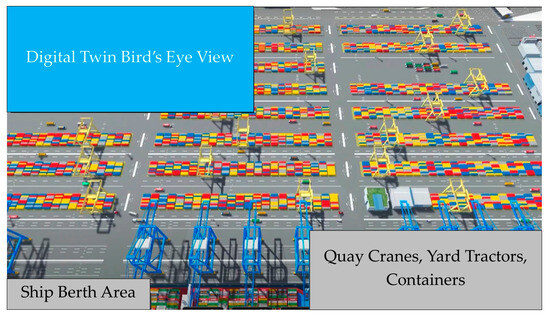
Figure 2.
Pusan New International Terminal’s digital twin.
ETA (Estimated Time of Arrival) and ATA (Actual Time of Arrival) data were obtained from the terminal operation system of Pusan international terminal (PNIT). The terminal operating system (TOS), which organizes the scheduling and planning of port objects and vehicles, contains all of the timestamps that are used in the terminal. Table 2 shows the data gathered from the TOS of the PNIT digital twin. In the case of the ATA and ETA, the update history is also stored in the TOS, and the algorithm updates every 5 min. The additional voyage time under JITA can be obtained according to the difference between the ETA and ATA of the vessel. Table 4 presents the data of the terminal operating system.
Table 4.
Ship arrival and departure data from the terminal operating system in PNIT’s digital twin.
Figure 3 provides a summary of the ETA and the ATA of each vessel at one berth obtained from the TOS as an example. The x-axis represents time, while the y-axis represents the vessel list (Vi). Each row presents the planned time (ETA) in yellow boxes and the actual time (ATA) in blue boxes.
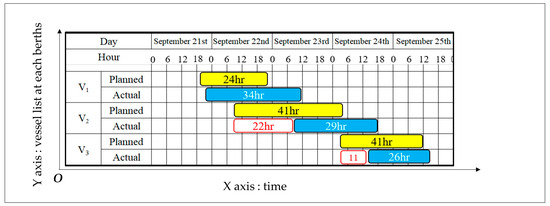
Figure 3.
Berth plan example.
Figure 4 shows the layout of the Pusan New Port terminal, which is the subject of this study. The studied terminal has three berths, as presented in Figure 4. Each berth’s CII variation was investigated for the period from 22–30 September in 2022, as detailed in Section 3.1, Section 3.2 and Section 3.3.
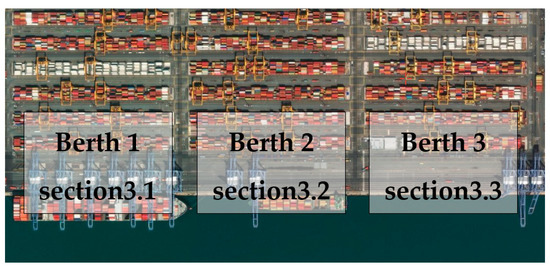
Figure 4.
Pusan New International Container Port—plan view.
2.2.4. Satellite AIS Data for the Distance Term of CII
We used satellite AIS data to generate each vessel’s route. One-year satellite AIS data were gathered, and representative routes were generated. The satellite AIS data are summarized in Table 3. Yoon et al. [13] proposed a method for modelling the representative route of a ship based on its AIS history. We adopted Yoon’s method to build the distance model for each vessel. Figure 5 shows a representative satellite AIS device, which was equipped in the vessels.
Figure 5.
Satellite Automatic Identification System.
Table 5 gives the raw data obtained from AIS.
Table 5.
AIS data sample.
The distance and fuel oil consumption terms of the CII affected the historical routes of the vessels. Figure 6 shows an example route modeling result. Each vessel’s representative route was determined from 1-year AIS historical data, which were transmitted from the vessel to the target terminal.
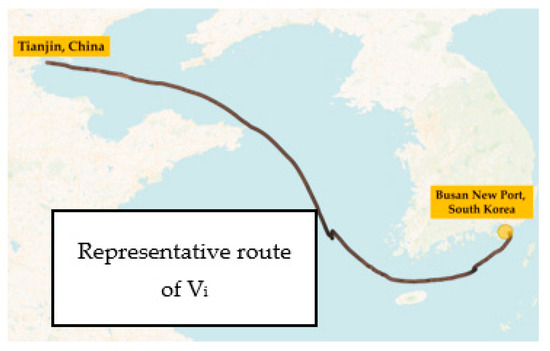
Figure 6.
Vessel route modeling.
Table 6 provides distance and previous port information. The amount of fuel oil consumed and the CO2 emissions are indirectly affected by the route distance. These data can be used to generate the distance for CII forecasting.
Table 6.
Ship distance and previous port information.
2.3. Methodology
In this section, the overall process for calculating the CII is explained. Section 2.3.1 describes the waiting time at port and how JITA can reduce CO2 emissions by using the waiting time as additional voyage data. In Section 2.3.2, fuel consumption and CO2 emissions reduction will be defined. In Section 2.3.3, we detail how CII and the EEXI (energy efficiency existing index) are obtained based on real ship arrival and departure data.
2.3.1. Ship Waiting Time (WT) Quantification
The just-in-time arrival method [8] minimizes waiting time and converts it into voyage time using the communication time stamps between the vessel and terminal. The IMO and the Digital Container Shipping Association developed the relevant standard [17] to promote the efficiency of vessels. Use of the JITA strategy can reduce CO2 emissions immediately, without requiring a change of engine or fuel. If a vessel can determine the expected waiting time at a port pre-emptively, it can travel at a reduced speed in order to arrive just in time. We calculated the waiting time according to the difference between the estimated time of arrival and the actual time of arrival. The terminal operating system obtains both time stamps of each vessel that berths in the terminal. The waiting time can be defined as follows:
WT (Vi) = Actual Time of Arrival (Vi) − Estimated Time of Arrival (Vi).
Figure 7 presents an example of the berth plan summarizing the vessel arrival and departure times. The yellow boxes present the planned cargo operation schedules of each vessel, while the blue boxes indicate the actual cargo operation schedules. The white boxes with a red outline represent the waiting time, which can be converted into JITA voyage time.
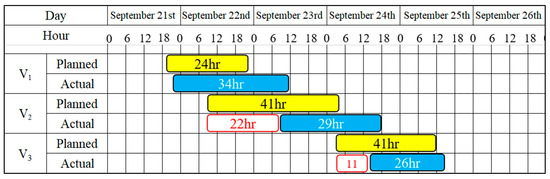
Figure 7.
Vessel berth plan.
Figure 8 presents the detailed components of the chart in Figure 7; the left edge is the actual time of arrival, and the right edge is the actual time of departure. Therefore, the delay can be quantified as the difference between the ATA and ETA. The key strategy of JITA is to maintain a minimum delay time through its re-utilization as sailing time. This strategy is typically carried out by reducing a vessel’s speed.
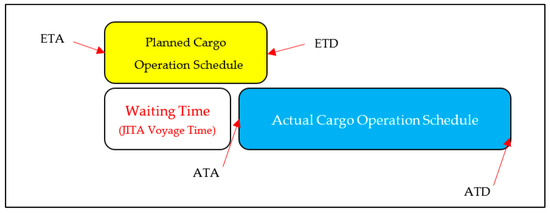
Figure 8.
Time stamps in the berth plan.
As a result, the waiting time of each vessel was obtained from the real data from Pusan international terminal, as presented in Table 7. The waiting time was converted into the additional voyage time in order to realize the JITA strategy.
Table 7.
Waiting times (WT) of the vessels.
Figure 9 presents a histogram of Table 5. According to the data, 5 ships waited for less than 4 h, 7 ships waited for more than 4 h and less than 24 h, and 3 ships waited for more than 24 h and less than 48 h.
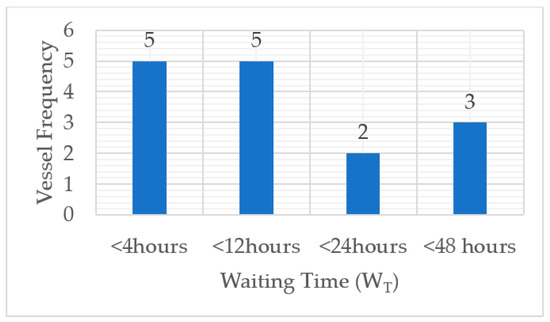
Figure 9.
Waiting times of the vessels (Vi) at the port.
2.3.2. Just-in-Time Arrival Policy
In this section, we explain how the JITA system can reduce CO2 emissions. For example, the conventional arrival policy and the JITA scheme are compared. Figure 10 presents the conventional arrival policy strategy for a container vessel. The original required time of arrival was 22 September at 10 a.m., but this was changed to 23 September at 8 a.m. (a 22 h shift). In this case, the vessel had lower fuel efficiency in two regards. First, the vessel arrived on 22 September at 10 a.m. near the port and anchorage. Thus, the vessel had an additional 22 h that could have been added to its voyage time at a slower speed. Second, bio-fouling, which increases resistance, would have been increasing during its anchorage time. Figure 10 presents the concept of the as-is operation.
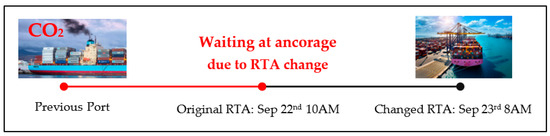
Figure 10.
Conventional arrival method (without JITA).
In contrast, Figure 11 presents the just-in-time arrival (JITA) operation concept. The main idea of the JITA concept is to maximally utilize a ship’s voyage time by pre-emptively perceiving the change in RTA. The vessel perceives the port operation situation—specifically, the cargo operations of previous vessels at the berth where the vessel will arrive—and then uses the remaining voyage time in an optimal manner to avoid any waiting time at anchorage. This strategy has two benefits. First, the ship sails at an optimal speed to minimize fuel oil consumption. Second, the use of JITA does not necessarily lead to any additional fuel oil consumption or CO2 emissions. Moreover, the lack of waiting time at anchorage ameliorates biofouling, as there is no time for the relevant organisms to form.
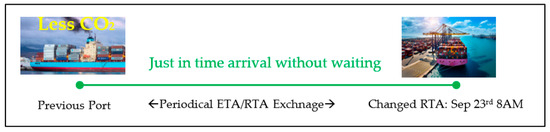
Figure 11.
Just-in-time arrival method (JITA case).
The voyage time and speed under the JITA policy can be obtained as follows:
where Vi denotes the ith vessel, VT is the voyage time, and WT is the waiting time.
VT_JITA (Vi) = VT_origitnal (Vi) + WT (Vi),
In the Equation above, Vs is the voyage speed.
The just-in-time arrival strategy utilizes waiting time as additional voyage time. Therefore, the use of JITA saves fuel and reduces CO2 emissions, when compared to the case without JITA, by facilitating travel at slower speeds. To calculate the efficiency improvement under JITA, it is necessary to calculate the estimated fuel oil consumption when the JITA voyage scheme is adopted. Notably, fuel oil consumption is the main index of EEXI and CII. In this study, we adopted the method of Kim [12] to calculate the ship’s fuel oil consumption, considering ship resistance and the propulsion power efficiency of the vessel, as follows:
where Power is the required Power (kW) of vessel i, ηshaft is the engine efficiency, ηpropeller is the propeller efficiency, ηengine is the engine efficiency, Rhull is the hull resistance, Vs is the ship speed, VT is the voyage time, CO2 denotes the carbon dioxide emissions (ton), and CF is the carbon factor associated with the fuel type.
Power (Vs(Vi)) = ηshaft ηpropeller ηengine (Rhull (Vs(Vi))),
2.3.3. Carbon Intensity Indicator (CII) Modeling
CII is a regulatory index that limits carbon emissions during voyages. As presented in Equation (1), CII represents the ratio of the quantity of CO2 emissions, the capacity, and the voyage distance. The CII of the ith vessel can be defined as in Equation (10):
According to the results of the MEPC 78th and 80th meetings, the CII standard will be strengthened annually. At this stage, the IMO designed the CII such that a 70% CO2 reduction could be achieved by 2050 compared to the baseline, i.e., 2008. This reduction is designed as the reduction factor in the CII, as shown in Equation (11)
where Z is a reduction factor that serves to regulate carbon emissions.
The reduction factor decrease level is defined until 2026, while the reduction factor Z for the following years will be defined by the MEPC (Maritime Environment Pollution Committee). In this study, we adopt the reduction factor set in the 2023–2026 standard. In particular, the reduction factor of 2023 is interpolated according to the medium value between 2026 and 2050. The reduction factor value by year is presented in Table 8.
Table 8.
Reduction factor (Z%) for the relative CII [16].
CII has five ratings for the evaluation of vessels, namely, A, B, C, D, and E. If a vessel obtains a rating of D or E continuously over 3 years, then its further voyage will be prohibited. In the case that a vessel provides a modified voyage plan, then its operations can be restored. The rates of CII are categorized using the factors di, which are associated with the limits of the inferior, upper, lower, and superior boundaries, as presented in Figure 12.
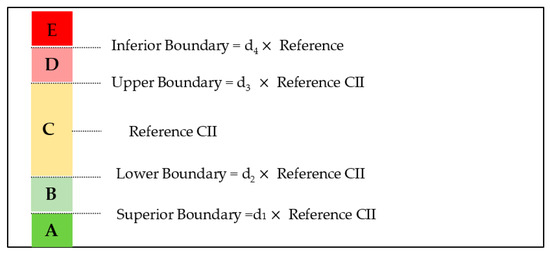
Figure 12.
CII ranks and boundary conditions.
Table 9.
Rating factors di for container ships [16].
For reference, the di values differ with the ship type [16]. In this study, we use the values for a container carrier. The EEXI (energy efficiency existing ship index) aims to reduce the carbon emissions of the maritime shipping chain, and it is another index representative of CO2 emissions. The process of the EEXI’s calculation is presented in Equations (16)–(18). The EEXI was designed to assess the amount of CO2 per mile, as can be seen from Equation (18). The difference between EEXI and the CII is that the velocity is substituted into the EEXI equation instead of distance.
where Cf is the carbon factor, and DWT is the capacity ton (deadweight—ton).
The calculated EEXI value denotes a ship’s energy efficiency compared to a reference value. The EEXI was developed by adopting the average energy efficiency of ships built between 1999 and 2009. The reference value according to a ship’s type and size can be inferred by following the NK rule [16], as presented in Table 10 for a container ship.
Table 10.
EEXI factor X—container case.
The required EEXI is the index that is satisfied by a ship’s voyage, as shown in Equation (19), through the combination of EEXIreference and a reduction factor X:
where EEXIreference is the reference value of EEXI.
The reduction factor is defined by the capacity of the container ship, as presented in Table 11.
Table 11.
EEXI factor X: container case [17,18,19,20,21,22,32].
3. Results
We analyzed the change in the CII with the use of JITA by considering real ship arrival and departure data obtained from the Pusan new international terminal within the period from 22–30 September 2022. The Pusan new international terminal is a container terminal that has three berths for ships. Section 3.1, Section 3.2 and Section 3.3 quantify the delay and investigate the CII variation of the vessels at each berth under the application of JITA.
3.1. The Case of Berth 1
In Figure 13, the yellow boxes present the times of the original cargo operation schedule of the vessels, and the left edge of the yellow box represents the original time of arrival of the vessels; for example, V1 originally intended to arrive on September 21st at 19:00 but actually arrived at 21:00. Therefore, its cargo unloading operations were delayed by two hours. Additionally, its cargo loading and unloading operations were delayed by a total of 10 hours compared to the original schedule. Consequently, V2 had to wait at the port in anchorage for 22 h. The JITA strategy converts this waiting time (i.e., 22 h) into voyage time to minimize the carbon emissions during sailing. The blue boxes in the chart show the real times of the cargo loading and unloading schedule at the berth, and the red-outlined boxes represent the waiting period of the vessels in anchorage. The times in the red-lined white boxes can be utilized as voyage times for just-in-time arrival operation-based voyage optimization.
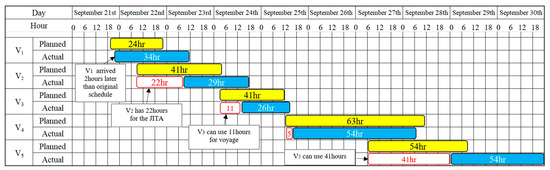
Figure 13.
Case 1: ETA and ATA of the vessels.
Table 12 summarizes the CII reference values for the vessels in berth 1 that changed according to the IMO guidelines for 2050. The Without JITA column in the table presents the CII when the JITA operation was not applied, while the With JITA column reveals the CII when the JITA strategy was utilized. An overall improvement in CII compared to the Without JITA case can be observed when the JITA operation scheme was adopted.
Table 12.
CII summary for Berth 1.
Figure 14 shows the CII and EEXI of V1. In the case of V1, the CII value without JITA was 14.8, while that with JITA was 11.4. Meanwhile, the required CII value varied from 6.9 in 2023 to 3.4 in 2050. Thus, V1 did not satisfy the CII reference both with and without JITA. When the JITA strategy was applied, the improvement was only 2 hours, so its effect was marginal. In terms of EEXI, the JITA operation strategy was inferior to the case without JITA. This result was due to the fact that EEXI has Vs in the denominator. The reduction due to JITA was marginal; therefore, the effect of JITA on the EEXI was trivial.
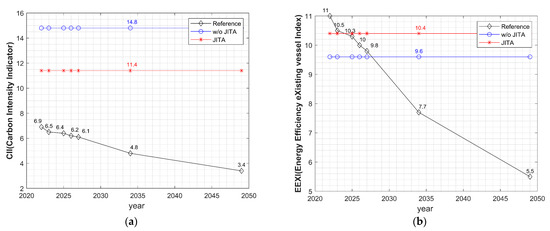
Figure 14.
(a) The CII values for V1; (b) the EEXI values for V1.
Meanwhile, V2 presented crucial enhancements in CII and EEXI through the application of JITA, as presented in Figure 15. The CII and EEXI of V2 did not meet the standard when the JITA operation was not applied. The CII of V2 with JITA satisfied the guideline CII value until 2050. In terms of EEXI, the EEXI of V2 also satisfied the required EEXI when the JITA operation was applied. This reduction was achieved without any change to the engine or fuel of the vessel. In the case of V2, the waiting time in anchorage was as long as the voyage time; therefore, the effect of JITA was clear.
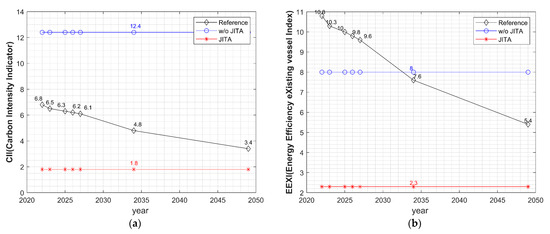
Figure 15.
(a) The CII values for V2; (b) the EEXI values for V2.
The case of V3 presented a different trend compared to the other vessels, as shown in Figure 16. Its waiting time at the port occupied 31% of its voyage time, which is relatively shorter than that of the other cases. Its original voyage time without JITA was 30 h, but this increased to 41 h with JITA. Additionally, its voyage time was about 31% longer. Consequently, the CII and EEXI values in the JITA case were lower than those without JITA. The CII value of V2 with JITA satisfied the requirement until 2032, while EEXI satisfied the requirement until 2040. Meanwhile, the CII without JITA did not meet the requirement, and the EEXI only met the requirement until 2027, that is, for 13 fewer years than when JITA was applied.
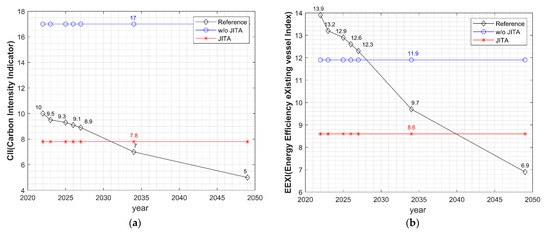
Figure 16.
(a) The CII values for V3; (b) the EEXI values for V3.
The V4 case also indicated that the JITA strategy was effective in reducing the CII and EEXI, as presented in Figure 17. The application of JITA reduced the CII from 17.2 to 10.0 and the EEXI from 12.0 to 9.7. In consequence, Vessel 4 satisfied the EEXI requirement until 2027. Figure 18 presents the CII grade of Vessel 4. Initially, the JITA application case was graded at rank D but was expected to be reclassified as rank E by 2023. Meanwhile, without the application of JITA, it obtained a grade of E and was far from the inferior boundary of rank E, making it hard to escape the CII penalty.
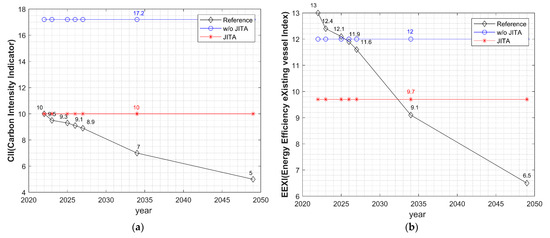
Figure 17.
(a) The CII values for V4; (b) the EEXI values for V4.
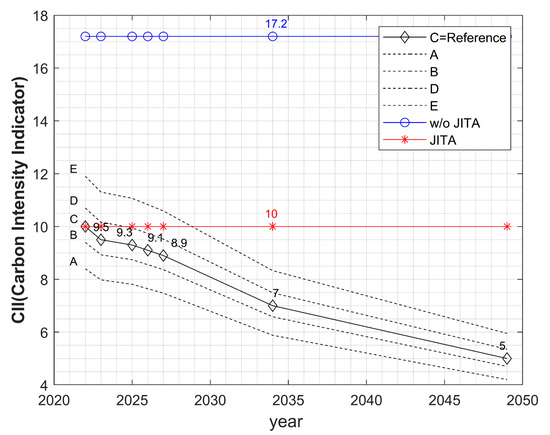
Figure 18.
The CII ranks and the attained CII of V4.
As shown in Figure 19, JITA also worked well in the case of V5, which waited 41 h more than its original estimated arrival. The voyage time of V5 was only 25 h, after which it waited 164% longer than its original voyage time. Therefore, the V5 case presented significant reductions in both CII and EEXI. Naturally, when the waiting time at the port is longer, the effects of JITA on the CII and EEXI become greater, with 22 h being saved by applying JITA in this case.
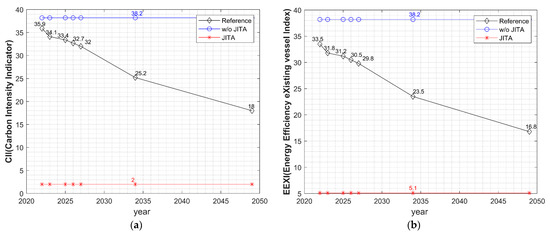
Figure 19.
(a) The CII values for V5; (b) the EEXI values for V5.
3.2. The Case of Berth 2
The waiting time in the case of berth 2 was generally lower than that for berth 1. Both V6 and V7 were behind schedule by under 2 h; V8 and V9 waited 8 and 7 h, respectively; and V10 waited for 24 h, as shown in Figure 20. Thus, the cargo operation efficiency was better than that in the case of berth 1.
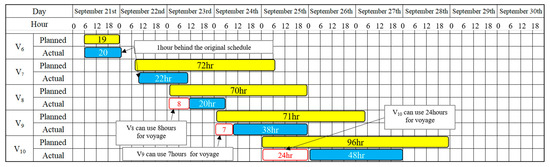
Figure 20.
Case 2 ETA and ATA of the vessels.
Table 13 summarizes the annual carbon intensity indicator from 2023 to 2025 for the vessels that arrived at Berth 2 with and without the application of JITA. The CII variation due to JITA for V6 and V7 was marginal, while the CII changes due to JITA for the cases of V7, V8, V9, and V10 were meaningful. The cases of V8 and V10 exceeded the reference CII in all the coming years without JITA, while the JITA application cases were below the CII reference.
Table 13.
CII summary for Berth 2.
Figure 21 shows the CII and EEXI values for V7. The CII without JITA was originally 16.3 and then changed to 14.7 with JITA. The EEXI of V7 was originally 13.1 and then changed to 12.2 when JITA was applied.
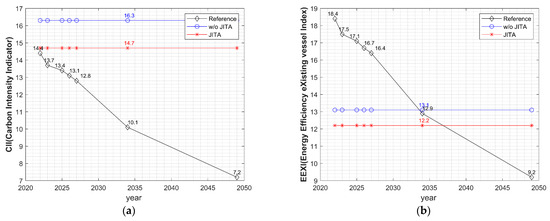
Figure 21.
(a) The CII values for V7; (b) the EEXI values for V7.
Figure 22 presents the CII and EEXI calculation results for V8. The CII of this vessel without JITA was originally 16.2 but changed to 6.9 with JITA. The EEXI of V7 was originally 13.1 but changed to 12.2 with JITA. Considering the CII reference value trend with respect to year, the CII results with JITA were expected to surpass the reference value in 2028. Meanwhile, the with-JITA cases satisfied the CII standard through to 2050.
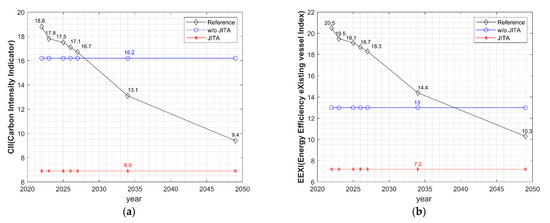
Figure 22.
(a) The CII values for V8; (b) the EEXI values for V8.
Figure 23 illustrates the CII and EEXI values for V10. The CII results for V10 showed a similar trend to those for V8. The CII value without JITA was 16.3, while that with JITA was 2.1. The waiting time of V10 was the longest for berth 2. Therefore, the CII value without JITA could not meet the CII reference line, while the CII result with JITA case satisfied the CII reference through to 2050.
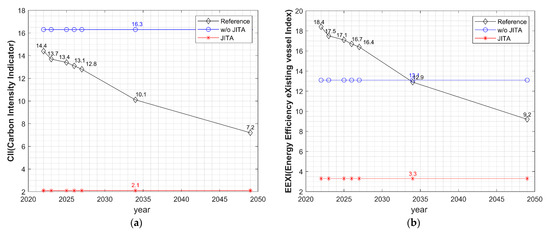
Figure 23.
(a) The CII values for V10; (b) the EEXI values for V10.
The rest of the charts for the case of Berth 2 are in Appendix A.
3.3. Berth 3 Case
In the case of Berth 3, as shown in Figure 24, V11 and V12 only waited one hour for the cargo operation, which was finished in a way that met the planned schedule. It can be inferred from these data that the estimated time of departure has a time buffer. This phenomenon was repeatedly investigated in the cases of V13–V15. In the case of V13, the cargo operation was finished 52 h earlier than the original schedule. This tendency was also observed in the V14 and V15 cases. The actual times of departure of V14 and V15 were 33 and 82 hours earlier than the original schedule, respectively. This result suggests that it would be worth predicting the ETD and analyzing the parameters that contribute to the time of departure of the vessels.
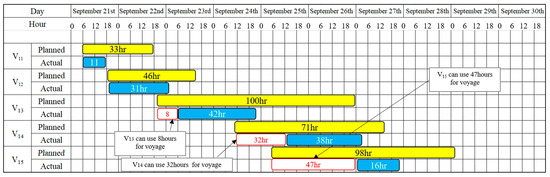
Figure 24.
Case 3—ETA and ATA of the vessels.
Table 14 provides a summary of the CII index values according to whether the JITA operation was used or not. An overall reduction in CII was observed due to the conversion of waiting times at the port into voyage time through the just-in-time arrival policy. A significant reduction in CII was detected in the cases of V14 and V15. The results for V14 and V15 were delayed due to their long waiting time at the port. Meanwhile, the CII reduction effect for V13 was relatively small, as it had a voyage distance that was five times longer when compared to the V14 case. It can be concluded that a long waiting time is meaningful with respect to predicting lower CII values for a long-distance voyage.
Table 14.
CII summary for Berth 3.
Figure 25 shows the CII and EEXI values for V11. Based on the results, V11 only waited for one hour at the port, so the CII and EEXI improvements were marginal. The CII values of V11 with and without JITA both failed to meet the CII and EEXI reference values.
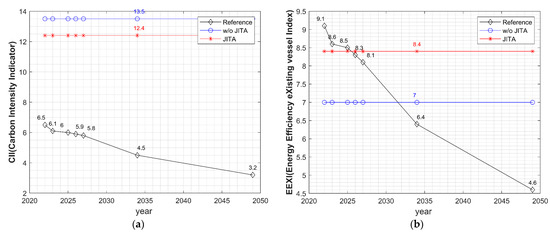
Figure 25.
(a) The CII values for V11; (b) the EEXI values for V11.
Figure 26 shows the CII and EEXI values for V15. Based on the results, V15 waited at the port for 47 h, thus rendering the CII and EEXI improvements significant. The CII of V15 before applying JITA did not satisfy the CII reference, while the voyage with JITA fell far below the CII reference.
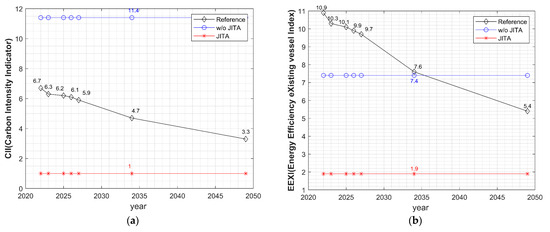
Figure 26.
(a) The CII values for V15; (b) the EEXI values for V15.
The rest of the charts for the case of Berth 3 are provided in Appendix A.
4. Discussion
In this study, we investigated the variation in carbon emissions caused by implementing the just-in-time arrival operation for vessels. The carbon intensity indicator—the IMO CO2 regulation standard—was quantified by correcting the voyage speed through the conversion of the waiting time at port into voyage time. To quantify the effect on CII, real operation data from a container terminal were collected from the digital twin infrastructure of the Pusan New International Terminal, located at the Pusan new port, South Korea. Based on real cases, the potential CO2 savings under the just-in-time arrival strategy were unveiled. The real operation data of a total of 15 vessels, which had different capacities, engines, and voyage routes, were used to test our hypothesis. The CO2 emissions were found to be reduced, as the just-in-time arrival strategy minimizes the waiting time and converts it into the voyage time, through the realization of the slow-steaming policy.
According to the results of the analysis, ship carbon emissions decreased by an average of 45.8% and a maximum of 91% compared to when the just-in-time arrival strategy was not applied. In addition, 87.0% of vessels showed a carbon intensity indicator rank improvement, extending the period that they could satisfy carbon intensity regulations by an average of 11 years and a maximum of 27 years by applying the proposed just-in-time arrival policy. This result implies that the just-in-time arrival strategy can prolong the voyage time of vessels while satisfying carbon emissions regulations. For reference, regarding the average vessel lifetime of around 20 years, 11 years accounts for almost 55% of the lifetime of a vessel.
A reduction in CII was observed when implementing the JITA operation in every case. In most of the cases, the JITA operation scheme significantly improved the CII grade. Consequently, it can be concluded that the JITA strategy reduced carbon emissions; however, it is worth considering that this method only measures fuel consumption and CO2 emissions during a voyage.
A CII reduction can be attained when a vessel waits for longer at a port through the use of JITA. The longer the vessels wait and the shorter their voyage periods become, the greater the reduction in CII. Further, the JITA scheme is more effective for large-capacity vessels than small-capacity vessels.
Newly built ships have many design options for reducing their carbon emissions, but existing ships have fewer options to reduce their carbon emissions, as re-docking and the fixing/processing of the propulsion system is a financially challenging option given that these operations create downtime. Therefore, the JITA scheme can provide an instantaneous solution to this issue under a strengthened CO2 reduction policy. The accompanying benefits, such as anti-fouling and hull-life extension, can also positively reduce more CO2 emissions.
The JITA operation scheme can be realized through the analysis of the time of arrival and time of departure exchanged between the vessel and port. In this study, the digital infrastructure of Pusan new international port (i.e., the digital twin model of Pusan’s port) was considered; however, the IMO and the DCSA [33] provide a standard structure that could be used to exchange the time stamps related to a vessel’s arrival and departure.
Prediction methods that forecast departure times are worth further investigation. The estimated time of arrival is affected by the cargo operation time of previous vessels at the same berth. If a vessel can predict and obtain the estimated time of departure of the prior vessel, then it can utilize the estimated time of departure to forecast its own just-in-time arrival. Moreover, real-time data exchange without delay between vessels and ports is worth exploring in order to ensure that just-in-time arrival is possible. If there is an unexpected voyage plan change, then the port and vessel could exchange the update arrival and departure time stamps using such a real-time data exchange process. For this exchange, the data communication method and process need to be standardized. In addition, this research only focused on container vessels, but the application of just-in-time arrival policies to vessels carrying other cargos (e.g., LNG, tankers, and Ro-Ro vessels) is also a valuable research direction. In particular, we plan to study the just-in-time arrival policy for carbon reduction considering multiple ports, not just a single port target. In the case of the just-in-time arrival policy, time stamp exchange between ports provides the possibility of further improving carbon emissions reduction.
Author Contributions
Conceptualization, S.-W.K.; methodology, J.-O.E.; software, S.-W.K.; validation, J.-O.E. and S.-W.K.; formal analysis, S.-W.K.; resources, S.-W.K.; data curation, J.-O.E. and S.-W.K.; writing—original draft preparation, S.-W.K.; writing—review and editing, S.-W.K.; visualization, J.-O.E.; supervision, S.-W.K.; funding acquisition, S.-W.K. All authors have read and agreed to the published version of the manuscript.
Funding
The Ministry of Science and ICT (MSIT), Republic of Korea, through the ICT Challenge and Advanced Network of HRD (ICAN) program (IITP-2023-RS-2022-00156345), under the supervision of the Institute for Information and Communications Technology, Planning, and Evaluation (IITP).
Data Availability Statement
Data are contained within the article.
Conflicts of Interest
The authors declare no conflict of interest.
Acronyms and Nomenclatures
| GHG | Green House Gas |
| IMO | International Maritime Organization |
| CII | Carbon Intensity Indicator |
| AIS | Automatic Identification System |
| TOS | Terminal Operating System |
| EEXI | Energy efficiency existing index |
| MEPC | Marine Environment Protection Committee |
| DWT | Dead Weight |
| SFOC | Specific Fuel Oil Consumption |
| HFO | Heavy Fuel Oil |
| MDO | Marine Diesel Oil |
| MMSI | Maritime Mobile Service Identity |
| JITA | Just-in-Time Arrival |
| ETA | Estimated Time of Arrival |
| ATA | Actual Time of Arrival |
| RTA | Required Time of Arrival |
| ETD | Estimated Time of Departure |
| CF | Carbon Factor |
| CIIref | CII Reference Value |
| D | Voyage Distance |
| Vi | ith vessel |
| WT | Waiting Time |
| Vs | Vessel Speed |
| VT | Voyage Time |
| Rhull | Hull Resistance |
| η | Delivery Efficiency |
Appendix A. CII and EEXI Charts of the Vessels
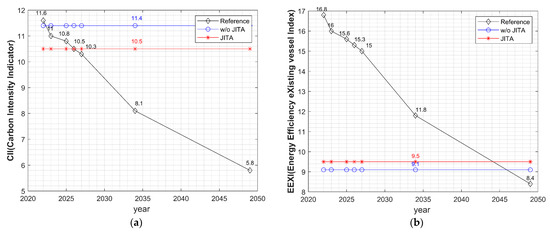
Figure A1.
(a) The CII values for V6; (b) the EEXI values for V6.
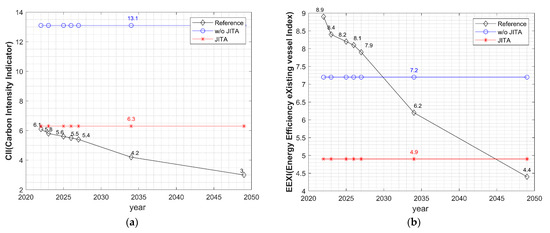
Figure A2.
(a) The CII values for V9; (b) the EEXI values for V9.
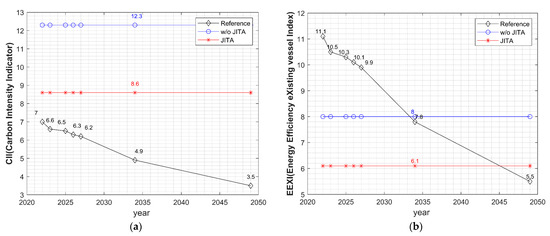
Figure A3.
(a) The CII values for V12; (b) the EEXI values for V12.
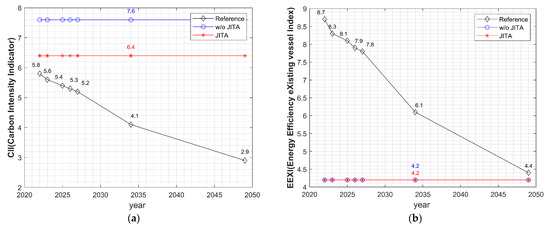
Figure A4.
(a) The CII values for V13; (b) the EEXI values for V13.
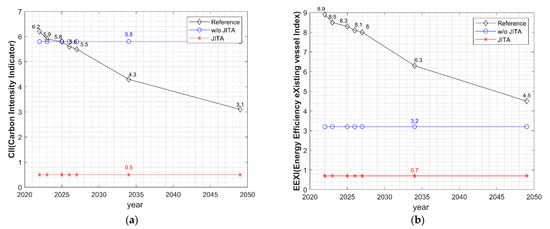
Figure A5.
(a) The CII values for V14; (b) the EEXI values for V14.
References
- Joung, T.H.; Kang, S.G.; Lee, J.K.; Ahn, J. The IMO initial strategy for reducing Greenhouse Gas (GHG) emissions, and its follow-up actions towards 2050. J. Int. Marit. Saf. Environ. Aff. Shipp. 2020, 4, 1–7. [Google Scholar] [CrossRef]
- Serra, P.; Fancello, G. Towards the IMO’s GHG goals: A critical overview of the perspectives and challenges of the main options for decarbonizing international shipping. Sustainability 2020, 12, 3220. [Google Scholar] [CrossRef]
- Winnes, H.; Styhre, L.; Fridell, E. Reducing GHG emissions from ships in port areas. Res. Trans. Busi. Mana. 2015, 17, 73–82. [Google Scholar] [CrossRef]
- Halim, R.A.; Smith, T.; Englert, D.P. Understanding the Economic Impacts of Greenhouse Gas Mitigation Policies on Shipping: What Is the State of the Art of Current Modeling Approaches? World Bank Policy Research Working Paper 8695; World Bank: Washington, DC, USA, 2019. [Google Scholar]
- Gianni, M.; Pietra, A.; Coraddu, A.; Taccani, R. Impact of SOFC Power Generation Plant on Carbon Intensity Index (CII) Calculation for Cruise Ships. J. Mar. Sci. Eng. 2022, 10, 1478. [Google Scholar] [CrossRef]
- Braidotti, L.; Bertagna, S.; Rappoccio, R.; Utzeri, S.; Bucci, V.; Marinò, A. On the inconsistency and revision of Carbon Intensity Indicator for cruise ships. Transp. Res. Part D Transp. Environ. 2023, 118, 103662. [Google Scholar] [CrossRef]
- Bayraktar, M.; Yuksel, O. A scenario-based assessment of the energy efficiency existing ship index (EEXI) and carbon intensity indicator (CII) regulations. Ocean Eng. 2023, 278, 114295. [Google Scholar] [CrossRef]
- Yu, J.; Voß, S. Towards Just-In-Time Arrival for Container Ships by the Integration of Prediction Models. In Proceedings of the 56th Hawaii International Conference on System Sciences, Hawaii, HI, USA, 4 January 2023. [Google Scholar]
- Senss, A.; Canbulat, O.; Uzun, D.; Gunbeyaz, S.A.; Turan, O. Just in time vessel arrival system for dry bulk carriers. J. Ship. Trade 2023, 8, 12. [Google Scholar] [CrossRef]
- Mudzzaffar, H.B. Ship Route Optimization to Enable the Just-in-Time Arrival at a Port. Master’s Thesis, Nanyang Technological University, Singapore, 2022. [Google Scholar]
- Vermeulen, M. Identifying and Improving Port Call Processes to Enable Just-In-Time Arrivals and Services: A Case Study on MSC Container Shipping in the Port of Rotterdam. Master’s Thesis, Delft University of Technology, Delft, The Netherlands, 10 September 2020. [Google Scholar]
- Kim, S.; Yun, S.; You, Y. Eco-Friendly speed control algorithm development for autonomous vessel route planning. J. Mar. Sci. Eng. 2021, 9, 583. [Google Scholar] [CrossRef]
- Yoon, J.H.; Kim, D.H.; Yun, S.W.; Kim, H.J.; Kim, S. Enhancing Container Vessel Arrival Time Prediction through Past Voyage Route Modeling: A Case Study of Busan New Port. J. Mar. Sci. Eng. 2023, 11, 1234. [Google Scholar] [CrossRef]
- Arjona, J.; Giménez, A.; Ferrús, G.; Alonso, N.; Calabria, L.; Lara, J. Enabling a green just-in-time navigation through stakeholder collaboration. Eur. Transp. Res. Rev. 2020, 12, 22. [Google Scholar] [CrossRef]
- De Andres Gonzalez, O.; Koivisto, H.; Mustonen, J.M.; Keinänen-Toivola, M.M. Digitalization in just-in-time approach as a sustainable solution for maritime logistics in the baltic sea region. Sustainability 2021, 13, 1173. [Google Scholar] [CrossRef]
- ClassNK. Available online: https://www.classnk.or.jp/hp/pdf/activities/statutory/seemp/CII_en.pdf (accessed on 19 August 2023).
- IMO. Available online: https://wwwcdn.imo.org/localresources/en/OurWork/Environment/Documents/Air%20pollution/MEPC.337(76).pdf (accessed on 19 August 2023).
- IMO. Available online: https://wwwcdn.imo.org/localresources/en/KnowledgeCentre/IndexofIMOResolutions/MEPCDocuments/MEPC.334(76).pdf (accessed on 19 August 2023).
- IMO. Available online: https://wwwcdn.imo.org/localresources/en/KnowledgeCentre/IndexofIMOResolutions/MEPCDocuments/MEPC.333(76).pdf (accessed on 19 August 2023).
- IMO. Available online: https://wwwcdn.imo.org/localresources/en/OurWork/Environment/Documents/Air%20pollution/MEPC.339(76).pdf (accessed on 19 August 2023).
- IMO. Available online: https://wwwcdn.imo.org/localresources/en/OurWork/Environment/Documents/Air%20pollution/MEPC.338(76).pdf (accessed on 19 August 2023).
- IMO. Available online: https://www.imo.org/en/MediaCentre/PressBriefings/pages/CII-and-EEXI-entry-into-force.aspx (accessed on 19 August 2023).
- Man. Available online: https://man-es.com/applications/projectguides/2stroke/content/printed/S90ME-C10_2-GI.pdf (accessed on 19 August 2023).
- Man. Available online: https://man-es.com/applications/projectguides/2stroke/content/printed/G60ME-C9_5-GI.pdf (accessed on 19 August 2023).
- Man. Available online: https://man-es.com/applications/projectguides/2stroke/content/printed/k90mcc6.pdf (accessed on 19 August 2023).
- Wärtsilä. Available online: https://www.wartsila.com/marine/products/engines-and-generating-sets/diesel-engines/wartsila-32 (accessed on 19 August 2023).
- Man. Available online: https://man-es.com/applications/projectguides/2stroke/content/printed/s60mcc8.pdf (accessed on 19 August 2023).
- Man. Available online: https://man-es.com/applications/projectguides/2stroke/content/printed/l60mcc8.pdf (accessed on 19 August 2023).
- Man. Available online: https://man-es.com/applications/projectguides/2stroke/content/printed/S90ME-C9_2.pdf (accessed on 19 August 2023).
- Wärtsilä. Available online: https://www.wartsila.com/docs/default-source/product-files/engines/ls-x-engine/wartsila-o-e-ls-x92.pdf?sfvrsn=2 (accessed on 19 August 2023).
- Man. Available online: https://man-es.com/applications/projectguides/2stroke/content/printed/G80ME-C9_2.pdf (accessed on 19 August 2023).
- ClassNK. Available online: https://www.classnk.or.jp/hp/pdf/activities/statutory/eexi/eexi_rev3e.pdf (accessed on 19 August 2023).
- DCSA. Available online: https://dcsa.org/standards/jit-port-call/ (accessed on 19 August 2023).
Disclaimer/Publisher’s Note: The statements, opinions and data contained in all publications are solely those of the individual author(s) and contributor(s) and not of MDPI and/or the editor(s). MDPI and/or the editor(s) disclaim responsibility for any injury to people or property resulting from any ideas, methods, instructions or products referred to in the content. |
© 2023 by the authors. Licensee MDPI, Basel, Switzerland. This article is an open access article distributed under the terms and conditions of the Creative Commons Attribution (CC BY) license (https://creativecommons.org/licenses/by/4.0/).