


Ship Carbon Intensity Indicator Assessment via Just-in-Time Arrival Algorithm Based on Real-Time Data: Case Study of Pusan New International Port


Abstract
:1. Introduction
2. Materials and Methods
2.1. Research Problem Formulation
2.1.1. Problem Formulation
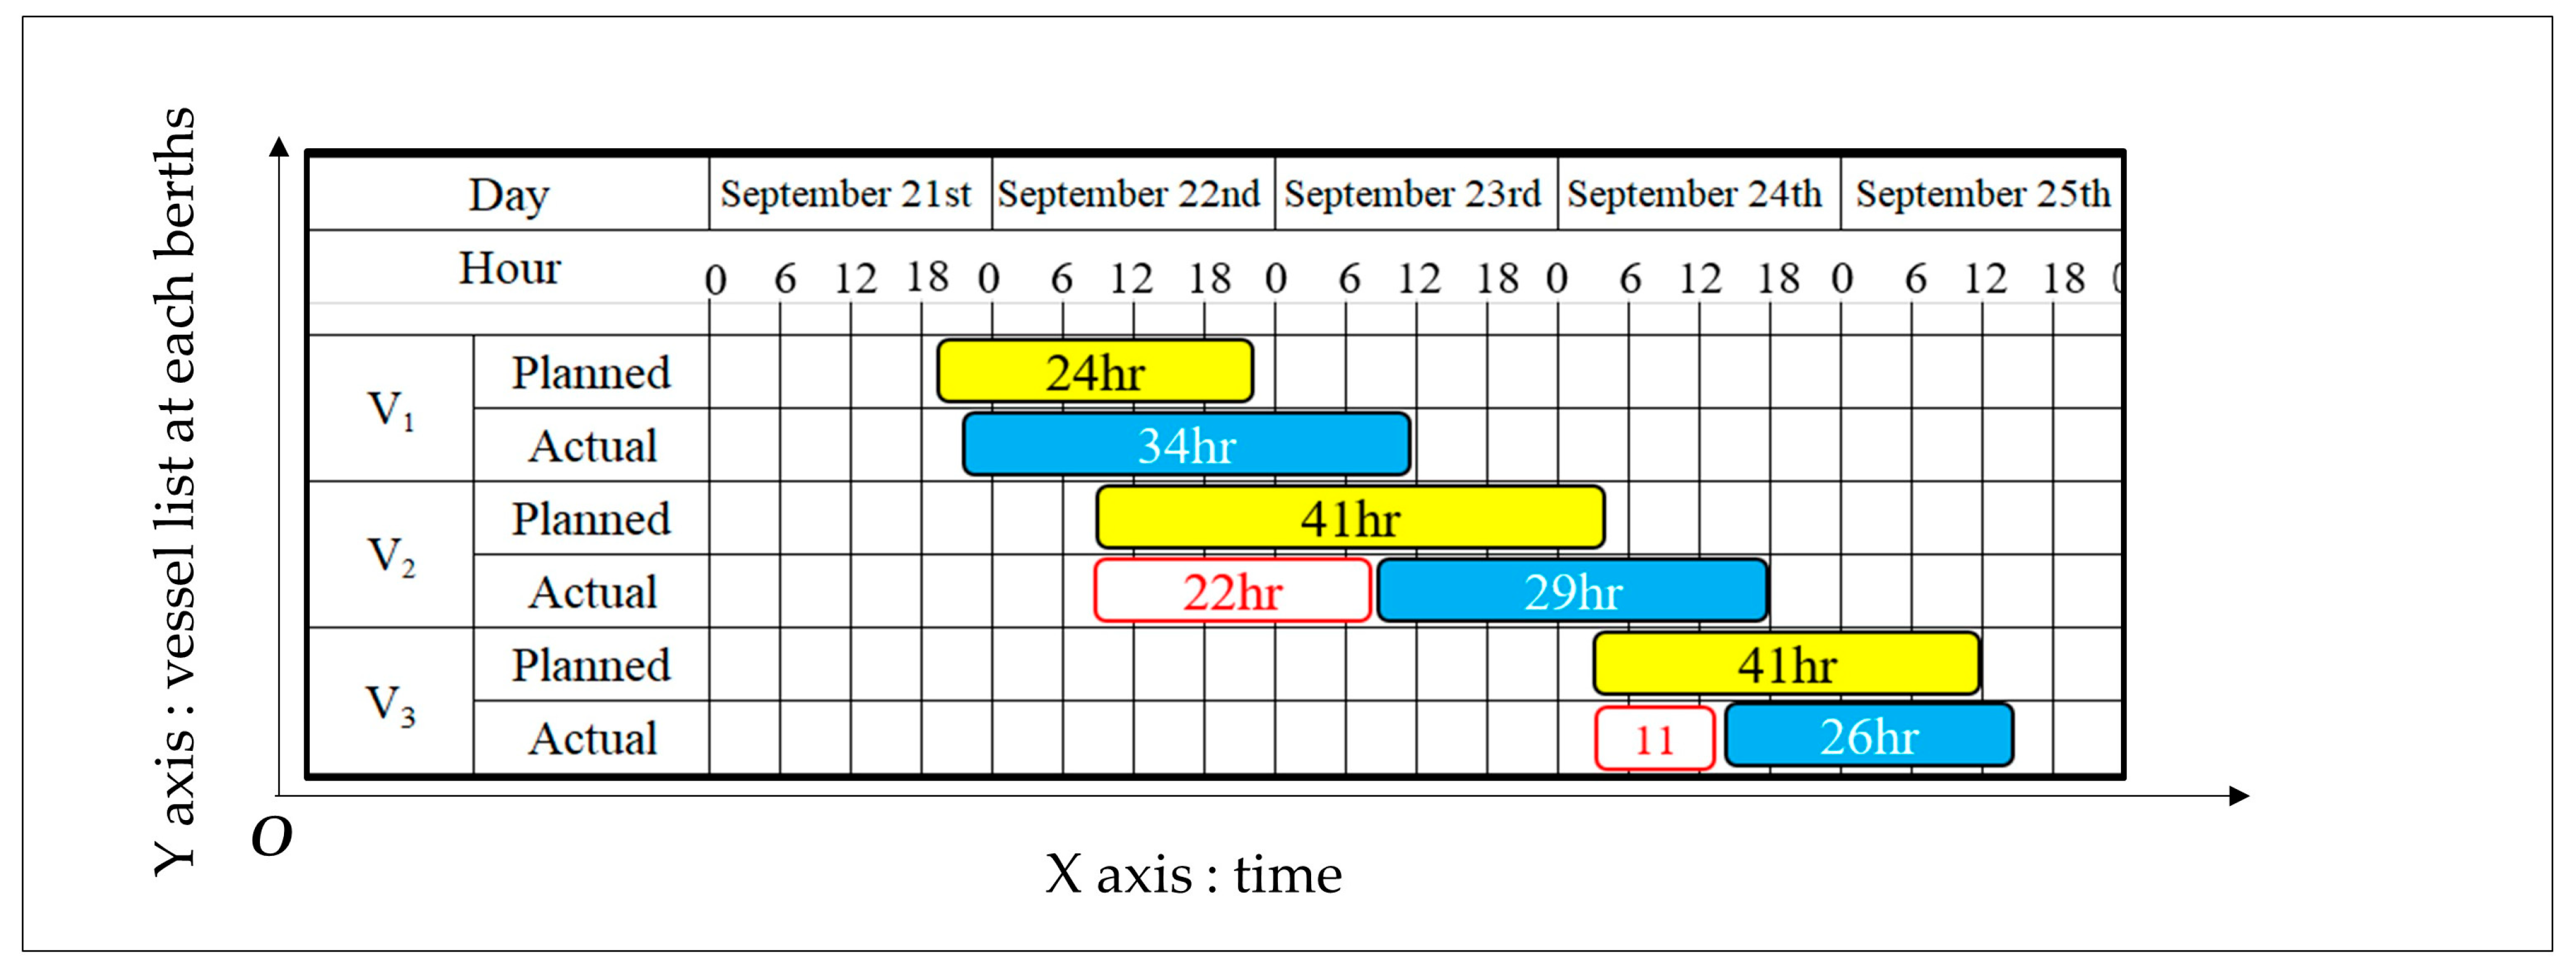
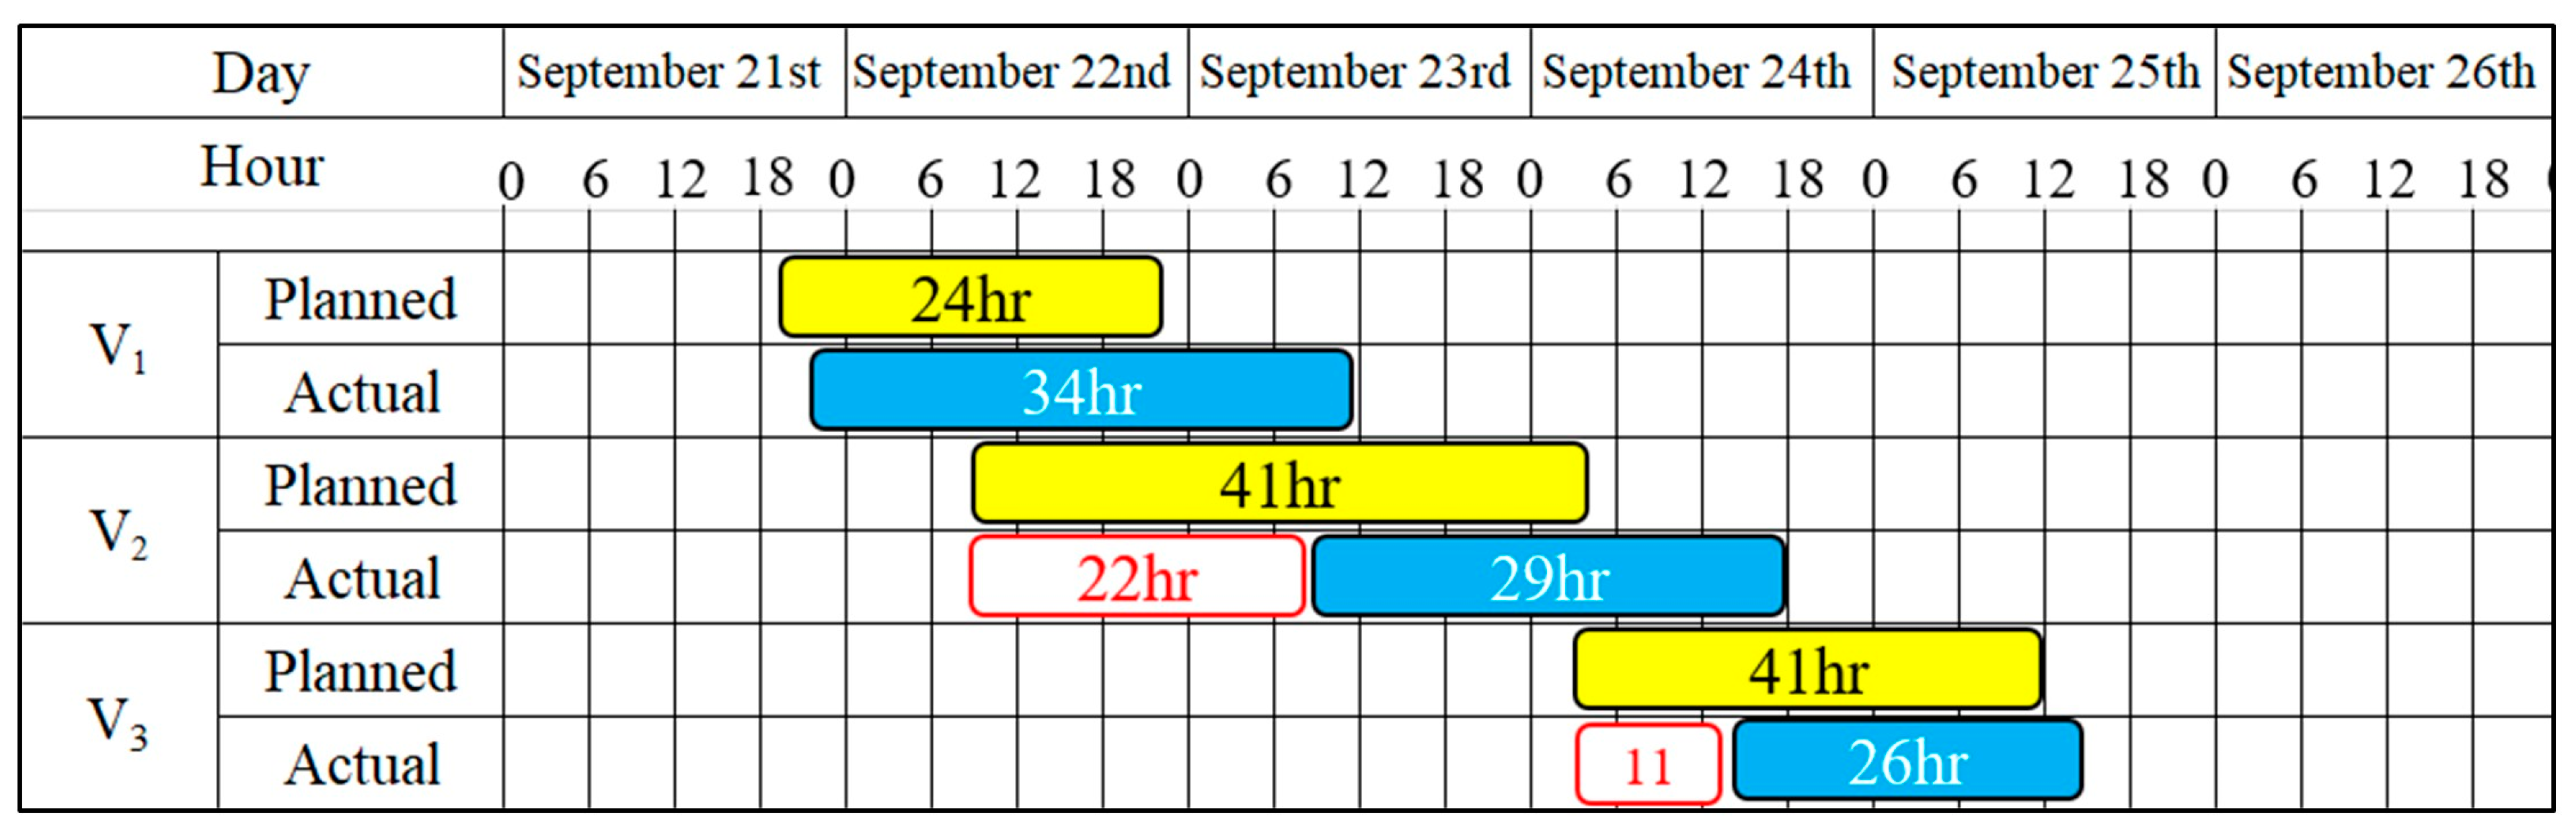
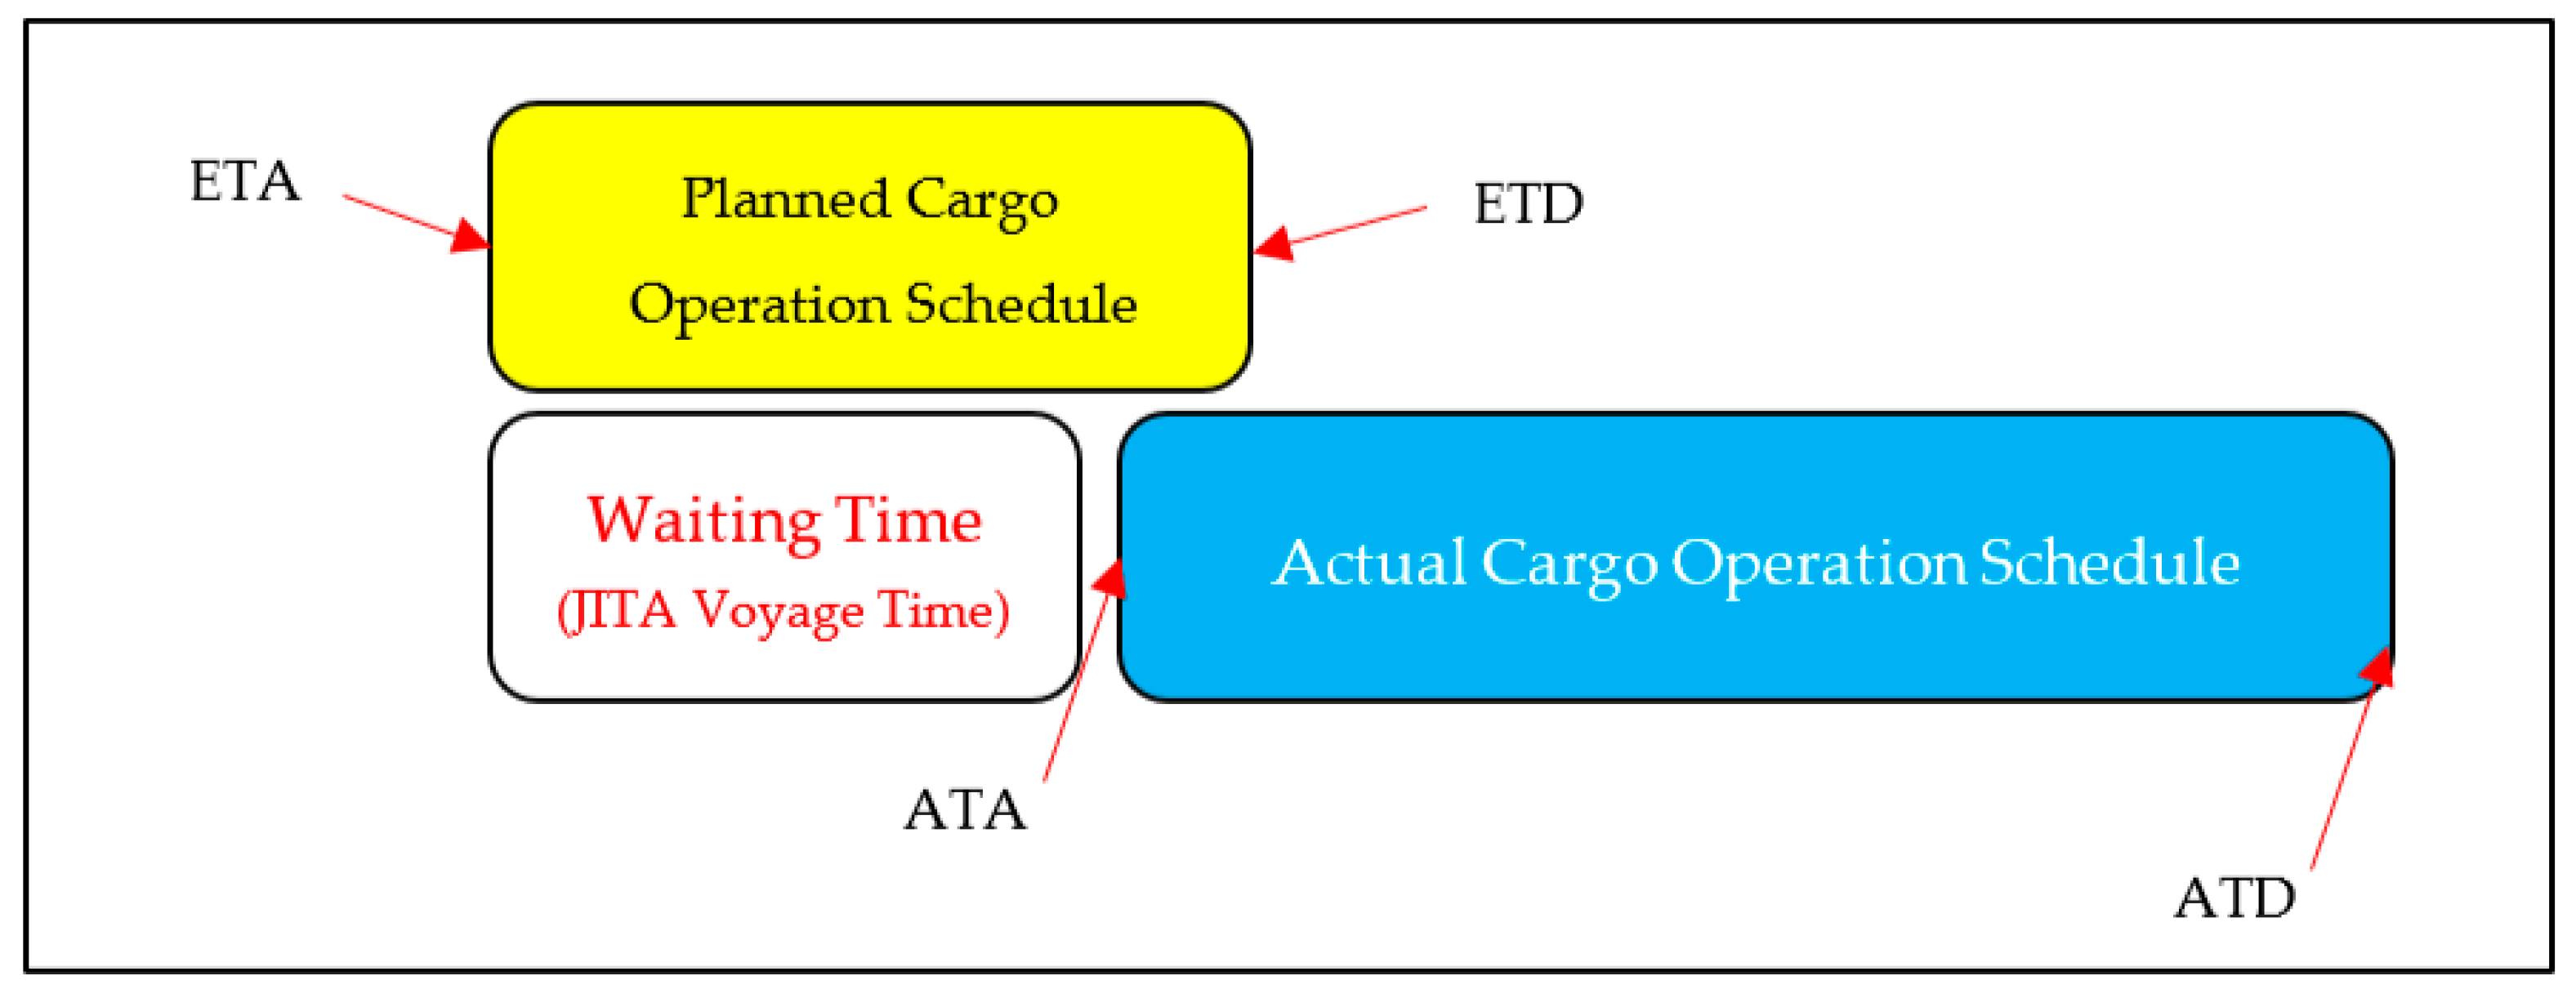
- Step 1. Quantification of the waiting time of the vessel at the port by subtracting the actual time of arrival from the estimated time of arrival.
- Step 2. Conversion of the waiting time to the extra voyage time needed to realize just-in-time arrival.
- Step 3. Optimization of the speed that can minimize the CO2 emissions based on the vessel’s route information.
- Step 4. Calculation of the CO2 emissions and the corresponding carbon intensity indicator estimate, as shown in Equation (1).
2.1.2. Novelty of the Research
2.2. Used Data
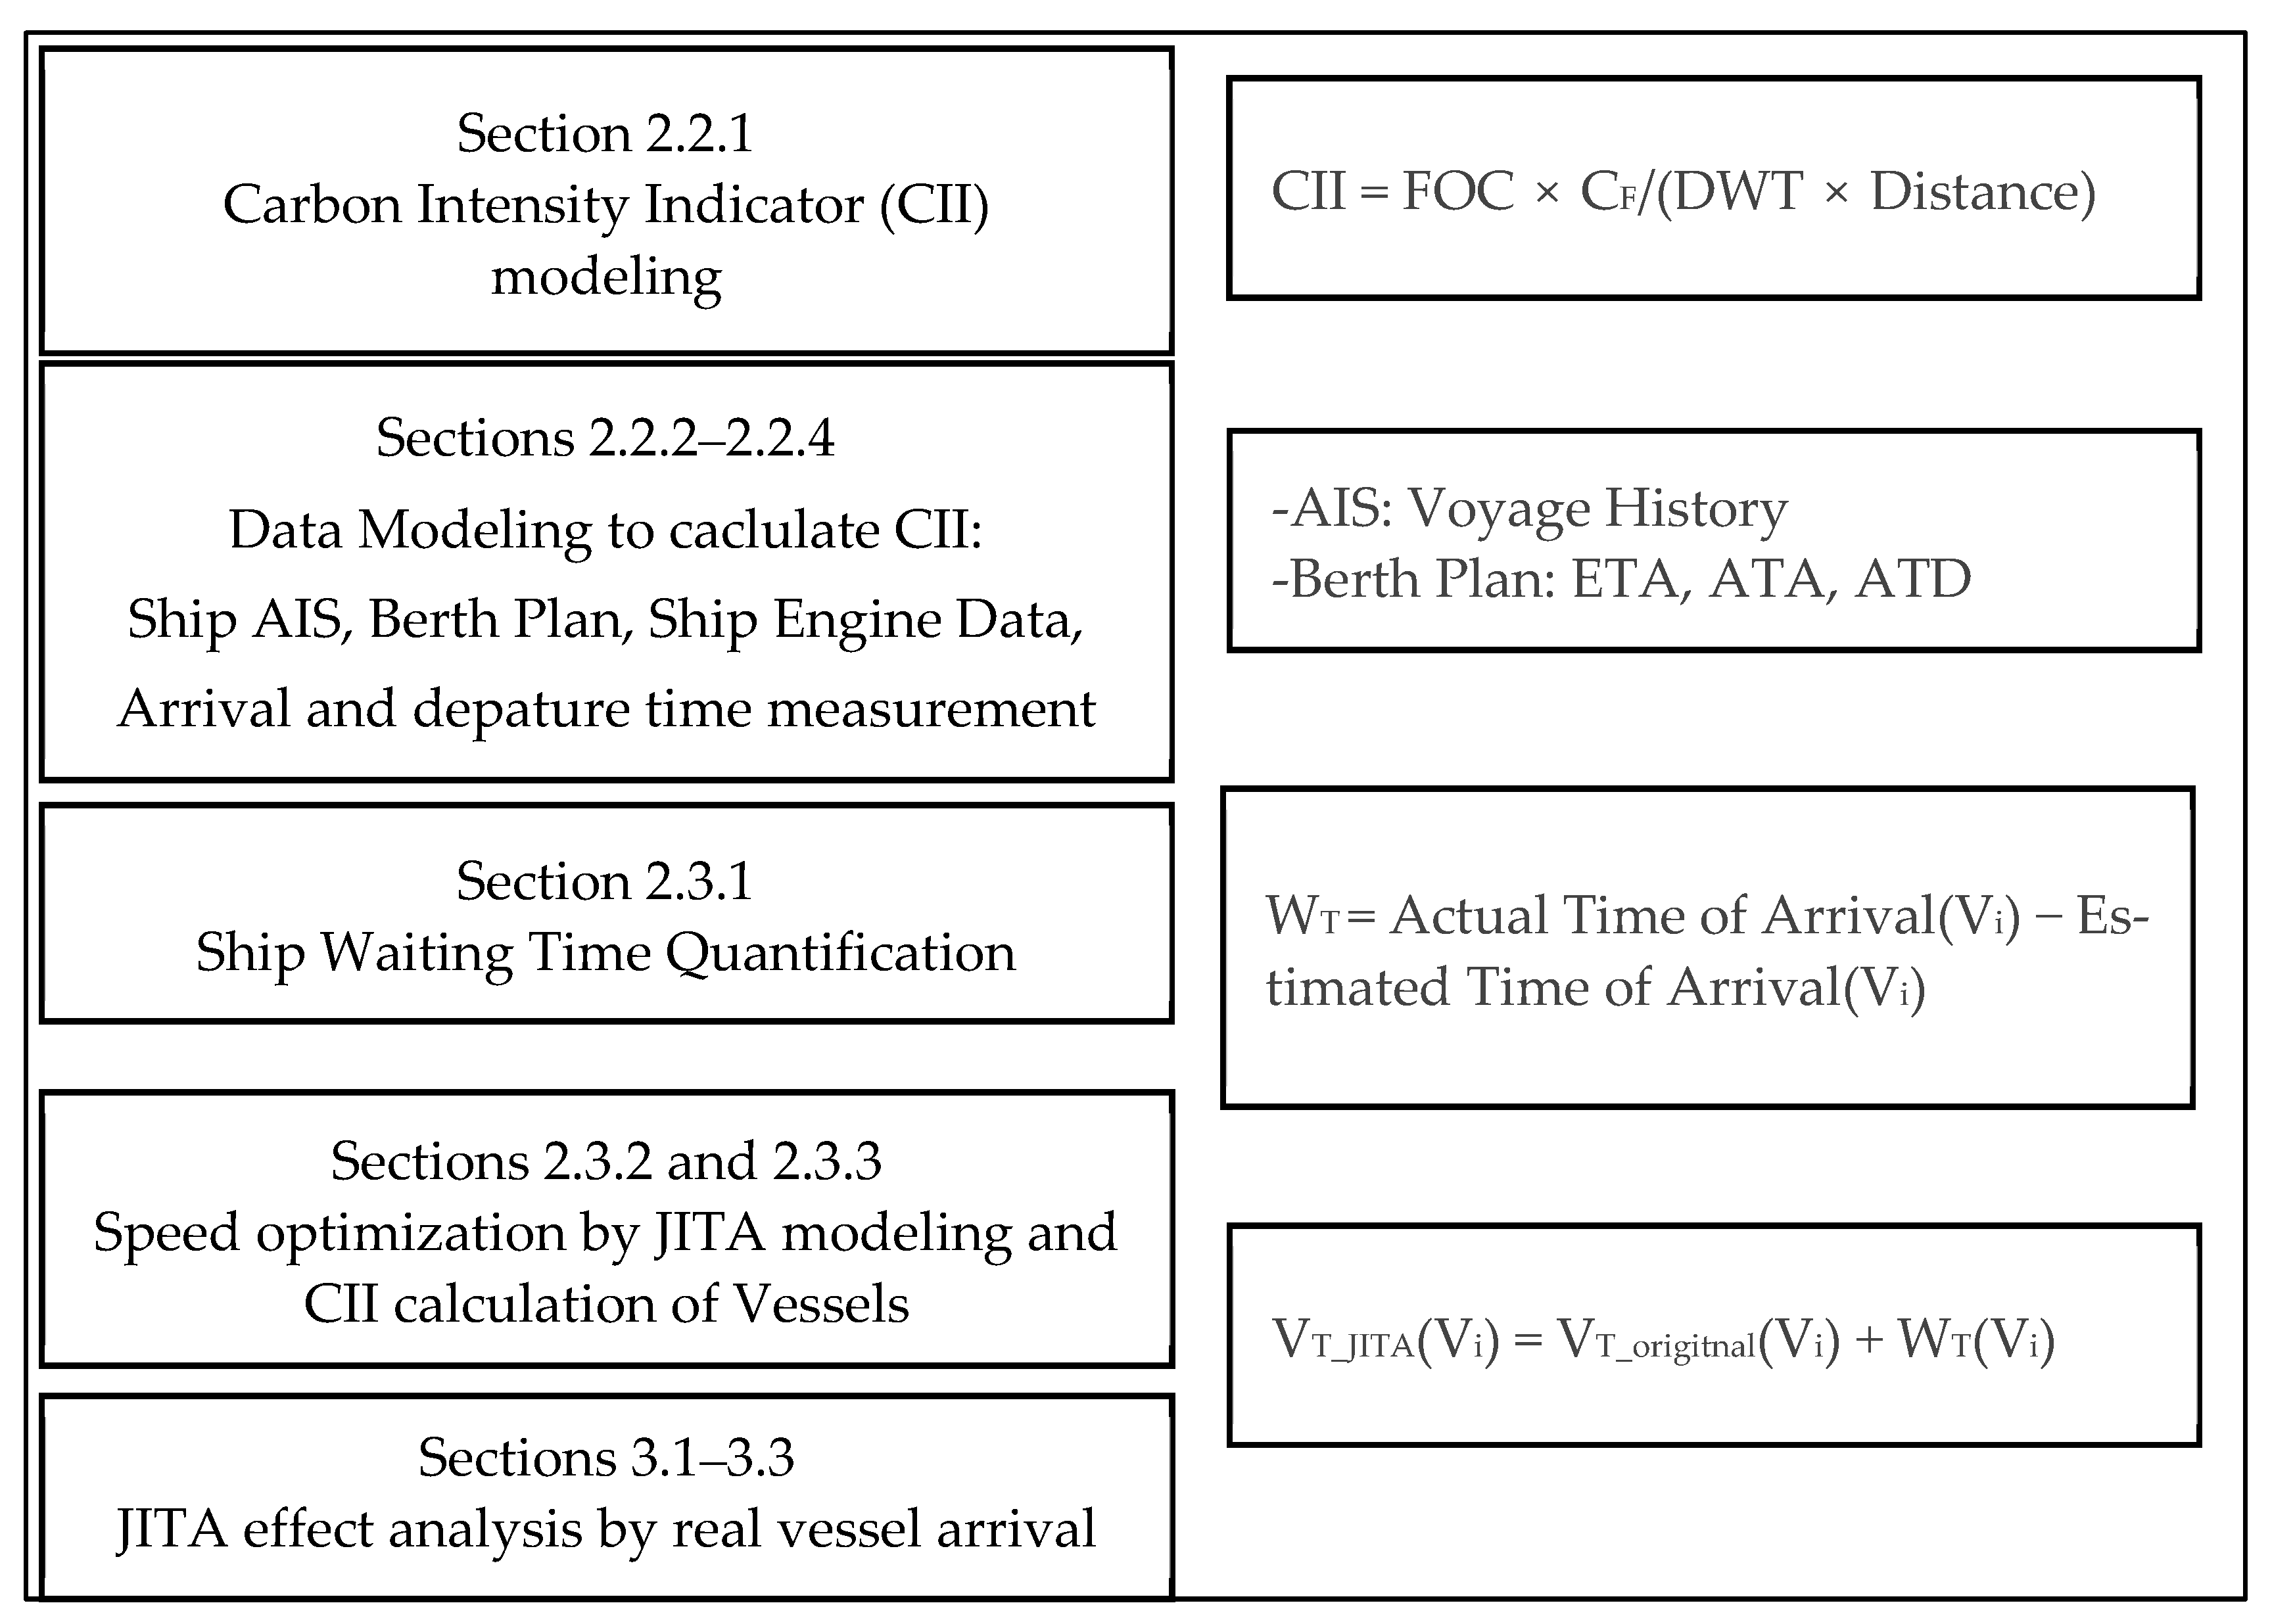
2.2.1. Carbon Intensity Indicator Modeling
2.2.2. Ship Capacity and Engine Information
2.2.3. Ship Arrival and Departure Data
2.2.4. Satellite AIS Data for the Distance Term of CII
2.3. Methodology
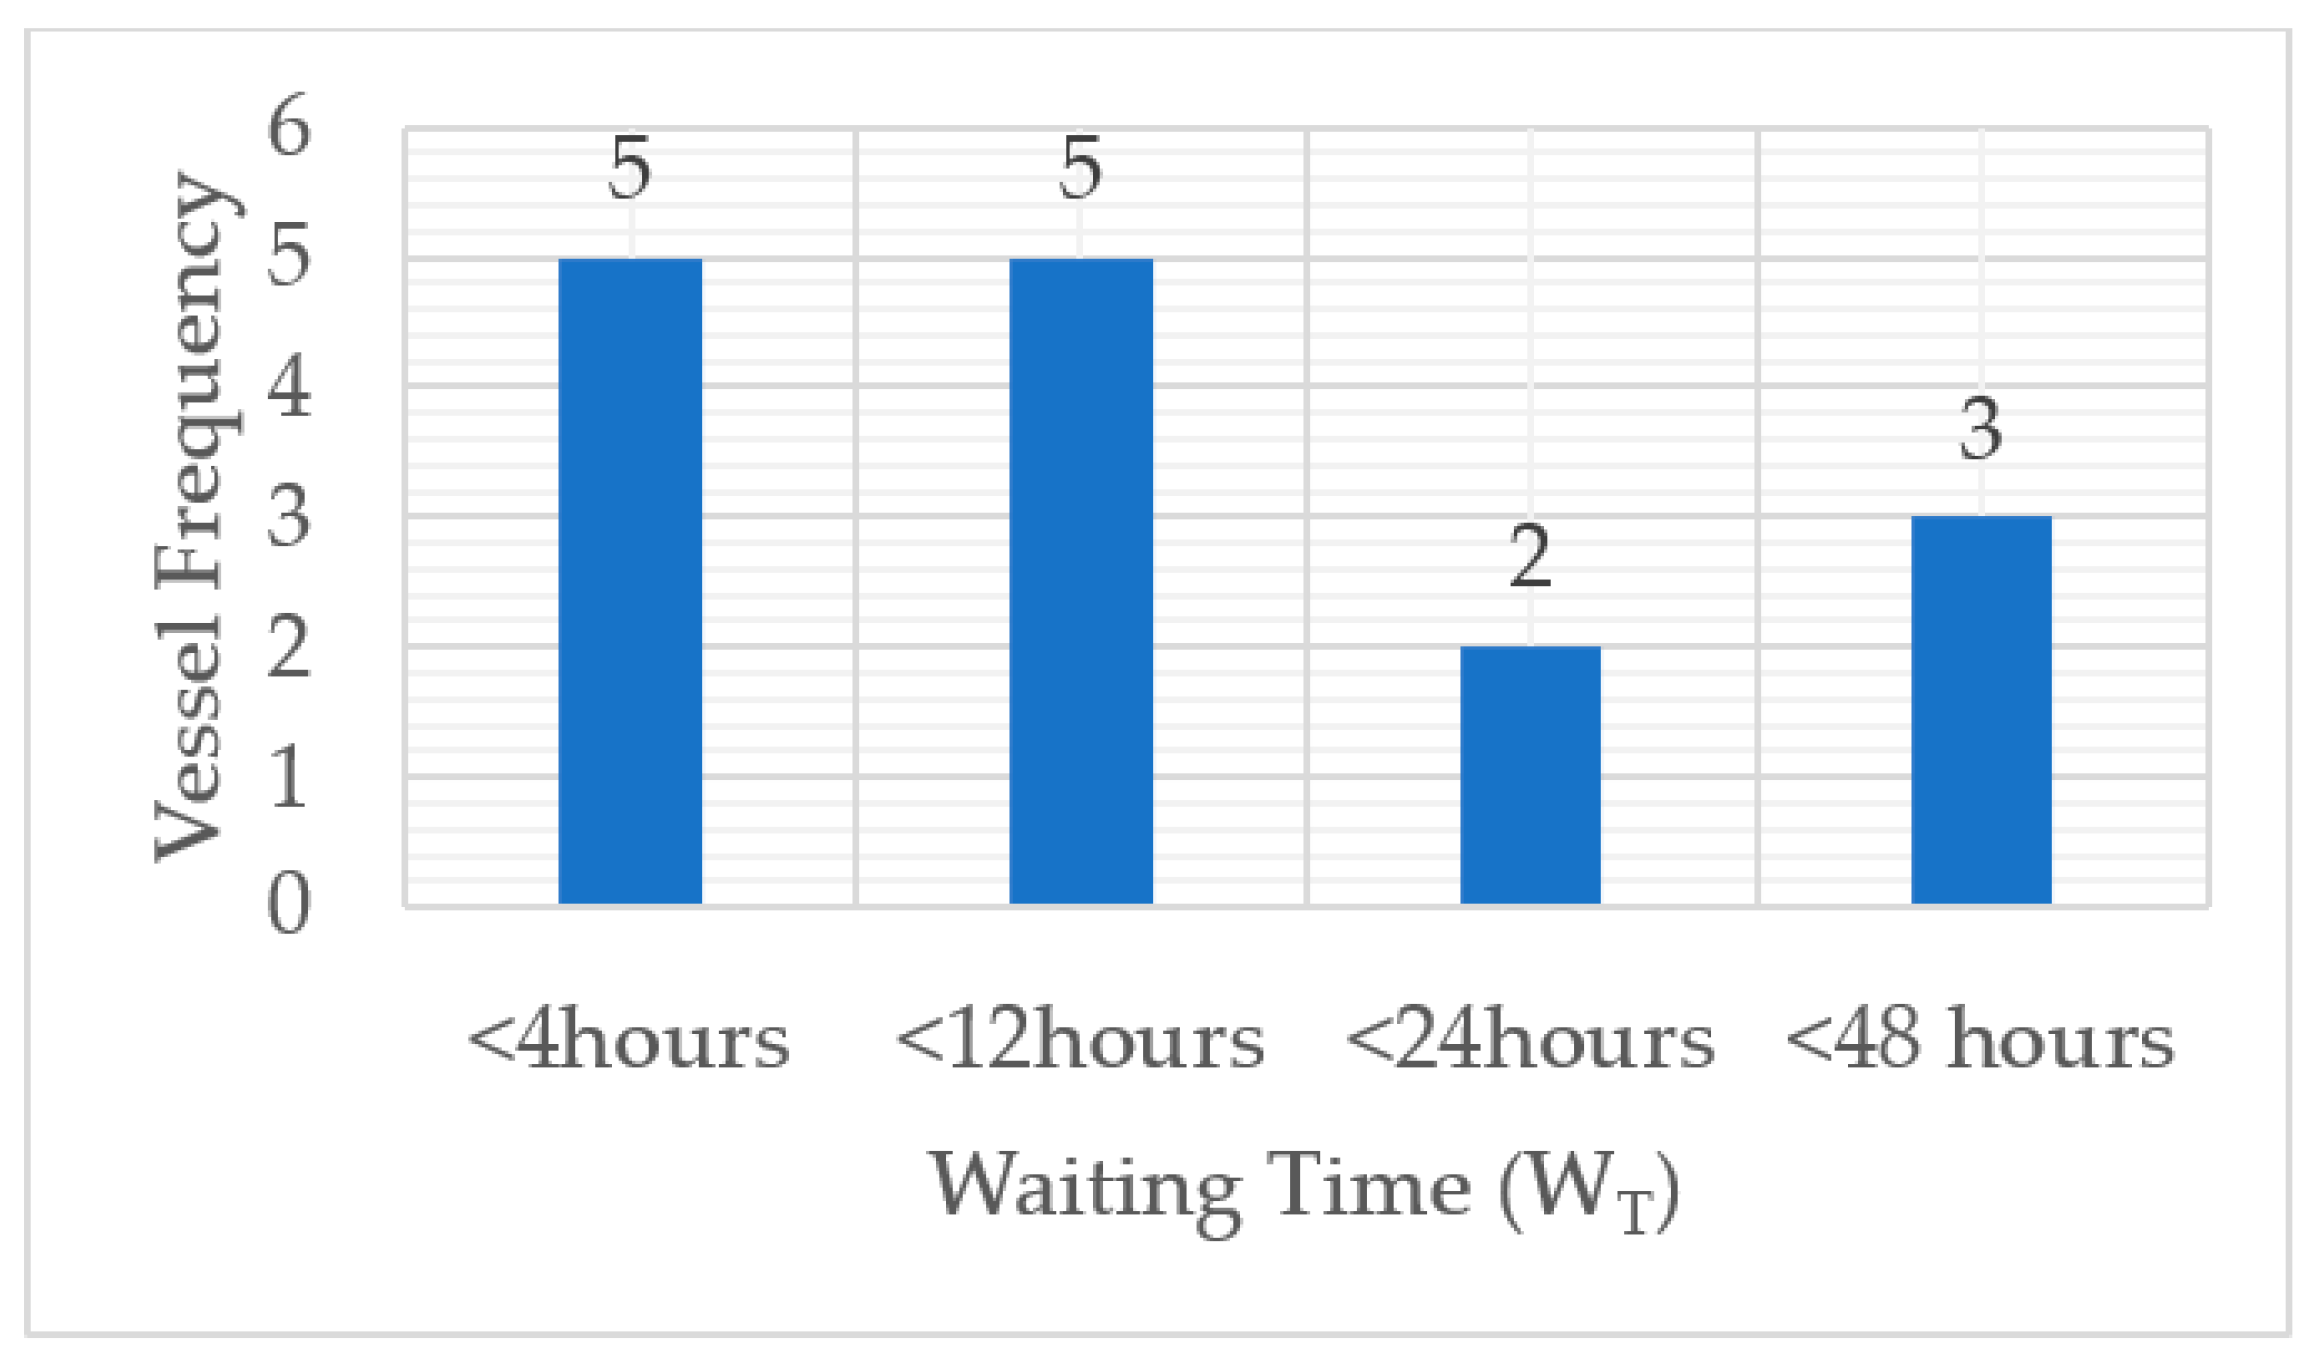
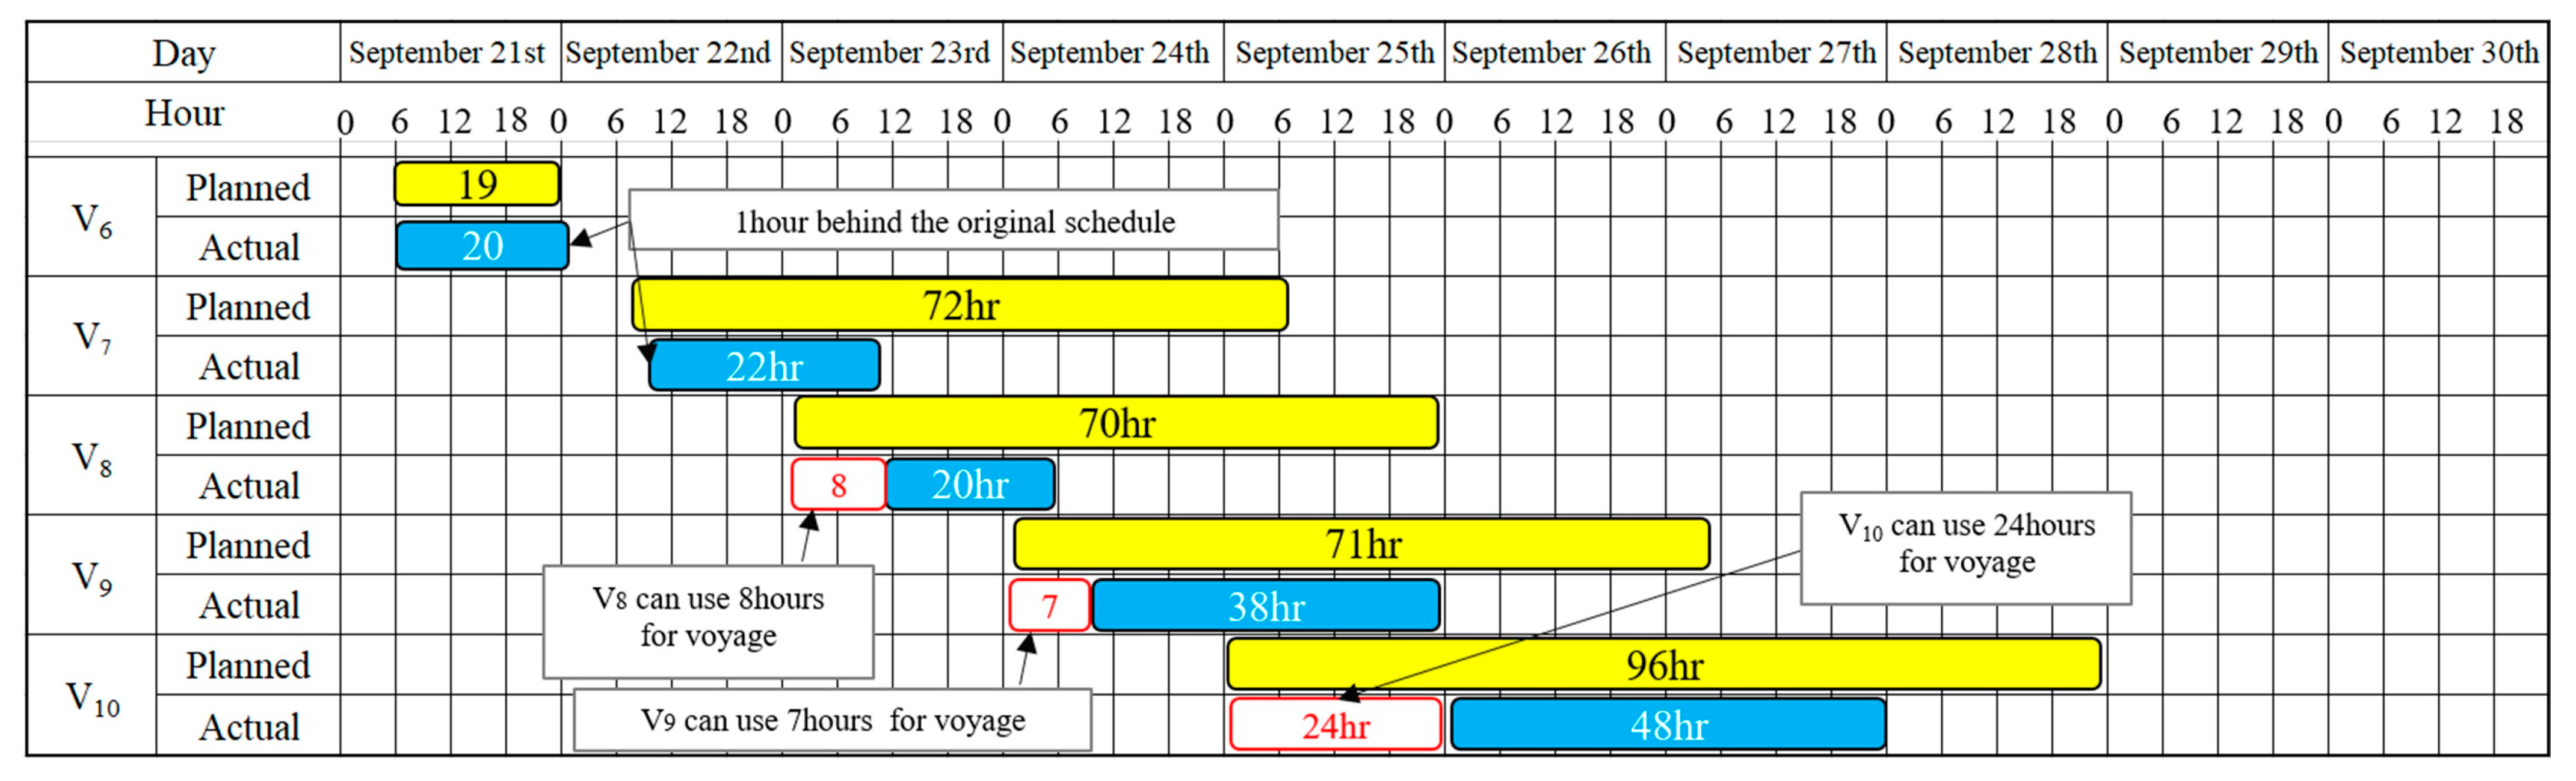
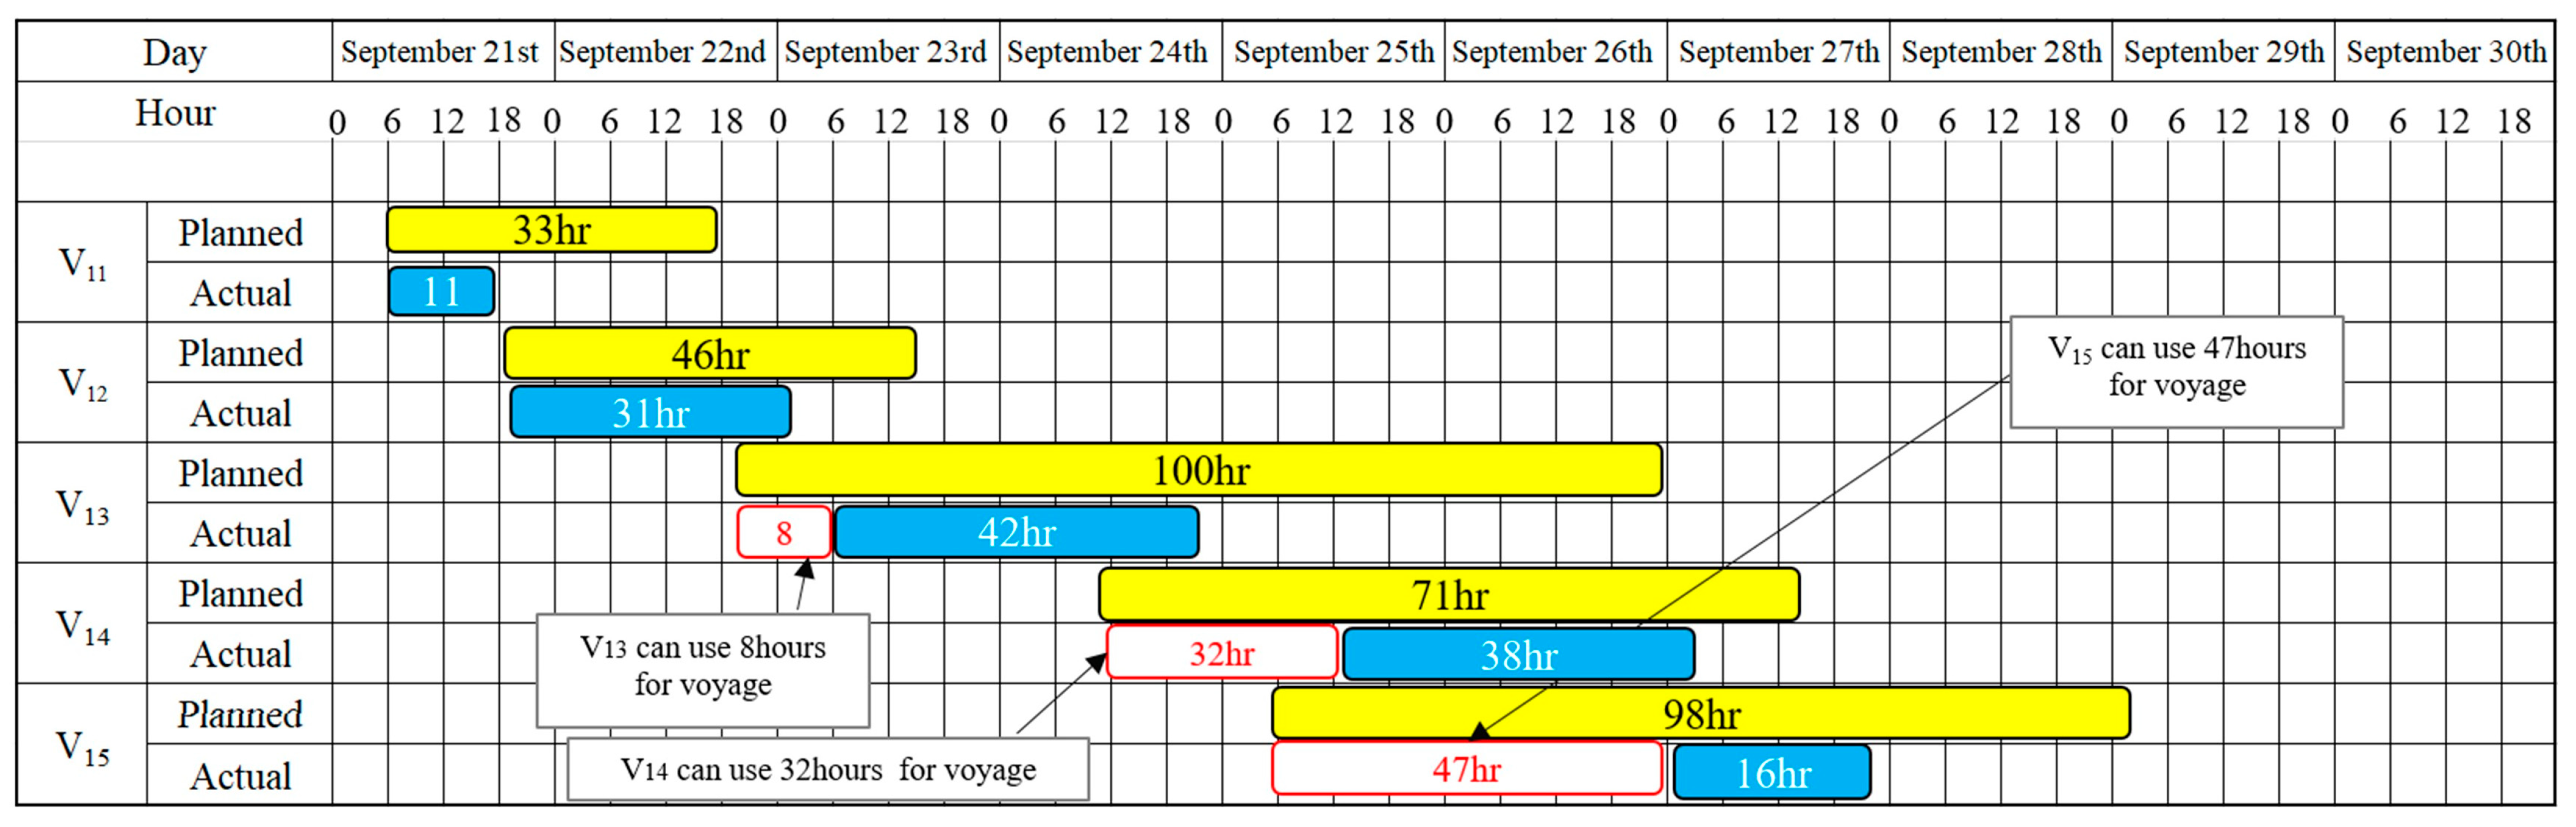
2.3.1. Ship Waiting Time (WT) Quantification
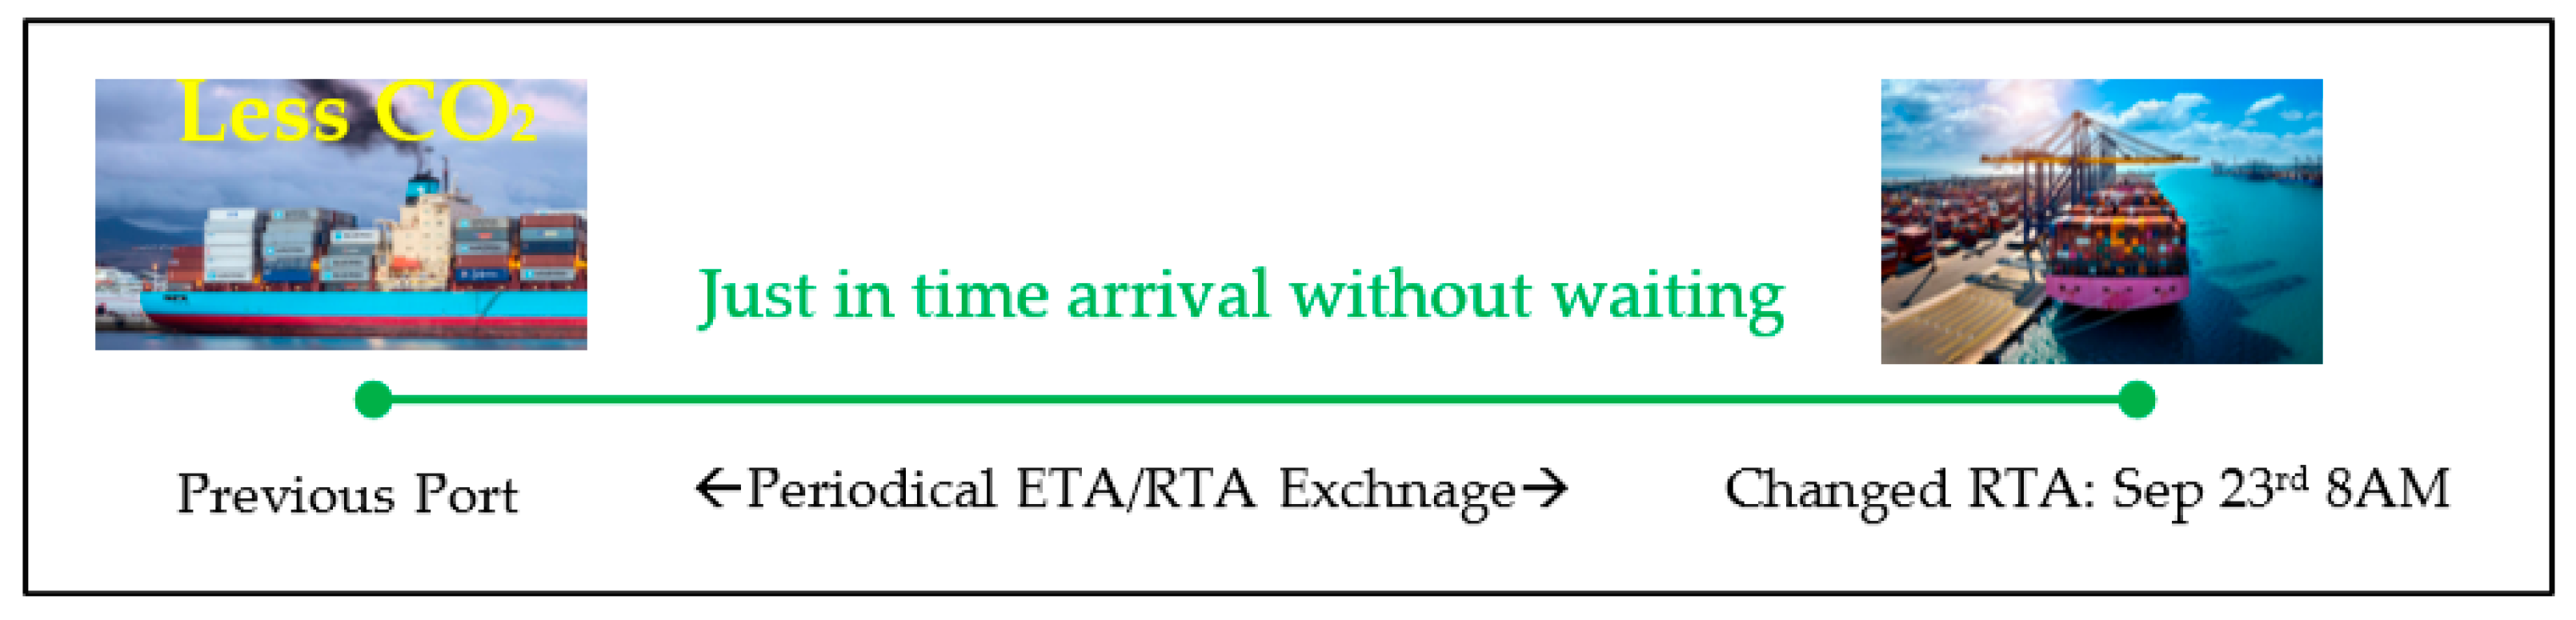
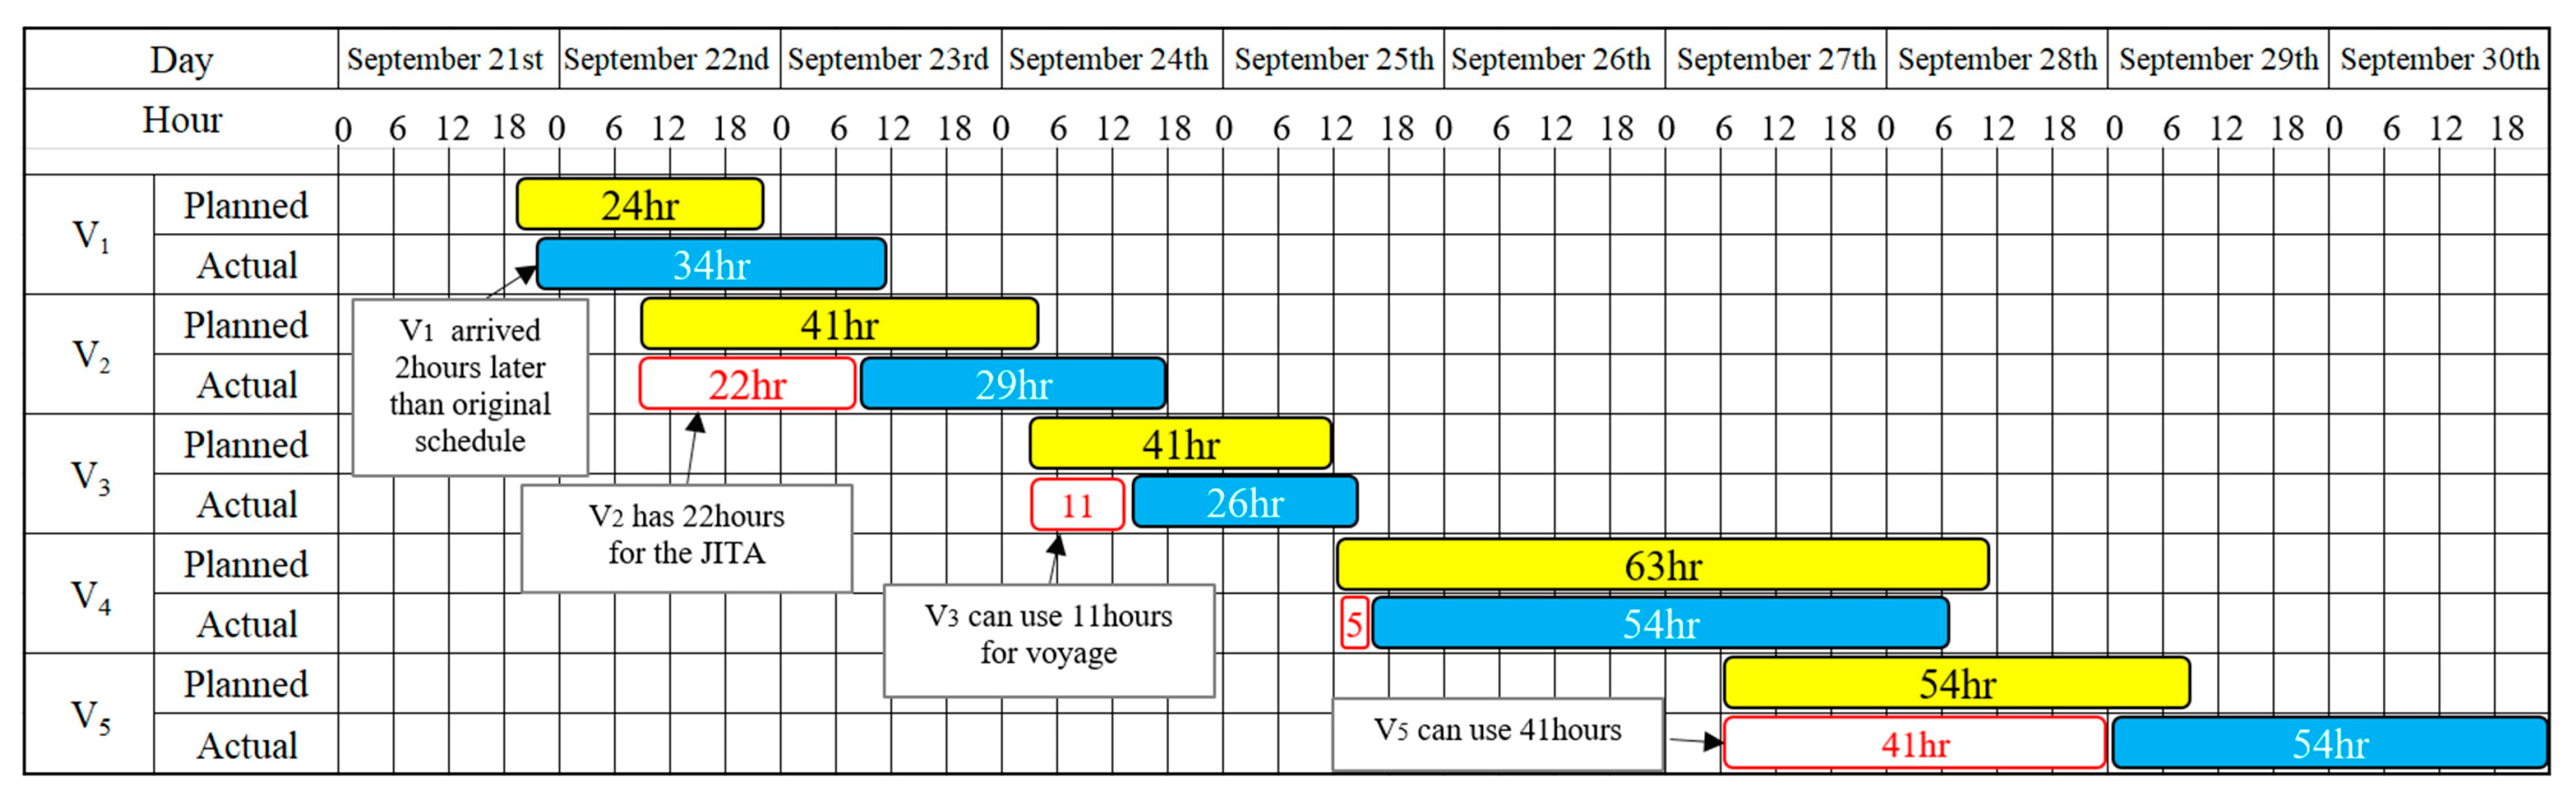
2.3.2. Just-in-Time Arrival Policy
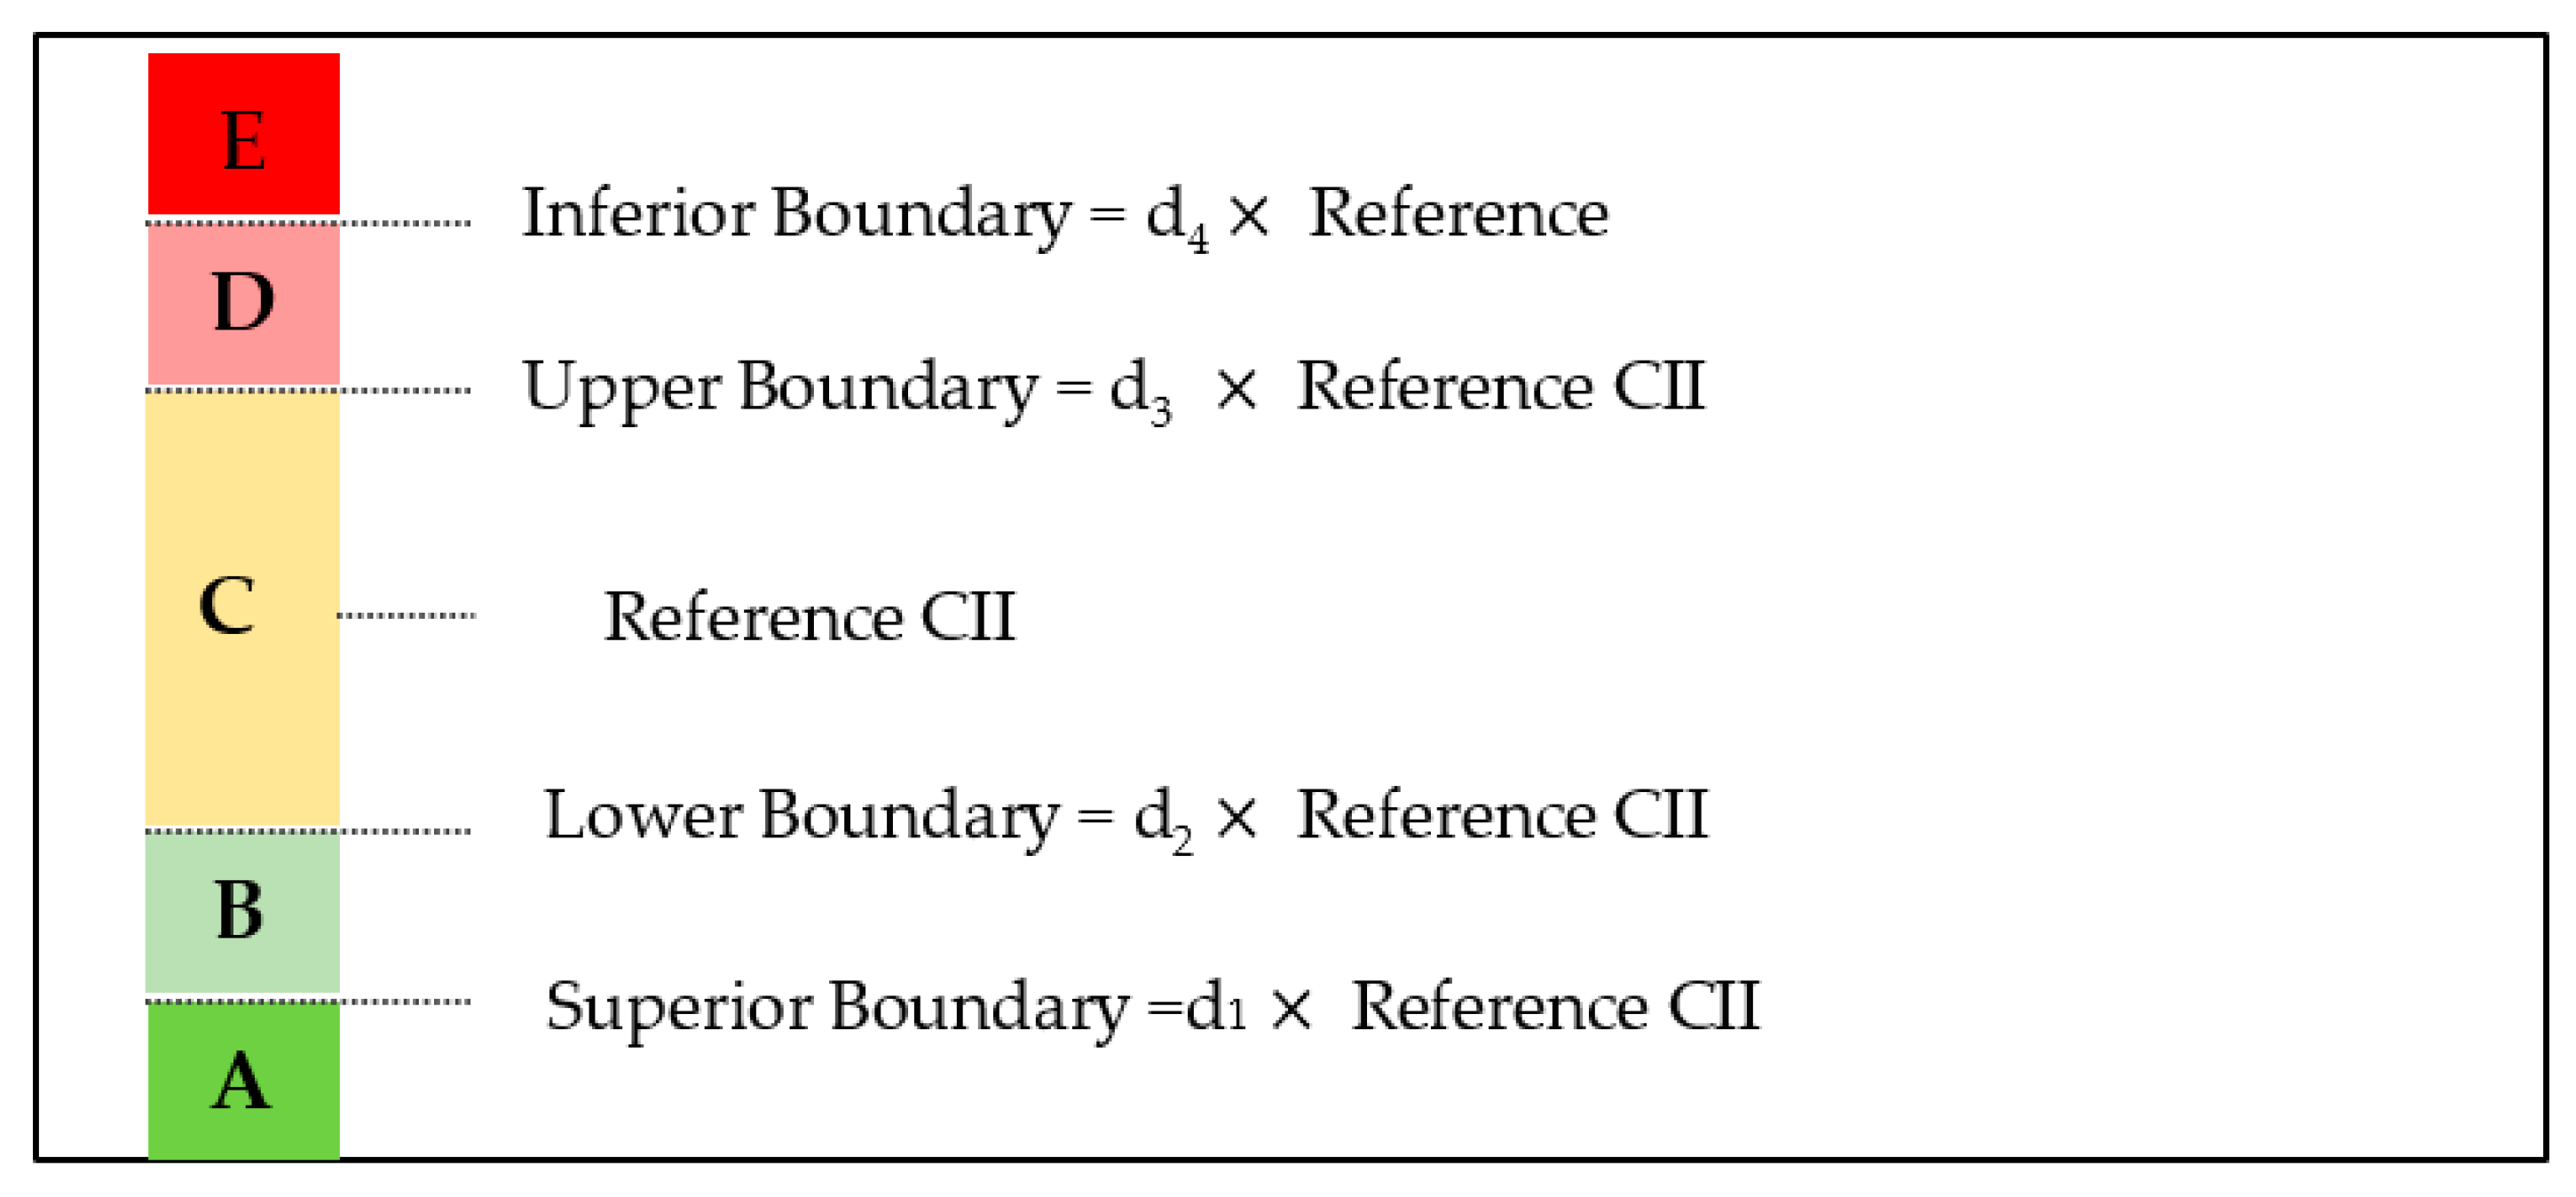
2.3.3. Carbon Intensity Indicator (CII) Modeling
3. Results
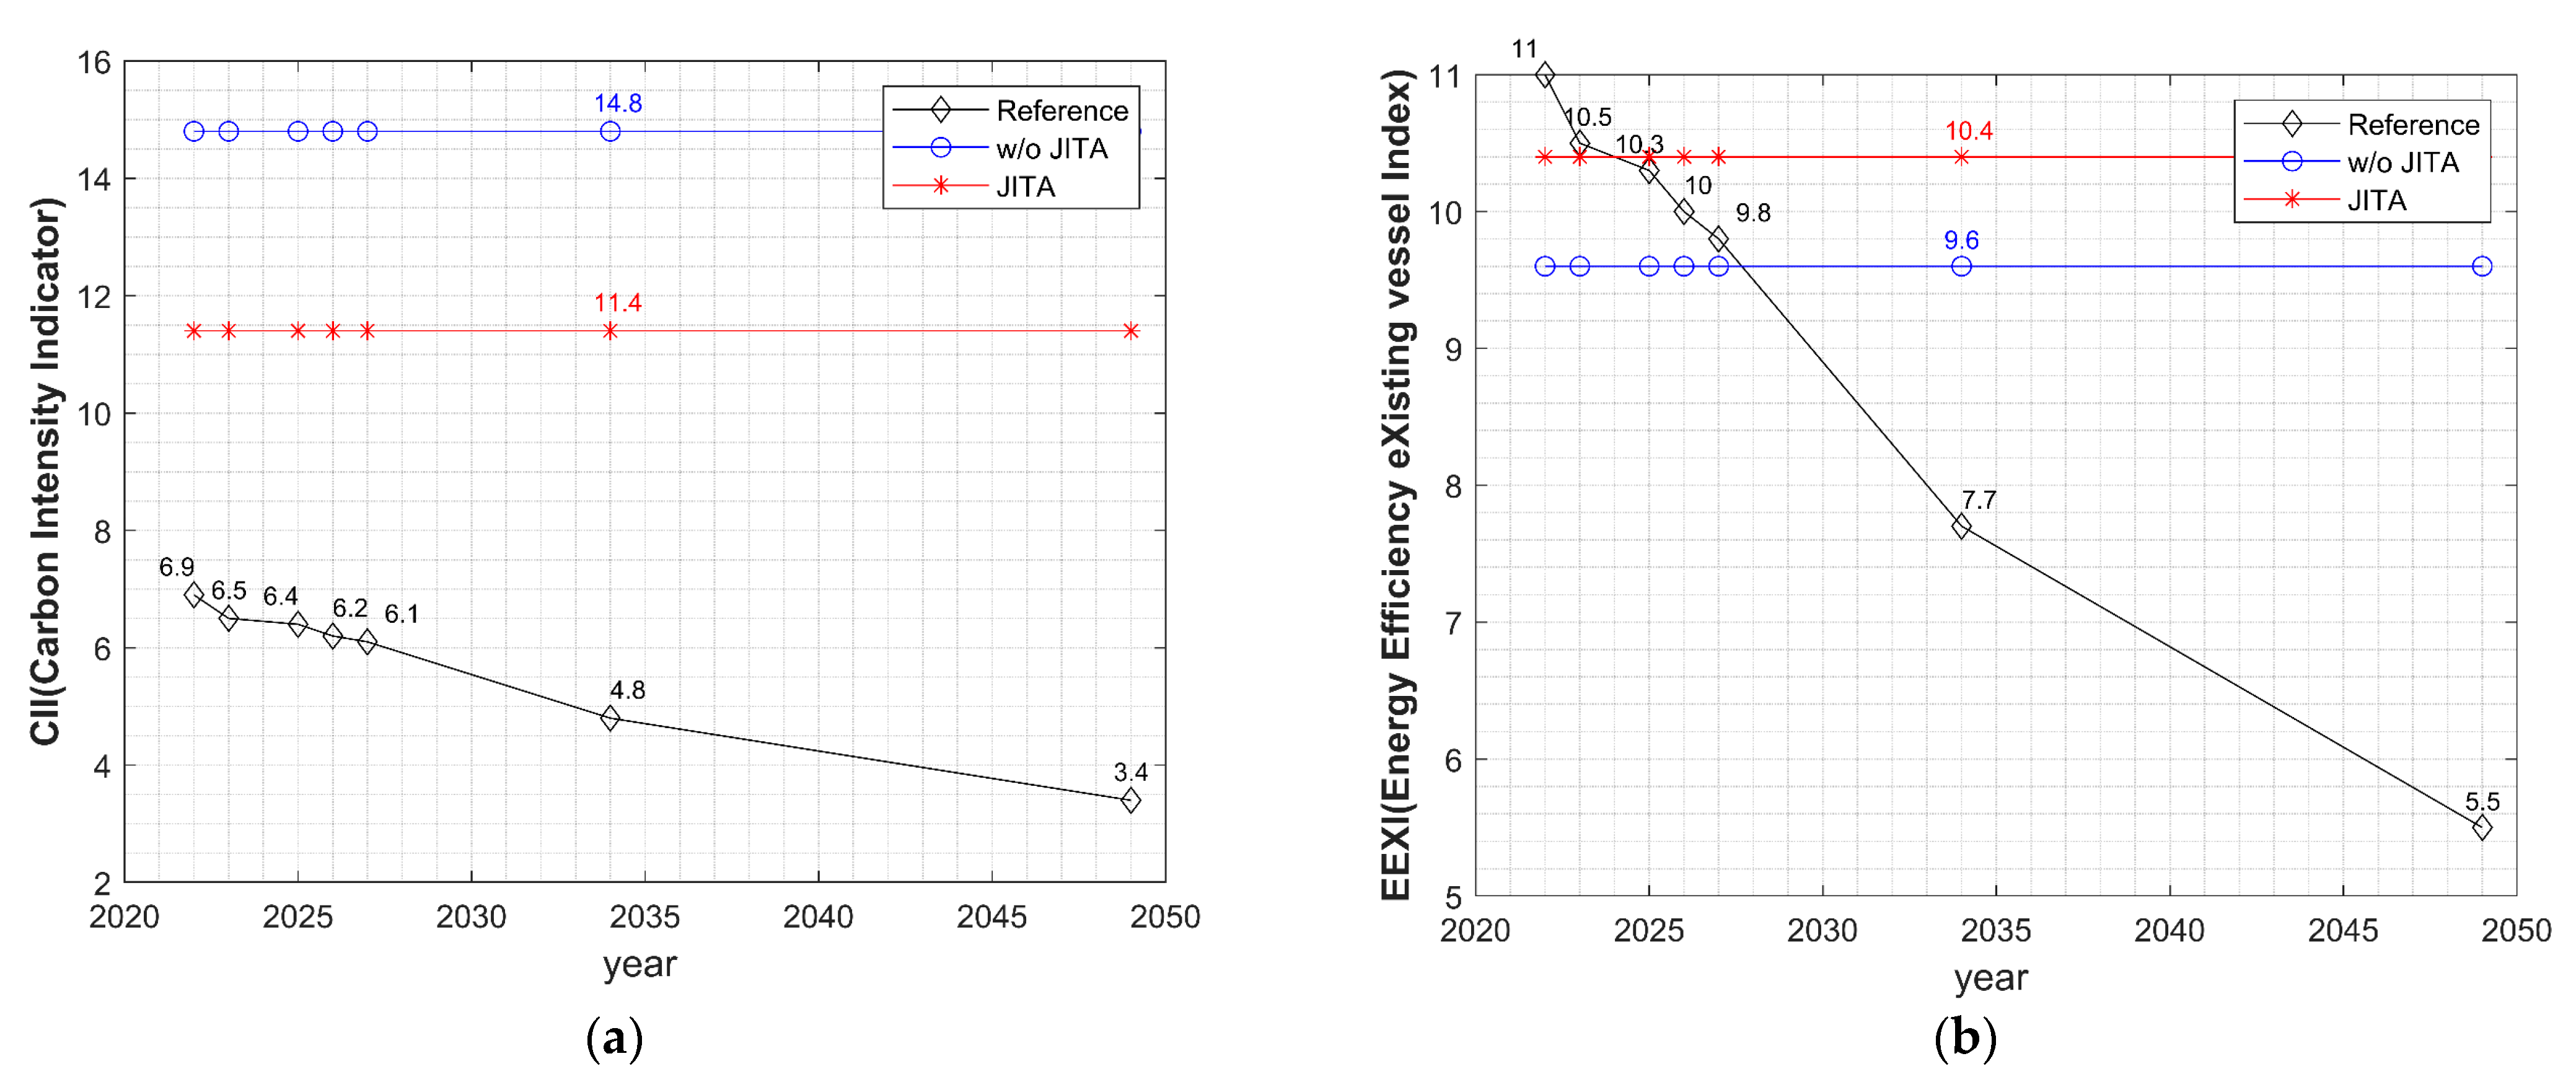
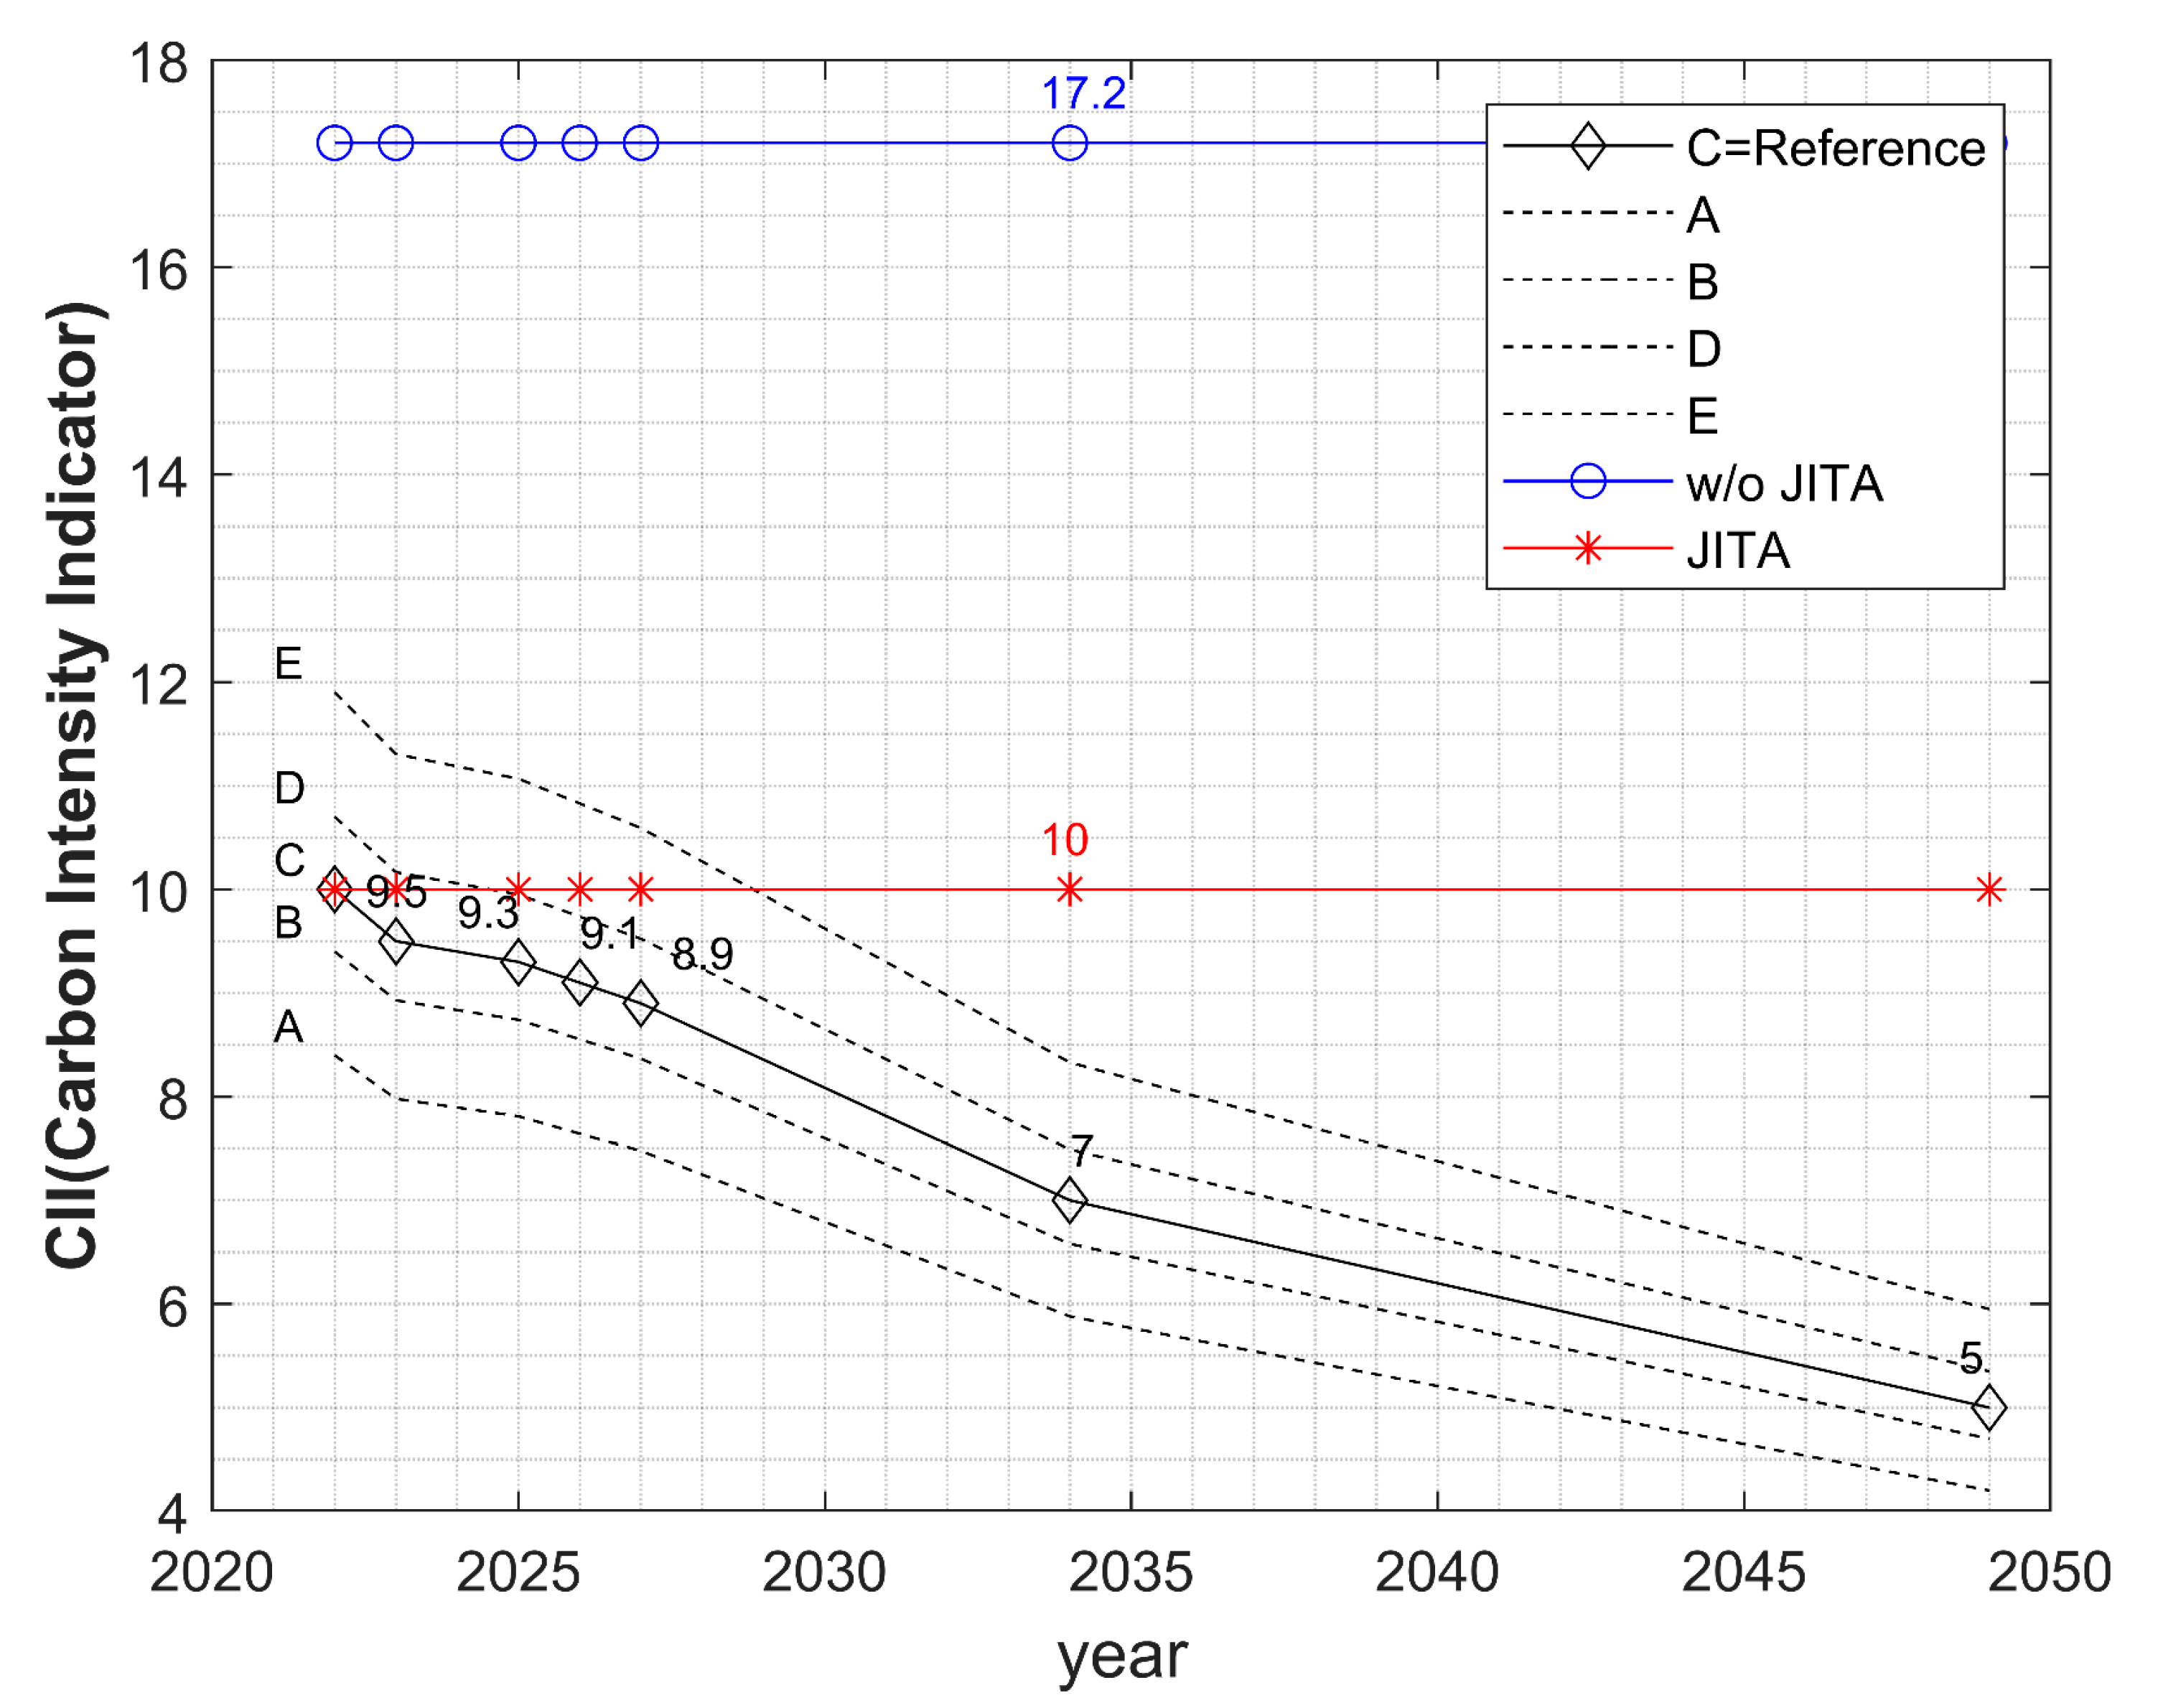
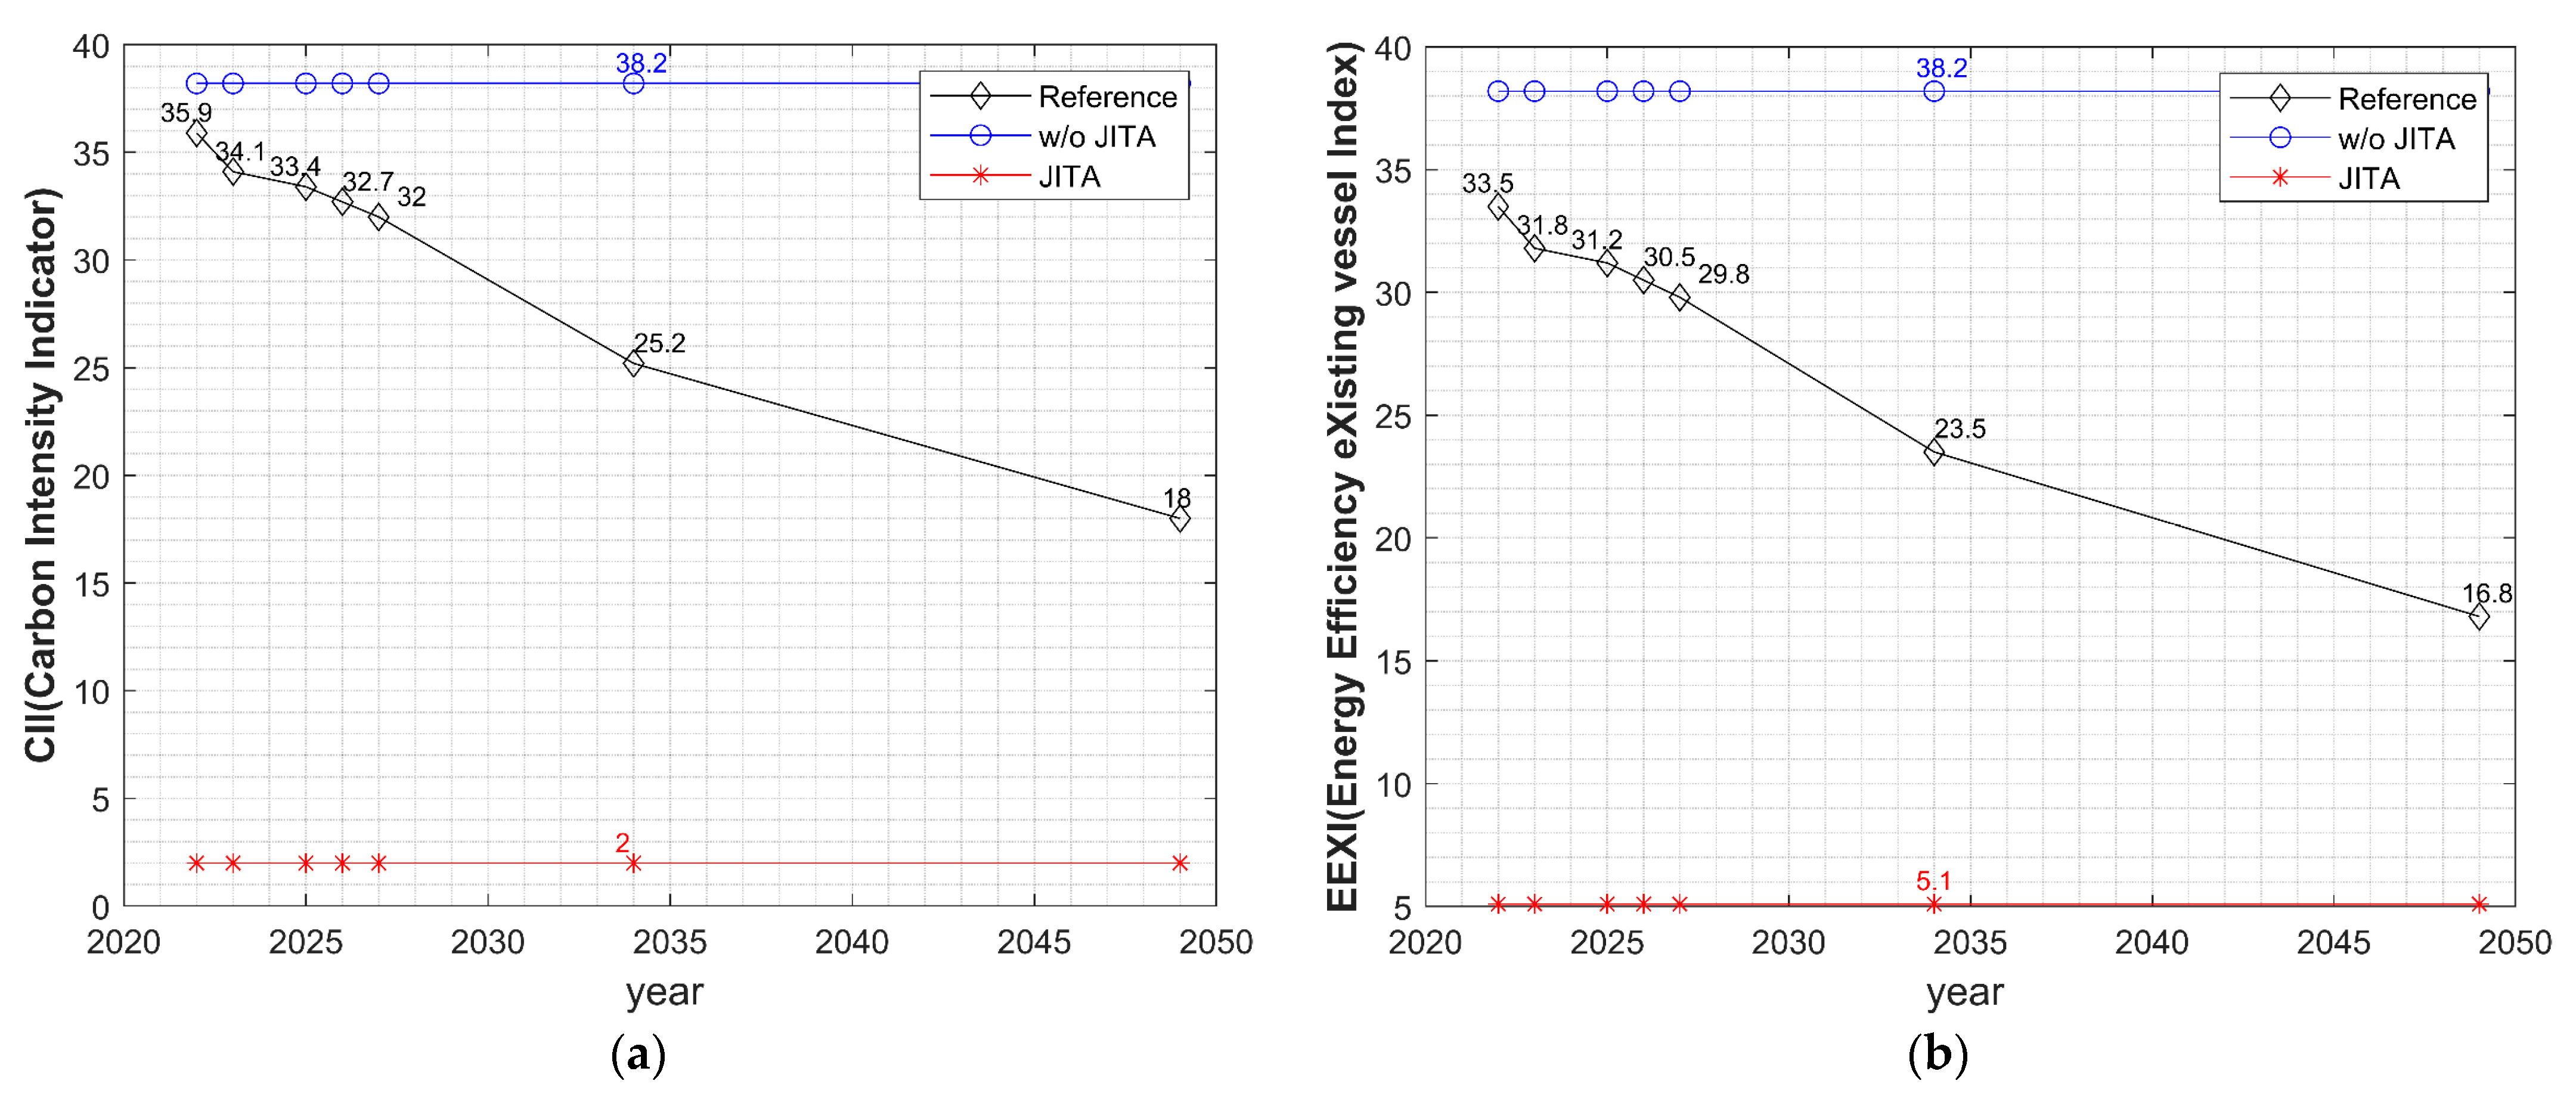
3.1. The Case of Berth 1
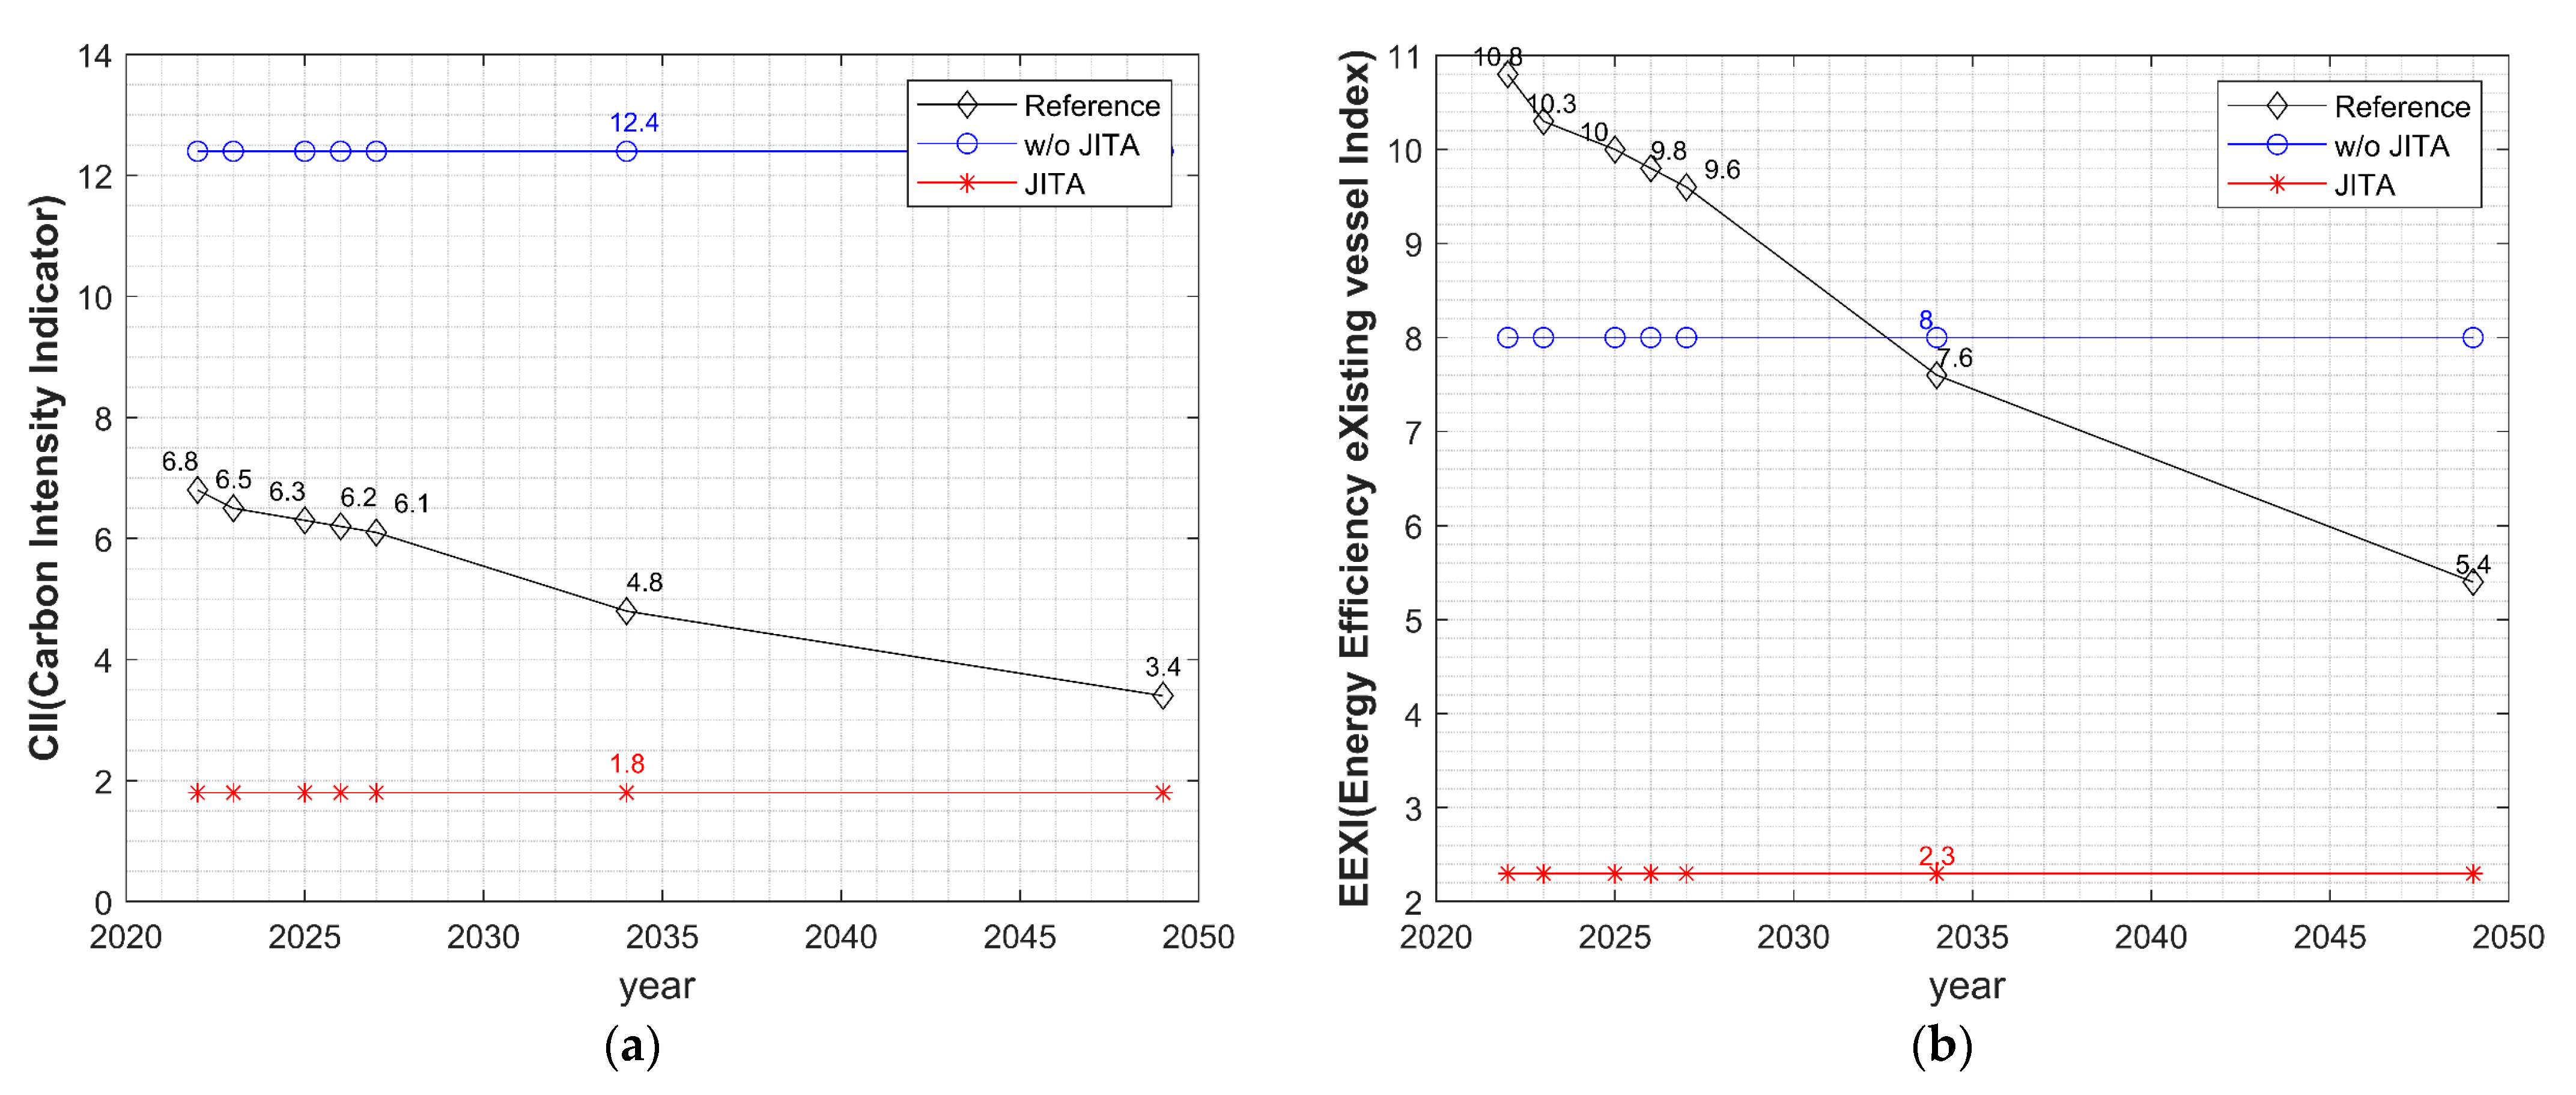
3.2. The Case of Berth 2
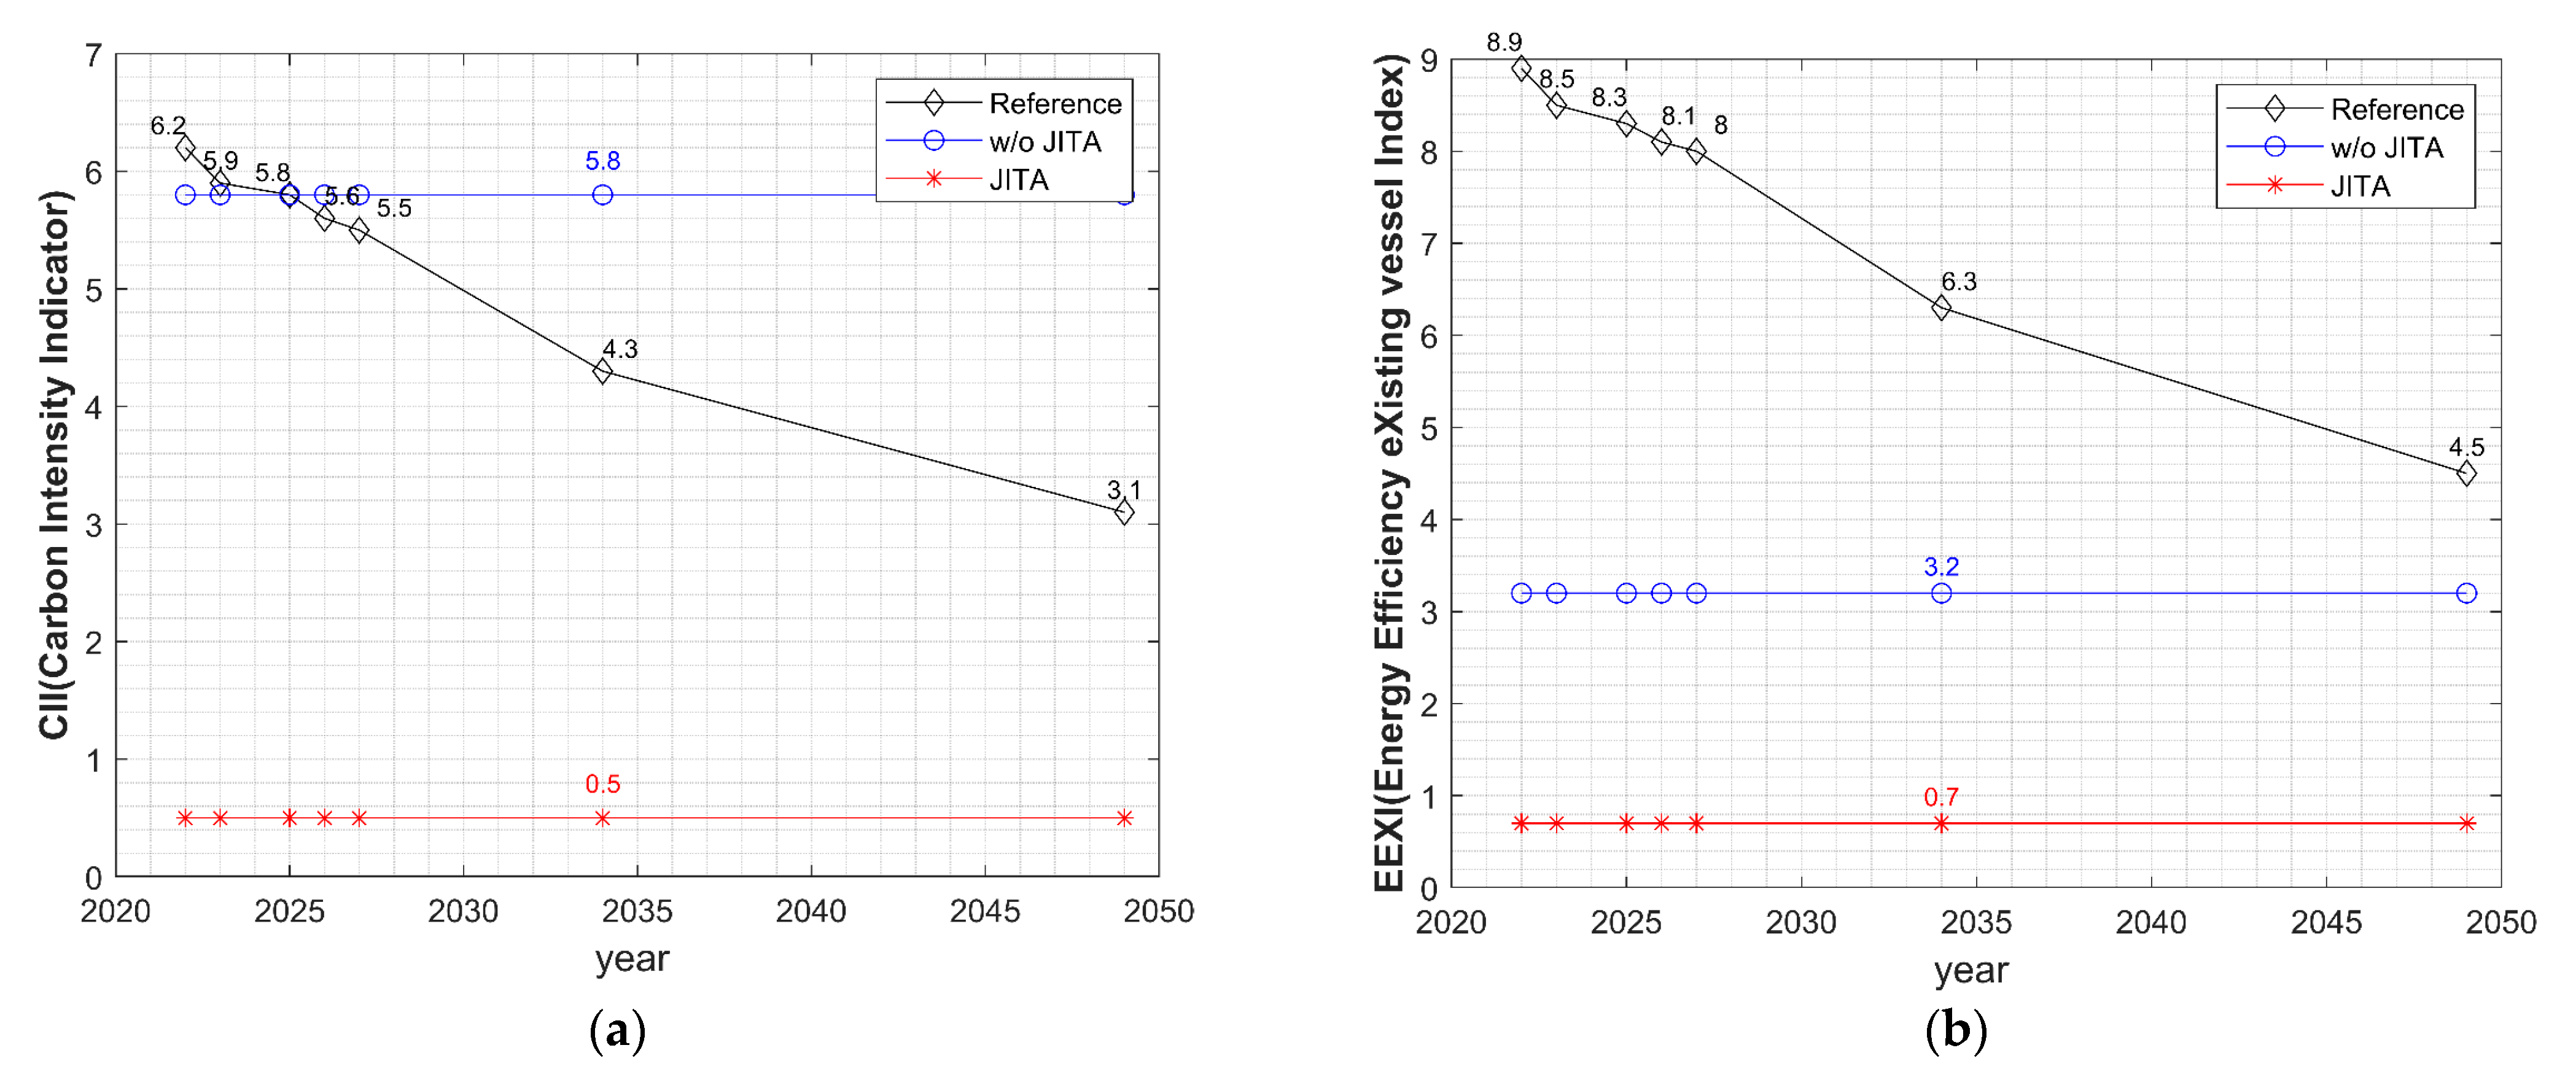
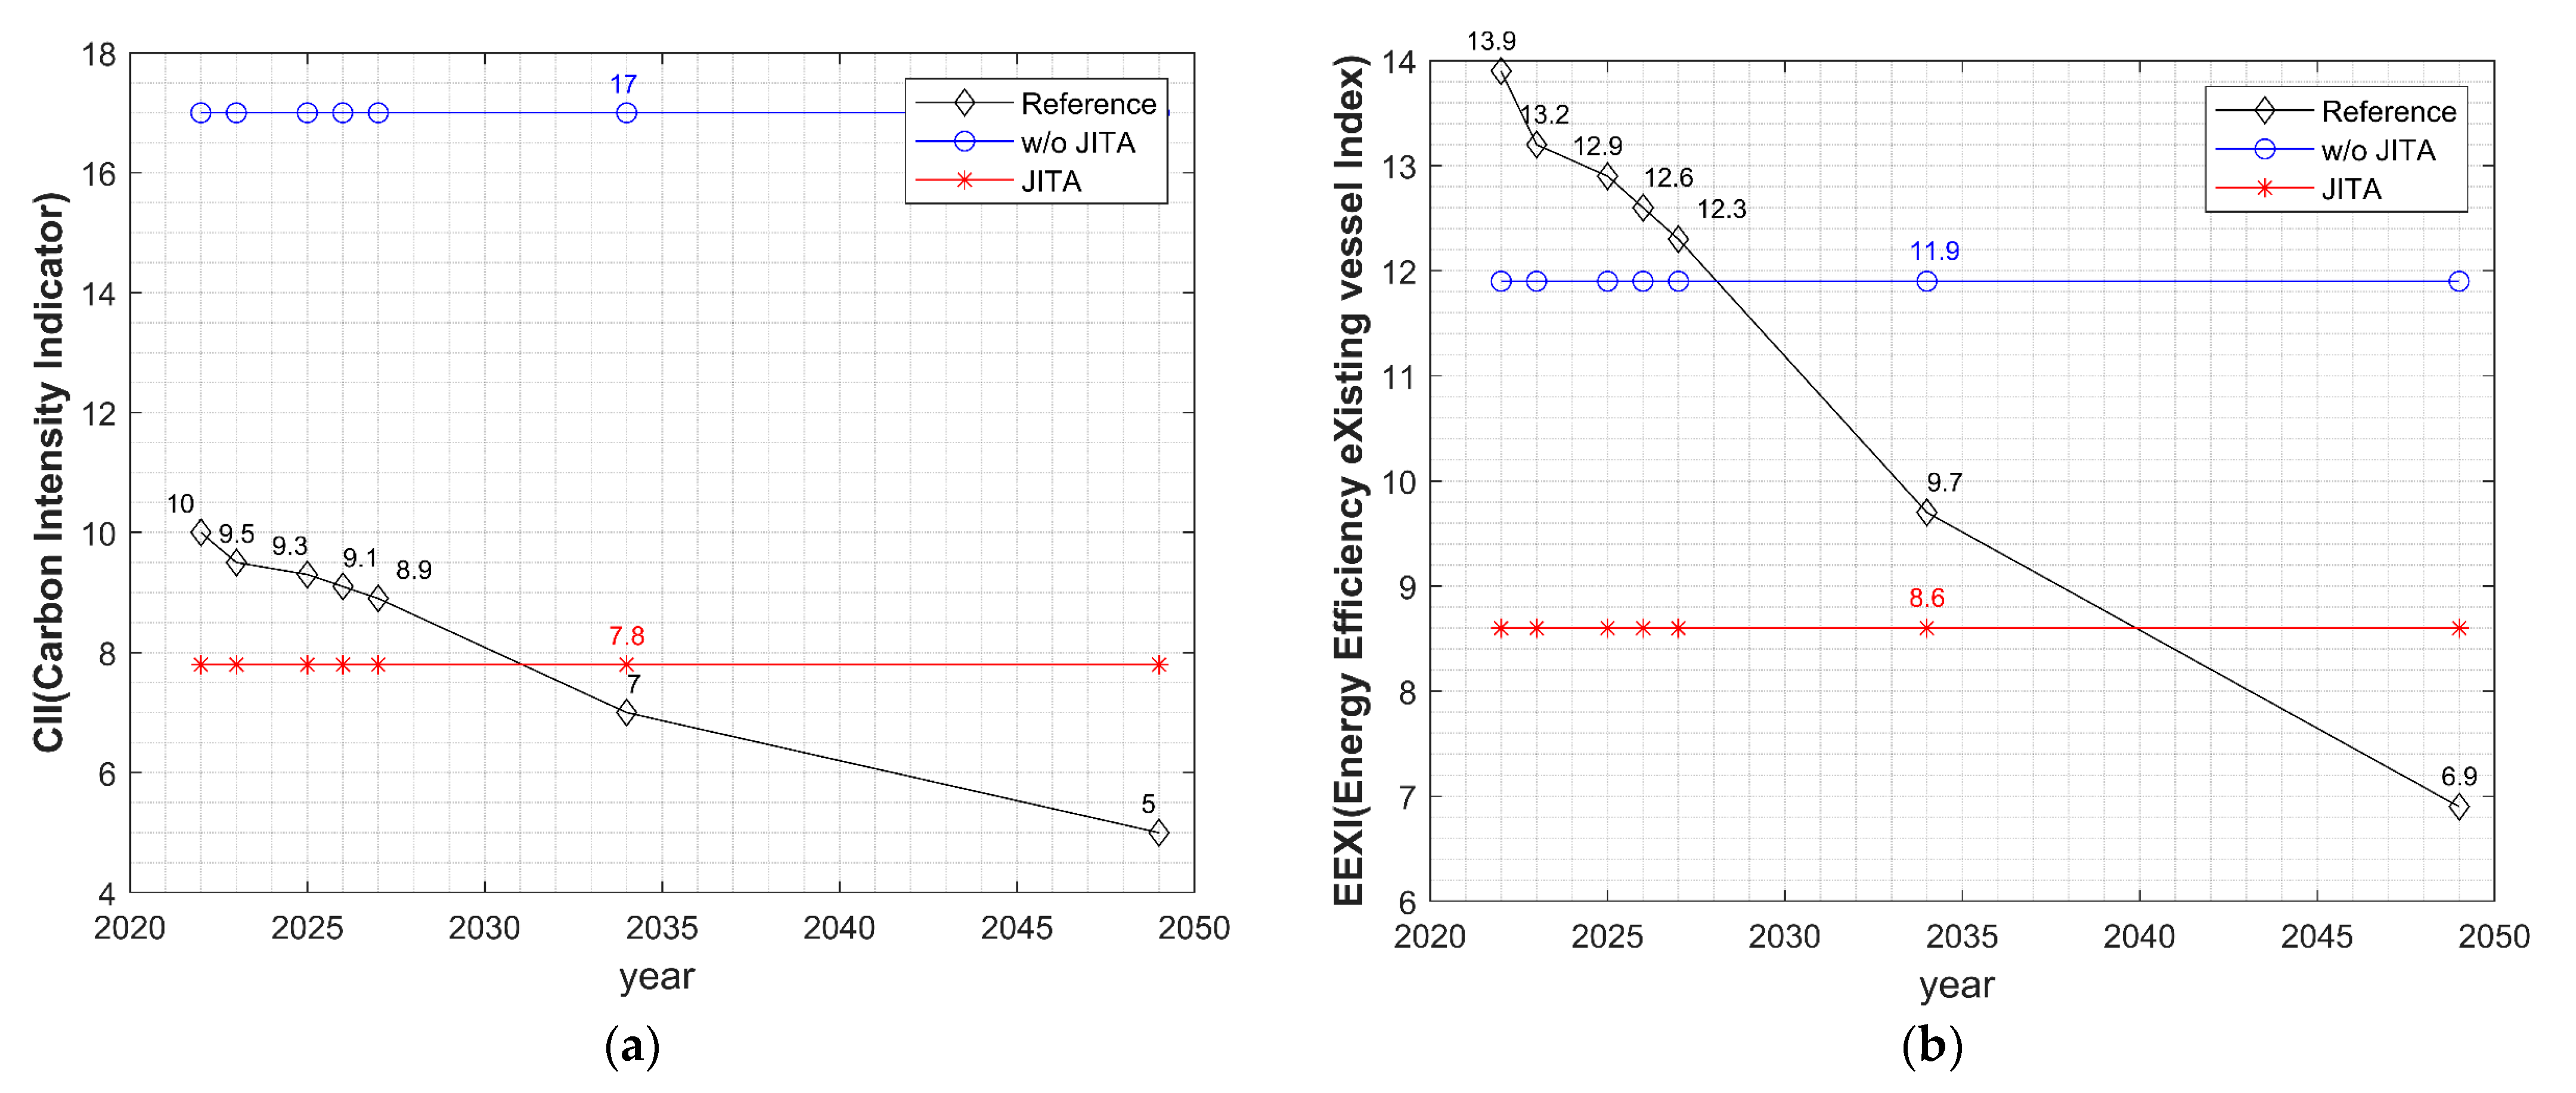
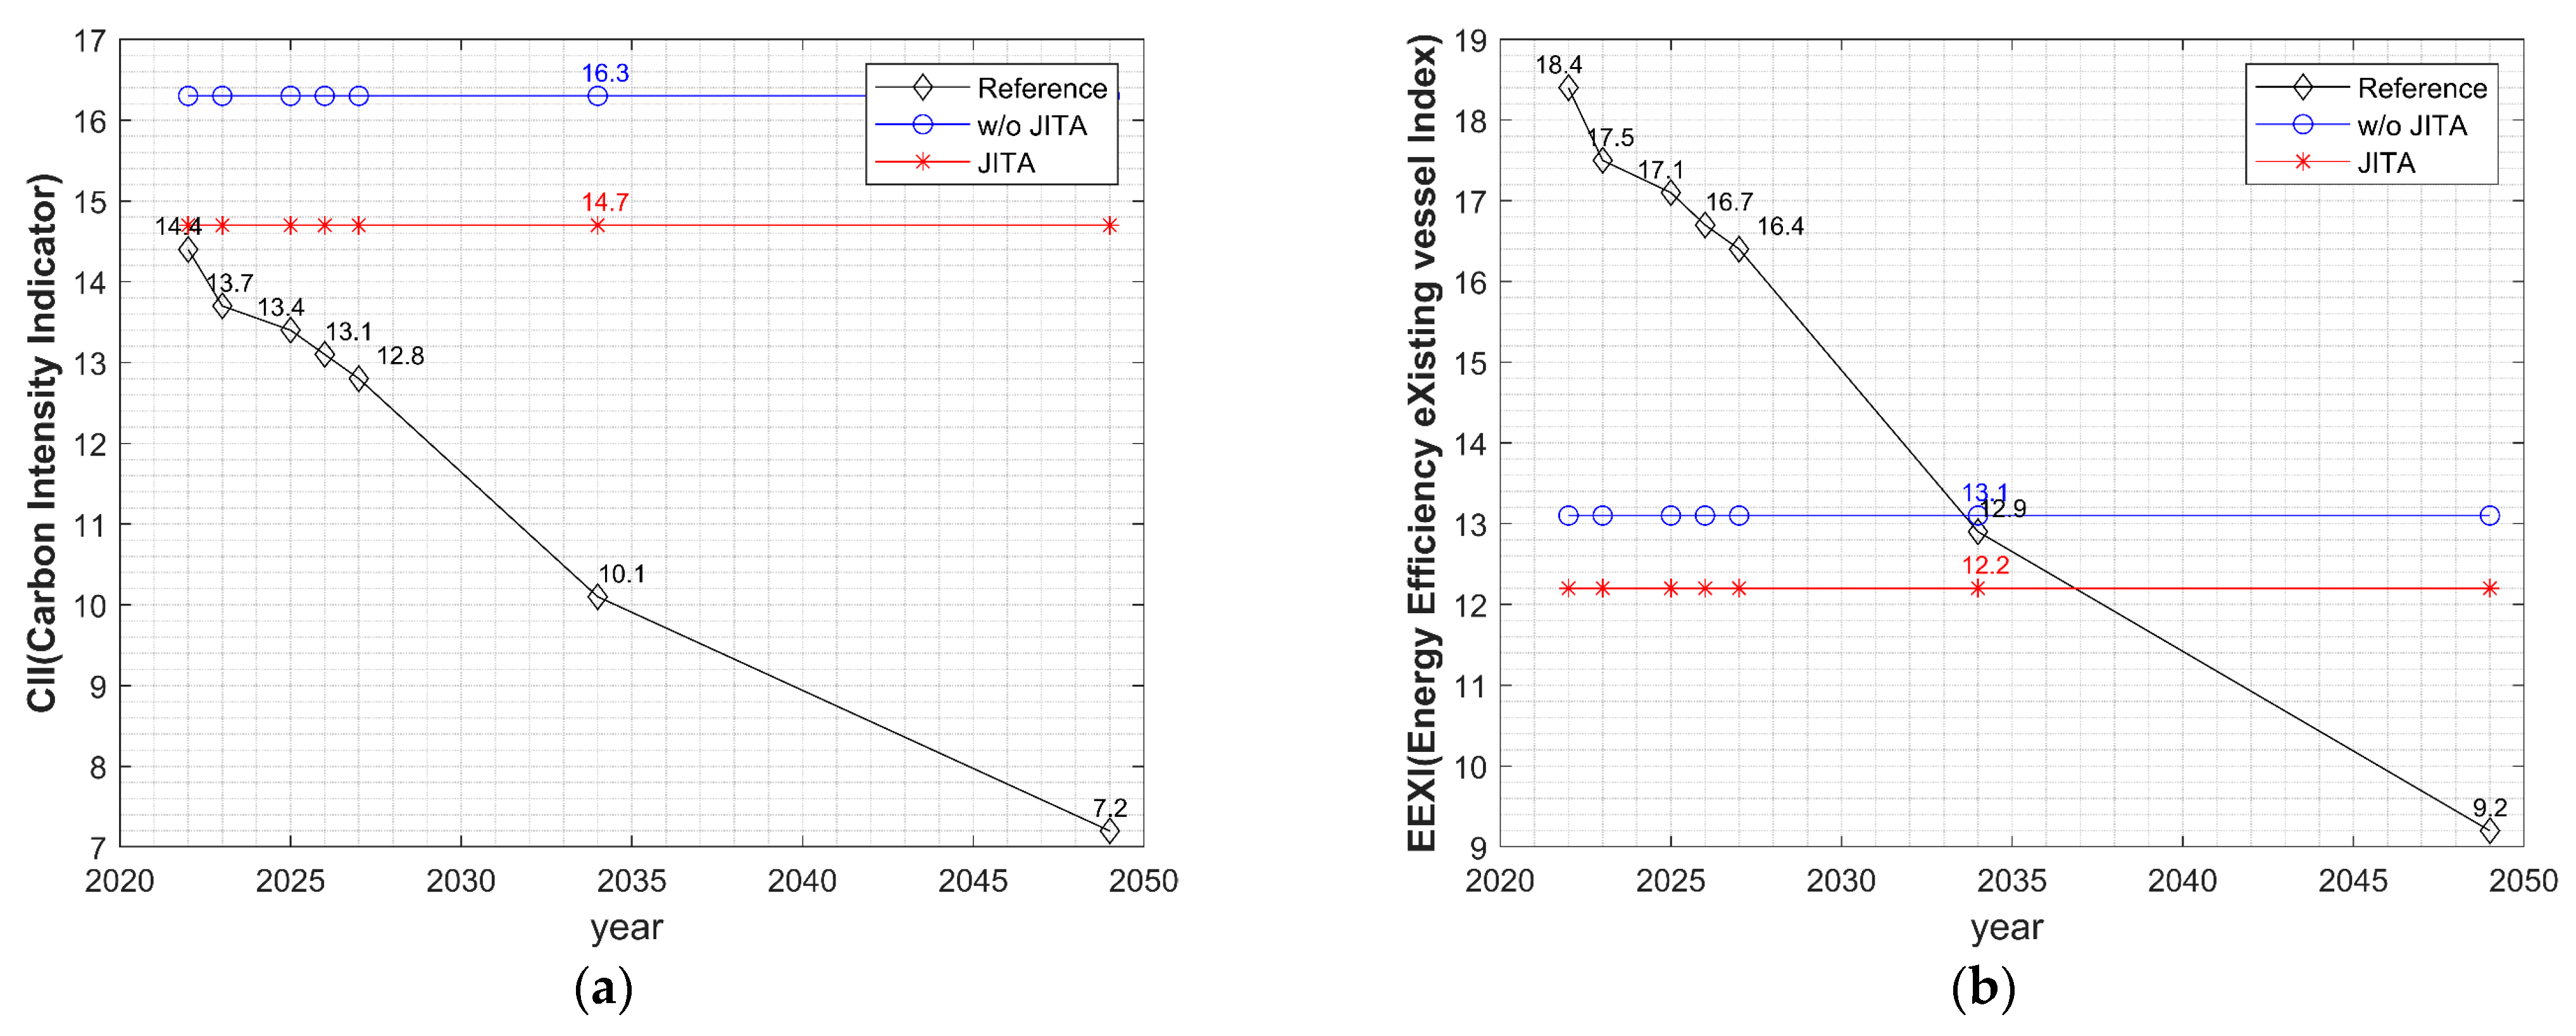
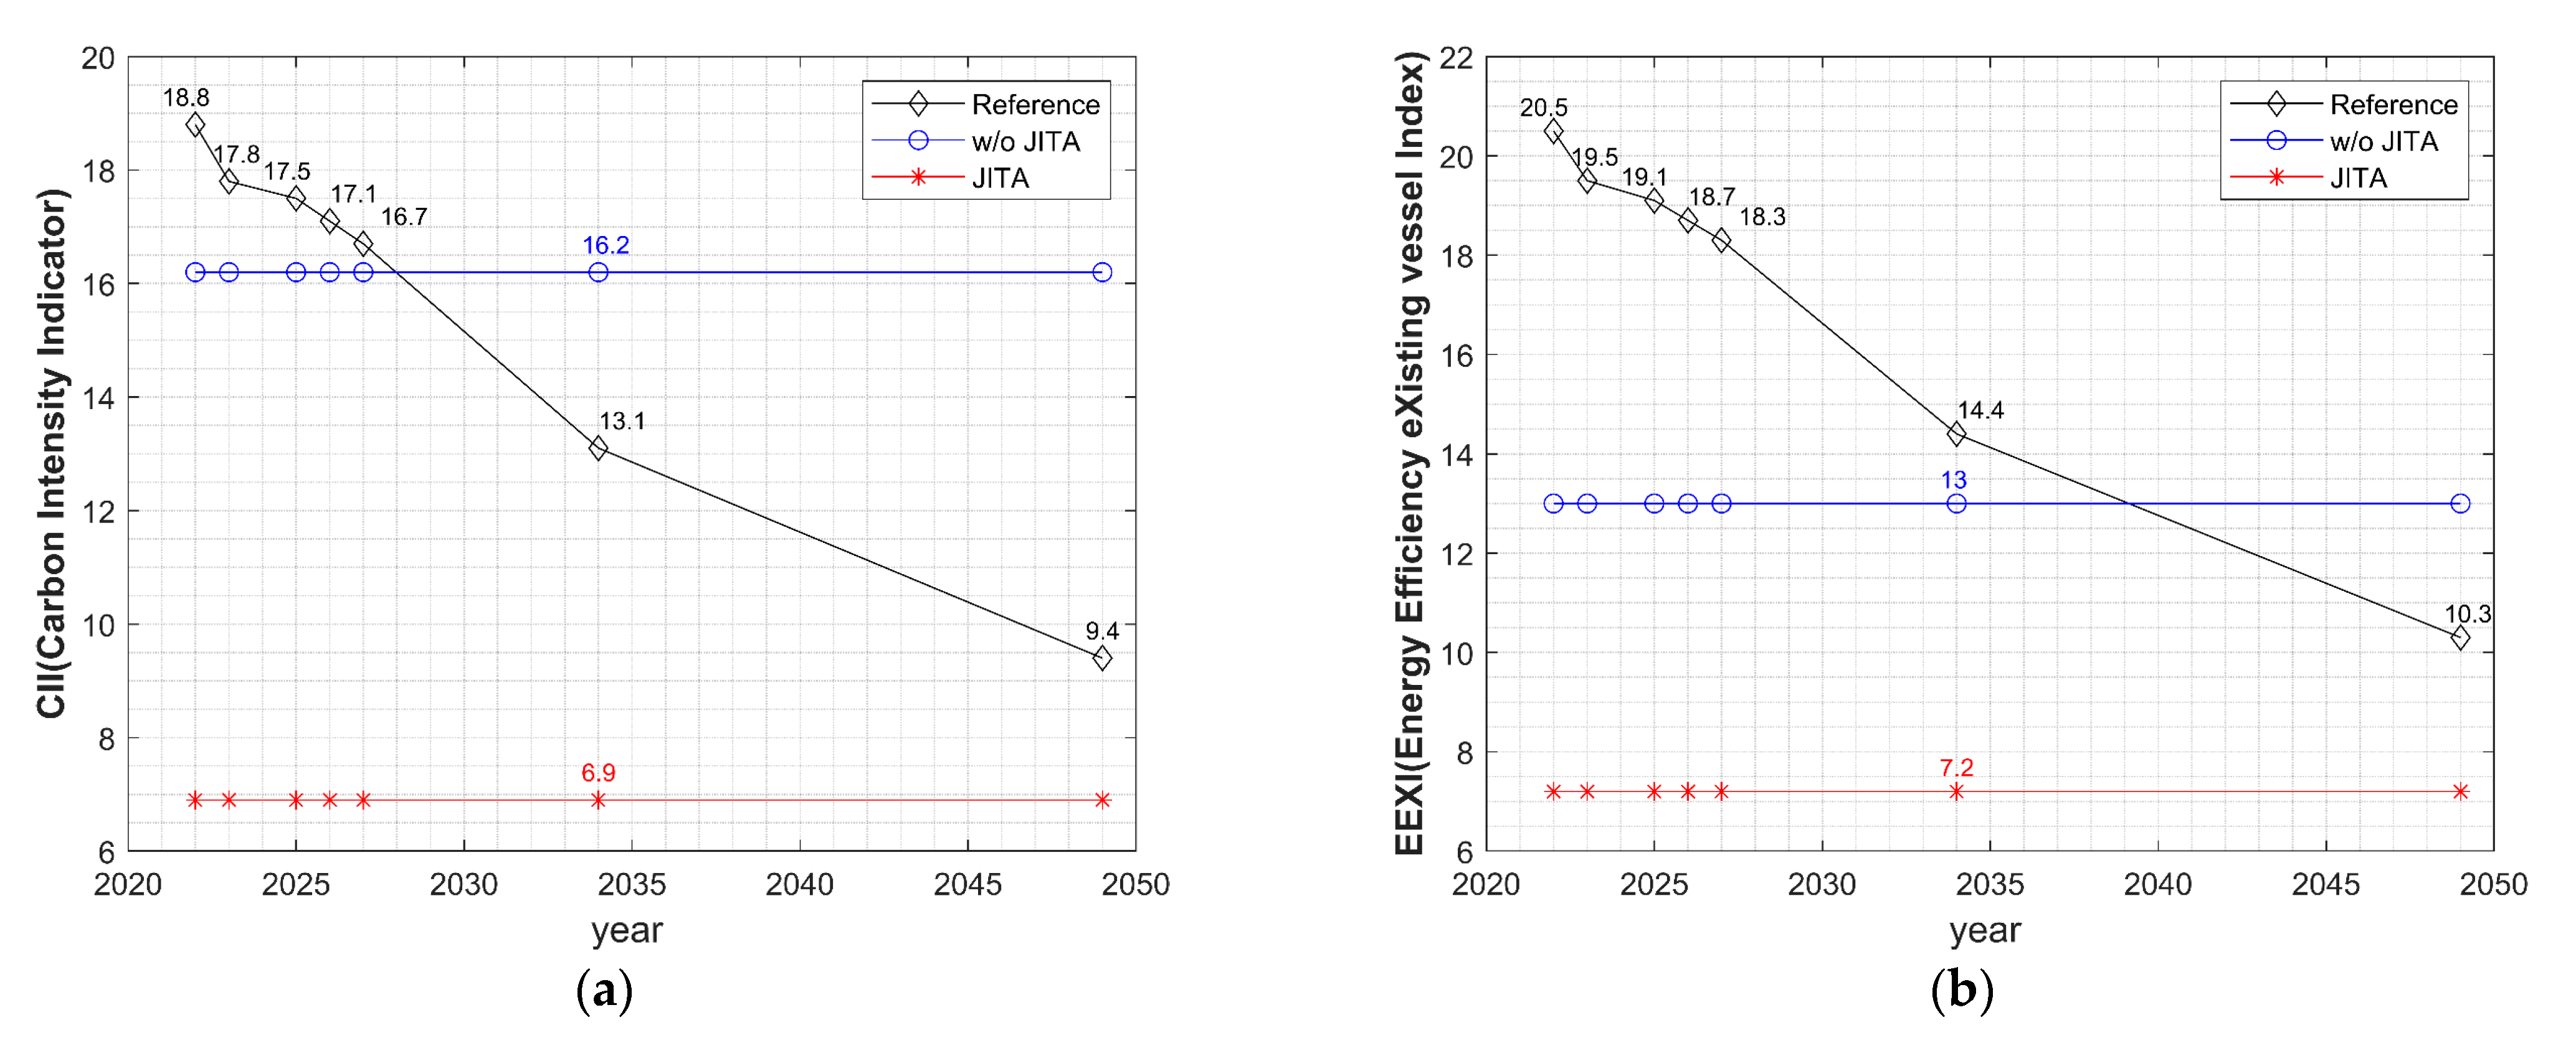
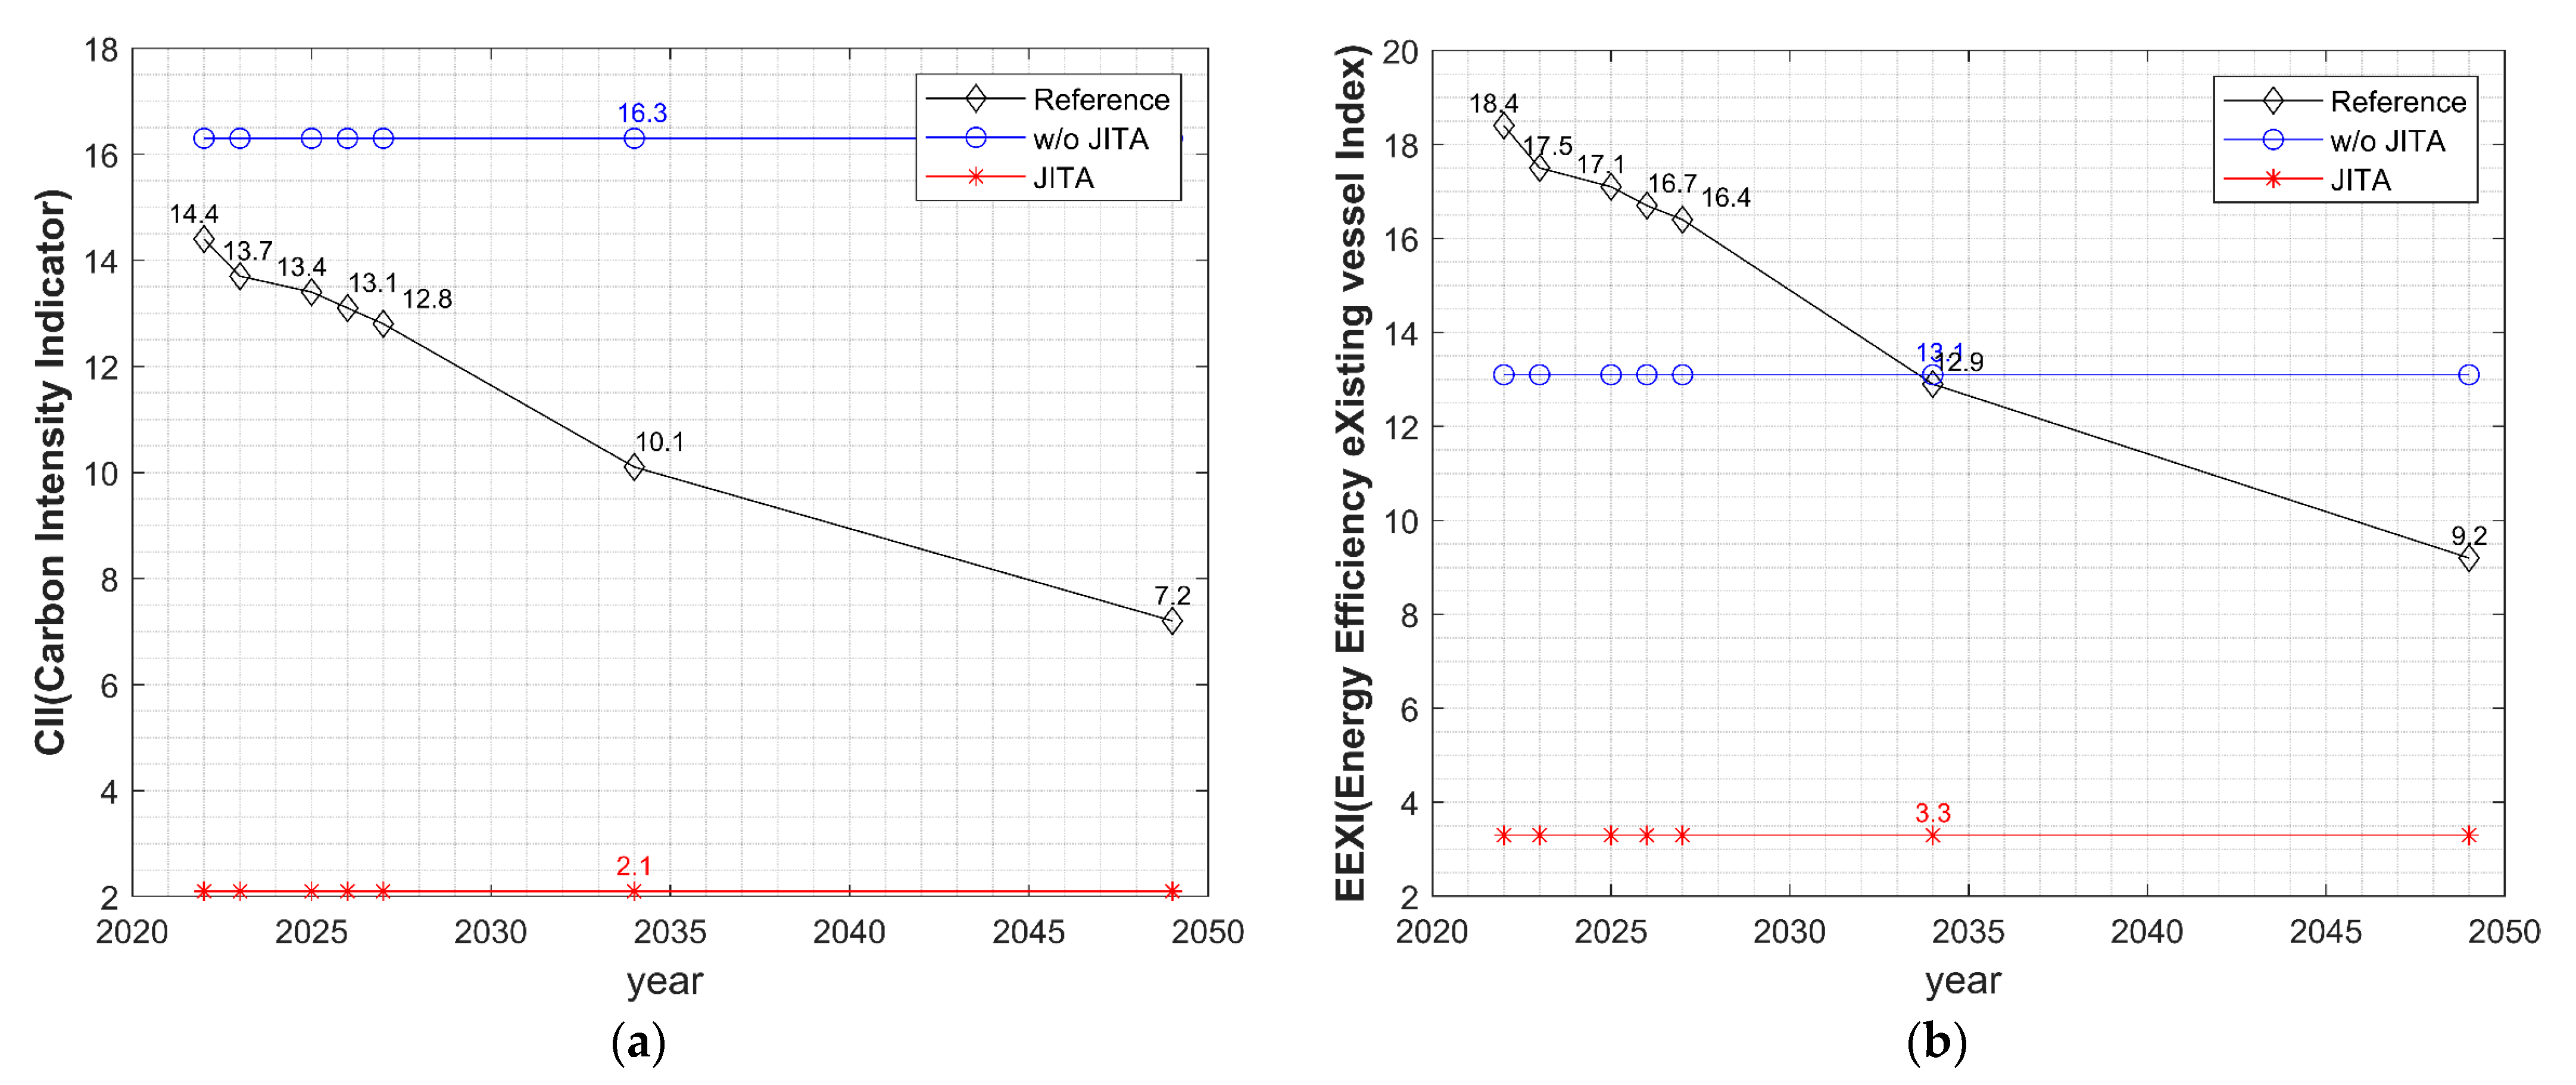
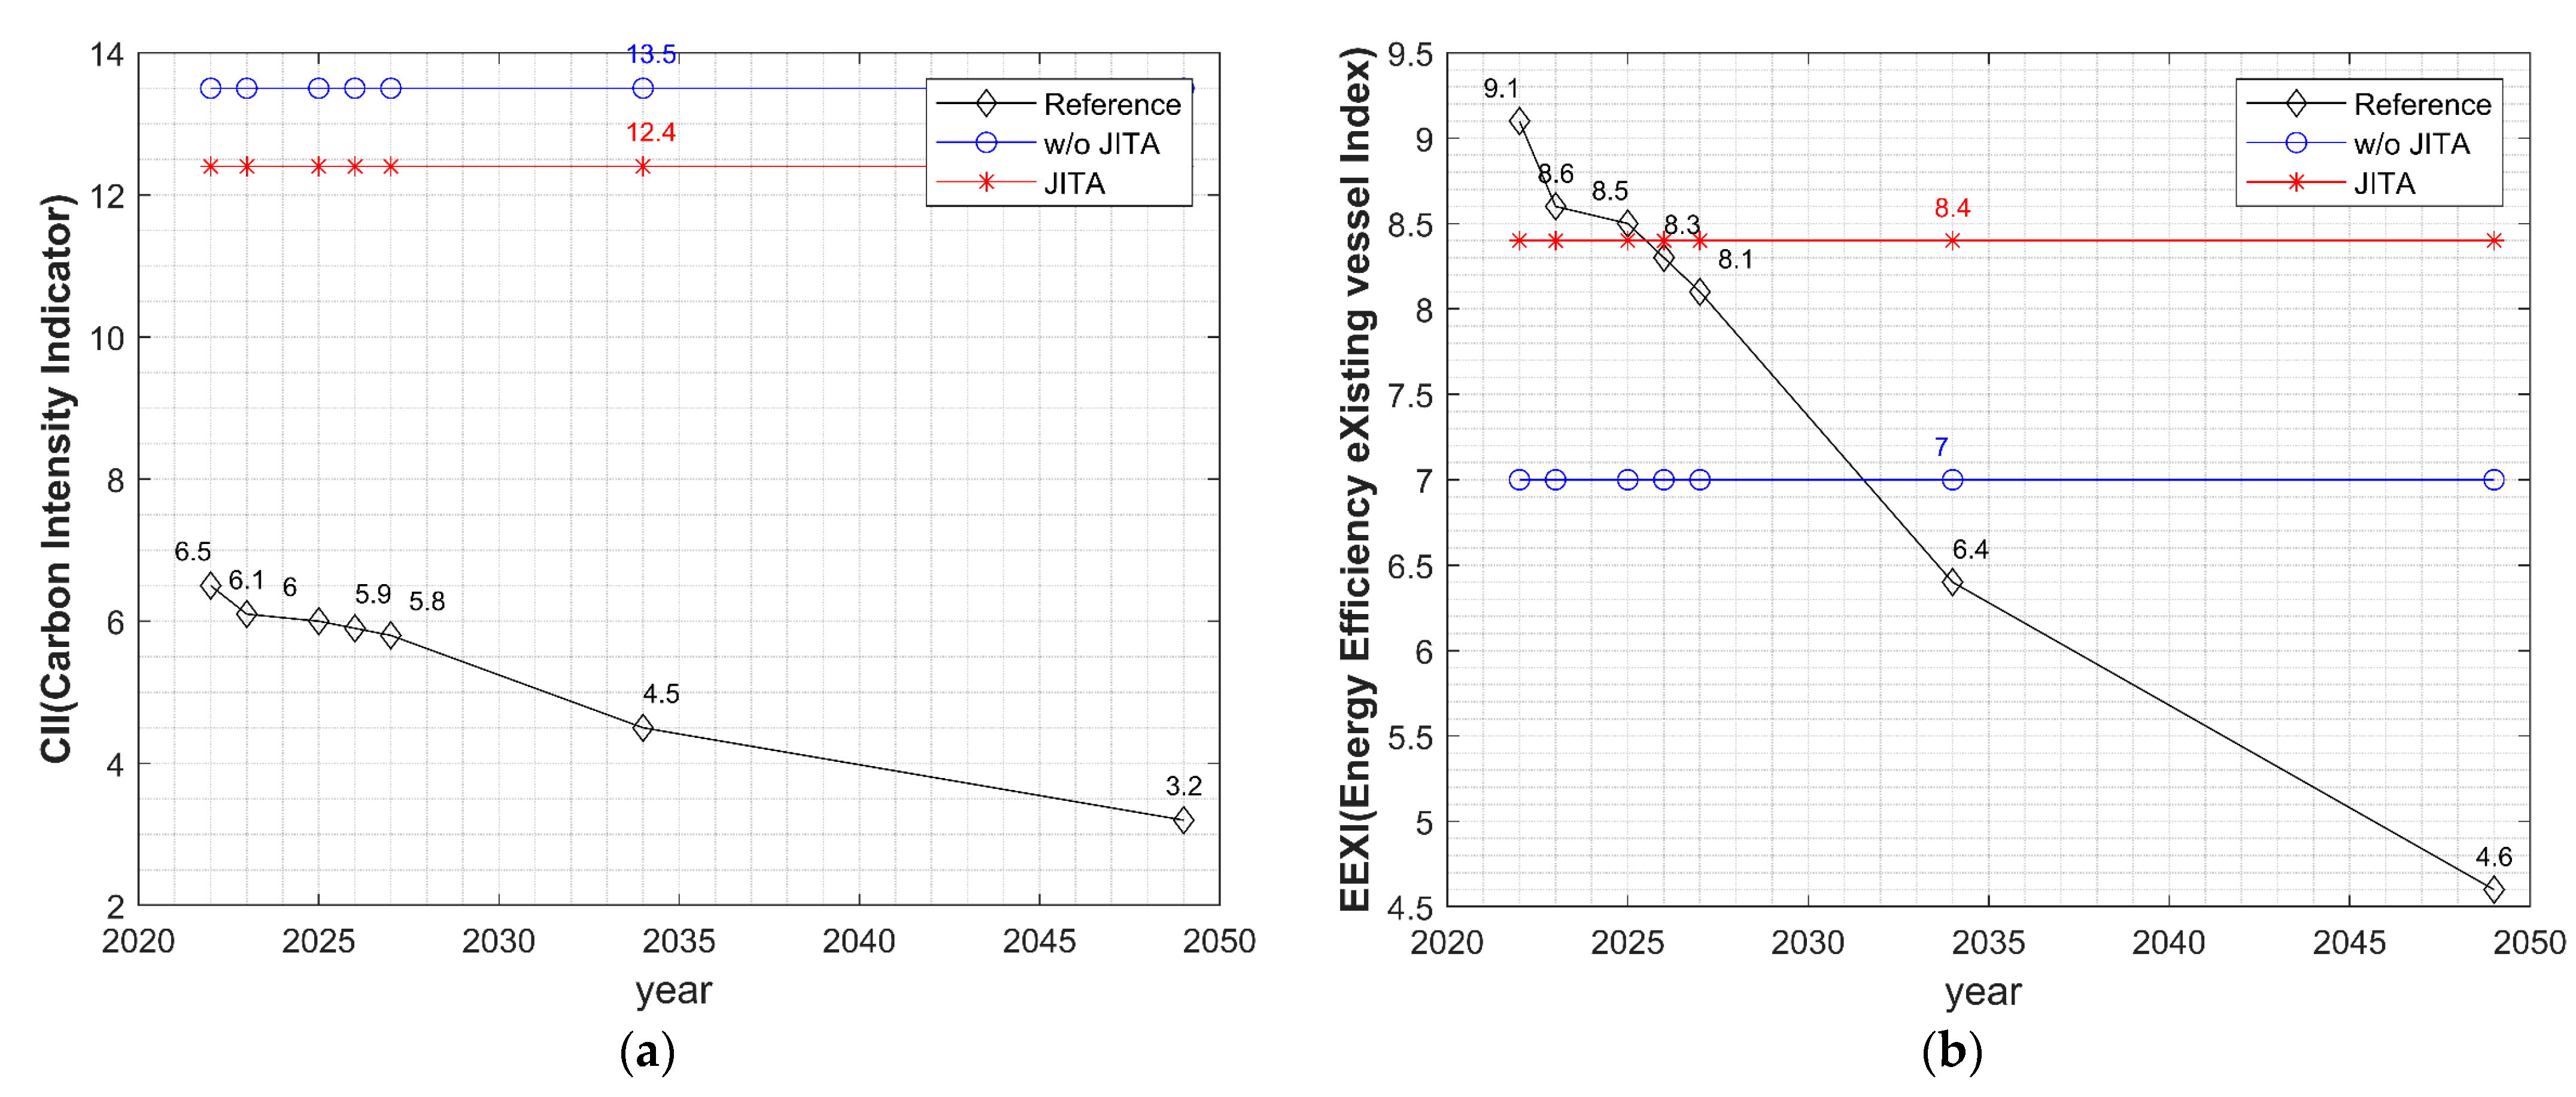
3.3. Berth 3 Case
4. Discussion
Author Contributions
Funding
Data Availability Statement
Conflicts of Interest
Acronyms and Nomenclatures
| GHG | Green House Gas |
| IMO | International Maritime Organization |
| CII | Carbon Intensity Indicator |
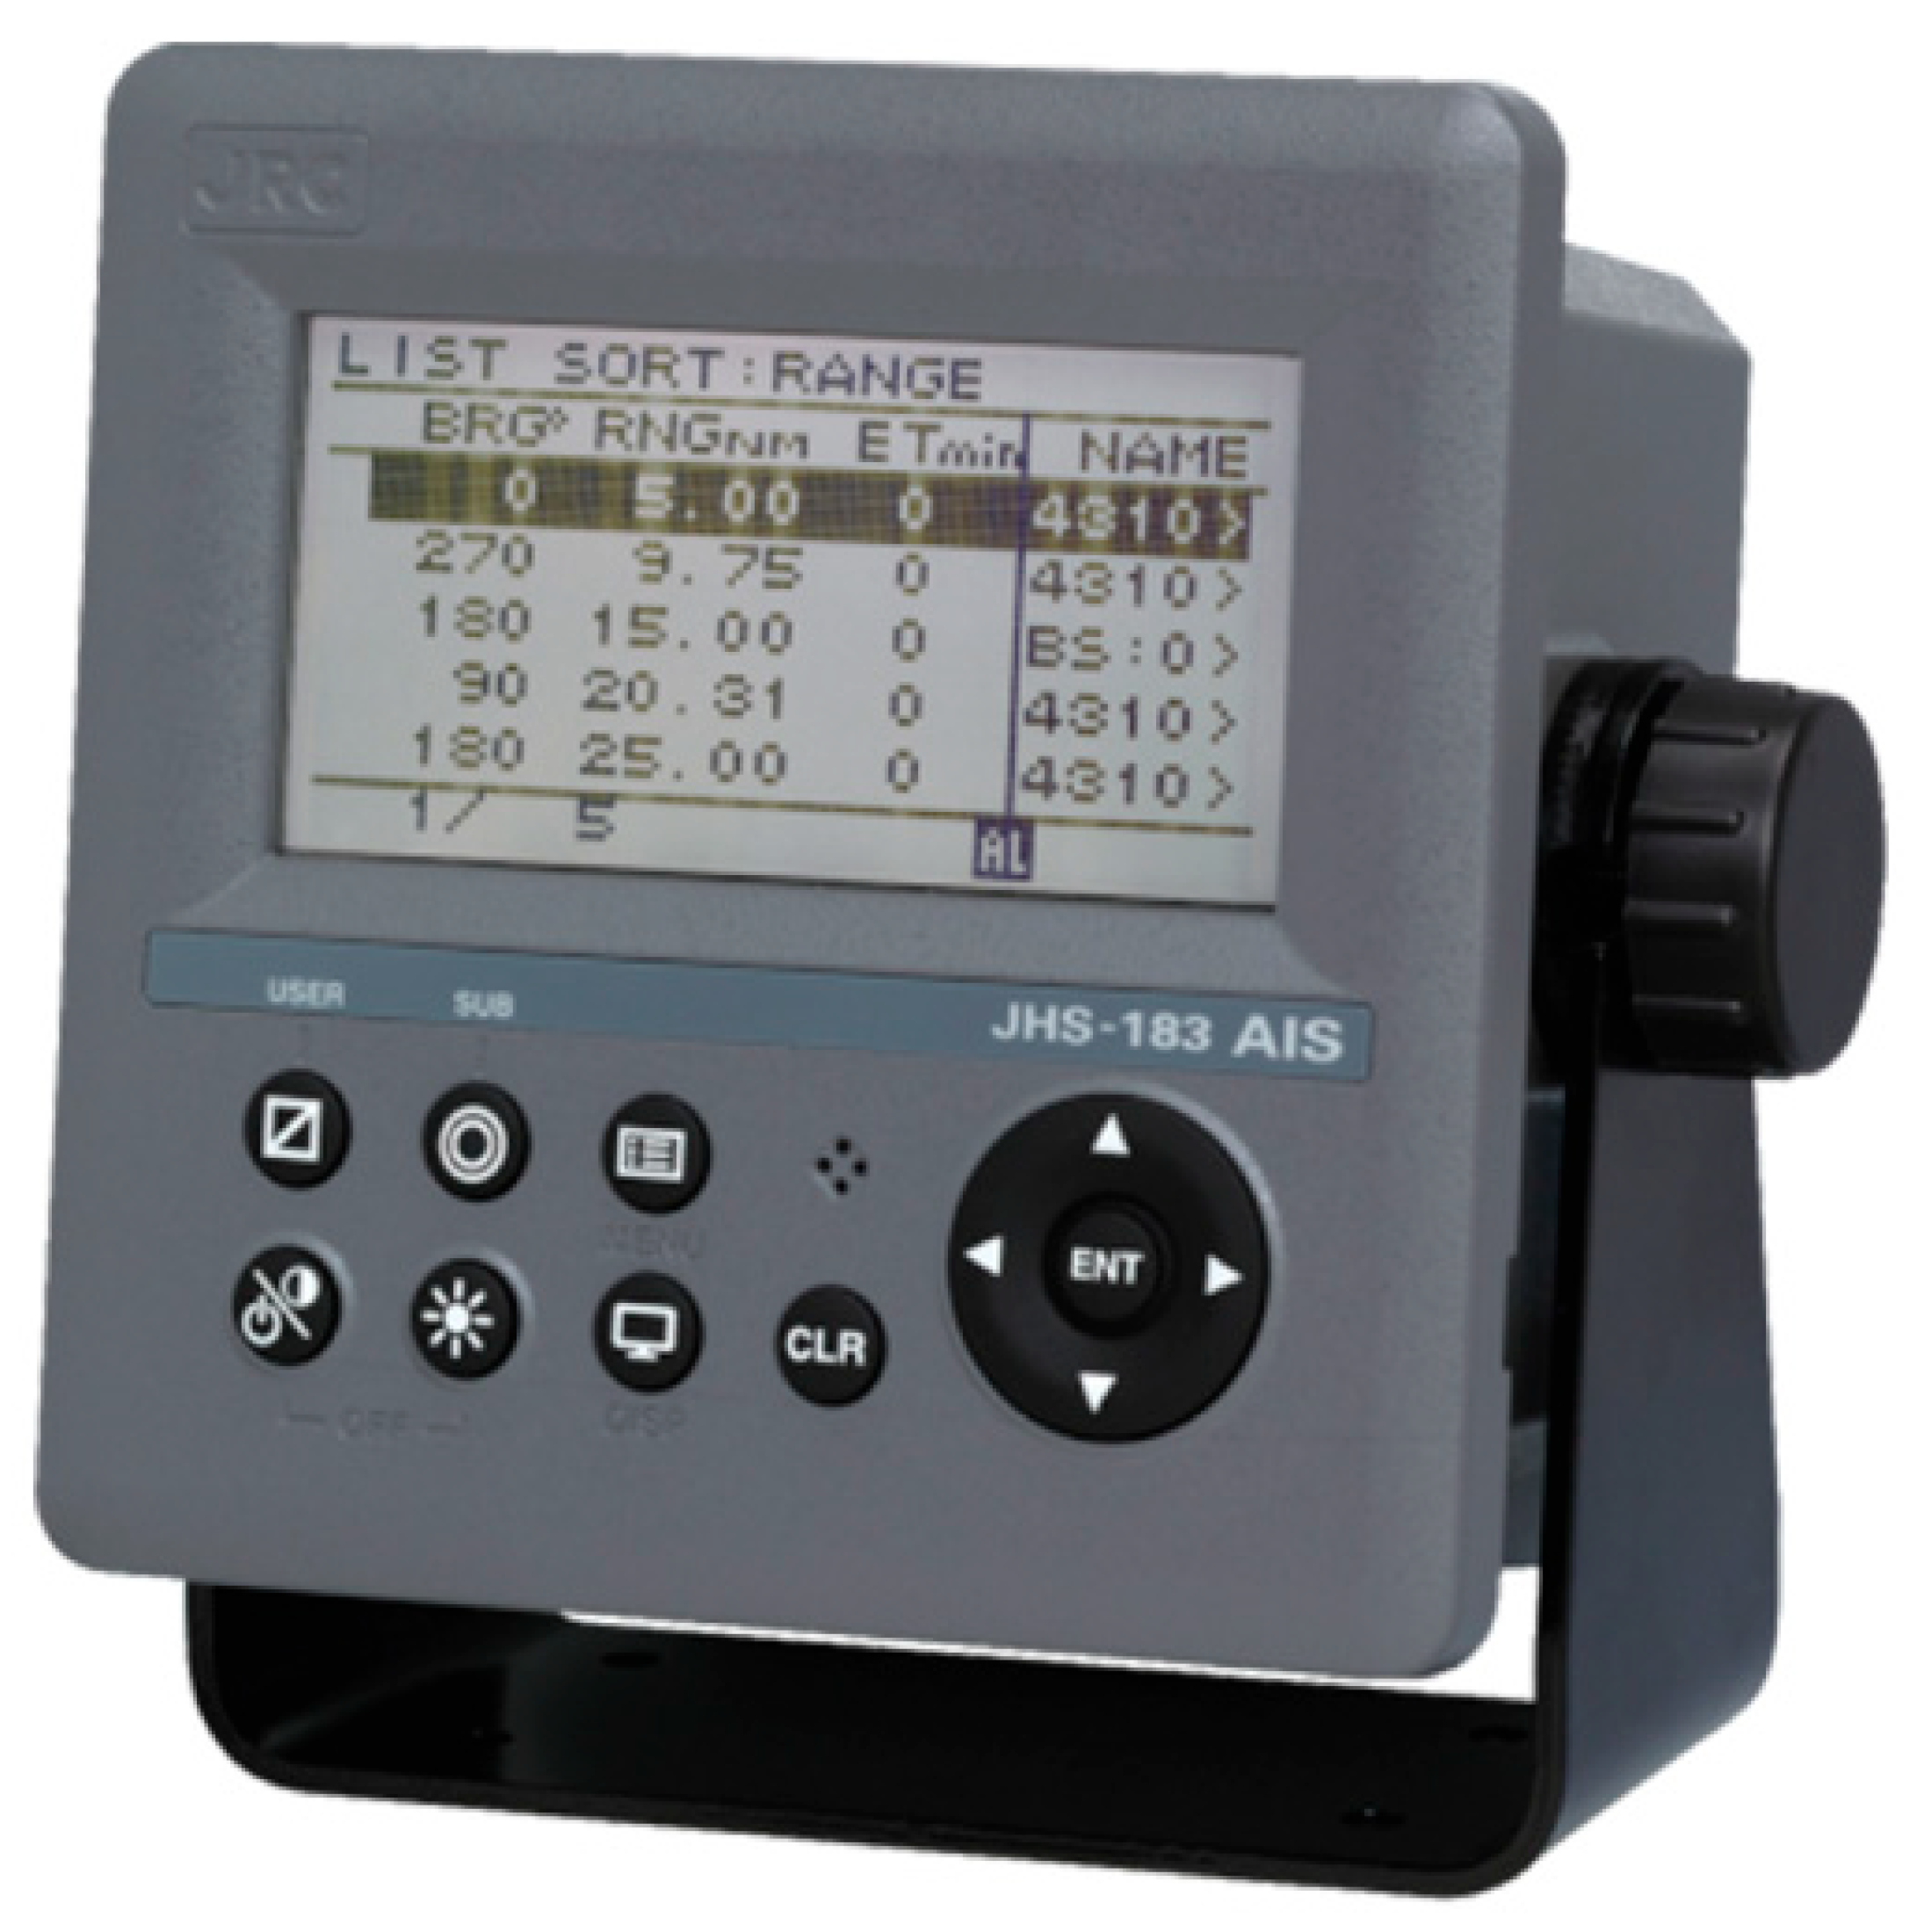
| AIS | Automatic Identification System |
| TOS | Terminal Operating System |
| EEXI | Energy efficiency existing index |
| MEPC | Marine Environment Protection Committee |
| DWT | Dead Weight |
| SFOC | Specific Fuel Oil Consumption |
| HFO | Heavy Fuel Oil |
| MDO | Marine Diesel Oil |
| MMSI | Maritime Mobile Service Identity |
| JITA | Just-in-Time Arrival |
| ETA | Estimated Time of Arrival |
| ATA | Actual Time of Arrival |
| RTA | Required Time of Arrival |
| ETD | Estimated Time of Departure |
| CF | Carbon Factor |
| CIIref | CII Reference Value |
| D | Voyage Distance |
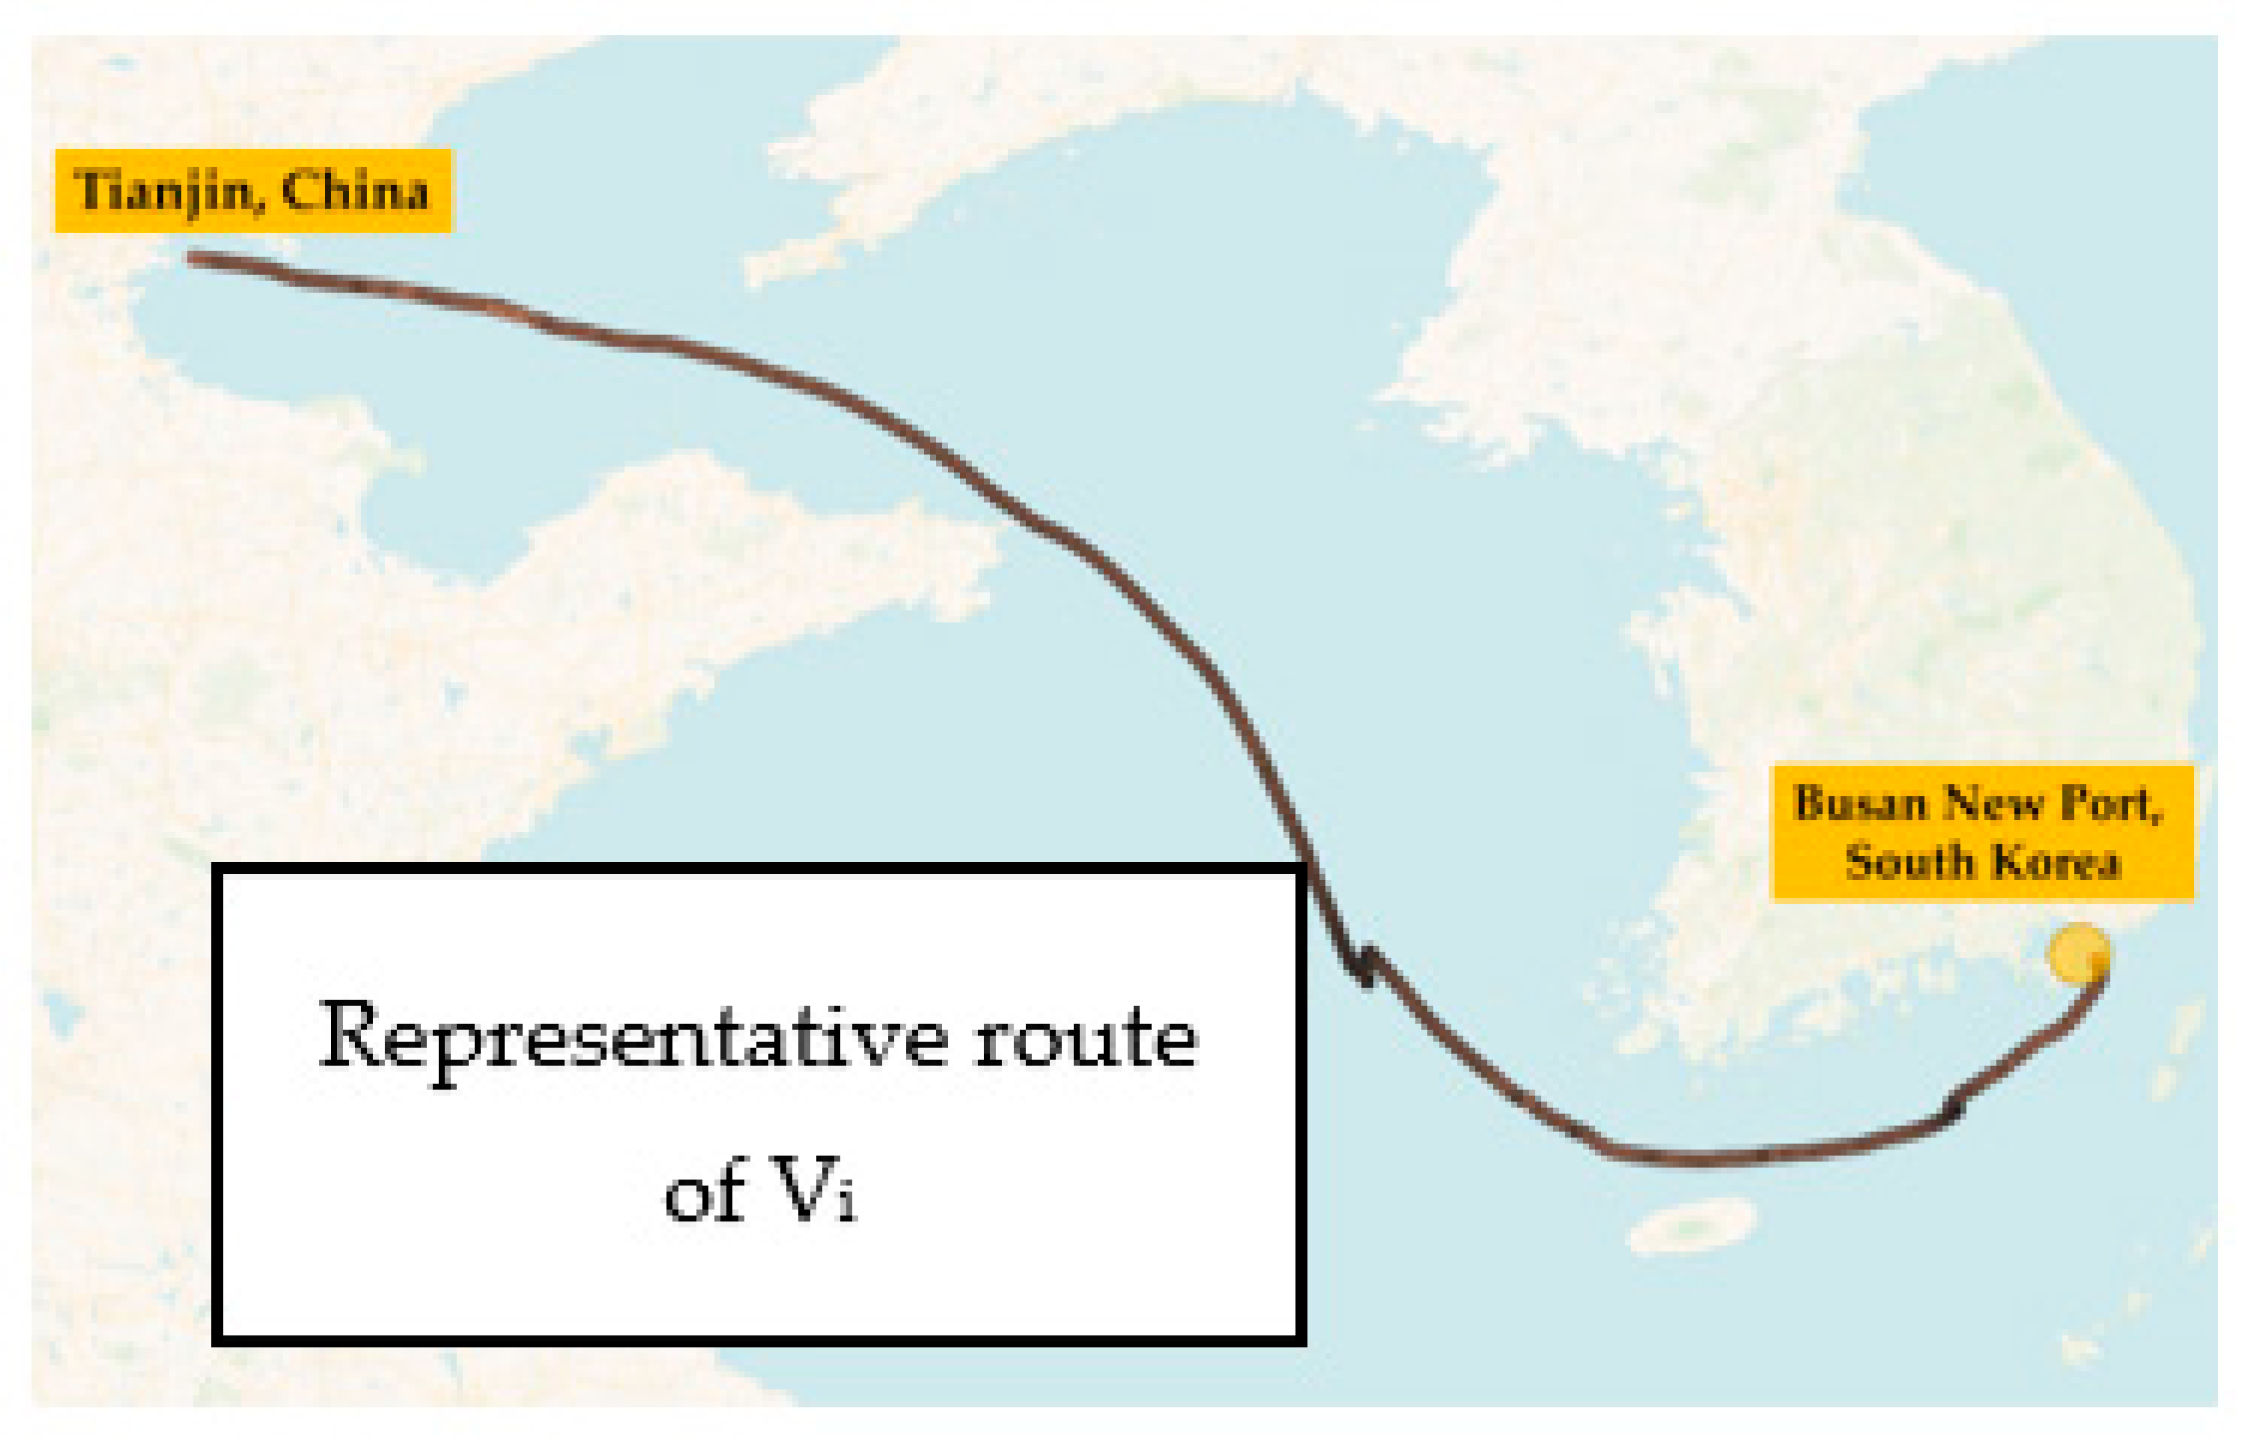
| Vi | ith vessel |
| WT | Waiting Time |
| Vs | Vessel Speed |
| VT | Voyage Time |
| Rhull | Hull Resistance |
| η | Delivery Efficiency |
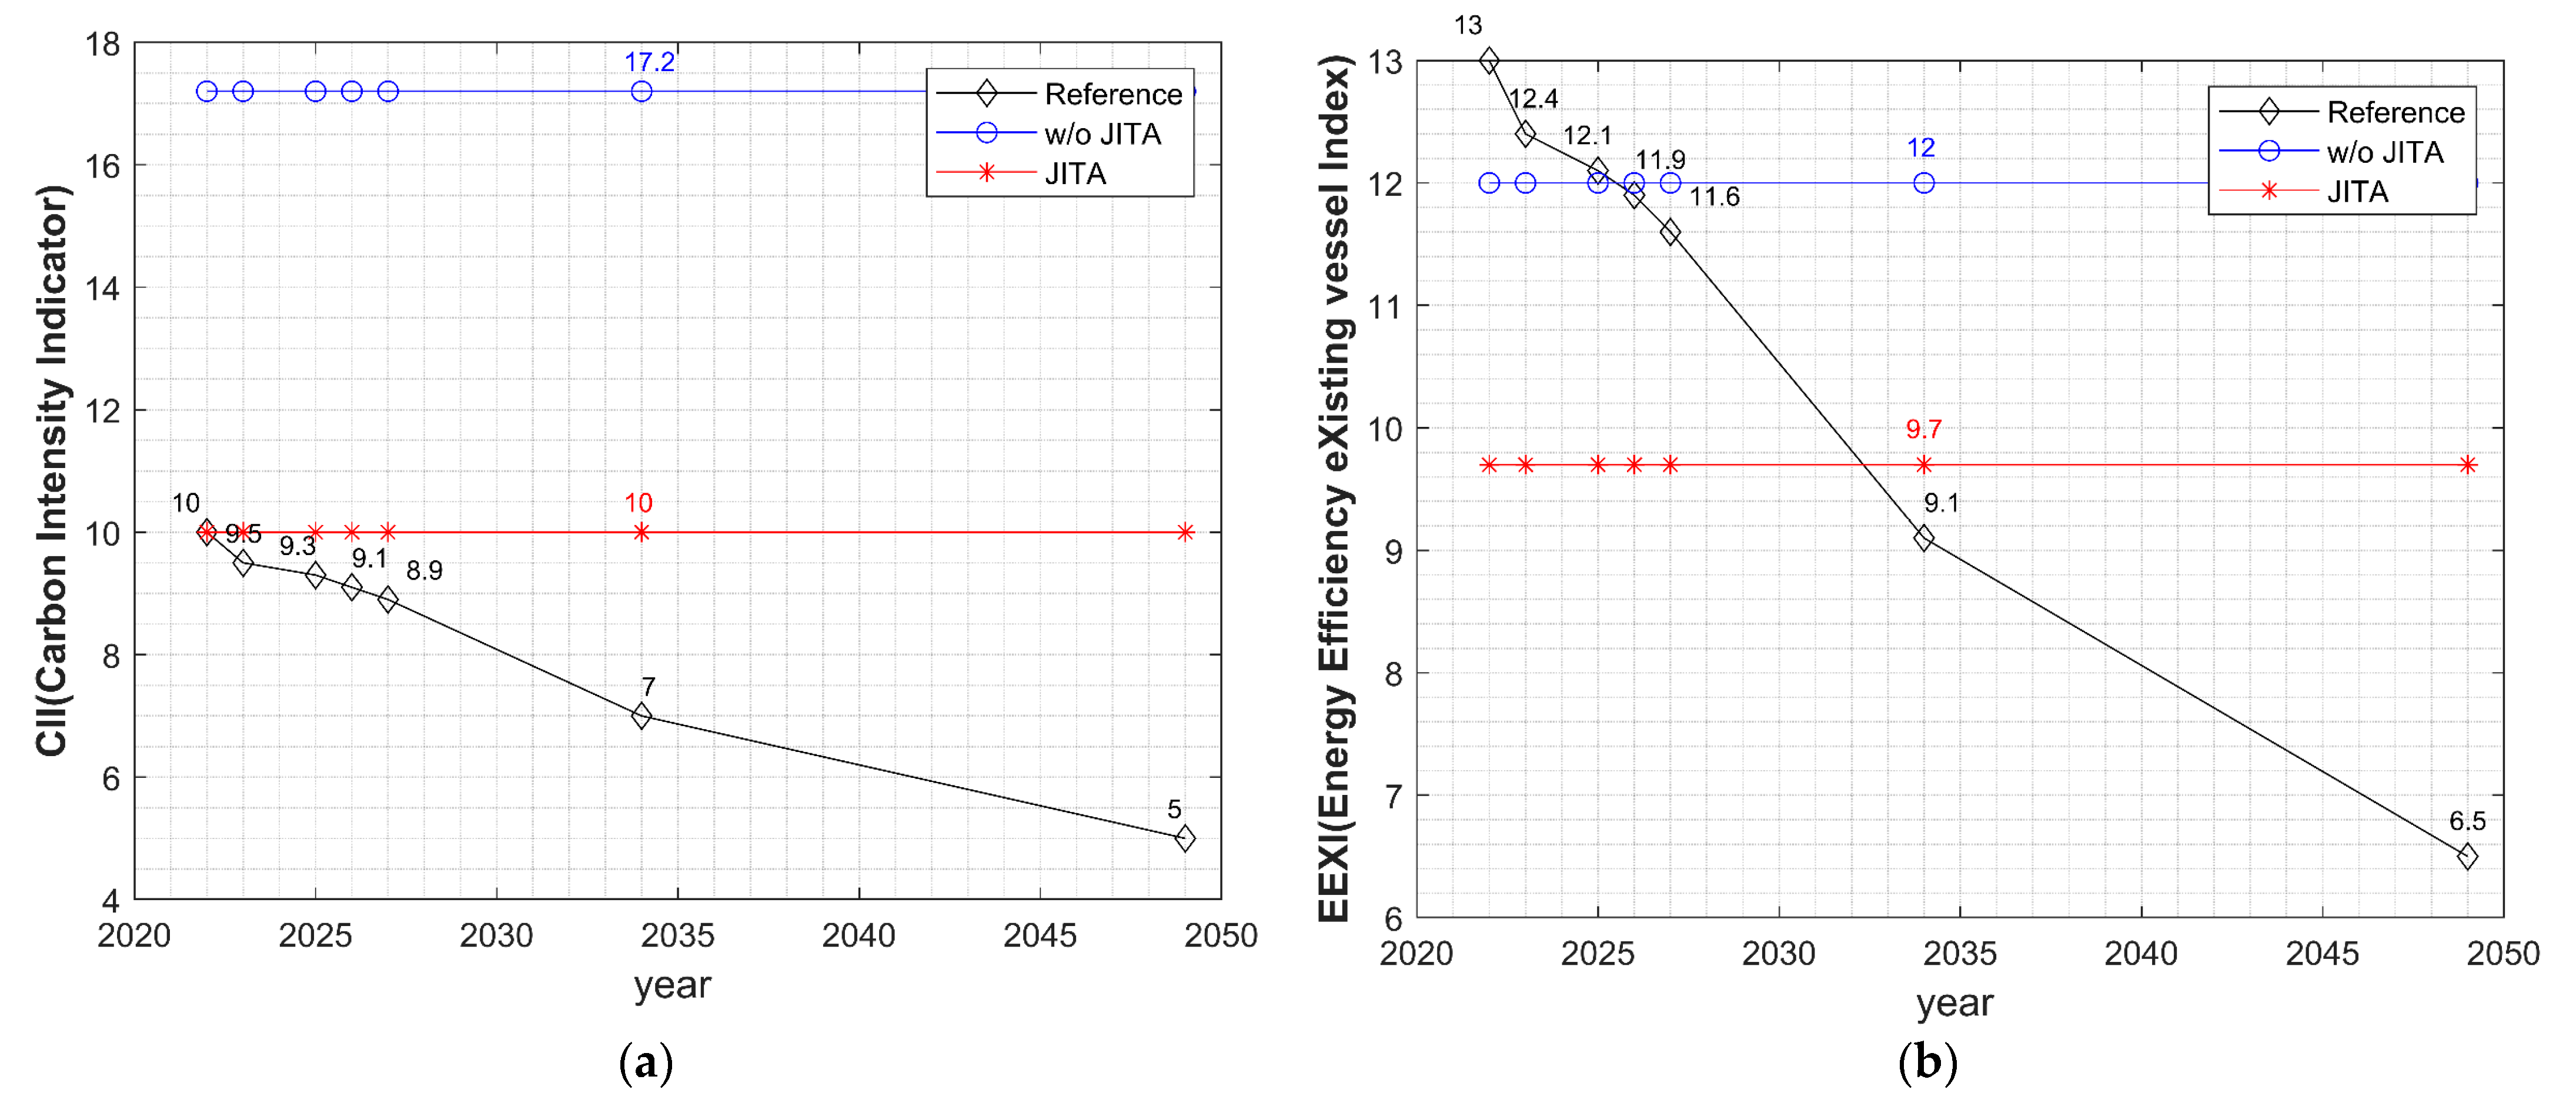
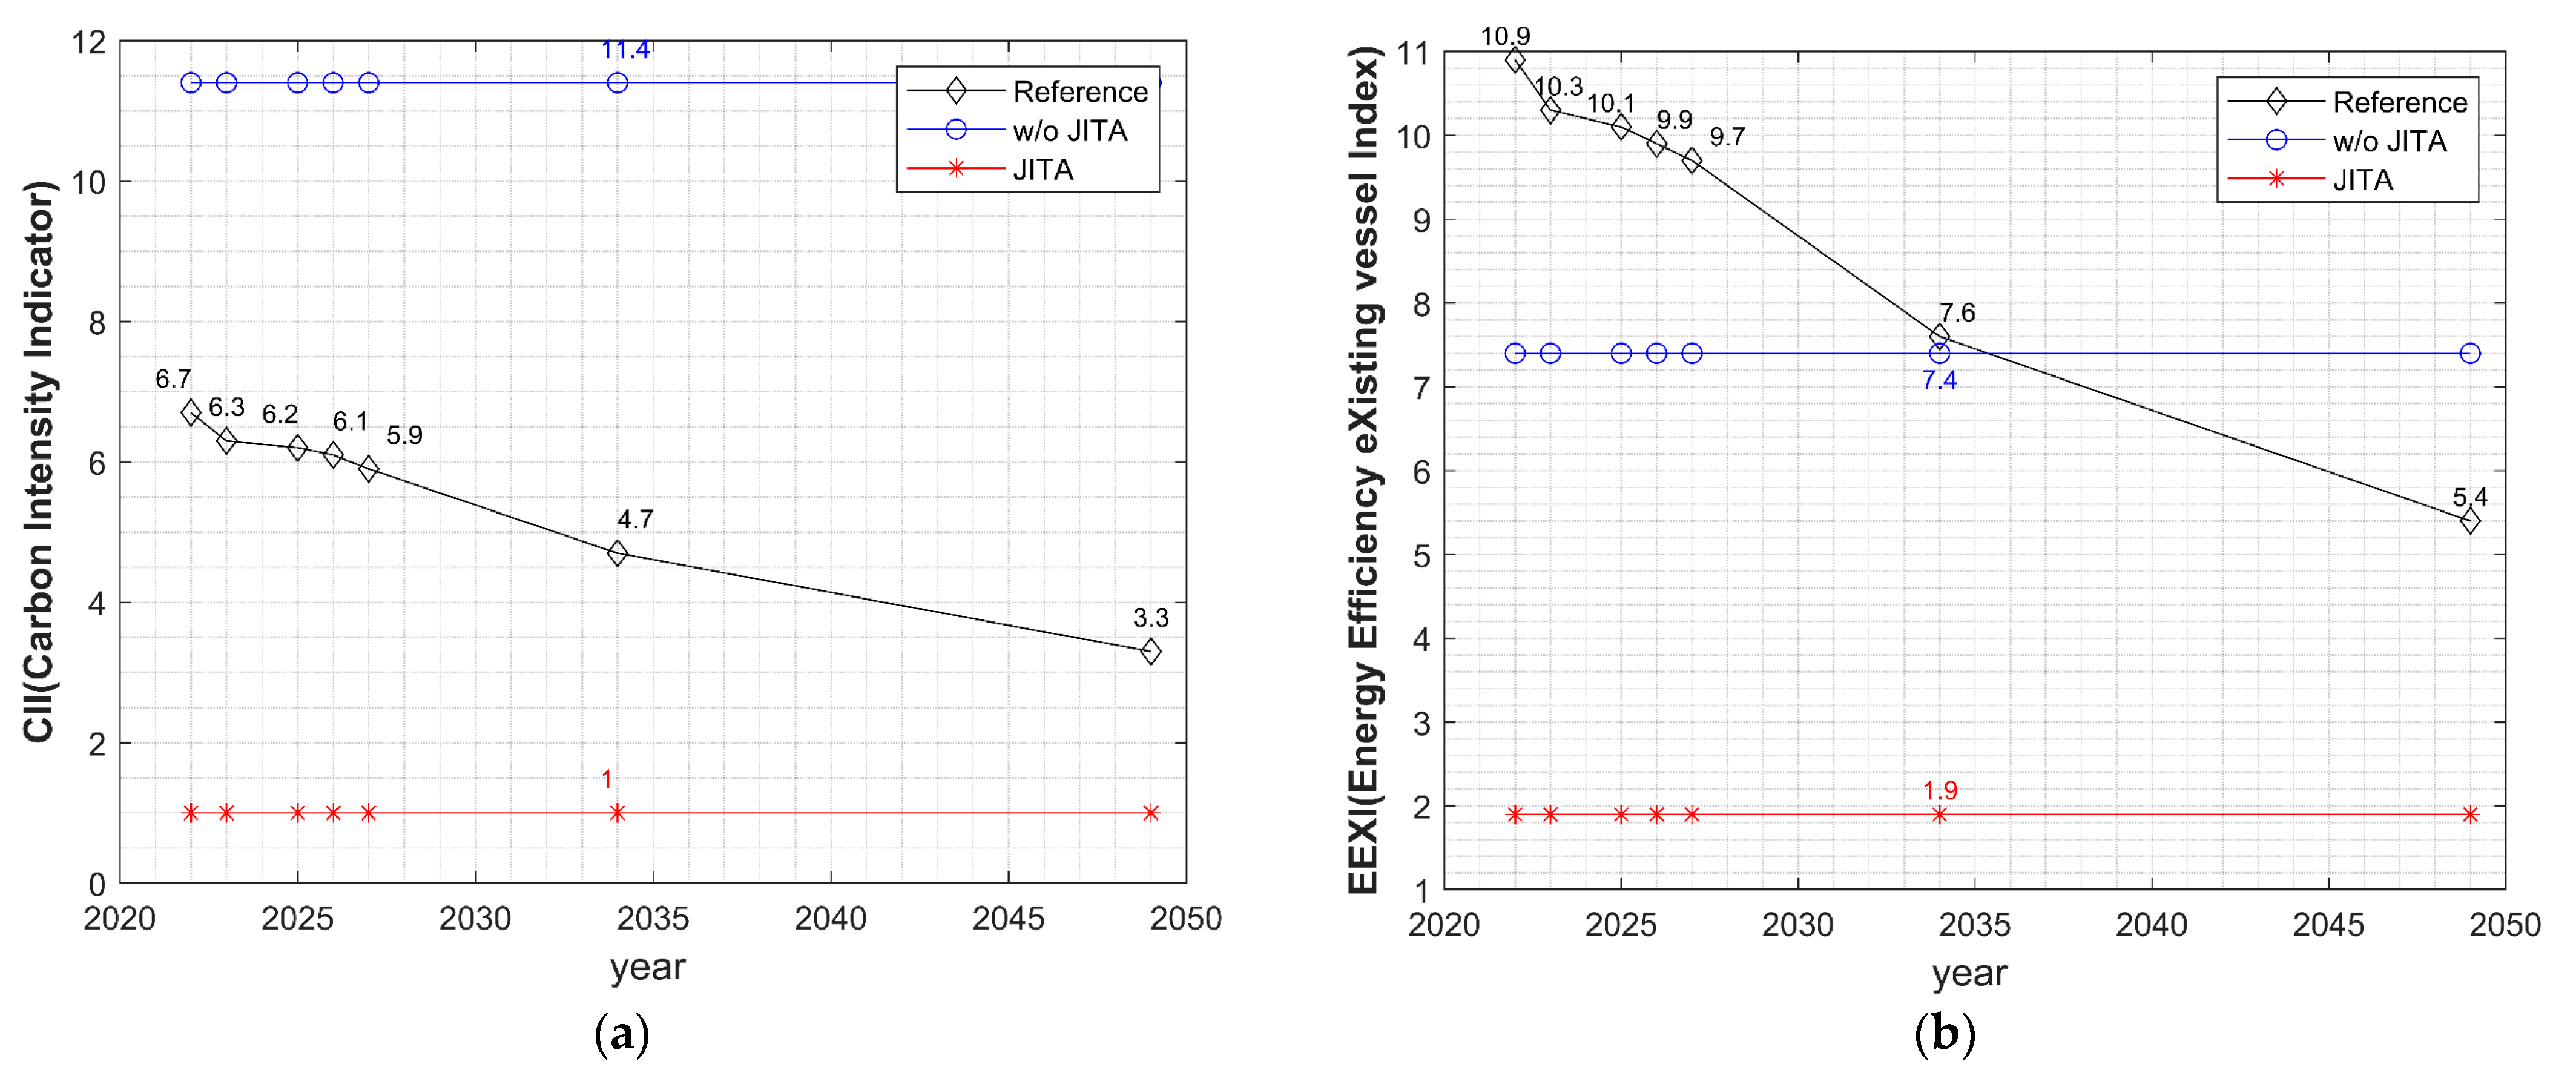
Appendix A. CII and EEXI Charts of the Vessels


References
- Joung, T.H.; Kang, S.G.; Lee, J.K.; Ahn, J. The IMO initial strategy for reducing Greenhouse Gas (GHG) emissions, and its follow-up actions towards 2050. J. Int. Marit. Saf. Environ. Aff. Shipp. 2020, 4, 1–7. [Google Scholar] [CrossRef]
- Serra, P.; Fancello, G. Towards the IMO’s GHG goals: A critical overview of the perspectives and challenges of the main options for decarbonizing international shipping. Sustainability 2020, 12, 3220. [Google Scholar] [CrossRef]
- Winnes, H.; Styhre, L.; Fridell, E. Reducing GHG emissions from ships in port areas. Res. Trans. Busi. Mana. 2015, 17, 73–82. [Google Scholar] [CrossRef]
- Halim, R.A.; Smith, T.; Englert, D.P. Understanding the Economic Impacts of Greenhouse Gas Mitigation Policies on Shipping: What Is the State of the Art of Current Modeling Approaches? World Bank Policy Research Working Paper 8695; World Bank: Washington, DC, USA, 2019. [Google Scholar]
- Gianni, M.; Pietra, A.; Coraddu, A.; Taccani, R. Impact of SOFC Power Generation Plant on Carbon Intensity Index (CII) Calculation for Cruise Ships. J. Mar. Sci. Eng. 2022, 10, 1478. [Google Scholar] [CrossRef]
- Braidotti, L.; Bertagna, S.; Rappoccio, R.; Utzeri, S.; Bucci, V.; Marinò, A. On the inconsistency and revision of Carbon Intensity Indicator for cruise ships. Transp. Res. Part D Transp. Environ. 2023, 118, 103662. [Google Scholar] [CrossRef]
- Bayraktar, M.; Yuksel, O. A scenario-based assessment of the energy efficiency existing ship index (EEXI) and carbon intensity indicator (CII) regulations. Ocean Eng. 2023, 278, 114295. [Google Scholar] [CrossRef]
- Yu, J.; Voß, S. Towards Just-In-Time Arrival for Container Ships by the Integration of Prediction Models. In Proceedings of the 56th Hawaii International Conference on System Sciences, Hawaii, HI, USA, 4 January 2023. [Google Scholar]
- Senss, A.; Canbulat, O.; Uzun, D.; Gunbeyaz, S.A.; Turan, O. Just in time vessel arrival system for dry bulk carriers. J. Ship. Trade 2023, 8, 12. [Google Scholar] [CrossRef]
- Mudzzaffar, H.B. Ship Route Optimization to Enable the Just-in-Time Arrival at a Port. Master’s Thesis, Nanyang Technological University, Singapore, 2022. [Google Scholar]
- Vermeulen, M. Identifying and Improving Port Call Processes to Enable Just-In-Time Arrivals and Services: A Case Study on MSC Container Shipping in the Port of Rotterdam. Master’s Thesis, Delft University of Technology, Delft, The Netherlands, 10 September 2020. [Google Scholar]
- Kim, S.; Yun, S.; You, Y. Eco-Friendly speed control algorithm development for autonomous vessel route planning. J. Mar. Sci. Eng. 2021, 9, 583. [Google Scholar] [CrossRef]
- Yoon, J.H.; Kim, D.H.; Yun, S.W.; Kim, H.J.; Kim, S. Enhancing Container Vessel Arrival Time Prediction through Past Voyage Route Modeling: A Case Study of Busan New Port. J. Mar. Sci. Eng. 2023, 11, 1234. [Google Scholar] [CrossRef]
- Arjona, J.; Giménez, A.; Ferrús, G.; Alonso, N.; Calabria, L.; Lara, J. Enabling a green just-in-time navigation through stakeholder collaboration. Eur. Transp. Res. Rev. 2020, 12, 22. [Google Scholar] [CrossRef]
- De Andres Gonzalez, O.; Koivisto, H.; Mustonen, J.M.; Keinänen-Toivola, M.M. Digitalization in just-in-time approach as a sustainable solution for maritime logistics in the baltic sea region. Sustainability 2021, 13, 1173. [Google Scholar] [CrossRef]
- ClassNK. Available online: https://www.classnk.or.jp/hp/pdf/activities/statutory/seemp/CII_en.pdf (accessed on 19 August 2023).
- IMO. Available online: https://wwwcdn.imo.org/localresources/en/OurWork/Environment/Documents/Air%20pollution/MEPC.337(76).pdf (accessed on 19 August 2023).
- IMO. Available online: https://wwwcdn.imo.org/localresources/en/KnowledgeCentre/IndexofIMOResolutions/MEPCDocuments/MEPC.334(76).pdf (accessed on 19 August 2023).
- IMO. Available online: https://wwwcdn.imo.org/localresources/en/KnowledgeCentre/IndexofIMOResolutions/MEPCDocuments/MEPC.333(76).pdf (accessed on 19 August 2023).
- IMO. Available online: https://wwwcdn.imo.org/localresources/en/OurWork/Environment/Documents/Air%20pollution/MEPC.339(76).pdf (accessed on 19 August 2023).
- IMO. Available online: https://wwwcdn.imo.org/localresources/en/OurWork/Environment/Documents/Air%20pollution/MEPC.338(76).pdf (accessed on 19 August 2023).
- IMO. Available online: https://www.imo.org/en/MediaCentre/PressBriefings/pages/CII-and-EEXI-entry-into-force.aspx (accessed on 19 August 2023).
- Man. Available online: https://man-es.com/applications/projectguides/2stroke/content/printed/S90ME-C10_2-GI.pdf (accessed on 19 August 2023).
- Man. Available online: https://man-es.com/applications/projectguides/2stroke/content/printed/G60ME-C9_5-GI.pdf (accessed on 19 August 2023).
- Man. Available online: https://man-es.com/applications/projectguides/2stroke/content/printed/k90mcc6.pdf (accessed on 19 August 2023).
- Wärtsilä. Available online: https://www.wartsila.com/marine/products/engines-and-generating-sets/diesel-engines/wartsila-32 (accessed on 19 August 2023).
- Man. Available online: https://man-es.com/applications/projectguides/2stroke/content/printed/s60mcc8.pdf (accessed on 19 August 2023).
- Man. Available online: https://man-es.com/applications/projectguides/2stroke/content/printed/l60mcc8.pdf (accessed on 19 August 2023).
- Man. Available online: https://man-es.com/applications/projectguides/2stroke/content/printed/S90ME-C9_2.pdf (accessed on 19 August 2023).
- Wärtsilä. Available online: https://www.wartsila.com/docs/default-source/product-files/engines/ls-x-engine/wartsila-o-e-ls-x92.pdf?sfvrsn=2 (accessed on 19 August 2023).
- Man. Available online: https://man-es.com/applications/projectguides/2stroke/content/printed/G80ME-C9_2.pdf (accessed on 19 August 2023).
- ClassNK. Available online: https://www.classnk.or.jp/hp/pdf/activities/statutory/eexi/eexi_rev3e.pdf (accessed on 19 August 2023).
- DCSA. Available online: https://dcsa.org/standards/jit-port-call/ (accessed on 19 August 2023).


| Category | Approach Used in Previous Research | Approach Used in This Paper |
|---|---|---|
| Time stamp exchange between ship and vessel | Braidotti et al. [6] and Bayraktar [7] did not consider interactive scheduling between ship and port | A periodical time stamp communication structure between ship and vessel is proposed in order to enhance the schedule perception for the vessel and port. |
| Effect of just-in-time arrival on CII | Just-in-time arrival policy is not considered in the calculation of CII [5,6,7] | A just-in-time arrival policy application method is developed and adopted |
| Ship and terminal operation data | Real schedule data were not applied in the CII modeling [5,6,7] | Real ship arrival and departure data are applied |
| AIS-based route modeling and arrival time prediction | AIS-based realistic route modeling was not conducted [5,6,7,8,9,10,11] | AIS-based realistic route modeling is conducted |
| Fuel Type | CF (t-CO2/t-Fuel) | Carbon Content |
|---|---|---|
| MDO | 3.206 | 0.8744 |
| HFO | 3.114 | 0.8493 |
| LNG | 2.766 | 0.7500 |
| Methanol | 1.375 | 0.3750 |
| Vessel | TEU | Fuel Type | DWT (ton) | Max. Speed (knot) | SFOC (gallon/kwh) at MCR | Engine Model |
|---|---|---|---|---|---|---|
| V1 | 8401 | HFO | 107,964 | 25.6 | 172 | MAN B&W 12K98MEC |
| V2 | 14,000 | HFO | 109,832 | 21 | 162 | MAN B&W 9S90ME-C10.2 |
| V3 | 4249 | HFO | 49,954 | 24.5 | 177 | MAN B&W 8K90MC-C |
| V4 | 13,798 | MDO | 67,797 | 23.1 | 174 | MAN B&W 8K98MC-C |
| V5 | 100 | MDO | 3650 | 19.1 | 178 | Wärtsilä 8R32 E |
| V6 | 12,400 | HFO | 37,087 | 22 | 171 | MAN B&W 7S60MC-C |
| V7 | 2061 | HFO | 23,679 | 20 | 172 | MAN B&W 6L60MC |
| V8 | 10,000 | HFO | 13,779 | 24 | 171 | MAN B&W 7L458/64 |
| V9 | 9300 | HFO | 139,419 | 19.3 | 174 | MAN-B&W 12K98MC-C7 |
| V10 | 14,500 | HFO | 23,679 | 22.8 | 172 | MAN B&W 6L60MC |
| V11 | 5762 | HFO | 121,839 | 26.2 | 170 | MAN B&W 12K98MEC |
| V12 | 13,000 | HFO | 104,544 | 25.8 | 167 | MAN-B&W, 8S90ME-C9.2 |
| V13 | 16,010 | HFO | 149,831 | 19.3 | 166 | Wärtsilä. Model, 8X92 |
| V14 | 9200 | HFO | 132,788 | 19.5 | 167 | MAN B&W 7S80ME-C9.2 |
| V15 | 8063 | HFO | 114,908 | 25 | 165 | MAN B&W, 11S90ME-C |
| Field | Value |
|---|---|
| MMSI | 19,875,715 (Vi) |
| ETA | 20 September 2022. 13:00:00 |
| ATA | 21 September 2022. 10:00:00 |
| Berth Location | Berth 1, 2, 3 |
| Field | Value |
|---|---|
| voyage_info | (eta: ‘09211045’, max_draught: 10.0, destination: ‘SADMM’) |
| Position_info | (‘lat’: 17.2595, ‘lon’: 72.4836, ‘turn’: 44.0, ‘speed’: 12.2, ‘course’: 196.1, ‘true_heading’: 140, ‘received’: 2022-09-13T04:35:58Z’), |
| Previous Port | Tianjin, Shanhai, Tokyo, Singapore, etc. |
| Destination | Pusan |
| Vessel | Distance (NM) | Previous Port |
|---|---|---|
| V1 | 439 | Shanhai |
| V2 | 488 | Qindao |
| V3 | 741 | Tainjin |
| V4 | 504 | Ningbo |
| V5 | 488 | Qindao |
| V6 | 741 | Tainjin |
| V7 | 546 | Vladivostok |
| V8 | 488 | Qindao |
| V9 | 504 | Ningbo |
| V10 | 488 | Qindao |
| V11 | 741 | Tainjin |
| V12 | 158 | Yokohama |
| V13 | 2544 | Singapore |
| V14 | 504 | Ningbo |
| V15 | 741 | Tianjin |
| Vessel | JIT Additional Hour (WT) | Vessel | JIT Additional Hour (WT) |
|---|---|---|---|
| V1 | 2 | V9 | 7 |
| V2 | 22 | V10 | 24 |
| V3 | 11 | V11 | 1 |
| V4 | 5 | V12 | 1 |
| V5 | 41 | V13 | 8 |
| V6 | 1 | V14 | 32 |
| V7 | 1 | V15 | 47 |
| V8 | 8 |
| Year | Reduction Factor (Z) |
|---|---|
| 2023 | 5% |
| 2024 | 7% |
| 2025 | 9% |
| 2026 | 11% |
| 2027~2049 | TBD |
| 2035 | 30% |
| 2050 | 70% * |
| di | Value |
|---|---|
| d1 | 0.84 |
| d2 | 0.94 |
| d3 | 1.07 |
| d4 | 1.19 |
| EEXIrefererence | Formula |
|---|---|
| Container Ship | 174.22 DWT−0.201 |
| Capacity | X% |
|---|---|
| 10,000 < DWT < 15,000 | 0~20 (10) |
| 15,000 < DWT < 40,000 | 20 |
| 40,000 < DWT < 80,000 | 30 |
| 80,000 < DWT < 120,000 | 35 |
| 120,000 < DWT < 200,000 | 45 |
| DWT > 200,000 | 50 |
| Vessel | CII at 2023 | 2027 | 2035 | 2050 | Without JITA | With JITA |
|---|---|---|---|---|---|---|
| V1 | 6.9 | 6.2 | 4.8 | 3.4 | 14.8 | 11.4 |
| V2 | 6.8 | 6.2 | 4.8 | 3.4 | 12.4 | 1.8 |
| V3 | 10.0 | 9.1 | 7.0 | 5.0 | 17.0 | 7.8 |
| V4 | 8.6 | 7.8 | 6.0 | 4.3 | 17.2 | 10.0 |
| V5 | 35.9 | 32.7 | 25.2 | 18.0 | 38.2 | 2.0 |
| Vessel | CII at 2023 | 2027 | 2035 | 2050 | Without JITA | With JITA |
|---|---|---|---|---|---|---|
| V6 * | 11.5 | 10.5 | 8.1 | 5.8 | 11.4 | 10.5 |
| V7 | 14.4 | 13.1 | 10.1 | 7.2 | 16.3 | 14.7 |
| V8 | 18.7 | 17.1 | 13.1 | 9.4 | 16.2 | 6.9 |
| V9 | 6.0 | 5.5 | 4.2 | 3.0 | 13.1 | 6.3 |
| V10 | 14.4 | 13.1 | 10.1 | 7.2 | 16.3 | 2.1 |
| Vessel | CII at 2023 | 2027 | 2035 | 2050 | w/o JITA CII | JITA CII |
|---|---|---|---|---|---|---|
| V11 | 6.5 | 5.9 | 4.5 | 3.2 | 13.5 | 12.4 |
| V12 | 7.0 | 6.3 | 4.9 | 3.5 | 12.3 | 8.6 |
| V13 | 5.8 | 5.3 | 4.1 | 2.9 | 7.6 | 6.4 |
| V14 | 6.2 | 5.6 | 4.3 | 3.1 | 5.8 | 0.5 |
| V15 | 6.7 | 6.1 | 4.7 | 3.3 | 11.4 | 1.0 |
Disclaimer/Publisher’s Note: The statements, opinions and data contained in all publications are solely those of the individual author(s) and contributor(s) and not of MDPI and/or the editor(s). MDPI and/or the editor(s) disclaim responsibility for any injury to people or property resulting from any ideas, methods, instructions or products referred to in the content. |
© 2023 by the authors. Licensee MDPI, Basel, Switzerland. This article is an open access article distributed under the terms and conditions of the Creative Commons Attribution (CC BY) license (https://creativecommons.org/licenses/by/4.0/).
Share and Cite
Kim, S.-W.; Eom, J.-O. Ship Carbon Intensity Indicator Assessment via Just-in-Time Arrival Algorithm Based on Real-Time Data: Case Study of Pusan New International Port. Sustainability 2023, 15, 13875. https://doi.org/10.3390/su151813875
Kim S-W, Eom J-O. Ship Carbon Intensity Indicator Assessment via Just-in-Time Arrival Algorithm Based on Real-Time Data: Case Study of Pusan New International Port. Sustainability. 2023; 15(18):13875. https://doi.org/10.3390/su151813875
Chicago/Turabian StyleKim, Se-Won, and Jeong-On Eom. 2023. "Ship Carbon Intensity Indicator Assessment via Just-in-Time Arrival Algorithm Based on Real-Time Data: Case Study of Pusan New International Port" Sustainability 15, no. 18: 13875. https://doi.org/10.3390/su151813875
APA StyleKim, S.-W., & Eom, J.-O. (2023). Ship Carbon Intensity Indicator Assessment via Just-in-Time Arrival Algorithm Based on Real-Time Data: Case Study of Pusan New International Port. Sustainability, 15(18), 13875. https://doi.org/10.3390/su151813875