1. Introduction
With the establishment of the dual carbon goal, energy development has taken on increasingly greater importance as the lifeblood of the economy. However, the energy system is currently supported by fossil fuels, rendering it unsuitable for the country’s development needs in terms of carbon intensity. From the perspective of economics, electricity is a public good. It possesses the characteristics of being nonexclusive and noncompetitive. One of the important problems to be solved in the economics of public goods is how to use limited resources to meet the needs of human society. Regarding power production, if the limited supply of coal, a nonrenewable resource, is not adequate to meet the needs of human society in the future, we must seek other resources to supplement and replace coal, e.g., wind energy, photovoltaic, and other renewable resources, in order to solve this problem. As such, transformation of the energy structure has become imperative. The development of renewable energy has become a primary target in achieving carbon peaking and carbon neutrality goals [
1]. The “14th Five-Year Plan” clarifies the pathways toward and policies supporting China’s renewable energy development [
2]. Multiple departments in China jointly issued the “14th Five Year Plan for Renewable Energy Development” to further promote the development of renewable energy in China [
3]. The plan actively promotes the development of a clean, low-carbon, modern energy system as the next step in market construction. Renewable energy in China has developed considerably to date and the total amount of consumption has increased. However, wind energy, light energy, and other new energy sources have a certain degree of randomness and volatility [
4]; the overall energy absorption rate needs to be improved. Problems with abandoning light and wind resources entirely are becoming more and more significant and have attracted the attention of the state and various segments of society [
5]. Further improving the electricity market, promoting the consumption of renewable energy, and reducing costs will be important factors for future development [
6].
There has been a significant development of renewable energy over the past two decades. Renewable energy power generation technology has gradually matured and become an important resource. The scale of renewable energy has continuously expanded while prices have decreased. China has formulated many policies to support this growth. These policies have shifted from industrial support to promoting market absorption. According to data from the National Energy Administration, China had an installed capacity of 1213 million kW for renewable energy power generation by the end of 2022, accounting for approximately 47.3% of the total installed power generation capacity. The installed capacity of renewable energy power generation reached 2.7 trillion kwh, accounting for 31.6% of the total power generation capacity. These statistics highlight the increasingly prominent role that renewable sources play in clean energy substitution.
In addition, the cost advantage of renewable energy power generation has grown increasingly prominent. Since 2010, the costs of solar photovoltaic (PV) power generation, concentrated solar thermal power generation (CSP), onshore wind power generation, and offshore wind power generation have decreased by 82%, 47%, 39%, and 29%, respectively. In 2019, of all large-scale, renewable energy power generation capacity available, 56% of the power generation costs were lower than the cheapest fossil fuel [
7]. In 2020, China proposed the goal of “achieving a peak in carbon dioxide emissions by 2030 and achieving carbon neutrality by 2060” [
8].
Reducing the consumption of fossil fuels and promoting the use of renewable energy is a key direction in the development of the electric power industry. The proportion of renewable energy in power generation will continue to rise, and ensuring its efficient use will be a significant topic in the development of the electricity market and power grid. With the increasing share of renewable energy in the electricity market, establishing a market trading mechanism that involves large-scale renewable energy is necessary to accelerate its integration into the marketization process [
9]. However, the challenges of addressing the uncertainty of renewable energy output and improving energy efficiency persist [
10,
11].
The trading mechanism is a prerequisite for ensuring normal electricity trading and market operations. Research on the trading mechanism of the electricity market with the participation of renewable energy has already begun [
12]. Tan Jun, Zhang Shitong, Liu Guangyi, etc. [
13], proposed a carbon intensity marginal electricity price model to quantify the impact of the carbon market on the electricity market and, based on this, proposed an operational system for the electric carbon coupling market and a model architecture for electric vehicles participating in the diversified electric carbon market. In regions with relatively mature renewable energy development, such as Northern Europe and the United States, day-ahead spot market trading or a combination of green certificates and renewable energy are commonly used [
14,
15]. The main purposes of studying these mechanisms for renewable energy participation in the trading market are to achieve the maximum consumption of renewable energy, while ensuring economic and environmental benefits, as well as to mitigate the negative impact of renewable energy instability.
Regarding the research on renewable energy participation in market clearing decisions and optimization models, Zhang Yuzhuo and others [
16] used China’s wind power industry as an example to establish a long-term development model for the renewable energy power generation industry based on feed-in tariffs and a renewable energy quota system. Cheng Lihong [
17] constructed a pricing model for quota entities to participate in the green certificate market, then offered suggestions for quota entities to participate in green certificate trading decision making. Zhang Xuejun and Jing Jiangfan, considering the generation certainty of large-scale grid connection of wind power, built an optimization model of day ahead power market clearing including wind power, aiming at low power purchase cost, high power supply reliability, and large wind power consumption [
18].
Jiang Yuewen and Chen Meisen [
19] used interval models to describe the uncertainty of renewable energy output and electricity prices, then established a day-ahead market clearing model with the goal of minimizing the cost of electricity purchases in the day-ahead and real-time markets. Their model can be used to determine the optimal clearing result in the day-ahead power market but does not consider the uncertainty of load output. In order to promote the absorption of wind power and enable wind power generators to obtain the highest possible profits, Han Zhaoyang, Zhou Lin, Liu Shuo, etc. [
20], have established a double-layer planning model of wind power declaration and market clearing in the integrated energy system market. The model has optimized and improved the market mechanism and introduced carbon trading to promote emission reduction. Du Shuai and Feng Yufan [
21] have designed a spot market trading mechanism suitable for the participation of new energy power generation companies and established a bilateral clearing model for spot market transactions that proposes risk avoidance.
Further, Zhou Ming and others [
22] established a joint clearing optimization model for the day-ahead market and the reserve market, taking into account the participation of renewable energy sources based on consideration of medium and long-term transactions. Wang Zhicheng, Wang Xiuli, et al. [
23] proposed a joint clearing model for wind power participation, which uses multi-scenario technology to describe the uncertainty of wind power output and solves the model based on scenario sets to achieve clearing results. Wang G, Zhang Q, Li Y, et al. [
24] took the minimum total cost of power generation and cross-regional transmission as an objective function to allocate consumption indicators in various provinces of China in an economically feasible and fair manner.
Previous studies on the power market transaction model focused on a single power market, which could not adapt to the reality of the increasing scale of interprovincial transmission, and the market clearing model is the future research trend [
25,
26]. In addition, the continuous expansion of the proportion of new energy and the continuous emergence of new market players have brought great challenges to the current trading mechanism, and the establishment of a variety of product portfolio clearing models can fully stimulate market vitality [
27].
In the conventional electricity market and cooperative cross-regional electricity market, daily clearing processes help market participants better formulate power generation plans. A larger electricity market can also alter the short-term supply and demand relationship to determine the true value of electricity commodities. To address the instability of renewable energy power generation, building a renewable energy trading platform between provinces is an important way to promote renewable energy consumption. With the current level of developed grid structures and connectivity, mid- and long-term transactions, as well as incremental spot transactions of renewable energy power across provinces and regions, have reduced the waste of wind and solar energy in areas where renewable energy power consumption is insufficient. This approach has also improved the overall consumption of renewable energy power in a market-oriented manner.
In order to ensure the effective consumption of renewable energy power, China has formulated a renewable energy power consumption guarantee mechanism that restricts the minimum proportion of renewable energy power to be consumed in each province. In provinces with abundant renewable energy power supply, achieving the required proportion of renewable energy consumption is relatively easy, and there may still be some surplus power. However, in southeast coastal areas where the demand for electricity is high, the supply of renewable energy power may be insufficient, leading to situations where the required proportion cannot be satisfied. In such cases, purchasing renewable energy power or green certificates from other regions can help achieve the optimal allocation of energy resources and improve the efficiency of renewable energy utilization. The implementation of the renewable energy quota system and the green certificate trading mechanism reflects the economic value of environmental resources and helps solve the problem of environmental pollution with economic laws, which not only guarantees the short-term economic interests of the power industry but also realizes the long-term goal of protecting the environment and realizes the sustainable development required by environmental economics.
It is of great significance to study the liquidation mode of renewable energy power generation enterprises participating in the electricity market. This paper puts forward a two-tier decision-making model of renewable energy generators as interprovincial electricity purchasers and constructs a two-tier decision-making model of intraprovincial and interprovincial markets in combination with the market transaction mode of interprovincial consumption of renewable energy electricity to complete the consumption responsibility weight. The proposed model promotes the further consumption of renewable energy between regions and embodies ecological value on the basis of ensuring economic benefits. Furthermore, in current studies, little consideration has been given to the practicalities of split pricing which, despite its impact on electricity sales, is often seen as a uniform value. A uniform price can neither accurately reflect the actual situation nor conform to the scientific nature of the study. Therefore, in this paper, the development of a power market clearing model considering split pricing can fill an important gap.
The parts of this paper are arranged in the following manner: the first part is an introduction, introducing the current situation of electricity market trading, focusing on the ways that renewable energy participates in the electricity market, and proposing how to solve the problem of the electricity market liquidation model under the condition of taking into account the split price. The second part concerns the market structure and related assumptions of the renewable energy consumption guarantee mechanism, the construction of the two-level decision model of the intraprovincial market. In this part, the coupling relationship of the two levels of the market is abstracted into a mathematical model. The third part is the simulation example of the market clearing model. The data set is built according to the actual situation, and the model is used for simulation. The fourth part is related discussion. The fifth part is the conclusion. The flowchart is shown in
Figure 1 below:
2. Materials and Methods
2.1. Market Framework
The development of China’s regional power market has gradually realized “two-level operation” after the new power reform, and remarkable progress has been made in the construction of the power market system, gradually realizing the optimal allocation and sharing of power resources across the country. At the end of 2022, the National Development and Reform Commission issued the Guiding Opinions on Accelerating the Construction of a National Unified Electricity Market System, which clearly pointed out that by 2035, China will initially establish a national unified electricity market system and complete the initial reform of the electricity market.
As the most widely used renewable energy incentive policies, the renewable energy quota system and green certificate trading mechanism have been duly implemented in many European and American countries. These policies have had a certain impact on the traditional electricity market. From the perspective of market entities, “green certificate trading + renewable energy quota system assessment” [
28] will significantly affect investment, operations, trading, and other behaviors [
29,
30]. The implementation of a quota system can effectively improve the energy structure and promote the development of renewable energy.
On 10 May 2019, the National Development and Reform Commission and the National Energy Administration jointly issued the “Notice on Establishing and Improving the Renewable Energy Electricity Consumption Guarantee Mechanism” [
31], which set clear requirements for renewable energy electricity consumption among participants in the electricity market. This issuance marked the official implementation of the consumption guarantee mechanism with the weight of consumption responsibility as its core. As an important guarantee for energy transformation, the mechanism is guided and supported by the government’s mandatory regulations on the proportion of renewable energy in the market share of demand-side entities through laws and regulations [
32].
The United States was the first country to implement such a quota system, followed by other developed countries such as Australia, the United Kingdom, and Japan. Scholars have explored the benefits of the green certificate market [
33] and constructed a multi-objective scheduling optimization model that includes economic and environmental aspects, where combining a renewable energy quota system with green certification can effectively reduce the wind abandonment rate while ensuring the safety of the power system [
34]. Compared to the fixed price model, the market-oriented trading of green certificates can effectively increase the consumption of renewable energy electricity and the trading volume of the green certificate market without significantly increasing the cost of the responsible entity under a renewable energy quota system [
35].
Green certificate trading serves as a supplementary completion method to fulfill the renewable energy power consumption weight, facilitating the flow of quota indicators and improving the consumption responsibility completion rate [
36]. Therefore, the market mainly encompasses intraprovincial, interprovincial, electric energy, and green certificate segments. As a result, the proposed electricity market clearing model pertains to the intraprovincial spot market, inter- or cross-regional spot market, and green certificate trading market. The day-ahead market is the primary market; the intraday market can supplement and modify the day-ahead market.
The spot market within the framework discussed here only includes the day-ahead market segment. Renewable energy in the intraprovincial and interprovincial markets involved in our model can be coordinated to expand the scope of renewable resource consumption and effectively allocate resources over a wide range. The weight of consumption responsibility is restricted, so the green certificate market is regarded as one link in the market optimization process. The various entities involved in the market clearing process include consumer-side consumption responsibility entities, renewable energy power producers, conventional energy power producers, national level trading centers, provincial level trading centers, and others.
Various participants in the provincial electricity market report their respective renewable energy demand to interprovincial renewable energy power producers. Interprovincial renewable energy traders report their renewable energy power purchase demand to the national electricity trading center based on the provincial renewable energy forecast. The national power trading center sends provincial renewable energy units to produce electricity to meet the interprovincial renewable energy demand as declared. A scheduling plan for the liaison line forms after the transaction is cleared, which serves as the clearing boundary for the provincial power market. In a bilevel system, participants in the provincial electricity market can complete renewable energy consumption assessments through renewable energy power trading within the province, green-card trading within the province, and purchasing green certificates from the green-card trading market.
2.2. Market Assumptions
The market clearing model presented in this paper is an enhanced optimization of the traditional clearing model. In addition to split price constraints, it takes into account essential security elements such as conventional power balance constraints, per-unit generation capacity constraints, and ramping constraints. The clearing quantity of each generator unit is determined through the utilization of the clearing model. The primary objective of market clearing is to minimize the overall market cost by effectively allocating responsibility weights for renewable energy consumption.
Interprovincial cooperation in renewable energy has created a multi-market environment where renewable energy power, as a commodity traded across provinces, has gained significant market competitiveness. For regions with insufficient renewable energy power production and consumption within the province, renewable energy power producers can participate in the interprovincial renewable energy trading market and act as intermediaries in the trade of renewable energy power. In a bilevel electricity market, which is coupled within and between provinces, renewable energy producers can engage in electricity and green certificate transactions by participating in the provincial electricity trading and green certificate markets; they can purchase renewable energy power from outside the province (i.e., play roles as interprovincial renewable energy purchasers). The intraprovincial and interprovincial renewable energy transactions are sequential: they are not conducted simultaneously.
In order to maximize local renewable energy power consumption, we assume here that renewable energy power within the province is given priority for consumption. Once intraprovincial transactions are fulfilled, renewable energy producers may consider participating in trans-provincial and trans-regional transactions as intermediaries and purchase renewable energy power from outside the province to fulfill the consumption responsibility weight when their own power generation capacity is insufficient. Accordingly, renewable energy power producers negotiate with the subject responsible for consumption and act as interprovincial power purchasers to buy renewable energy for entities in other provinces.
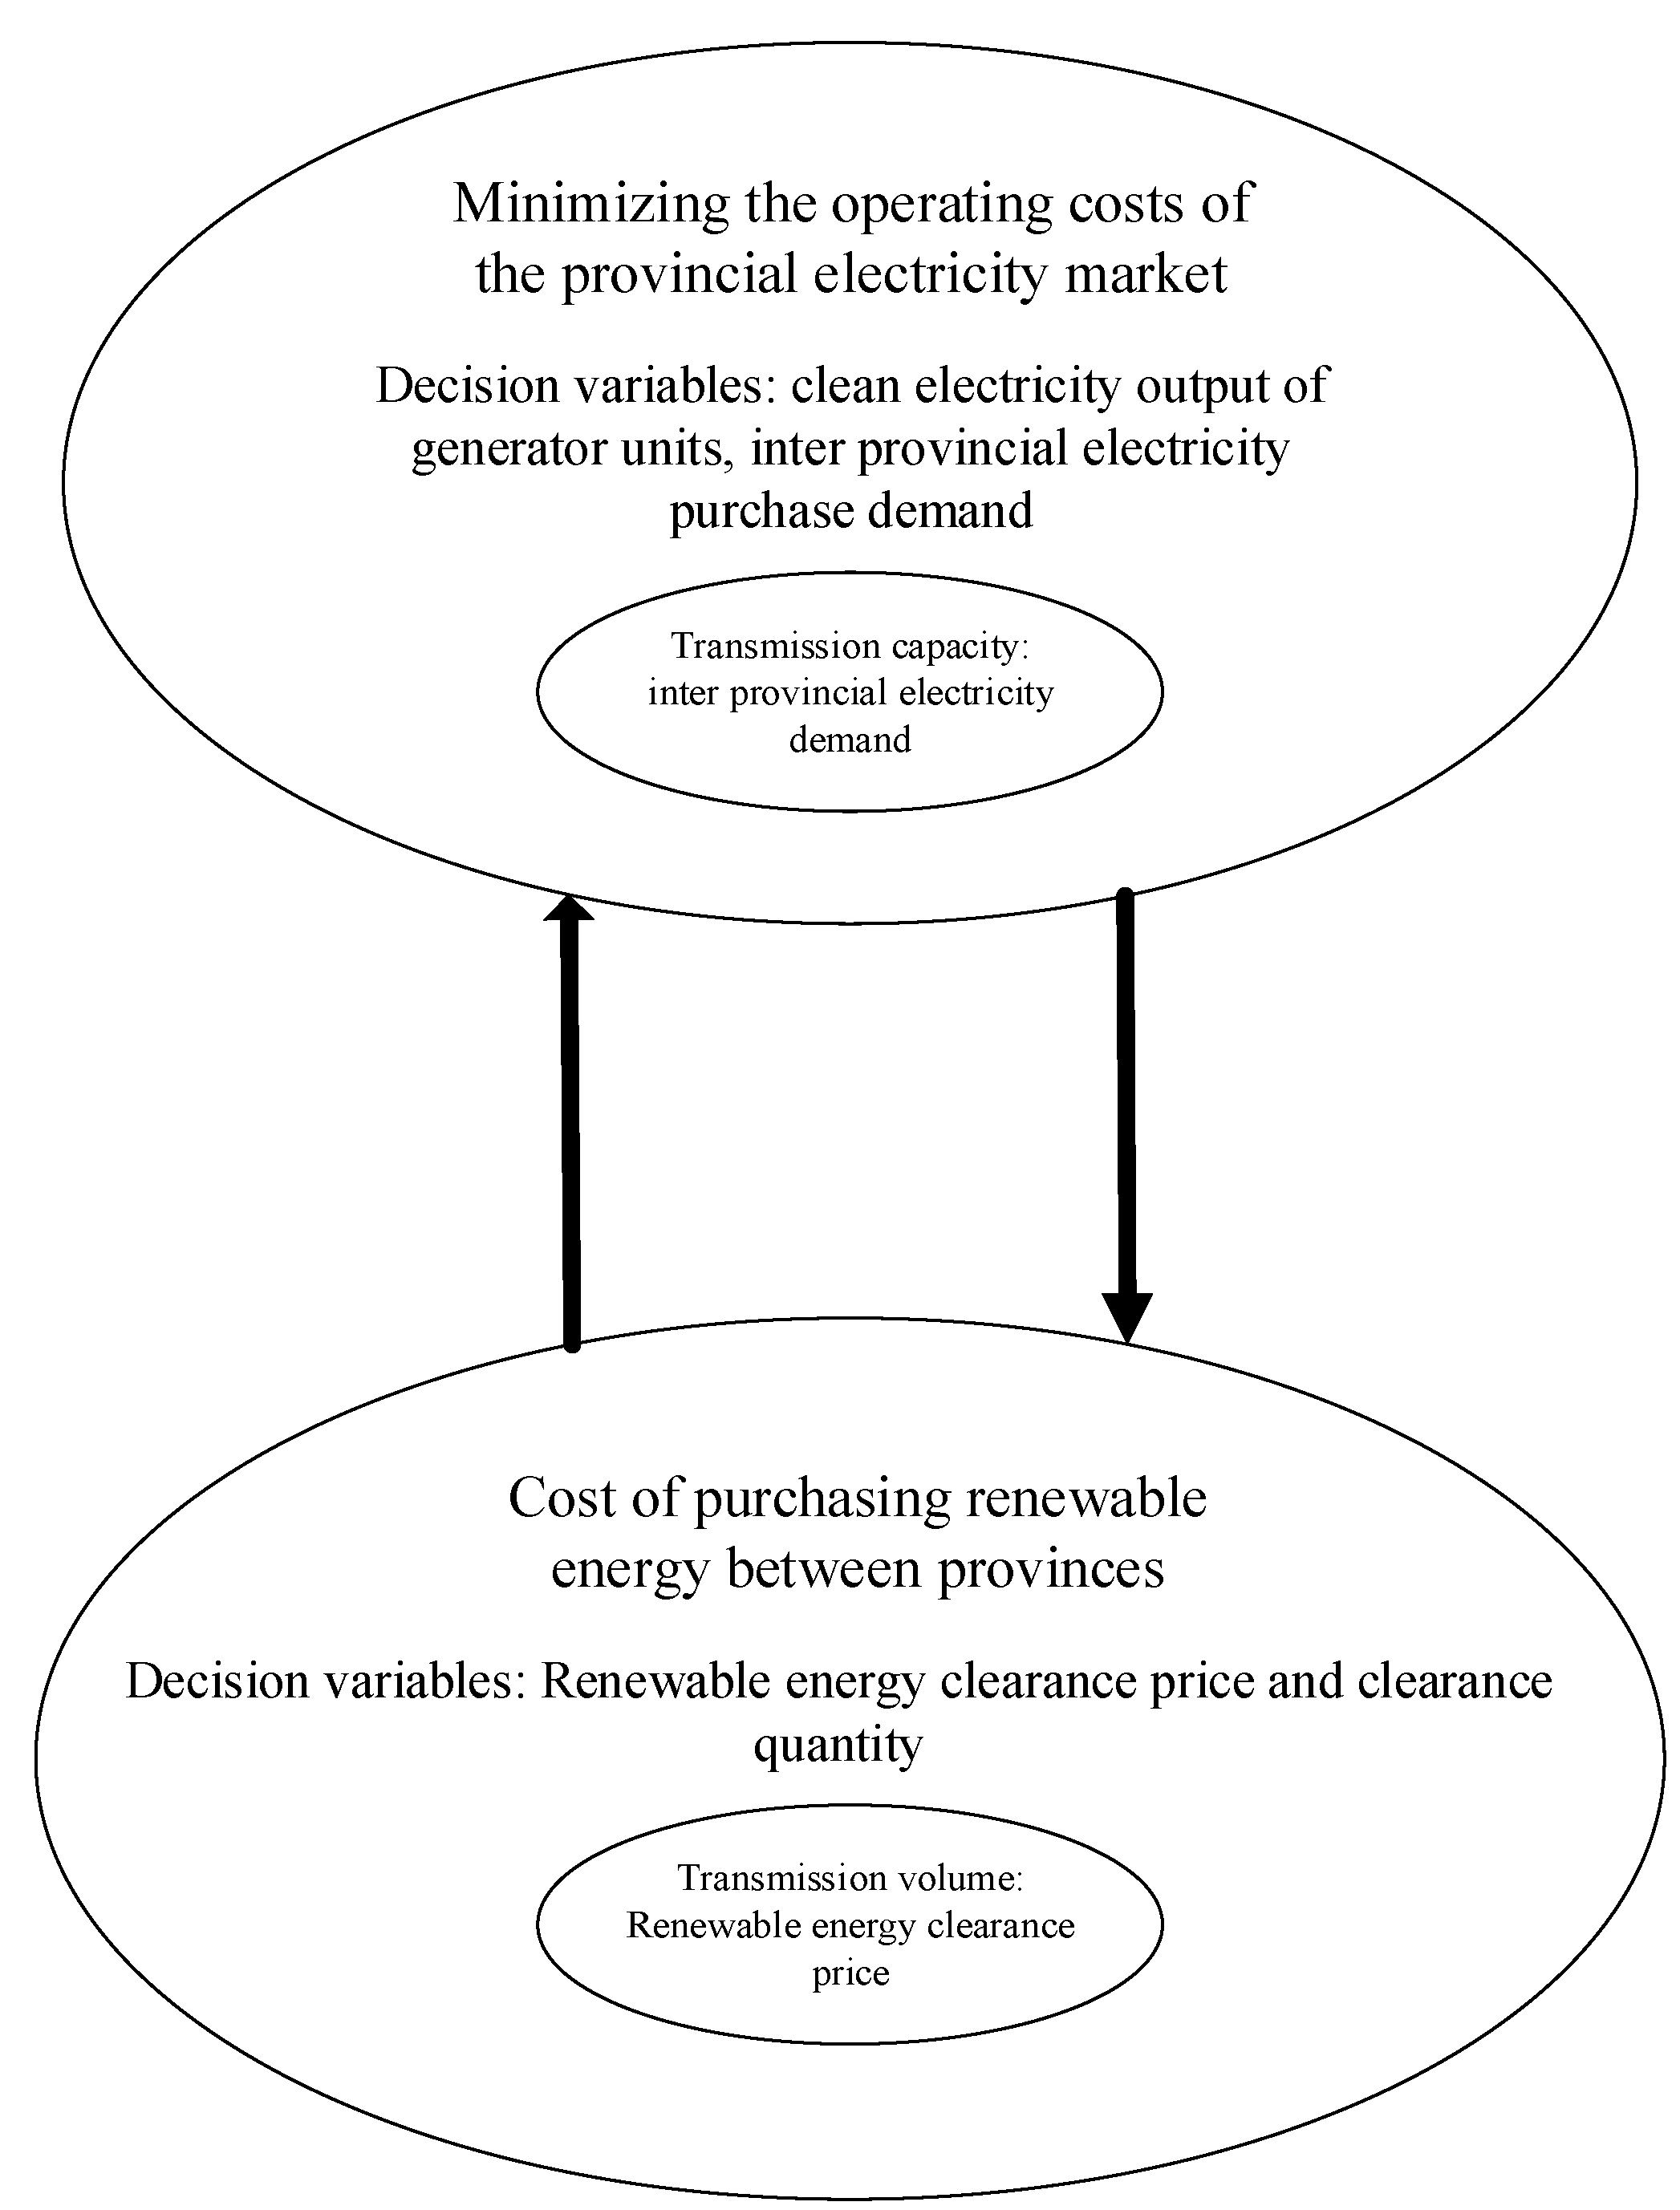
2.3. Bilevel Model Construction
By establishing a two-level decision-making model of intraprovincial and interprovincial markets, the coupling relationship between the two levels of markets is abstracted into a mathematical model. Under the weight of absorption responsibility, the multi-market decision-making problem can be reflected by the two-tier decision-making model. In the upper optimization model, it is reflected as the quotation decision-making problem of participating in the provincial electricity market as a power producer, and in the lower optimization model, it is reflected as the cross-province electricity purchasing decision problem as an interprovincial electricity purchasing supplier. The optimization results of the upper and lower models are iterated, and, finally, the optimal power purchase decision and the provincial market clearing power of renewable power generators are formed.
2.3.1. Upper-Layer Construction
The upper provincial market optimization model adopts a unilateral bidding model on the power generation side. The power generation costs of wind turbines and conventional units, the cost corresponding to interprovincial renewable energy demand, and the cost of purchasing additional green certificates are taken into account. The following model is designed to minimize operating costs:
The meanings of each decision variable and constant above are listed in
Table 1.
It is impossible to reach the maximum generating power quickly due to the time necessary for generating units to run from shutdown to full power. Therefore, it is necessary to impose climbing restrictions on wind turbine generator units and conventional energy generator units: the generating capacity within this time period cannot excessively increase compared to the generating capacity within the previous time period. The specific upper limit is, generally, the maximum generating capacity multiplied by a reasonable coefficient.
The constraint Equation (2) ensures the balance of power generation and consumption at every moment. The power generation resources supporting this balance include conventional energy as well as intraprovince thermal, wind, PV, and other renewables. The constraint Equation (3) ensures that the reserve services provided by conventional energy power producers in the province meet the requirements of rotating reserves in the power system. The reserve amount is set according to a certain proportion of the load. The constraint Equation (4) ensures that the renewable energy consumption weight of the subject responsible for consumption meets the indicator requirements. Weight satisfaction methods include the consumption of wind power within the province, renewable energy power outside the province, and green certificates with the same effect. The constraint Equation (5) ensures that the output of each wind turbine generator unit is within the predicted generation capacity. The constraint Equation (6) ensures that the output of each unit of a conventional energy power producer is within the range of the power generation capacity. The constraint Equation (7) ensures that the output of each wind turbine generator unit meets the climbing limit. The constraint Equation (8) ensures that each unit of a conventional energy power generator meets the climbing limit.
2.3.2. Lower-Level Construction
After determining the interprovincial power purchase demand through the market clearing of the upper optimization model, the wind power supplier begins to act as the interprovincial agent to purchase renewable energy power from outside the province.
The lower layer is a power purchase optimization model. Under the conditions of meeting grid security constraints (e.g., load balancing and interprovincial transmission constraints), the following model is designed to minimize power purchase costs:
The meanings of each decision variable and constant in the above are listed in
Table 2.
The constraint Equation (10) ensures that the interprovincial renewable energy trading volume is balanced with the interprovincial renewable energy power demand under the influence of transmission line losses. The constraint Equation (11) ensures that the renewable energy power transmitted between provinces is within the capacity range of the interprovincial transmission channel. The constraint Equation (12) ensures that the clean electricity output of renewable energy outside the province is within the transregional transmission capacity range. The constraint Equation (13) ensures that the dual variable corresponding to the equality constraint has the same significance as the clearing price of interprovincial transactions.
The optimization results of the upper and lower levels of the model are iterated in such a cycle, which ultimately forms the optimal power purchase decision and the market clearing electricity quantity of renewable energy power generators in the province. The transitive relation of decision variables between upper and lower levels can be seen in
Figure 2.
2.4. Bilevel Model Derivation and Solution
The bilevel model demonstrates the intricate nature and interconnectedness of multiple markets within the realm of renewable energy consumption responsibility weight. This is evident in the coupling of electricity and green certificates at the upper level as well as the coupling of intraprovincial and interprovincial markets at the lower level. Achieving optimal decision making necessitates the exchange of decision variables between the two levels. However, conventional optimization solvers currently lack the capability to handle bilevel models or iterative solutions. To address this limitation, we employ a simplification technique that leverages duality properties to transform one model into a different set of constraints.
2.4.1. Steps of Model Monolayer
- 2.
The Lagrange function calculates the gradient of variables to form a stability condition:
- 3.
Complementary relaxation conditions:
The stability condition and complementary relaxation condition together constitute the KKT condition of the lower-layer model. This KKT can be used to effectively replace the original lower-layer model. The bilevel model is thus converted into a single-layer model, for which the lower layer serves as a constraint condition. To facilitate the solution, the nonlinear parts of the objective function and constraint conditions were linearized as follows.
- 4.
Nonlinear constraint linearization processing:
The nonlinear complementarity Equations (16)–(19) in the mathematical model take linearization form via the large M method as Equation (20) (not listed here):
- 5.
Linearization of objective function:
In the upper-level problem, a section of the objective function involves multiplication of two decision variables: interprovincial renewable energy purchasing demand and interprovincial clearing price. The objective function can be linearized using strong duality theory.
Under the strong duality theorem, the optimal solution of the lower-level problem is equal to the optimal solution of the lower-level dual problem. Thus, Equation (21) holds:
The upper objective function can be rewritten based on the above as Equation (22):
At this point, the bilevel model is converted to a single-layer model.
Considering the needs of program design, we rewrote Equation (22) to obtain the objective function (23) of the main model:
The meanings of decision variables in the above are listed in
Table 3.
Compared to Equation (22), the last three items of Equation (23) are the same, while in the others, Σ Electricity × The “unit price” type item (total price) is simplified to Si. The calculation of Si is relatively complex, and it is reflected in constraints to simplify the representation of the objective function during program design. Otherwise, the objective function will be very long (although it can be written more succinctly when writing formulas).
Unless otherwise specified, “price” means electricity at a single point in time multiplied by unit price, and “total price” means the sum of prices at each point in time. Both concepts are discussed for a single power source.
2.4.2. Main Model Constraints
Equations (2)–(8), (10)–(13), and (15)–(19) are constraints. Among them, Equations (16)–(19) should be linearized using the large M method (Equation (20)).
- 2.
Time division and price constraints
The meaning of split price is that the unit price of electricity from a single time period and single power source is a simple function, and the total price is the integral of this simple function. Taking wind power companies in the province as an example, their energy cut-off points and corresponding electricity prices are shown in
Table 4.
In
Table 4, the corresponding energy interval for each level of electricity price is [a,b], where a is the amount of electricity on the left side of the electricity price, and b is the amount of electricity on the right side of the electricity price. The value 10,000 represents the upper limit of power. In the case of a large amount of electricity, it is not possible to continuously increase the electricity price. Therefore, an impossible upper limit value for electricity consumption is set for different power sources, and the electricity price is constant in the last period.
When the electricity quantity exceeds the upper and lower limits of a certain section, the difference between the upper and lower limits of the electricity quantity in the section and the electricity price are multiplied and included in the total price of the power source. Taking the 180 Mwh electricity provided by a provincial wind power supplier at a certain time as an example, the single period cost is: . When the power is large, the calculation is relatively complex and should be implemented using a computer.
Next, we discuss transforming the linear term of a piecewise function (simple function) into a mixed integer programming linear term and introducing 0–1 variables to facilitate programming.
Let an n-segment linear function
have
n + 1 points, which are, respectively,
, and introduce
to express x and
as follows:
with the following constraints:
In this model,
is a simple function related to k, abbreviated as
(split price, as shown in
Table 4. In Equation (22),
(collectively referred to as
) corresponds to x,
(collectively referred to as
) corresponds to
, and
is a constant when it comes to purchasing electricity from outside the province; otherwise, it is 0.
The following constraints hold:
where
i is the power source number and other variables are defined as already described above.
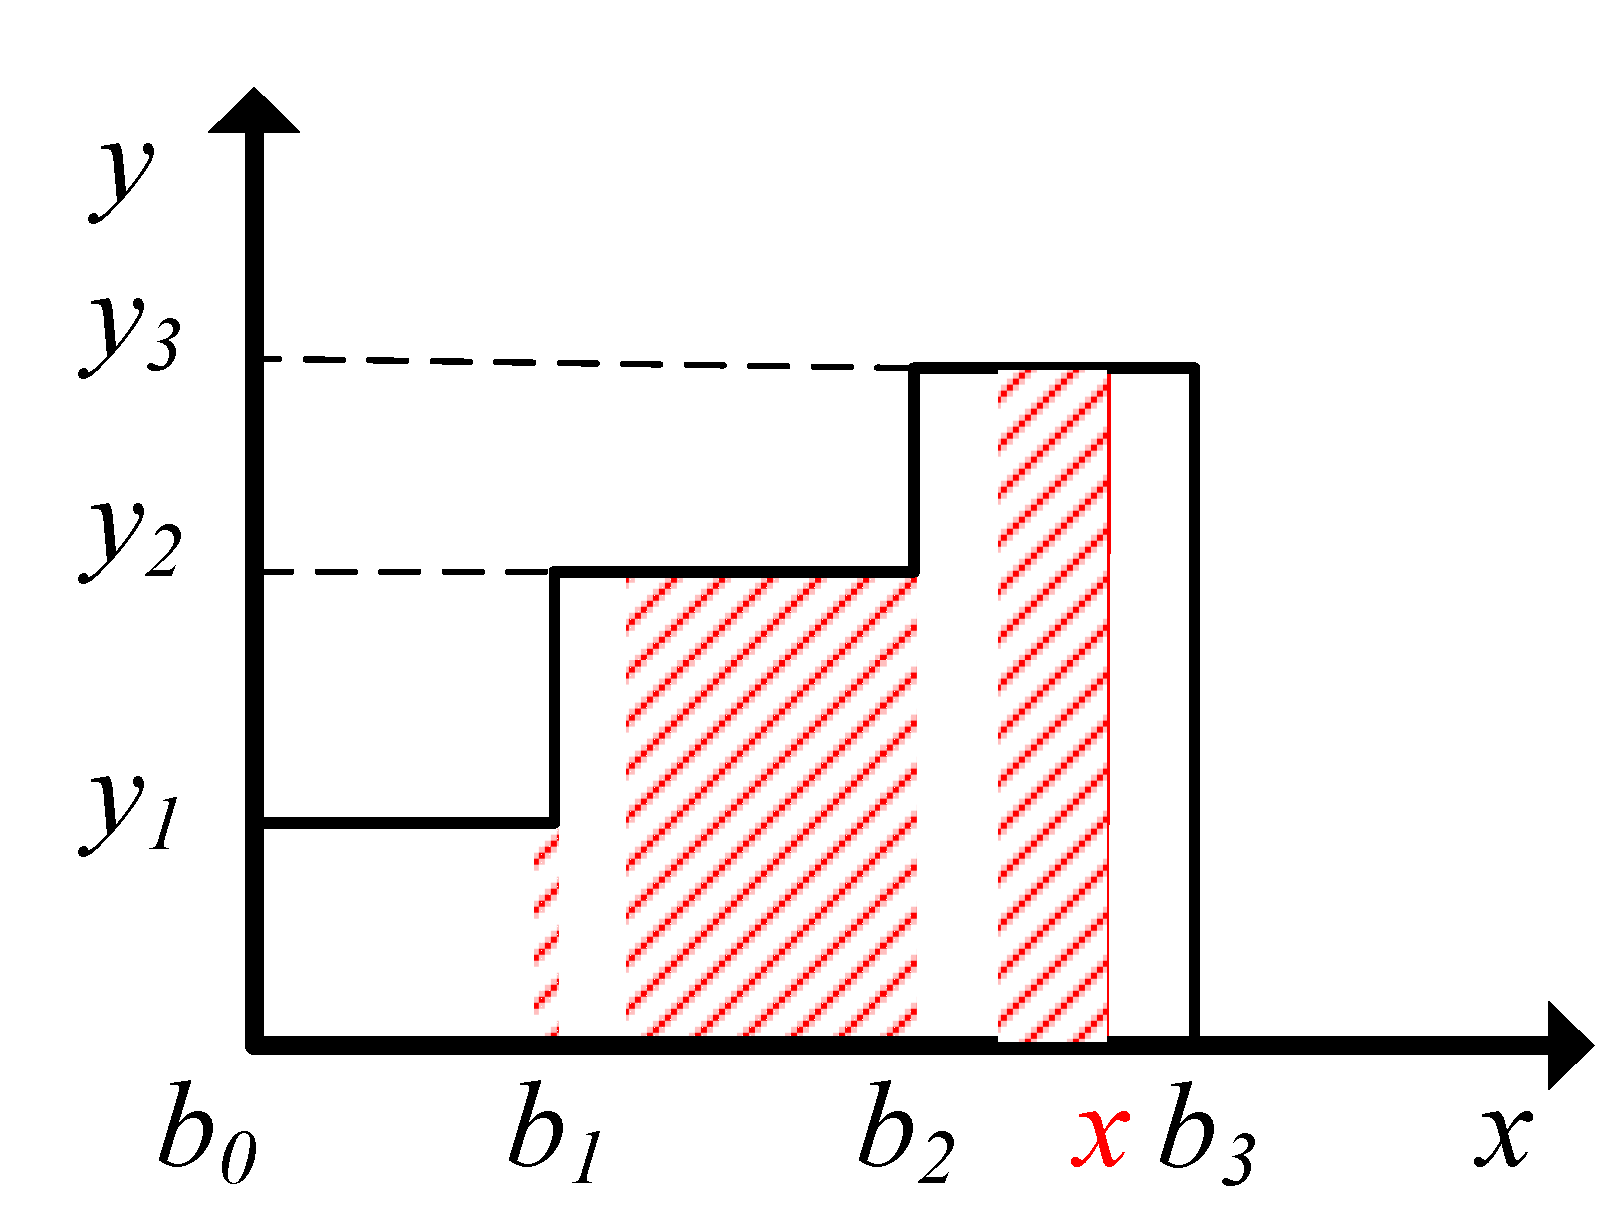
The simple function is shown in
Figure 3, where the red area was calculated using the conventional method (Equation (34)).
Equation (34) can be rewritten as follows:
According to Formula (31), in a single time period, all and only one of the z values of a single power source is 1, which represents the range in which the power is located. Multiplying and summing all z with formulas similar to that in Equation (35) can achieve the calculation of only the area of the red shaded portion (segmented electricity price) in
Figure 3 when the electricity falls within different intervals, as shown in Equation (29). In Equation (30), k is incremented from 2 because the first
b value in
Figure 3 is 0, which can be omitted.
It is important to clarify that the linearization of the objective function within the model only simplifies a portion of it. The fundamental calculation for total price remains “unit price × electricity”, with the unit price determined by the electricity. Consequently, the objective function of the main model is inherently nonlinear. The software combination of MATLAB, YALMIP, and Gurobi can effectively handle such nonlinear programming solutions. The relevant version numbers of the three software are as follows: MATLAB R2021a, YALMIP R20210331, and Gurobi 9.5.1
To sum up, the objective function of the main model is Equation (23), and the constraints are Equations (2)–(8), (10)–(13), (15)–(19), and (29)–(33), wherein Equations (16)–(19) should be linearized according to Formula (20).
4. Discussion
Based on the above analysis, we attempted, in this study, to establish a market clearing model that properly incorporates the split price. Our main contributions can be summarized as follows.
We propose a multi-market clearing decision model for renewable energy power producers, taking into account price segmentation. The imposition of constraints on the power consumption weight of renewable energy guarantees a substantial renewable energy representation within the electricity market, instigating shifts in the market structure. This transition not only secures certain economic advantages for renewable energy power producers but also diminishes the proportion of conventional energy power generation, thereby contributing to environmental protection.
We have formulated a bilevel decision-making model for renewable energy power producers acting as interprovincial power buyers. By integrating the market transaction method of trans-provincial renewable energy power consumption, we allocate the weight of consumption responsibility across both intraprovincial and interprovincial markets. The model acknowledges the interdependence between intraprovincial and interprovincial markets in trans-provincial transactions, iteratively determining the optimal decision through the alternating transfer of variables between its upper and lower levels. Taking the Singapore power grid as a case, Li Yuanzheng, Huang Jingjing et al. (2022) proposed a day-before risk aversion market clearing model considering demand response. This model not only proposed the scenario of renewable energy participatory power market but also further considered the actual situation of the grade electricity price in the simulation experiment. This model is of more reference significance to power market participants [
37]. In order to solve this problem quickly, KKT condition and linearization method are used to transform the two-layer model into a single-stage linear programming model, and KKT condition of the lower model can transform the two-layer model into a single-layer nonlinear model, which is convenient for calculation and solution. Compared with the single-layer model of other studies, the construction of the intraprovincial and interprovincial dual-layer model coupled the two intraprovincial markets, which solved the problem of multi-market clearing decision making better than using only one market.
Through the simulation experiments, the validity of the multi-market liquidation decision model for renewable energy power producers is effectively proved, and the further consumption of renewable energy and the reduction of market operating costs can indeed be realized through intraprovincial and interprovincial markets. In reality, power producers and decision makers can factor in the actual situation of the region and obtain the best results through the model’s operation, helping them to make the best decision to maximize economic and ecological value, avoid resource waste, and reach an economic, social, and ecological win-win situation.
However, in this study, the number of entities participating in the market in the example is limited, and the types and number of power generation entities will certainly be more in practice, which makes the solution of the model more complicated, which is a potential limitation of the research. In addition, when we build the model, we mainly focus on the constraints of consumption responsibility weight on operating costs but do not consider the carbon emission constraints in power generation, and the carbon emission constraints of power producers are also important for the constraints of power production. This neglected aspect provides a promising direction for future research. In addition, the issue of market decision making and income distribution of various market players under different cooperation models is a direction for future in-depth research.
There are some risks for the successful operation of the two-tier market clearing model constructed in this paper. The first is the operation risk of the generator set. Each generator set should be able to operate normally; otherwise, it will affect the entire market supply. The second risk is intraprovincial transaction risk. If there is no infrastructure to support interprovincial electricity trading, it will not be possible to achieve interprovincial electricity trading. Finally, there is the risk of information exchange. If the supply and demand information of electricity between the provinces is not centralized on one platform, poor information between the parties will also lead to the failure of the transaction.
5. Conclusions
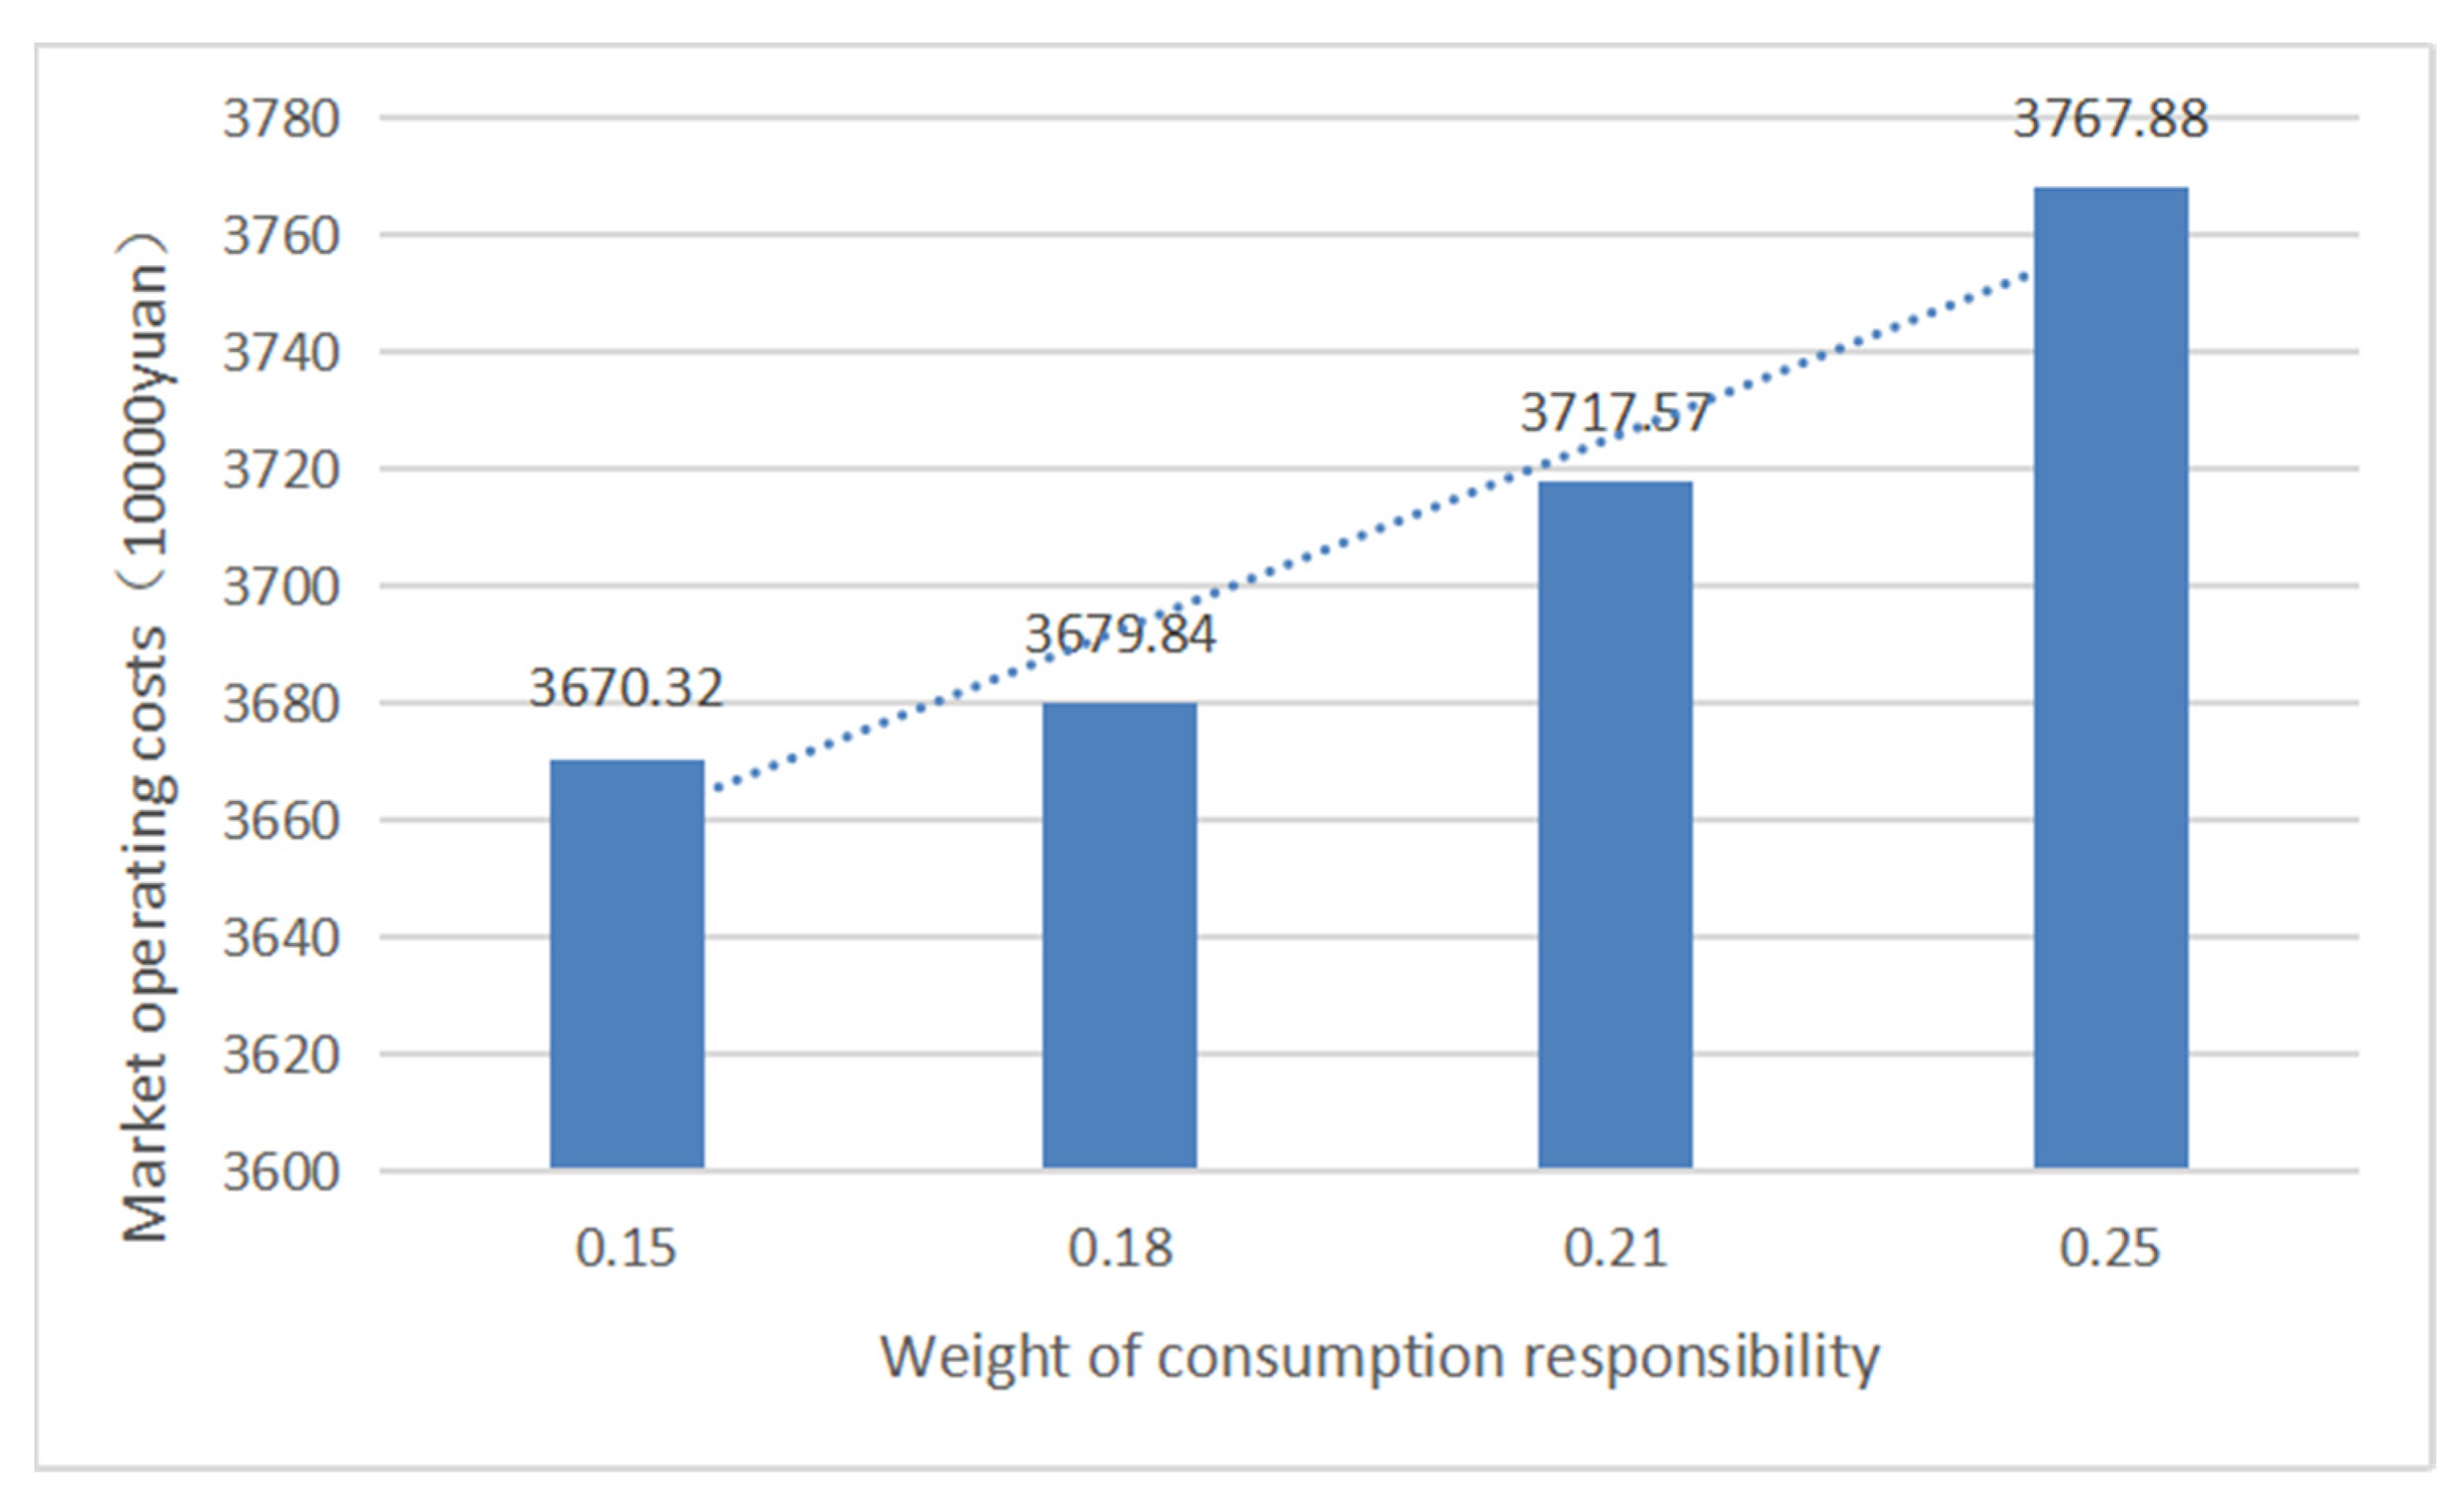
In this study, we constructed a bilevel electricity market clearing model with the participation of renewable energy power producers based on hierarchical price constraints. We explored the impact of different consumption responsibility weights on market participants’ purchase decisions. Under the influence of distinct consumption responsibility weights, each entity within the power market establishes the clearing capacity for various types of power generators, the intraprovincial and interprovincial trading capacities, the transaction status of green certificates, and the market operating costs.
We conducted an example simulation to determine that increasing the weight of consumption responsibility promotes renewable energy consumption in the power market, though it also increases operating costs. However, renewable energy power producers can regain economic benefits through green certificates. At a provincial renewable energy consumption responsibility weight of 15%, green certificates benefit renewable energy power generation. At 18%, interprovincial transactions are needed to absorb 7.21 GWh of renewable energy power from other provinces. A bilevel market clearing model within and outside the province can reduce market costs by CNY 1.5547 million when considering price segmentation.
Through the analysis of the result of the example, it is found that renewable energy generators can participate in the market with different roles in the multi-market environment and form the situation of multi-market decision making. As the green certificate is the supplementary completion method of the absorption responsibility weight assessment, it will promote the green certificate market to mature and stable development. Renewable energy power producers can sell electric energy and use green certificates by participating in the renewable energy power market, obtaining additional green certificate income. To this end, the government should introduce relevant policies to encourage green certificate trading in different regions, help build relevant trading platforms, and promote the further development of the green certificate market.
In addition, renewable energy generators participate in the provincial electricity market, and, at the same time, they participate in the interprovincial electricity market by acting as the provincial consumption responsibility entities. In the multi-market environment of coupling electric energy and green certificates and coupling of intraprovincial and interprovincial transactions, the company obtains electricity income and green certificate income as a power producer and obtains agent income as an interprovincial electricity purchasing business. Through the rational decision making of multiple markets under the weight of consumption responsibility, the company improves its own income level, reduces the operation cost of the provincial market, and realizes the consumption of renewable energy power in a wider range and scale. To this end, the energy management department should issue documents to encourage new energy generators to participate in the market outside the province, increase renewable energy consumption while protecting the province’s energy consumption, and promote economic development.
The simulation conducted in this study accounts for not only the participants in the electricity market but also hierarchical price constraints, resulting in realistic and applicable outcomes. However, the proposed model only considers the constraints of consumption responsibility weight on operating costs, possibly neglecting the influence of carbon emission restrictions on power generation. This is an area for future research.
The bilevel market clearing model proposed in this paper encapsulates the interplay of intraprovincial and interprovincial transactions and the price and ecological attributes of electricity. By solving the bilevel model, the optimal interprovincial renewable energy power purchase can be achieved under the minimum market operating cost in the province. Moreover, by incorporating green certificate transactions, the model reflects the value of renewable energy electricity and ecological benefits. This strategy not only reduces the overall market operating costs and increases the profitability of renewable energy production, but also promotes the further consumption of renewable energy.


