Article

Analysis of Disaster Risk on Expressways for Foreign Tourists to Japan Using Rental Cars: Study Using Central Nippon Expressway Pass

1
Faculty of Transdisciplinary Sciences for Innovation, Institute of Transdisciplinary Sciences for Innovation, Kanazawa University, Kanazawa 920-1192, Japan
2
Toyota Transportation Research Institute, Toyota 471-0024, Japan
*
Author to whom correspondence should be addressed.
Sustainability 2023, 15(18), 13481; https://doi.org/10.3390/su151813481
Submission received: 1 June 2023 / Revised: 18 August 2023 / Accepted: 23 August 2023 / Published: 8 September 2023

Abstract

:
The travel patterns of foreign visitors to Japan are changing from group travel, which was the mainstream to date, to individual travel, and there has been an increase in the number of cars rented by visitors as a means of transportation. The use of rental cars improves access to rural areas and is being promoted as a means of transportation. However, if a natural disaster occurs while driving a rental car, then the individual may face difficulties owing to a lack of local support. Therefore, the traffic volume on the roads used by foreign visitors to Japan during certain periods needs to be estimated in advance as well as the natural disaster risks that exist on those roads. In this study, we utilized CEP data managed by the Central Nippon Expressway Company in Japan to identify the risk of disaster for foreign visitors to Japan who use expressways with rental cars. The CEP data has usage records of foreign visitors to Japan who used rental cars on expressways in the Chubu region of Japan during the period from 1 April 2018 to 31 March 2019. Using this data, we calculated the risk of earthquake and landslide disasters. Result of this analysis, it is clear that the risk of earthquake disasters is high on expressways in the Tokai region, and the risk of landslide disasters is high on expressways in mountainous areas.

1. Introduction

1.1. Background

The number of foreign tourists to Japan has sharply decreased with the spread of the novel coronavirus infection (COVID-19). In 2019, the number of tourists reached a record high of approximately 31.88 million, however after the global COVID-19 pandemic, this number fell to approximately 4.12 million in 2020 [1]. The number of visitors to Japan is currently increasing again due to the relaxation of border controls, and it has been reported that the number of tourists has recovered to approximately 40% of the number before the outbreak of the COVID-19 pandemic [2]. Therefore, when considering future demand for travel in Japan, it is important to accumulate knowledge about the activities of foreign tourists.
The travel patterns of foreign tourists to Japan have changed greatly from group travel, which has been the mainstream historically, to individual travel [3]. Accompanying this is the change in the patterns of the means of transportation, and there has been an increasing number of foreign tourists to Japan who rent cars for sightseeing. Sightseeing behavior using rental cars improves access to rural areas other than major domestic tourist destinations such as Tokyo, Osaka, and Kyoto. In December 2019, the Japan Tourist Agency [4] formed a study group to promote the use of rental cars by foreign tourists visiting Japan with the aim of determining the direction of regional development, and active utilization has been recommended.
The use of rental cars by foreign visitors has the important advantage of expanding tourism to rural areas, however, this can give rise to other issues such as:
  • Traffic safety issues including traffic violations and traffic accidents caused by ignorance of local traffic laws;
  • Language issues that make it difficult to understand interchange (IC) road signs.
In response to such issues, the above-mentioned “Study Group for Promoting the Use of Rental Cars by Foreign Tourists Visiting Japan” has been studying solutions. Nevertheless, it is believed that while these issues may occur during normal times, there are others that can occur during natural disasters. Sightseeing using a rental car is generally an individual trip, therefore, if a natural disaster occurs while driving a rental car, then the driver and their passengers may face difficulties because there is no local support.
To the best of our knowledge, there have not been any studies on a support system for foreign tourists in the event of a natural disaster occurring while renting a car. Additionally, there has been no organization of information such as determining the records of expressway usage by foreign tourists using rental cars and the estimation of the risks of natural disasters occurring, which are needed for studying such aspects.

1.2. Purpose and Method of This Study

Based on these problems, in this study, we target expressways that are likely to be used frequently by foreign tourists using rental cars for sightseeing, and we estimate the earthquake and landslide disaster risks based on the records of expressway usage by foreign tourists to Japan. In this analysis, the k-means method, which is a non-hierarchical cluster analysis, is used to extract the characteristics of earthquake and landslide disaster risks on expressways to achieve the purpose.
The procedure for this study is described below.
  • First, it is necessary to determine the record of usage (traffic volume within a certain period) of foreign tourists. This provides an index of the risk of exposure to disasters on highways. In this study, we used the Central Nippon Expressway Pass (CEP) data [5] that were obtained with the cooperation of the Central Nippon Expressway Co., Ltd. (Nagoya, Japan) (NEXCO Central) to calculate the expressway usage by foreign tourists to Japan for each link in the IC section. CEP is the name of an unlimited expressway pass for foreign visitors to Japan that can be used in the Chubu region and is managed by NEXCO Central, and CEP data are where the CEP user information is accumulated. The provided CEP data can be used to determine the IC inflow and outflow for each individual (application ID given at the time of CEP application).
  • Next, the hazard information that exists for each link in the target IC section is determined, and the natural disaster risk for each link is calculated. In this analysis, we consider the two natural disaster types of earthquakes and landslides, which are thought to affect driving due to road damage/blockages on expressways.
  • Finally, a non-hierarchical cluster analysis (k-means) is performed using the actual use of IC section links calculated from the CEP data and the hazard information of earthquake and landslide disasters. From these results, characteristics of the disaster hazard of each highway are extracted.
There have been several studies on foreign tourists to Japan during a natural disaster [6,7,8]. These studies summarize the current situation and issues of providing disaster relief information to foreign tourists. In addition, there has been a study that aims to develop information provision tools for foreign tourists to be used in the event of a disaster [9]. This same study set Kagawa Prefecture as a research target area and investigated the ideal information provision tools that integrate tourism and disaster prevention information for inbound tourists based on interview surveys [9]. Another study was conducted aiming to improve the disaster response for foreign tourists to Japan [10]. A role-playing experience game was developed as a method for a wide range of stakeholders related to foreign tourists to learn the disaster response in a practical manner [10].
To the best of our knowledge, studies referring to foreign tourists to Japan at the time of natural disasters often develop tools and summarize how information should be provided. Meanwhile, when the scope is expanded to include foreign residents as well as tourists, there are also studies that estimate the risks of natural disasters occurring [11,12], such as the present study.
There are several studies that focus on foreign tourists to Japan who use rental cars, with examples [13,14]. A study focusing on the problem of the increasing number of traffic accidents that accompany the increase in the number of rental cars used by foreign tourists to Japan was conducted [13]. Accident data were used to statistically compare the characteristics of traffic accidents involving Japanese nationals, foreigners with Japanese driver’s licenses, and foreigners with other driver’s licenses. In addition, a study was conducted with a similar perspective of the problem [14] and used ETC 2.0 probe data to compare places where sudden braking occurs among residents, Japanese rental car users, and foreign rental car users.
The CEP data that are used in the present study was also used in a previous study [15]. That study also used individual data from the Consumption Trend Survey of Foreign Tourists to Japan [16] and flow data of foreign tourists to Japan [17] to analyze the characteristics and sightseeing patterns of foreign tourists according to nationality.
None of these studies addressed the disaster risks for foreign tourists who were using rental cars. On the other hand, there have been many tourism studies focusing on transportation during normal times, not during disasters. One example is a study that evaluated the environmental impact of automobile tourism on an island [18]. There are also studies that model the tourists visiting Mauritius Island from the viewpoint of transportation infrastructure [19]. Furthermore, there are studies that have conducted impact assessments focusing on CO2 emissions during tourism activities [20]. However, this study differs from these studies in that it examines the risk of disaster during tourism. There was one study that applied the CEP data used in the present study for academic research [15]. However, that study focused on the tourism characteristics and tourism patterns when using a rental car. Therefore, although the same data are being used in the present study, the perspectives of the research are different. There are many studies that estimate risks of natural disasters that include foreign residents, however, few studies have been conducted on the actual use of rental cars by foreign visitors to Japan and the estimation of disaster risk. Therefore, we believe that this study is novel. As mentioned above, the number of foreign tourists to Japan who use rental cars is expected to increase in the future, and it is therefore important that studies that consider different disaster periods in the light of this expectation should be conducted as well. Estimating disaster risks for foreign tourists to Japan who are using rental cars is basic information needed to investigate this important research topic further.

2. Materials and Methods

2.1. CEP Data Overview

In this section, we provide an overview of the CEP data used in the present study and confirm the data structure through basic aggregation.
As mentioned above, this study uses CEP data provided by NEXCO Central, which enables the records of expressway usage by foreign tourists to Japan to be determined. CEP data can be used to grasp the IC history of inflows and outflows focused on foreign visitors to Japan who use rental cars on highways in the Chubu region. This data is managed by the NEXCO Central and is not publicly available in Japan. The authors use this data in academic research with the cooperation of NEXCO Central. Figure 1 shows the analysis range in the present study. The targets are expressway ICs and junctions (JCTs) and links between ICs and JCTs in the area located in the central part of the Japanese archipelago.
Table 1 shows an example of CEP data. CEP is a product that allows unlimited rides within a target area (target expressways in the Chubu region) for 2–14 d, and the item indicating the unlimited ride period can be determined by the application period in Table 1. The “application ID” determines the user who applied for the CEP. It is originally displayed as a 10-digit number, but in Table 1, these have been individually renumbered for the present study. Additionally, the dates and names of the ICs where the tourists flow in and out are each described. The structure is such that one line of data is accumulated when a vehicle enters an IC, travels on the expressway, and exits from another IC. Therefore, there will be multiple rows of data for each user.

2.2. Basic Tabulation Results

Table 2 shows the CEP data period, number of subjects, and number of data records used in the present study. The subjects in the present study are foreign tourists to Japan who applied for the CEP between 1 April 2018 and 31 March 2019. During this one-year period of interest, 8939 foreign tourists to Japan were used in the subsequent analysis, and 72,837 data records (the number of times each user flowed in and out of an IC) were accumulated. The CEP data contains the usage history of foreign visitors to Japan who use rental cars, and no special work is required for data extraction. The data contained missing values in the blank columns, and data that were judged to be unusable were deleted.
First, the nationalities of the subjects (Figure 2) are determined. Of the 8939 subjects, three countries were the source of the most visitors, which were Hong Kong (53.5%), Taiwan (19.2%), and South Korea (10.3%). It is, therefore, clear that most visitors to Japan using rental cars are from Asia. In addition, classified under “Other”, there were visitors from the United States, the United Kingdom, Australia, Canada, and Malaysia, although the numbers were small. These statistics were generally consistent with a previous study [15].
Next, Figure 3 shows the tabulated results for each unlimited expressway ride period (2–14 days) that is registered when applying for the CEP. The most popular choice among the visitors was for the five-day unlimited ride period (18.8%), and almost 75% of tourists prefer no more than a six-day unlimited ride period. Figure 3 shows that there were a small number of people who applied for unlimited rides for periods of 10 days or more (approximately 3.7%). Figure 4 shows the aggregated results of CEP application status by calendar month. It shows a relatively level trend for each month, with February being the most (11.4%), and September the least popular (5.2%). The CEP data with these data structures were used to calculate the actual number of users of expressways.

3. Results

3.1. Expressway Usage

3.1.1. Calculation Method

In this section, information that can be determined from CEP data was used to calculate the actual number of foreign tourists to Japan on links between ICs in expressways. The aim of this study is to calculate the risk of foreign tourists to Japan being affected by a natural disaster for each expressway link. The period and nationality are ignored. Therefore, in this analysis, the only relevant variable is the expressway link between ICs The data is summed to calculate the record of usage by foreign tourists to Japan between each link.
Figure 5 shows the method of calculating records of usage for each link between ICs in this analysis. First, as shown in Table 1, the CEP data includes the inflow and outflow IC names, but it is not possible to determine the ICs through which the tourists have passed. The purpose of this analysis is to calculate the record of usage for each IC. Therefore, we estimated the “passed” IC from the inflow and outflow ICs by searching for the shortest path using Dijkstra’s algorithm [21]. Dijkstra’s method was applied to the inflow and outflow IC information of each user (72,837 data records) that could be determined from the CEP data to calculate the passing ICs. In subsequent analysis in the present study, the 498 links in the IC sections, which are within the range where the CEP is applied, were analyzed.

3.1.2. Record of Expressway Usage

The method described in the previous section was used to calculate and visualize the records of expressway usage of foreign tourists to Japan for each link (Figure 6). Darker link colors indicate a higher record of usage. Figure 6 shows the record of usage of each IC within the jurisdiction of NEXCO Central (CEP range), and expands the areas with high expressway network density in Aichi Prefecture. It can be seen from Figure 6 that foreign tourists to Japan who applied for the CEP from 1 April 2018 to 31 March 2019 tended to use it mainly in Aichi Prefecture. In addition, the tourist route called Shoryudo, which connects Aichi, Gifu, Toyama, and Ishikawa Prefectures to the north and south, has a particularly high record of usage. Table 3 shows the top five ICs that have the highest numbers of records of usage within the target range. The results show that the usage volume is highest from the Shirakawago IC to the Hida Kiyomi IC (12,195 times during the period from 1 April 2018 to 31 March 2019). The next point is Ichinomiya JCT–Ichinomiya IC and Mino IC–Mino Seki JCT, which have many records of usage. These are the ICs near the center of Aichi Prefecture, and they are routes that lead to the Shoryudo. Therefore, measuring the number of tourists who flow in or out of Shoryudo reveals an increase in the records of usage. Furthermore, there are high records of usage for Minami IC–Mino IC, and Gujo Hachiman IC–Minami IC, which are both within the sightseeing route of Shoryudo.

3.2. Disaster Risks on Expressways

3.2.1. Selection of Hazards That Exist between ICs
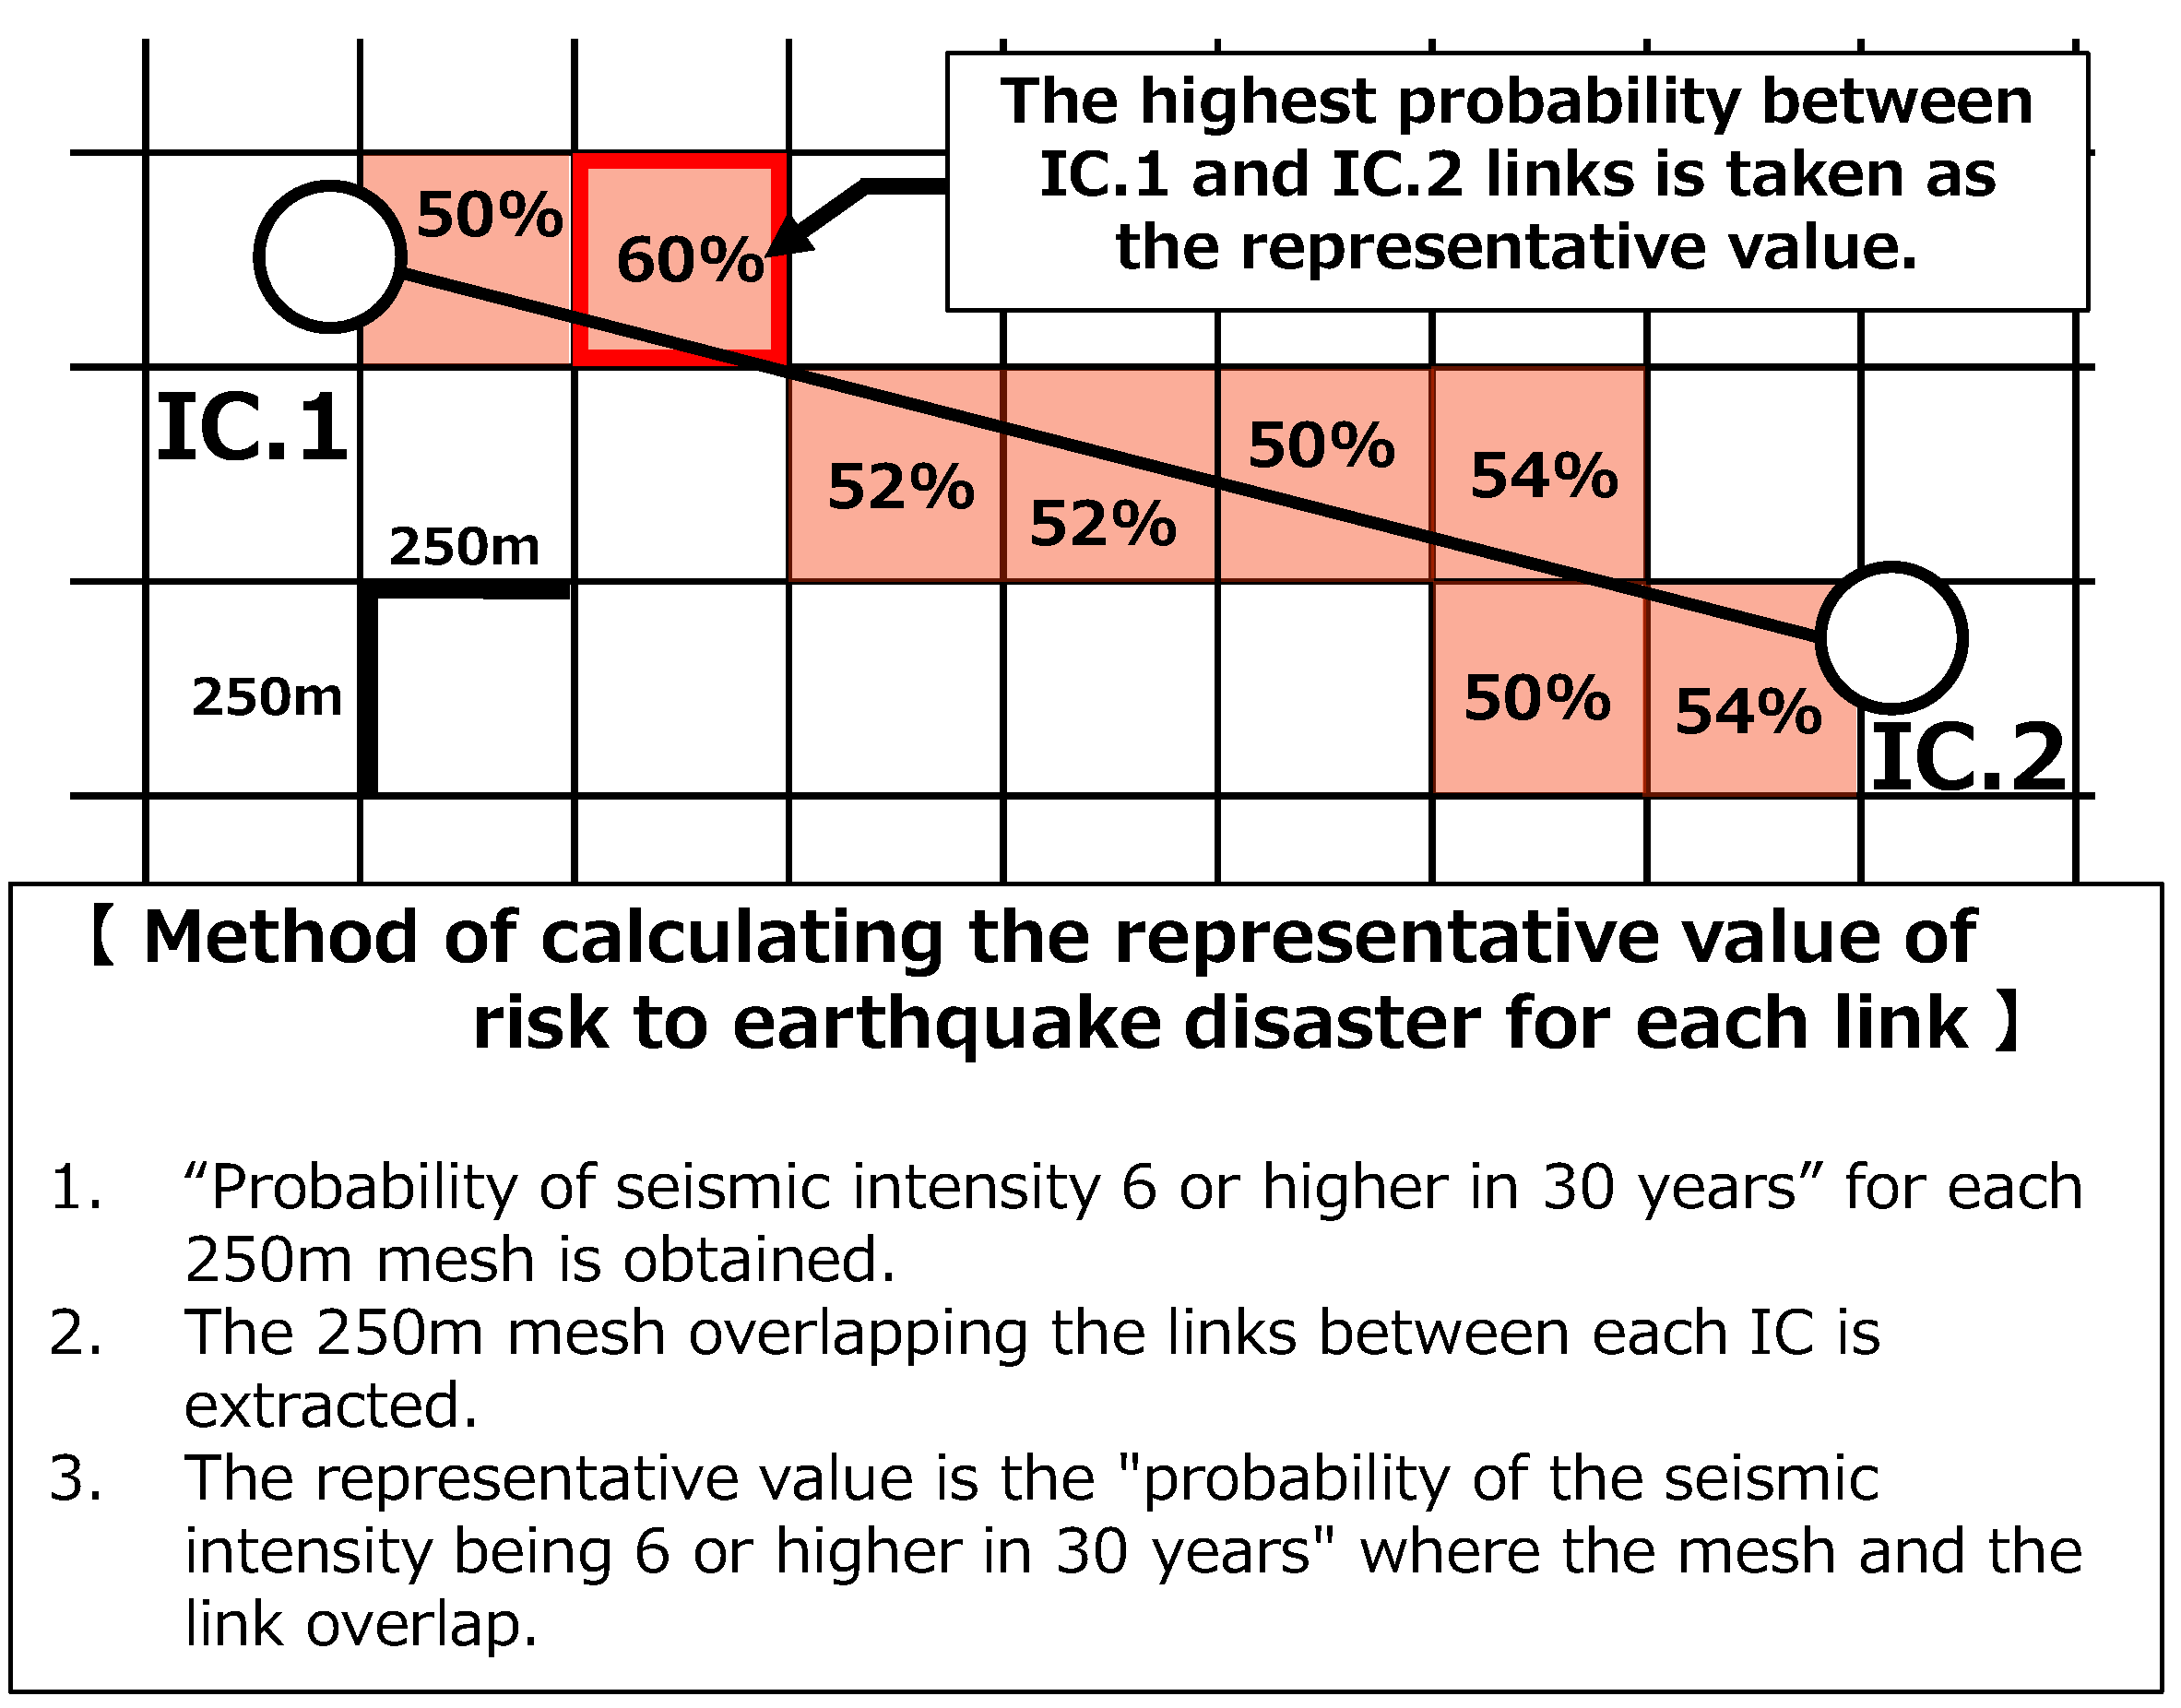
The disaster risk is calculated for the actual number of IC sections used by foreign tourists to Japan that was calculated in the previous section. The target disasters are earthquakes and landslides, which are thought to have a significant impact on expressway traffic. The calculation method of the disaster risk index for each link in the IC section is shown below.

Earthquake Disaster

First, the earthquake disaster risk index is calculated for the expressway network to be analyzed. In the present study, we used data that can be obtained from the Japan Seismic Hazard Information Station (J-SHIS) [22] which is provided by the National Research Institute for Earth Science and Disaster Resilience. In this analysis, we use the “30-year occurrence probability of shaking with seismic intensity of 6 Upper or more” (OP6) in the Probabilistic Seismic Hazard Map as an earthquake disaster risk index. This data is based on a comprehensive calculation of the “30-year occurrence probability of shaking with seismic intensity of 6 Upper or more,” taking into account both active fault-type and subduction-zone earthquakes expected to occur in Japan. In addition, the purpose of this analysis is to calculate the risk of earthquake disasters for each link in each IC section, therefore, a method such as that shown in Figure 7 was conducted to decide the index for each link.
First, the OP6 that could be obtained from J-SHIS is stored in units of a 250-m mesh. The mesh that overlaps with the link of the IC section is extracted, and the mesh with the highest OP6 was used as an earthquake disaster risk index for the link. For example, in Figure 7, the mesh shown in red exists on the link connecting IC.1 to IC.2. Then, the mesh with the highest OP6 (locations with 60% value or more) in each mesh are extracted, and these are used as the index of the risk of earthquake disaster D e q .

Landslide Disaster

Next, the landslide disaster risk index for each link in the IC section is calculated. The data used were the landslide warning area data obtained from the National Land Information Division download site that is managed by the Ministry of Land, Infrastructure, Transport and Tourism [23]. Landslide warning areas are defined by experts based on three-dimensional mapping from aerial photographs and on-site surveys and are a group of data compiled by local governments on places where landslide disasters can occur due to landslides and debris flows on steep slopes. Areas where landslide disasters can occur can be determined in a planar manner (as polygon data). In this analysis, the index for each link is determined by the method shown in Figure 8. The distance between IC.I and IC.II is set to L ; the locations between the links of IC.I and IC.II that overlap with landslide warning area data are set as l ; and the following Equation ( 1 ) is used as an index of the risk D l s for landslide disasters:
Dls = l/L

3.2.2. Visualization of Disaster Risks on Expressways

The method described in the previous section was used to calculate the risk of earthquake and landslide disasters for each link in the IC section of the expressway that was targeted for analysis. Figure 9 shows the distribution map of the earthquake disaster risks, which confirms that there is a difference in the earthquake disaster risks in each IC section. There are high-risk areas shown on the expressway from Aichi Prefecture to Shizuoka Prefecture, which is indicated by the black oval frame in the figure. Furthermore, Figure 10 shows the distribution map of the landslide disaster risks. This shows that there is a difference in the landslide disaster risk; however, it confirms that the high-risk areas are different for landslides to earthquakes. In particular, it can be seen that the landslide disaster risks are high in the areas surrounded by the black oval frames in the figure (partway up Shoryudo, the road from Nagano Prefecture to Gifu Prefecture).
In the next section, we clarify the relationship between the record of usage by foreign tourists to Japan and the risk of earthquake and landslide disasters for each link in each IC section.

3.2.3. Disaster Risk Based to Foreign Tourists for Each Link

The following three variables were calculated from the results above of usage by foreign tourists for each IC section link, and earthquake and landslide disaster risk indices. These were used to clarify the relationship between the record of usage by foreign tourists (possibility of exposure to disasters) and the earthquake and landslide risks for each link.
The method used was a non-hierarchical cluster analysis that can group the similarities of the three variables. Figure 11 and Figure 12 show the results of the four-way classification for the above three variables using the k-means method, which is widely used in non-hierarchical cluster analysis. The features of each cluster can be determined from Figure 12. For example, in cluster 1, the central value of the cluster shows low values for the risk index D e q for earthquake disasters and risk index D l s for landslide disasters, and the value for the record of expressway usage is high. Therefore, the expressways belonging to cluster 1 can be interpreted as a “group of links with a high possibility of being used by many foreign tourists to Japan and a relatively low risk of earthquake and landslide disasters”. Table 4 shows the results of interpreting the characteristics of each cluster. In cluster 2, D e q is low, but D l s is at a moderate level of risk. The record of usage by foreign tourists to Japan is low, but it can be seen that there is a risk of landslide disasters. It can also be seen that cluster 3 is a group of links with both a low record of usage and a risk of disasters. Finally, cluster 4 is confirmed as a group of links with an extremely high risk of earthquake disasters, although its record of usage is small.
Figure 13 shows a visualization of these cluster classifications. The Shoryudo, which has an extremely large number of records of usage by foreign tourists to Japan, belongs to cluster 1. Furthermore, the group of links with a relatively high risk of landslide disaster (cluster 2) tended to be more in the Nagano and western Fukui Prefectures. In addition, the group of links with an extremely high risk of earthquake disaster (cluster 3) is concentrated in Aichi and Shizuoka Prefectures, as well as in Mie Prefecture. Based on the above, we conducted a cluster analysis using the record of usage, D e q , and D l s for each IC section link calculated in this analysis, which enabled us to group the disaster risk and potential of exposure to foreign tourists to Japan for each link.

4. Discussion and Conclusions

In this study, CEP data managed by NEXCO Central and Geographic Information System data were used to calculate the record of usage of foreign tourists to Japan who use rental cars and the disaster risk for each IC section link. Cluster analysis was used to group the disaster risks and the possibility of exposure to those disasters for each link. Results showed that the earthquake and landslide disaster risks were relatively low on the Shoryudo, which is extremely popular with foreign visitors to Japan. Furthermore, the earthquake disaster risk was extremely high in Aichi Prefecture, Shizuoka Prefecture, and some parts of Mie Prefecture.
The purpose of this research was to accumulate information with the aim of establishing a support system in the event of a disaster for the use of foreign tourists using rental cars, whose needs are expected to increase in the future. Through the analysis in this research, although basic in nature, the characteristics of disasters present in each expressway link have been determined.
The most significant feature of this study is that it introduces actual usage data of foreign visitors to Japan into the risk assessment of highways. This is considered as the amount of exposure to disaster risk, and generally, true values are used because of the actual values used. On the other hand, there is much room for improvement in disaster risk management. The data used to calculate the risk of earthquake disaster were from the National Research Institute for Earth Science and Disaster Resilience, which is under the jurisdiction of the Japanese Ministry of Education, Culture, Sports, Science and Technology (MEXT). The data used to calculate the risk of landslides were official data compiled by local governments throughout Japan. These data are also widely used in academic research in Japan, and thus have a certain degree of reliability. However, the process of risk calculation is basic, and further improvement in accuracy is needed.
For the earthquake hazard risk calculation, only the probability of earthquakes on the highway was considered, since the “30-year occurrence probability of shaking with seismic intensity of 6 Upper or more” was used in this study. However, the study conducted by Motatalla et al. [24] used Monte Carlo simulations to examine the possibility of damage on the highway due to earthquake disasters. Thus, the accuracy of this study will be improved by calculating the damage potential of the highway on a simulation basis.
Additionally, in this study, the risk of landslide disasters is based on the “landslide warning area” used by all local governments in Japan. The “landslide warning areas” are mapped in three dimensions from aerial photographs and set by experts based on on-site surveys. Although this area also has a certain degree of reliability as a hazard area, it does not take into account factors such as precipitation, geology, vegetation, slope, and other factors that contribute to landslides. There are many studies that have examined the causes of landslides, such as those by OTSUKA et al. [25] and NAGAO et al. [26]. They quantified the risk of slope failure on highways under Japanese topographic and geologic conditions. It was clear that catchment landforms and granite areas are particularly prone to landslides. We believe that this information can be used in this study to enhance the risk of landslides on highways.
Future issues include the need for refining each index used in this analysis. The record of usage by foreign tourists to Japan is calculated using only one year from April 2018 to March 2019, so the period of the data to be used needs to be increased to make the actual values more representative. This study was conducted in the Chubu region of Japan, and similar analyses could be conducted throughout Japan by expanding the CEP data. If data similar to the CEP data exist, it should be possible to perform the same analysis outside Japan. In this regard, the authors will consider the use of various data that exist outside of Japan. In addition, the actual usage values for the expressways used in this study are cumulative values for the one-year period from April 2018 to March 2019. However, as can be read from Figure 4, the number of users varies depending on the season. Therefore, it is necessary to calculate and analyze the actual usage values considering the season. The authors should continue to study the details of this issue. Finally, in this study, the CEP data and the calculated disaster risk values were used to identify the characteristics of the highway. However, this study has not been verified at this time. Therefore, it is necessary to verify the results of this study by referring to various previous studies and utilizing topographical and geological data.

Author Contributions

Conceptualization, Y.M.; methodology, Y.M.; software, M.F.; validation, Y.M., M.F. and S.O.; formal analysis, Y.M.; investigation, Y.M.; resources, M.F.; data curation, Y.M.; writing—original draft preparation, Y.M.; writing—review and editing, Y.M.; visualization, Y.M.; supervision, M.F. and S.O; project administration, M.F.; funding acquisition, M.F. All authors have read and agreed to the published version of the manuscript.

Funding

This research received no external funding.

Institutional Review Board Statement

Not applicable.

Informed Consent Statement

Not applicable.

Data Availability Statement

Data sharing does not apply to this article.

Conflicts of Interest

The authors declare no conflict of interest.

References

  1. Ministry of Land, Infrastructure, Transport and Tourism, Japan Tourism Agency. Number of Foreign Tourists to Japan/Exiting Japan. Available online: https://www.mlit.go.jp/kankocho/siryou/toukei/in_out.html (accessed on 10 January 2023).
  2. Japan National Tourism Organization: Monthly/Yearly Statistical Data (Foreign Tourists to Japan/Exiting Japan 2023). Available online: https://www.jnto.go.jp/jpn/statistics/visitor_trends/ (accessed on 10 January 2023).
  3. Inoi, H.; Yoh, K.; Doi, K. Considerations on how to promote the safe use of rental cars for inbound tourists to Japan. IATSS Rev. 2020, 45, 36–42. [Google Scholar]
  4. Ministry of Land, Infrastructure, Transport and Tourism, Japan Tourism Agency Study Group for Promoting the Use of Rental Cars by Foreign Tourists Visiting Japan 2019. Available online: https://www.mlit.go.jp/kankocho/rentalcars_000105.html (accessed on 10 January 2023).
  5. Central Nippon Expressway Co., Ltd. More Convenient Unlimited Expressway Ride Pass “CEP” for Foreign Tourists to Japan–Handling of Applications to Newly Start in KIX, with Handling Stores Expanding to Kanto Region 2016. Available online: https://hayatabi.c-nexco.co.jp/cep/en/ (accessed on 15 January 2023).
  6. Aibiki, R.; Yoshizawa, N.; Yamaguchi, K.; Shimomura, T.; Hikawa, T.; Taki, Y.; Yamazoe, M.; Kuriyama, A. Method of providing disaster information to foreign tourists visiting Japan. J. Jpn. Soc. Safety Eng. 2016, 55, 182–188. [Google Scholar] [CrossRef]
  7. Hada, Y. Current situation and issues in providing disaster information to international visitors in Japan. IATSS Rev. 2020, 45, 28–35. [Google Scholar]
  8. Kikusawa, I. Barriers for foreigners in times of disasters–Considerations on the information transmission modality. Urban Policy Res. 2020, 21, 25–38. [Google Scholar]
  9. Iwahara, H.; Shiraki, W.; Ishii, M. Study on providing tools combining tourist information and disaster prevention information for inbound in local cities. J. Jpn. Soc. Civil Eng. Ser. F6 Saf. Probl. 2018, 74, 1–10. [Google Scholar] [CrossRef] [PubMed]
  10. Ikuta, E.; Miyazaki, C.; Yoneda, A.; Kojima, K.; Nomura, Y. Development of experience-based game for foreign tourists in the event of a disaster. Ann. J. Urban Disaster Reduct. Res. 2020, 7, 37–42. [Google Scholar]
  11. Astatiani, A.; Kawasaki, A.; Meguro, K. Tokyo metropolitan earthquake’s population exposure to seismic intensity of foreigner–Through an investigation of Indonesian people residing in Japan. J. Inst. Ind. Sci. 2015, 67, 337–341. [Google Scholar]
  12. Yang, Z.; Inagaki, K.; Yoshida, S.; Sadohara, S. Regional characteristics analysis from the view of community-based disaster risk management for people with functional needs in times of disaster. J. Soc. Saf. Sci. 2015, 27, 145–154. [Google Scholar]
  13. Yoh, K.; Doi, K. Basic analysis on the traffic accident characteristics of foreign visitors using traffic accident statistics. Traffic Sci. 2020, 50, 41–48. [Google Scholar] [CrossRef]
  14. Yamanaka, R.; Kamiya, D.; Higa, K.; Wada, K.; Gushiken, S.; Sawabe, S. Analysis of relationship between the steep braking point and the road traffic environment for reducing traffic accidents by foreign driver. JSTE J. Traffic Eng. 2020, 6, A_79–A_84. [Google Scholar]
  15. Tatematsu, K.; Hibino, N. A study on behavior of inbound tourists using rental cars based on individual data of both tourism statistics and ETC. J. Jpn. Soc. Civil Eng. Ser. D3 Infrastruct. Plan. Manag. 2021, 76, I_823–I_836. Available online: https://ui.adsabs.harvard.edu/link_gateway/2021JSCIP..76..823T/doi:10.2208/jscejipm.76.5_I_823 (accessed on 18 January 2023). [CrossRef] [PubMed]
  16. Japan Tourism Agency. Consumption Trend Survey of Foreign Tourists to Japan 2014~2018. Available online: http://www.mlit.go.jp/kankocho/siryou/toukei/syouhityousa.html (accessed on 18 January 2023).
  17. Ministry of Land, Infrastructure, Transport and Tourism: FF-Data (Flow Data of Foreign Tourists to Japan 2014~2017). Available online: https://www.mlit.go.jp/sogoseisaku/soukou/sogoseisaku_soukou_fr_000022.html (accessed on 18 January 2023).
  18. Martín-Cejas, R.; Sánchez, P. Ecological footprint analysis of road transport related to tourism activity: The case for Lanzarote Island. Tour. Manag. 2010, 31, 98–103. [Google Scholar] [CrossRef]
  19. Khadaroo, J.; Seetanah, B. Transport infrastructure and tourism development. Ann. Tour. Res. 2007, 34, 1021–1032. [Google Scholar] [CrossRef]
  20. Dorta Antequera, P.; Díaz Pacheco, J.; López Díez, A.; Bethencourt Herrera, C. Tourism, Transport and Climate Change: The Carbon Footprint of International Air Traffic on Islands. Sustainability 2021, 13, 1795. [Google Scholar] [CrossRef]
  21. Dijkstra, E.W. A note on Two Problems in Connexion with Graphs. Numer. Math. 1959, 1, 269–271. [Google Scholar] [CrossRef]
  22. National Research Institute for Earth Science and Disaster Resilience: Japan Seismic Hazard Information Station (J-SHIS) 2023. Available online: https://www.j-shis.bosai.go.jp/ (accessed on 20 January 2023).
  23. Ministry of Land, Infrastructure, Transport and Tourism: National Land Information Division 2023. Available online: https://nlftp.mlit.go.jp/ksj/ (accessed on 20 January 2023).
  24. Moratalla, J.; Uma, S. Probabilistic assessment of road accessibility under cascading hazards. Int. J. Disaster Risk Reduct. 2023, 91, 103692. [Google Scholar] [CrossRef]
  25. Otuka, T.; Kamura, A.; Kazama, M. A study on predisposing factors for estimating failure probability of expressway cut slopes under heavy rainfall using deep learning. Artif. Intell. Data Sci. 2021, 2, 194–201. [Google Scholar]
  26. Nagao, K.; Sawano, K.; Matsuzaki, K.; Kamura, A.; Kazama, M. Evaluation of slope collapse factors based on actual disaster data on expressway in tohoku region. J. Jpn. Soc. Civ. Eng. Ser. C Geosph. Eng. 2020, 76, 235–253. [Google Scholar] [CrossRef] [PubMed]
Figure 1. Scope of analysis in the present study.
Sustainability 15 13481 g001
Figure 2. Tabulation results regarding nationalities of analysis subjects.
Sustainability 15 13481 g002
Figure 3. Tabulated results for unlimited ride period of CEP.
Sustainability 15 13481 g003
Figure 4. Tabulation results for application period for CEP of analysis subjects.
Sustainability 15 13481 g004
Figure 5. Calculation of record of usage of links between interchanges (ICs).
Sustainability 15 13481 g005
Figure 6. Calculation of record of usage of links between ICs.
Sustainability 15 13481 g006
Figure 7. Calculation of risk index for earthquake disaster between each link.
Sustainability 15 13481 g007
Figure 8. Risk index for landslide disasters between links calculation.
Sustainability 15 13481 g008
Figure 9. Earthquake disaster risk index for each link.
Sustainability 15 13481 g009
Figure 10. Landslide disaster risk index for each link.
Sustainability 15 13481 g010
Figure 11. Results of classification into each cluster.
Sustainability 15 13481 g011
Figure 12. Result of iterative estimation.
Sustainability 15 13481 g012
Figure 13. Cluster classification.
Sustainability 15 13481 g013
Table 1. An example of CEP data used in the present study.
Subscription
Period
IDInfrow
Date
Inflow
Time
Inflow
IC
Outflow
Date
Outflow
Time
Outflow
IC
Nationality
01/04/2018~05/04/2018101/04/201810:20Komaki01/04/201810:40IchinomiyaHong Kong
01/04/2018~05/04/2018101/04/201815:02Ichinomiya kisogawa01/04/201816:23Hida kiyomiHong Kong
01/04/2018~05/04/2018102/04/201814:11Hida kiyomi02/04/201814:31ShirakawagoHong Kong
01/04/2018~06/04/2018201/04/201809:37Ichinomiya01/04/201810:33MinoTaiwan
01/04/2018~06/04/2018201/04/201812:26Gujo hachiman01/04/201813:05Hida kiyomiTaiwan
01/04/2018~06/04/2018203/04/201810:40Hida kiyomi03/04/201810:59ShirakawagoTaiwan
01/04/2018~06/04/2018203/04/201816:18Shirakawago03/04/201817:08ToyamaTaiwan
Table 2. Schemes follow the same formatting.
Duration of Data01/04/2018~31/03/2019
Number of persons analyzed
(Number of applications to CEP)
8939
Number of data
(Number of times inflow or outflow)
72,837
Table 3. Links between ICs with high records of usage.
RankLibk between ICCumulative Number of Uses
(04/01/2018~31/03/2019)
1stShirakawago IC~Hidakiyomi IC12,195
2ndIchinomiya JCT~Ichinomiya IC11,958
3rdMino IC~Minoseki IC11,848
4thMinami IC~Mino IC11,772
5thGujohachiman IC~Minami IC11,603
Table 4. Results of interpreting characteristics of each cluster.
Cluster1Cluster2Cluster3Cluster4
Index of the risk for earthquake disaster DeqLowLowLowHgih
Index of the risk for earthquake disaster DlsLowMediumLowLow
Cumulative number of uses for foreign visitors to JapanHighLowLowLow
Disclaimer/Publisher’s Note: The statements, opinions and data contained in all publications are solely those of the individual author(s) and contributor(s) and not of MDPI and/or the editor(s). MDPI and/or the editor(s) disclaim responsibility for any injury to people or property resulting from any ideas, methods, instructions or products referred to in the content.

