Abstract
The goal of this research is a static geographic comparison of the degree of Sustainable Development Goal 8 (SDG8) implementation and to compare its dynamics for the European Union (EU) in the period of 2002–2021 with the consideration of the COVID-19 pandemic. The level of implementation of the 2030 Agenda for Sustainable Development objectives is monitored both jointly and individually. This research uses the COPRAS, the Dynamic Time Warping (DTW) and the hierarchical clustering methods. The study confirmed the geographical diversity in the degree of SDG8 implementation. Nordic countries have the highest degree of implementation, while Greece, Spain, Italy, Romania and Slovakia have the lowest. Some less-developed countries (Czechia, Poland and Malta) were in the cluster where the implementation improved, and some well-developed countries (France, Luxembourg and Portugal) were in the cluster in which the situation did not improve or improved at a low degree. It was not possible to identify geographical diversity in the dynamics of changes in the degree of SDG8 implementation. The COVID-19 pandemic caused the decline in the degree of SDG8 implementation. The added value of the study consists of comparing the dynamics of the degree of implementation of SDG8 using the DTW method. The obtained conclusions may help to create policies for EU countries in this regard.
1. Introduction
In 2015, the United Nations General Assembly approved the universal 2030 Agenda for Sustainable Development [1]. It includes 17 distinct Sustainable Development Goals (SDGs) and 169 individual targets under these goals. They were at first thought to be aspirational and global goals, and national governments were expected to decide how they should be integrated into national planning, policy and strategy processes. The goals were seen as milestones, setting the direction of changes but not defining implementation at the national level. The level of achievement of individual goals is monitored. Studies such as this one are carried out both for all the goals together and for individual goals. The conclusions of the evaluation activities are intended to assist in their implementation. Undoubtedly, disruptions in their implementation may be caused by crises of a local nature, i.e., affecting one country. However, due to the globalisation of socio-economic processes, the greatest disruptions to the implementation of the Sustainable Development Goals are brought about by crises of a global nature. Reporting on progress towards the Sustainable Development Goals is extremely important in terms of creating appropriate policy [2]. An analysis of trends in publications in the area of the Sustainable Development Goals shows that one of the less highlighted goals is Sustainable Development Goal 8 (SDG8—Decent Work and Economic Growth) [3].
The goal of this research is a static geographic comparison of the degree of Sustainable Development Goal 8 implementation and to compare its dynamics for the European Union (EU) in the period 2002–2021 with the consideration of the COVID-19 pandemic. The analysis was conducted in two planes. The first one was a static analysis in which the EU countries were divided into homogeneous clusters with regard to the degree of achievement of SDG8 in selected years: 2002 (the beginning of the research period), 2009 (the peak of the financial crisis) and 2021 (the health crisis resulting from the COVID-19 pandemic). The second aspect was a dynamic analysis that compared the dynamics of the degree of SDG8 implementation and the influence of the COVID-19 pandemic. The following research methods were applied: linear ordering using the COPRAS method, the Dynamic Time Warping method and a hierarchical cluster analysis with the application of Ward’s method. The stated research objective is to identify the most divergent countries from those with the highest degree of SDG8 implementation (static analysis). The objective of the dynamic analysis was to identify groups of countries with a similar direction of change in the degree of SDG8 implementation. This may allow similar policies to be implemented to support sustainable development. The dynamics of the composite measure will identify which clusters of countries were most severely affected by the pandemic and which would require specific support. The use of less frequently used statistical and mathematical methods in the construction of composite measures can be considered an added value of the study [3].
This paper is organised as follows: Section 2 contains a discussion of the SDG8 targets and a literature review. In Section 3, the data used in the study and applied research methods are described. Section 4 contains a discussion of the results of the empirical study. Section 5 contains a discussion and Section 6 contains conclusions, directions for future research and limitations of the study.
2. Sustainable Development Goals
The Sustainable Development Goals were established by the United Nations General Assembly in 2015 (Resolution approved by the General Assembly) [1]. Progress towards the objectives is measured, monitored and evaluated using 17 goals. Sustainable Development Goal 8 (SDG8) is to “promote sustained, inclusive and sustainable economic growth, full and productive employment and decent work for all. SGD8 is the aspiration that the economic sector of each country should provide its citizens with the necessary needs for a good life, regardless of their origin, race or culture”. SDG8 has a total of twelve targets. They are included in Figure 1.
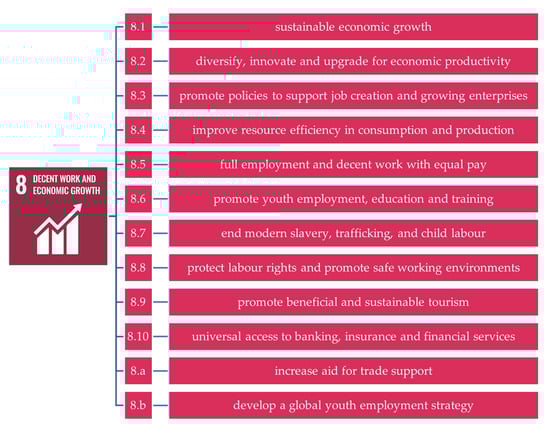
Figure 1.
Sustainable Development Goal 8 targets. Source: own elaboration on the basis of [4].
All Sustainable Development Goals are connected to each other. Research conducted by Fonseca et al. [5] indicates that SDG8 is positively correlated with most of the other SDGs. It is strongly and positively correlated with SDG2–SDG5, SDG7, SDG9, SDG11 and SDG16, and strongly negatively correlated with SDG12 (Responsible Consumption and Production). It should be noted here that SDG12 is negatively correlated with most of the other targets.
There is no doubt that crisis situations have an impact on the realisation of the Sustainable Development Goals. In recent years, the COVID-19 pandemic has been such an event. It has affected the socio-economic phenomena [6,7,8,9,10]. The Sustainable Development Goals Report 2021 [11] indicates that even before the pandemic outbreak, global economic growth had slowed. However, the beginning of the pandemic in 2020 severely disturbed global economic activity. The COVID-19-driven recession was assessed as the worst since the Great Depression.
As Kreinin and Aigner [12] highlight, SDG8 hinders society’s ability to achieve other Sustainable Development Goals and prevent disastrous environmental crises. They point out that a focus on economic growth and a focus on an increase in employment lead to unsustainable and inequitable consequences. Currently, only sub-goals 8.4, 8.7 and 8.8 are adequate in achieving the overall SDGs and 2030 Agenda goals of ending poverty and ensuring prosperity and protection of the Earth. The authors proposed a redesigned SDG8 framework, together with new targets and a new set of indicators, which together are expected to contribute to harmonising SDG8 with the overall goals of the 2030 Agenda.
Projections for the SDG targets in Austria for 2020 were presented by Bilek-Steindl and Url [13]. They showed that the SDG8 targets are strongly linked to the underlying economic situation and that the outcomes of the COVID-19 pandemic are evident in the results for 2020. In particular, the evaluation of indicators involving the economic aspect has rapidly declined with the economic crisis. The authors point out that some of the data on the SDG8 target are insufficiently up to date. They present ‘in-work at-risk-of-poverty rate’ and the ‘resource productivity’ as examples. The lack of data published with sufficient frequency makes forecasting difficult.
Regional organisations play an important role in the implementation of the SDGs. Both the Association of Southeast Asian Nations (ASEAN) and the European Union are examining and experimenting with various institutional mechanisms to participate in the achievement of these goals. The result of these experiments is the creation of new institutional mechanisms and initiatives. These new institutional instruments and mechanisms are characterised by varying degrees of effectiveness [14].
One of the issues that inhibits efforts to predict progress in implementing the Sustainable Development Goals is the lack of data on crises and the poor quality of some data [15]. Despite this, numerous attempts are being made to assess the impact of the COVID-19 pandemic on the SDGs. The research conducted by Alibegovic et al. [16] presented the impact of the pandemic on the SDGs in Italy. They found that SDG1 (No Poverty), SDG4 (Quality Education) and SDG8 (Decent Work and Economic Growth) were the goals most affected by COVID-19. In contrast, research by Shulla et al. [17] indicates the impact of COVID-19 on stronger links between SDG4, SDG8, SDG3 (Health and Well-Being) and SDG13 (Climate Action) goals. In Portugal, implementation of SDG8 during the first wave of the pandemic was threatened by corporate bankruptcy and the increase in unemployment [18]. The research conducted by Lucas and Landman [19] consisted of an analysis of the impact of COVID-19 on target 8.7. They point out the major limitations of the study caused by limited data availability. As Ranjbari et al. [20] indicated, there was an urgent need for action to support the achievement of the SDGs, particularly in the following directions: (1) opportunities for transformative sustainable development following COVID-19 with a focus on SDG12 (Consumption and Production) and SDG9 (Industry, Innovation and Infrastructure), (2) innovative solutions for economic resilience in support of SDG1 (No Poverty), SDG8 and SDG17 (Partnerships for the Goals), and (3) an in-depth analysis of the long-term implications of COVID-19 for social sustainability to achieve SDG4, SDG5 (Gender Equality) and SDG10 (Reducing Inequalities). The research conducted by Ranjbari et al. [21] attempted to identify priority areas for action after the COVID-19 crisis towards the implementation of the SDGs under the 2030 Agenda for Sustainable Development. Target 8.3 (development-oriented policies for supporting creativity and job creation) was identified as one of the highest priorities for action.
Most often, measures are taken to reduce the impact of crises negatively affecting the overall level of sustainable development. However, the impact of crises is not always negative. An example is the crisis resulting from the COVID-19 pandemic. The pandemic increased the demand for working from home, especially for parents with young children or school-age children. As a result, teleworking has gained attention and is estimated to continue in the future. Thus, a new form of employment in relation to the conventional workplace has become widespread [22,23]. Also, the acceleration of digitalisation may soon create more employment opportunities [24]. These factors have the potential to positively influence employment by using more effective approaches that can strengthen the progress towards the implementation of SDGS8 [25].
In their report, Sciarra et al. [26] ranked countries by the SDGs-GENEPY (GENeralised economic comPlexitY) framework [27] and SDG Index [28]. European and North American countries are at the top of these rankings. African and South Asian countries are in the worst situation. The analysis conducted by Pakkan et al. [29] points to correlations between the goals. SDG8 is often studied in conjunction with SDG9. In contrast, research conducted for Australia by Bandari et al. [30] indicates a strong link between SDG8 and SDG2 (Zero Hunger), and Rai et al. [31] argue that SDG8 focuses on Decent Work and Economic Growth insufficiently. In addition, they argue that SDG8 is at odds with SDG5, which calls for the value of domestic work and unpaid care to be recognised. On the other hand, the SDG8 implementation is positively influenced by the development of high-quality education, which is embedded within SDG4 [32].
The European Union is pursuing an accelerated transformation from the present linear economy to a circular one (CE). The CE is considered as a tool to achieve SDGs [33,34]. The research conducted by Rodríguez-Antón et al. [35] showed a significant positive correlation between the implementation of SDG8 and adherence to CE targets. This is particularly evident in such countries as Austria, Belgium, Denmark, France, Germany, Italy, the Netherlands and the United Kingdom.
Finally, Jianu et al. [36] investigated labour market inequalities in the EU, as expressed by specific indicators used for SDG8 of the 2030 Agenda for Sustainable Development on the basis of a cluster analysis for the 27 Member States. The first cluster comprised the majority of EU countries, geographically located in Eastern and Central Europe along with the Baltic countries, as well as two Mediterranean countries—Portugal and Greece. The principal characteristics of these countries were low values of the real GDP per capita, resource productivity and domestic material consumption and high values recorded for the NEET indicator for young people, the in-work at-risk-of-poverty rate the and long-term unemployment rate.
The analysis of the literature provided the basis for the following research hypotheses:
H1.
It is possible to identify regions of the European Union with a similar level of SDG8 implementation.
H2.
It is possible to identify regions of the European Union with similar dynamics of change in the degree of SDG8 implementation.
H3.
The COVID-19 pandemic caused the decline in the degree of SDG8 implementation.
The problem addressed in H1 is reflected in the available literature. The contribution of this study is to present the changes in the geographical distribution of countries with a similar degree of SDG8 implementation over a long research horizon. The verification of H2 fills a research gap related to the assessment of the dynamics of change in the degree of SDG8 implementation and its comparison using the DTW method. Also, the study of the impact of the COVID-19 pandemic on the degree of SDG8 implementation using a synthetic measure created with the COPRAS method (verification of H3) is the added value of the research.
3. Data and Research Methodology
In this study, a pre-defined set of indicators included in the Eurostat database was used. There are criticisms and proposals for new indicators in the literature. In their study, Kreinin and Aigner [12] suggest a new SDG8 framework consistent with the strong sustainability concepts of ‘Sustainable Work and Growth’. Similarly, Coscieme et al. [37] stress that pursuing unconditional GDP growth risks failing to achieve the Sustainable Development Goals. SDG8 implementation through continued GDP growth will make it more difficult to achieve environmental and inequality reduction goals. They propose guidelines for the selection of alternative indicators related to the achievement of SDG8. In addition, another problem arises. Many of the SDG indicators used to monitor implementation of the goals have long publication delays [38].
The Eurostat database collects data on sustainable development. These are grouped according to individual headline goals and include variables to examine these targets. The SDG8 data from period 2002–2021 were applied. There are eight variables related to the implementation of SDG8:
- x1—GDP per capita in constant prices from year 2021 (in Euro);
- x2—Investment share of GDP by institutional sectors (percentage of GDP);
- x3—Young people (aged 15–29 years) neither in employment nor in education and training by sex (NEET) (percentage of total population);
- x4—Employment rate (for persons aged 20–64 years) (percentage of total population);
- x5—Long-term unemployment rate (percentage of total population in the labour force);
- x6—In-work at-risk-of-poverty rate (percentage of total employed persons, aged 18 years and more);
- x7—Fatal accidents at work per 100,000 workers;
- x8—Inactive population due to caring responsibilities (percentage of population aged 20–64 outside the labour force and wanting to work).
The Eurostat data are public and freely available. They are collected in accordance with statistical reporting rules and have a high degree of reliability. These data do not require ethical considerations. The calculations were conducted in R language [39] with the use of the following libraries: clusterSim [40], dtw [41], NbClust [42] and factoextra [43].
The survey was conducted in several stages according to the following scheme (Figure 2).
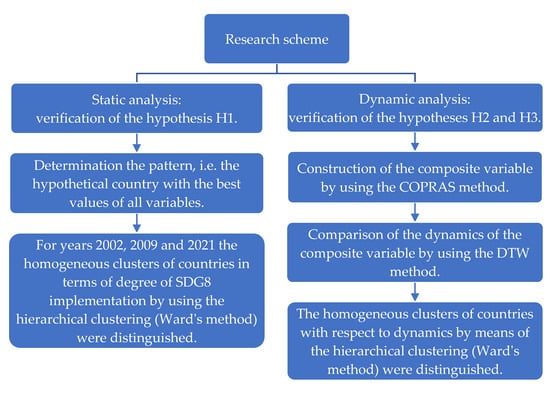
Figure 2.
Research scheme. Source: own elaboration.
In the first step of the static analysis, the pattern, i.e., best values of all variables, were determined (Table 1).

Table 1.
Pattern values of indicators.
The best values of variables vary across the countries and years. For half of the variables, their best values were in the Nordic countries. This confirms the initial finding that these countries are the ones with generally the highest degree of SDG8 implementation.
The static analysis (verification of H1) consisted of the selection of the homogeneous clusters of countries, with the artificial one being the pattern country (the hypothetical one with the best values of variables, as presented in Table 1). Although such an analysis can be performed every year, the size would exceed the capacity of this research. Therefore, three years were selected: 2002 (the beginning of the research period), 2009 (the peak of the financial crisis) and 2021 (the health crisis resulting from the COVID-19 pandemic). The agglomerative clustering method with Ward’s method for minimising the total within-cluster variance was used [44]. The hierarchical clustering was based on the distance matrix. For the static analysis, the Euclidean distance matrixes between the countries were applied.
The dynamic analysis allowed for verification of H2 and H3. Its first stage was the assessment of the degree of SDG8 implementation every year by means of linear ordering. Linear ordering methods are types of multivariate statistical analysis. The idea of linear ordering methods is the creation of a composite measure from a set of a larger number of variables. There are many linear ordering methods, which can be divided into two main groups: the pattern and patternless methods. The pattern methods assess the position of every object by means of the weighed distance of them from the so-called pattern or anti-pattern, which is the hypothetical object with the best (worst) values in the dataset. The patternless methods are based on the weighed sums of normalised variables. One of the patternless methods—the COPRAS method—was selected. In the second stage of the dynamic analysis, we compared the time series created from the composite measures by means of the DTW method and used the results in hierarchical clustering to distinguish homogeneous clusters of EU countries with respect to the dynamics of the degree of SDG8 implementation (verification of H2). In the third stage of the dynamic analysis, we assessed the influence of COVID-19 on the degree of SDG8 implementation (verification of H3).
It is worth noting that the static and dynamic analyses are complimentary, and thus cannot be directly compared. The static analysis was conducted for every year separately, while the dynamic one was conducted for the whole period (2002–2021).
3.1. The COPRAS Method
The COPRAS (the COmplex PRoportional Assessment) method was invented by the Lithuanian researchers Zavadskas et al. [45]. It was created for the needs of the decision theory and belongs to the group of Multiple-Criteria Decision-Making (MCDM) methods. MCDM methods are used to analyse the Sustainable Development Goals [46]. There are no clearly defined ways of selecting methods. When it comes to ranking, different methods may give different results [47]. The COPRAS method is also applied in the analysis of socio-economic phenomena [48,49,50,51]. However, it can also be used in multivariate statistical analysis. There are five steps of the COPRAS method. In the first one, there is the observation matrix X:
where the components are as follows:
- —Value of j-th variable in the i-th object;
- n—Number of objects;
- m—Number of variables.
In the second step, the data are normalised in order to remove units and ensure that the variables have the same order of magnitude. In this research, one of the quotient inversions, given by the following formula, was selected:
where is the value of the j-th variable in the i-th object after normalisation.
In the third step, the weighted normalised values of variables are calculated:
where is the weight of the j-th variable, satisfying the following conditions:
There are many methods used to assess the weights of variables. In this research, equal weights were assumed. The reason for this was that the weights allocated by statistical methods (on the basis of variation or correlation between variables) would vary from year to year. By contrast, using expert methods to assign weights would have resulted in a high level of subjectivity. As it is difficult to state whether some variables are of greater importance than others, equal weights are assumed. In the fourth step, the weighted sums for stimulants () and destimulants () for all objects are calculated:
where the components are as follows:
- —Variables that are stimulants;
- —Variables that are destimulants.
Stimulant variables are the ones where the highest values are the most preferred, and destimulants are the opposite. In our case, the variables , and are the stimulants. The remaining variables are the destimulants. In the fifth step, the value of the synthetic variable is obtained:
The value of is not normalised; is the best object and is the worst object. The composite measures for every country every year were calculated. These variables then created the time series of the degree of SDG8 implementation, which were compared with the use of the Dynamic Time Warping (DTW) method.
The advantage of the COPRAS method in this study over methods based on distances from the pattern and anti-pattern is due to the fact that their values also deteriorate during crises, which does not necessarily translate into a deterioration of the synthetic variable. Relying on the weighted sums of the normalised values alone (as in the COPRAS method) results in a decrease in the value of the synthetic measure when the indicators deteriorate and an increase if they improve. A disadvantage of the COPRAS method is that there must be at least one variable that is a destimulant. In this study, this assumption is satisfied.
3.2. Dynamic Time Warping (DTW)
DTW measures the similarity between time series. This method uses dynamic programming to find the optimal match between them with respect to a given score function. It was proposed by Bellman and Kalaba [52] and first used for speech recognition [53,54]. Its primary use has been in technical sciences, although more and more often its applications cover the areas of finance [55,56,57], labour markets [58,59] and energy markets [60,61,62].
There are four steps of the DTW method. Let and be two time series. In the first step, the time series are normalised. The z-normalisation was selected. In the second step, the local measure of cost for two elements of X and Y is specified.
In the third step, the time warping path is constructed, which is the point-to-point match between X and Y by means of the following sequence:
for .
This satisfies the boundary, monotonicity and step-size conditions. The first condition provides that the first and the last element of are and (the first (last) index from the first sequence must be matched with the first (last) index from the second one). The monotonicity and step-size conditions provide that the path always goes up, right or up and right of the current position, i.e.,
In the fourth step, the optimal match is found. It satisfies all the aforementioned restrictions and minimises the total cost of a warping path . This cost is calculated using the following equation:
Therefore, the optimal alignment between X and Y is
where P is the set of all warping paths.
The DTW distance, i.e., a stretch-insensitive distance between the two time series, which is also the minimum distance between the series X and Y, is therefore defined as
The degree of similarity between time series can also be tested using other distance measures, such as the Euclidean metric or other known distance measures. The first advantage of the DTW method in this respect is that the time series being compared do not have to be of equal lengths. The second advantage of this method is that it adjusts much better to differences in the cycles.
The calculated distances were applied in hierarchical clustering. The assessed similarities between the analysed time series by means of DTW were used in the hierarchical agglomerative clustering. A dendrogram was built with the use of the Ward’s method.
4. Empirical Results and Discussion
The data used in the study covered the years 2002–2021. The static analysis was conducted for each year separately. The exact results of the cluster analysis for three years are presented: 2002 (the first analysed year), 2009 (the peak of the financial crisis) and 2021 (the COVID-19 pandemic). The countries were also joined by a hypothetical ‘ideal’ country with values for the variables that are the pattern of development. The variables were normalised by using the data.Normalization function from the clusterSim R package. In every analysed year, we specified the number of clusters by using the NbClust function from the NbClust R package and applying the Beale index [63]. The results are presented in Figure 3, Figure 4 and Figure 5 (the dendrograms were drawn by using the fviz_dend function from the factoextra R package).
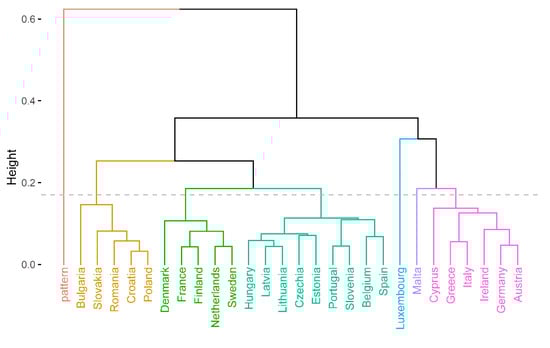
Figure 3.
Homogeneous clusters of the European Union countries and the pattern—the degree of SDG8 implementation in 2002. Source: own calculations.
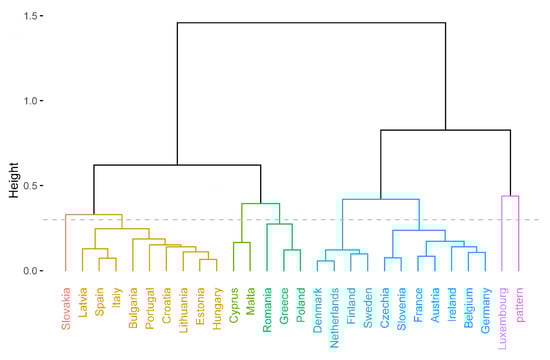
Figure 4.
Homogeneous clusters of the European Union countries and the pattern—the degree of SDG8 implementation in 2009. Source: own calculations.
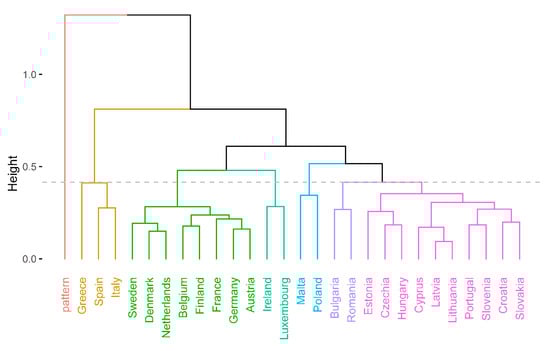
Figure 5.
Homogeneous clusters of the European Union countries and the pattern—the degree of SDG8 implementation in 2021. Source: own calculations.
4.1. Results of the Static Analysis
The static analysis was used to verify H1.
In each of the three analysed years (2002, 2009 and 2021), the hypothetical pattern country always formed a separate cluster. This means that even the countries with the overall best situation with respect to the implementation of SDG8 had some weaker areas that did not allow them to be in the same cluster as the hypothetical pattern country. In 2009 only, Luxembourg had the most similar situation with respect to the degree of implementation of SDG8 as the pattern country (Figure 4). In each of the three analysed years, Sweden, Denmark, the Netherlands and Finland were in one cluster. They were the countries that, in the majority of the analysed years, were at the top of the degree of SDG8 implementation. Poland, Bulgaria, Romania, Croatia, Greece and Malta were, at the beginning of the period under analysis, in the group of countries with the lowest degree of SDG8 implementation (Figure 3). Over the years, Slovakia’s position improved slightly, and Italy and Spain joined the cluster of countries with the lowest degree of SDG8 implementation. Germany, Belgium, Ireland and France were the countries forming clusters with a good (but not the highest) degree of SDG8 implementation throughout the analysed period. The remaining countries that joined the EU in 2004 were among those with an average degree of SDG8 implementation. The degree of SDG8 implementation in Ireland and Luxembourg was high, but their membership in the clusters was the most changing. The next two countries whose membership in the clusters was variable were Poland and Malta. They, in turn, are at the other pole of the degree of SDG8 implementation. Crisis periods have most severely deteriorated the degree of SDG8 implementation in Spain and Italy. This is also reflected in their membership in the clusters in 2009 and 2021 (Figure 4 and Figure 5).
4.2. Results of the Dynamic Analysis
The dynamic analysis was used to verify H2 and H3. In the first stage of the dynamic analysis, the degree of SDG8 implementation was assessed by means of the COPRAS method. In each year, the synthetic measures were calculated for every country. Thus, the obtained time series of the synthetic measure for every country were compared pairwise by using the DTW method. In the second stage of the dynamic analysis, on the basis of these comparisons, the DTW distance matrix for the whole period by using the dtw function from the dtw R package was obtained. This matrix reflects the comparison of dynamics of the degree of SDG8 implementation and was the basis for the hierarchical clustering (Ward’s method). Similarly, as in the static analysis, the Beale index in the NbClust function from the NbClust R package was applied to obtain the optimal number of clusters and the fviz_dend function from the factoextra R package to draw the dendrogram. The results of this analysis verify H2 and are presented in Figure 6.
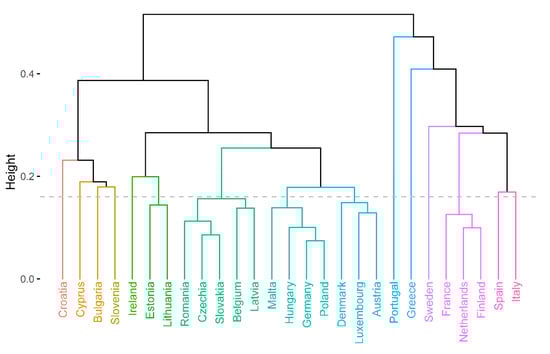
Figure 6.
Homogeneous clusters of the European Union countries—dynamic analysis of the degree of SDG8 implementation. Source: own calculations.
A total of 15 clusters with respect to the similarity of dynamics of the degree of SDG8 implementation were obtained. Italy (further referred to as Cluster 1), Spain (Cluster 2), Sweden (Cluster 3), Greece (Cluster 4), Portugal (Cluster 5), Ireland (Cluster 6), Slovenia (Cluster 7), Bulgaria (Cluster 8), Cyprus (Cluster 9) and Croatia (Cluster 10) formed separate single clusters. The dynamics of the synthetic variable formed clusters for the following countries:
- Estonia and Lithuania (Cluster 11);
- Romania, Czechia, Slovakia, Belgium and Latvia (Cluster 12);
- Malta, Hungary, Germany and Poland (Cluster 13);
- Denmark, Luxembourg and Austria (Cluster 14);
- France, the Netherlands and Finland (Cluster 15).
It can be found that the similarity of countries with the degree of SDG8 implementation (static analysis) does not have much in common with their dynamics. In general, it was hard to distinguish well-separated clusters with respect to dynamics of the SDG8 implementation. That is why the optimal number of them is that big. The results indicate that it is hard to find similarities between the dynamics of the degree of SDG8 implementation between the EU countries. The most similar countries with regard to the dynamics of the degree of SDG8 implementation were Poland and Germany, while Portugal was the most dissimilar with respect to all other EU countries. In the cases of Greece and Spain, the degree of SDG8 implementation at the end of the analysed period was lower than at the beginning. For Portugal (the most dissimilar country with comparison to other ones), it was the most steady (the degree of SDG8 implementation in Portugal had only small fluctuations). The highest increase was observed in the case of Ireland.
In the last stage of the dynamic analysis, H3 was verified. The average values of the COPRAS measure for each of the 15 clusters, obtained in the previous stage, are presented in Figure 7.
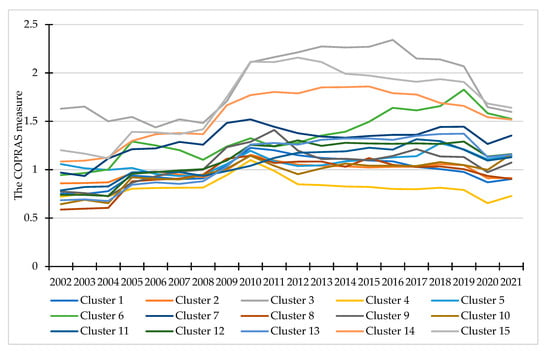
Figure 7.
Dynamics of the degree of SDG8 implementation in the clusters of the EU countries in years 2002–2021. Source: own calculations.
The dynamics of all clusters varies, which confirms the findings from the second stage (Figure 6). However, some common regularities for each cluster can be seen. Firstly, the financial crisis of 2007–2008 did not cause a significant decline in the degree of SDG8 implementation. Some clusters (3 and 15) showed its high increase. The second common regularity for all clusters is the decline in the year 2020 (the first year of the COVID-19 pandemic). In 2021, the degree of SDG8 implementation increased in most clusters. Only Clusters 3, 6, 8, 14 and 15 reported a further decline in SDG8 implementation. Therefore, this confirms H3, that the COVID-19 pandemic caused deterioration in the degree of SDG8 implementation. However, high differences between the clusters’ dynamics (especially since Clusters 1–10 consist of single countries) indicate that the directions of changes are different. This makes the implementation of a common policy with regard to the degree of SDG8 implementation difficult, if not impossible.
5. Discussion
The first research hypothesis concerned the geographical variation in the degree of SDG8 implementation. It was verified positively. The conducted study confirms the results of other studies. The results of the analysis by Rocchi et al. [64] showed that in 2019, the Nordic countries were the most advanced among European countries in terms of achieving the SDGs. These countries were at the top of the ranking for all dimensions, except for the environmental dimension in the case of Denmark. Moreover, Barbier and Burgess [65] explain such results by the institutional effectiveness and good governance associated with long-term development and success in sustainable development. This fact can explain the high position of the Nordic countries in terms of SDG implementation. The EU Baltic States and the post-communist countries performed the worst. The low position of the EU post-communist countries is due to their later accession to the EU. It should be noted that their accession had a positive impact on economic development, including the labour market [59]. However, the question of whether the economies of EU members are ‘driving’ the economies of EU candidates depends on a number of factors and is still open [66].
The high position of Sweden in terms of the implementation of all SDGs was pointed out by Stanujkic et al. [67]. And although this country was not leading in all the goals implemented, it ranked very high (e.g., SDG8) or high in all of them. Their research indicates a weak position of Romania, as well as Bulgaria. This is consistent with our analysis. Both countries are Eastern European ones and joined the EU in 2007. These countries have not included sustainable development as a demand in their policies yet. Interestingly, Romania ranks high in terms of implementing SDG7 [61]. Studies indicate an improvement in the energy use process in this country [68]. However, improvements are needed in the targets included in SDG8.
The targets and their constituting indicators of SDG8 in 2019 were assessed by Skvarciany and Astikė [69]. They showed that the most important indicator is the annual growth rate of the real GDP per employed person. In 2019, the countries that progressed the most in the implementation of SDG8 were Germany and France. Finland and Latvia made less progress in SDG8 implementation. The level of SDG8 implementation in EU countries between 2001 and 2020 was analysed by Grzebyk et al. [70]. Their results confirm that in most EU countries there have been positive changes in its implementation in the years studied. This is demonstrated by the increasing values of the synthetic measure calculated for each of the EU27 countries. According to their ranking in 2020, the Netherlands and Sweden were in the highest positions and Bulgaria and Romania were in the lowest positions. The latter two countries formed a separate cluster of countries in our 2021 study. In contrast, our analysis with respect to dynamics of the degree of SDG8 implementation indicated that both countries at the top of the ranking and at the bottom of the ranking were in separate clusters. This shows that changes in the implementation of the SDG8 targets in these countries have occurred in different ways. In contrast, in Carlsen’s [71] ranking of the EU27 countries for 2019, the first two are Sweden and Austria and the last two are Greece and Bulgaria. In creating this ranking, the author considered the five main indicators that characterise SDG8. These were in relation to our variables: x1, x2, x3, x4 and x5. The ranking created for 2020 by Kuc-Czarnecka et al. [72] showed that the best positions were held by the Netherlands and Finland, and the worst positions were held by Greece and Cyprus. In the latter study, the authors used different weights for all variables.
In the static analysis, Luxembourg and Ireland were often the outliers. This is confirmed by the study conducted by D’Adamo et al. [73]. As the authors point out, the distinguishing feature of these countries is a very attractive tax system, which appears to have succeeded in stimulating economic growth but has failed to reconcile it with the Sustainable Development Goals.
The verification of H2 was based on the DTW method, which is rarely used in studies on the SDGs. An example of such application was the study of SDG7 by Dmytrów et al. [61]. This study was able to identify homogeneous clusters of countries geographically. Unfortunately, it was not possible to extract such clusters in the current study on SDG8. A very large number of clusters were obtained, which were highly internally heterogeneous, as well as many clusters consisting of individual countries. This demonstrates the high diversity of EU countries according to the dynamics of the degree of SDG8 implementation. This may be related to the fact that EU countries are diverse in terms of their policies. There is a need to tailor programmes to the specifics of each region [74]. In addition, the main implications of the research by Anselmi et al. [75] are that Europe is moving towards the Sustainable Development Goals in an uneven manner, and so there is a need to define an agenda that allows for greater cooperation between several countries.
The third research hypothesis states that the COVID-19 pandemic caused a decline in the degree of SDG8 implementation. This is consistent with the research conducted by Grzebyk et al. [70]. In the last year of their study, 2020, the effect of the COVID-19 pandemic was observed. Also, other conducted studies are consistent with H3 [16,17,18,19,20]. Research conducted by Shuai et al. [76] identified progress towards the SDG targets after COVID-19 in the period 2020–2024 by means of predicted GDP and population growth and machine learning models. They justified that the total implementation of the SDGs declined by 7.7% in 2020 globally, with the performance of the 12 socio-economic SDGs (including SDG8) declining by 3.0–22.3% and the performance of the 4 environmental SDGs increasing by 1.6–9.2%. By 2024, progress on the 12 Sustainable Development Goals (including SDG8) will be delayed by one to eight years in comparison with their pre-COVID-19 trajectories, while the 4 environmental SDGs will gain additional time. Only the trajectory of SDG5 remained unchanged.
6. Conclusions
Decent Work and Economic Growth remains central to the prosperity of countries. Emerging crises cause countries around the world, including in the European Union, to face unexpected challenges.
It follows that the sustainable development of European countries is not uniform. It depends on their level of economic development, political and historical circumstances and the level of development of society. It will be interesting to see whether all countries will reach their targets in 2030. Therefore, research in this area is worth continuing.
A study of this type has some limitations. On the one hand, data for individual SDGs are available in the Eurostat database and grouped accordingly. On the other hand, the individual targets overlap. Hence, the question arises whether other variables should not also be taken into account when assessing the degree of achievement of a selected SDG. It is also interesting to note the proposals in the literature for other indicators. However, it happens that the data needed for the determination of other types of indicators are not collected with sufficient frequency and concern, for example, five-year periods. In addition, the data used for the classic indicators are provided with a delay of at least one year. Having more up-to-date data is essential in order to make effective and timely policy decisions. Another critical aspect is the fair assignment of weights. Researchers are also not consensual in assigning weights to individual indicators. Their inclusion may contribute to interesting new research results.
The conducted research allowed the first research hypothesis to be positively verified. The regions of the European Union with the highest degree of SDG8 implementation were the Nordic countries together with the Netherlands. On the other hand, the countries of Southern and Southeastern Europe were characterised by the lowest degree of SDG8 implementation. The second research hypothesis could not be positively verified. The dynamics of change in the degree of SDG8 implementation did not depend on the geographic location of a country, and no clearly differentiated clusters could be identified. The positive verification of the third hypothesis indicates a negative impact of the COVID-19 pandemic on the level of SDG8 implementation in EU countries.
This analysis may also encourage us to draw some policy recommendations. Countries with a low level of the degree of SDG8 implementation should follow the realisation of policy with respect to the Nordic countries, as they are the best in this regard. In the need for analysing the dynamics of the degree of SDG8 implementation, Ireland should be considered, as in the case of this country the increase in the indicators was the highest. The conclusions of this research may have a number of implications for governing bodies and policy makers in EU governments. When SDG8 implementation is low, it is necessary to change the governance model and take rigorous action. It is also important to establish cooperation between good and weak countries in order to equalise the level of SDG8 implementation. There is a need to adapt policies and programmes to the specific needs and characteristics of each region. There is unlikely to be a one-size-fits-all approach to guarantee success. The specific economic, social and environmental circumstances of the regions must always be taken into account.
Author Contributions
Conceptualization, B.B.-S. and K.D.; methodology, B.B.-S. and K.D.; software, B.B.-S. and K.D.; validation, B.B.-S.; formal analysis, K.D.; investigation, B.B.-S. and K.D.; resources, B.B.-S. and K.D.; data curation, B.B.-S. and K.D.; writing—original draft preparation, B.B.-S. and K.D.; writing—review and editing, B.B.-S. and K.D.; visualization, K.D.; supervision, B.B.-S. All authors have read and agreed to the published version of the manuscript.
Funding
This research received no external funding.
Institutional Review Board Statement
Not applicable.
Informed Consent Statement
Not applicable.
Data Availability Statement
All data are from https://ec.europa.eu/eurostat/web/main/data/database (accessed on 15 December 2022).
Conflicts of Interest
The authors declare no conflict of interest.
References
- United Nations. Transforming Our World: The 2030 Agenda for Sustainable Development. UN General Assembley 70 Session. Available online: https://sustainabledevelopment.un.org/content/documents/21252030%20Agenda%20for%20Sustainable%20Development%20web.pdf (accessed on 15 September 2022).
- Alsayegh, M.F.; Ditta, A.; Mahmood, Z.; Kouser, R. The Role of Sustainability Reporting and Governance in Achieving Sustainable Development Goals: An International Investigation. Sustainability 2023, 15, 3531. [Google Scholar] [CrossRef]
- Ali, S.M.; Appolloni, A.; Cavallaro, F.; D’Adamo, I.; Di Vaio, A.; Ferella, F.; Gastaldi, M.; Ikram, M.; Kumar, N.M.; Martin, M.A.; et al. Development Goals towards Sustainability. Sustainability 2023, 15, 9443. [Google Scholar] [CrossRef]
- United Nations. Goal 8 | Department of Economic and Social Affairs. Available online: https://sdgs.un.org/goals/goal8 (accessed on 23 August 2022).
- Fonseca, L.M.; Domingues, J.P.; Dima, A.M. Mapping the sustainable development goals relationships. Sustainability 2020, 12, 3359. [Google Scholar] [CrossRef]
- Fatih, C. What Can SVAR Models Tell us About the Impact of Public Expenditure Shocks on Macroeconomic Variables in Algeria? A Slight Hint to the COVID-19 Pandemic. Folia Oecon. Stetin. 2021, 21, 21–37. [Google Scholar] [CrossRef]
- Bieszk-Stolorz, B.; Dmytrów, K. Assessment of the Similarity of the Situation in the EU Labour Markets and Their Changes in the Face of the COVID-19 Pandemic. Sustainability 2022, 14, 3646. [Google Scholar] [CrossRef]
- Machová, R.; Korcsmáros, E.; Marča, R.; Esseová, M. An International Analysis of Consumers’ Consciousness During the Covid-19 Pandemic in Slovakia and Hungary. Folia Oecon. Stetin. 2022, 22, 130–151. [Google Scholar] [CrossRef]
- Musa, H.; Rech, F.; Yan, C.; Musova, Z. The Deterioration of Financial Ratios During the COVID-19 Pandemic: Does Corporate Governance Matter? Folia Oecon. Stetin. 2022, 22, 219–242. [Google Scholar] [CrossRef]
- Streimikiene, D. Energy poverty and impact of Covid-19 pandemics in Visegrad (V4) countries. J. Int. Stud. 2022, 15, 9–25. [Google Scholar] [CrossRef]
- The Sustainable Development Goals Report 2021. Available online: https://unstats.un.org/sdgs/report/2021/ (accessed on 31 August 2022).
- Kreinin, H.; Aigner, E. From “Decent work and economic growth” to “Sustainable work and economic degrowth”: A new framework for SDG 8. Empirica 2022, 49, 281–311. [Google Scholar] [CrossRef]
- Bilek-Steindl, S.; Url, T. Nowcasting and monitoring SDG 8. Empirica 2022, 49, 313–345. [Google Scholar] [CrossRef] [PubMed]
- Marx, A.; Pertiwi, S.B.; Depoorter, C.; Hoornick, M.; Mursitama, T.N.; Otteburn, K.; Arnakim, L.Y. What role for regional organizations in goal-setting global governance? An analysis of the role of the European Union and ASEAN in the Sustainable Development Goals. GPPG 2021, 1, 421–445. [Google Scholar] [CrossRef]
- Marzouk, M.; Azab, S.; Elshaboury, N.; Megahed, A.; Metawie, M.; El-Hawary, M.; Ghaith, D.; Bayoumi, A.E.M. Modeling COVID-19 effects on SDGs using system dynamics in Egypt. Environ. Sci. Pollut. Res. 2022, 29, 59235–59246. [Google Scholar] [CrossRef] [PubMed]
- Alibegovic, M.; Cavalli, L.; Lizzi, G.; Romani, I.; Vergalli, S. COVID-19 & SDGs: Does the current pandemic have an impact on the 17 Sustainable Development Goals? A qualitative analysis. FEEM Policy Brief 2020, 7, 1–18. [Google Scholar]
- Shulla, K.; Voigt, B.F.; Cibian, S.; Scandone, G.; Martinez, E.; Nelkovski, F.; Salehi, P. Effects of COVID-19 on the Sustainable Development Goals (SDGs). Discov. Sustain. 2021, 2, 15. [Google Scholar] [CrossRef] [PubMed]
- Borrego, A.C.; Carreira, F.A.; Pardal, P.; Abreu, R. Social Responsibility and SDG 8 during the First Wave of the COVID-19 Pandemic: The Role of Chartered Accountants in Portugal. Sustainability 2022, 14, 8625. [Google Scholar] [CrossRef]
- Lucas, B.; Landman, T. Social listening, modern slavery, and COVID-19. J. Risk Res. 2021, 24, 314–334. [Google Scholar] [CrossRef]
- Ranjbari, M.; Esfandabadi, Z.S.; Zanetti, M.C.; Scagnelli, S.D.; Siebers, P.-O.; Aghbashlo, M.; Peng, W.; Quatraro, F.; Tabatabaei, M. Three pillars of sustainability in the wake of COVID-19: A systematic review and future research agenda for sustainable development. J. Clean. Prod. 2021, 297, 126660. [Google Scholar] [CrossRef]
- Ranjbari, M.; Esfandabadi, Z.S.; Scagnelli, S.D.; Siebers, P.-O.; Quatraro, F. Recovery agenda for sustainable development post COVID-19 at the country level: Developing a fuzzy action priority surface. Environ. Dev. Sustain. 2021, 23, 16646–16673. [Google Scholar] [CrossRef] [PubMed]
- Djankov, S.; Panizza, U. Developing economies after COVID-19: An introduction. In COVID-19 in Developing Economies; Centre for Economic Policy Research: London, UK, 2020; Volume 8. [Google Scholar]
- Ljungholm, D.P.; Olah, M.L. Regulating fake news content during COVID-19 pandemic: Evidence-based reality, trustworthy sources, and responsible media reporting. Rev. Contemp. Philos. 2020, 19, 43–49. [Google Scholar]
- Avdiu, B.; Nayyar, G. When face-to-face interactions become an occupational hazard: Jobs in the time of COVID-19. Econ. Lett. 2020, 197, 109648. [Google Scholar] [CrossRef]
- Clemente-Suárez, V.J.; Rodriguez-Besteiro, S.; Cabello-Eras, J.J.; Bustamante-Sanchez, A.; Navarro-Jiménez, E.; Donoso-Gonzalez, M.; Beltrán-Velasco, A.I.; Tornero-Aguilera, J.F. Sustainable Development Goals in the COVID-19 Pandemic: A Narrative Review. Sustainability 2022, 14, 7726. [Google Scholar] [CrossRef]
- Sciarra, C.; Chiarotti, G.; Ridolfi, L.; Laio, F. A network approach to rank countries chasing sustainable development. Sci. Rep. 2021, 11, 15441. [Google Scholar] [CrossRef] [PubMed]
- Sciarra, C.; Chiarotti, G.; Ridolf, L.; Laio, F. Reconciling contrasting views on economic complexity. Nat. Commun. 2020, 11, 3352. [Google Scholar] [CrossRef]
- Sachs, J.D.; Schmidt-Traub, G.; Kroll, C.; Lafortune, G.; Fuller, G.; Woelm, F. The Sustainable Development Goals and COVID-19. Sustainable Development Report 2020; Cambridge University Press: Cambridge, UK, 2020. [Google Scholar]
- Pakkan, S.; Sudhakar, C.; Tripathi, S.; Rao, M. A correlation study of sustainable development goal (SDG) interactions. Qual. Quant. 2023, 57, 1937–1956. [Google Scholar] [CrossRef] [PubMed]
- Bandari, R.; Moallemi, E.A.; Lester, R.E.; Downie, D.; Bryan, B.A. Prioritising Sustainable Development Goals, characterising interactions, and identifying solutions for local sustainability. Environ. Sci. Policy 2022, 127, 325–336. [Google Scholar] [CrossRef]
- Rai, S.M.; Brown, B.D.; Ruwanpura, K.N. SDG 8: Decent work and economic growth—A gendered analysis. World Dev. 2019, 113, 368–380. [Google Scholar] [CrossRef]
- Sezgin, F.H.; Tekin Turhan, G.; Sart, G.; Danilina, M. Impact of Financial Development and Remittances on Educational Attainment within the Context of Sustainable Development: A Panel Evidence from Emerging Markets. Sustainability 2023, 15, 12322. [Google Scholar] [CrossRef]
- Androniceanu, A.; Kinnunen, J.; Georgescu, I. Circular economy as a strategic option to promote sustainable economic growth and effective human development. J. Int. Stud. 2021, 14, 60–73. [Google Scholar] [CrossRef]
- Skvarciany, V.; Lapinskaite, I.; Volskyte, G. Circular economy as assistance for sustainable development in OECD countries. Oecon. Copernic. 2021, 12, 11–34. [Google Scholar] [CrossRef]
- Rodríguez-Antón, J.M.; Rubio-Andrada, L.; Celemín-Pedroche, M.S.; Ruíz-Peñalver, S.M. From the circular economy to the sustainable development goals in the European Union: An empirical comparison. Int. Environ. Agreem. 2022, 22, 67–95. [Google Scholar] [CrossRef] [PubMed]
- Jianu, E.; Pîrvu, R.; Axinte, G.; Toma, O.; Cojocaru, A.V.; Murtaza, F. EU Labor Market Inequalities and Sustainable Development Goals. Sustainability 2021, 13, 2675. [Google Scholar] [CrossRef]
- Coscieme, L.; Mortensen, L.F.; Anderson, S.; Ward, J.; Donohue, I.; Sutton, P.C. Going beyond Gross Domestic Product as an indicator to bring coherence to the Sustainable Development Goals. J. Clean. Prod. 2020, 248, 119232. [Google Scholar] [CrossRef]
- Hopp, D.; Fu, E.; Peltola, A. Feasibility of nowcasting SDG indicators: A comprehensive survey. Stat. J. IAOS 2022, 38, 591–608. [Google Scholar] [CrossRef]
- R Core Team. R: A Language and Environment for Statistical Computing; R Foundation for Statistical Computing: Vienna, Austria, 2020; Available online: https://www.R-project.org/ (accessed on 15 August 2022).
- Walesiak, M.; Dudek, A. The Choice of Variable Normalization Method in Cluster Analysis. In Education Excellence and Innovation Management: A 2025 Vision to Sustain Economic Development During Global Challenges; Soliman, K.S., Ed.; International Business Information Management Association: King of Prussia, PA, USA, 2020; pp. 325–340. [Google Scholar]
- Giorgino, T. Computing and Visualizing Dynamic Time Warping Alignments in R: The dtw Package. J. Stat. Softw. 2009, 31, 1–24. [Google Scholar] [CrossRef]
- Charrad, M.; Ghazzali, N.; Boiteau, V.; Niknafs, A. NbClust: An R Package for Determining the Relevant Number of Clusters in a Data Set. J. Stat. Softw. 2014, 61, 1–36. [Google Scholar] [CrossRef]
- Kassambara, A.; Mundt, F. factoextra: Extract and Visualize the Results of Multivariate Data Analyses. R Package Version 1.0.7. Available online: https://CRAN.R-project.org/package=factoextra (accessed on 15 August 2022).
- Ward, J.H., Jr. Hierarchical Grouping to Optimize an Objective Function. J. Am. Stat. Assoc. 1963, 58, 236–244. [Google Scholar] [CrossRef]
- Zavadskas, E.K.; Kaklauskas, A.; Sarka, V. The new method of multicriteria complex proportional assessment of projects. Technol. Econ. Dev. Econ. 1994, 1, 131–139. [Google Scholar]
- Trane, M.; Marelli, L.; Siragusa, A.; Pollo, R.; Lombardi, P. Progress by Research to Achieve the Sustainable Development Goals in the EU: A Systematic Literature Review. Sustainability 2023, 15, 7055. [Google Scholar] [CrossRef]
- Miola, A.; Schiltz, F. Measuring sustainable development goals performance: How to monitor policy action in the 2030 Agenda implementation? Ecol. Econ. 2019, 164, 106373. [Google Scholar] [CrossRef]
- Tutak, M.; Brodny, J.; Bindzár, P. Assessing the Level of Energy and Climate Sustainability in the European Union Countries in the Context of the European Green Deal Strategy and Agenda 2030. Energies 2021, 14, 1767. [Google Scholar] [CrossRef]
- Radulescu, C.Z.; Radulescu, M.; Boncea, R. A Multi-Criteria Decision Support and Application to the Evaluation of the Fourth Wave of COVID-19 Pandemic. Entropy 2022, 24, 642. [Google Scholar] [CrossRef]
- Ünvan, Y.A.; Ergenç, C. Financial Performance Analysis with the Fuzzy COPRAS and Entropy-COPRAS Approaches. Comput. Econ. 2022, 59, 1577–1605. [Google Scholar] [CrossRef]
- Xie, Z.; Tian, G.; Tao, Y. A Multi-Criteria Decision-Making Framework for Sustainable Supplier Selection in the Circular Economy and Industry 4.0 Era. Sustainability 2022, 14, 16809. [Google Scholar] [CrossRef]
- Bellman, R.; Kalaba, R. On adaptive control processes. IRE Trans. Automat. Control 1959, 4, 1–9. [Google Scholar] [CrossRef]
- Rabiner, L.; Rosenberg, A.; Levinson, S. Considerations in dynamic time warping algorithms for discrete word recognition. IEEE Trans. Audio Speech Lang. Process. 1978, 26, 575–582. [Google Scholar] [CrossRef]
- Sakoe, H.; Chiba, S. Dynamic programming algorithm optimization for spoken word recognition. IEEE Trans. Audio Speech Lang. Process. 1978, 26, 43–49. [Google Scholar] [CrossRef]
- Stübinger, J. Statistical arbitrage with optimal causal paths on high-frequency data of the S&P 500. Quant. Financ. 2019, 19, 921–935. [Google Scholar] [CrossRef]
- Denkowska, A.; Wanat, S. Dynamic Time Warping Algorithm in Modeling Systemic Risk in the European Insurance Sector. Entropy 2021, 23, 1022. [Google Scholar] [CrossRef] [PubMed]
- Šťastný, T.; Koudelka, J.; Bílková, D.; Marek, L. Clustering and Modelling of the Top 30 Cryptocurrency Prices Using Dynamic Time Warping and Machine Learning Methods. Mathematics 2022, 10, 3672. [Google Scholar] [CrossRef]
- Dmytrów, K.; Bieszk-Stolorz, B. Mutual relationships between the unemployment rate and the unemployment duration in the Visegrad Group countries in years 2001–2017. Equilib. Q. J. Econ. Econ. Policy 2019, 14, 129–148. [Google Scholar] [CrossRef]
- Dmytrów, K.; Bieszk-Stolorz, B. Comparison of changes in the labour markets of post-communist countries with other EU member states. Equilib. Q. J. Econ. Econ. Policy 2021, 16, 741–764. [Google Scholar] [CrossRef]
- Dmytrów, K.; Landmesser, J.; Bieszk-Stolorz, B. The Connections between COVID-19 and the Energy Commodities Prices: Evidence through the Dynamic Time Warping Method. Energies 2021, 14, 4024. [Google Scholar] [CrossRef]
- Dmytrów, K.; Bieszk-Stolorz, B.; Landmesser-Rusek, J. Sustainable Energy in European Countries: Analysis of Sustainable Development Goal 7 Using the Dynamic Time Warping Method. Energies 2022, 15, 7756. [Google Scholar] [CrossRef]
- Cui, Y.; Zhu, Z.; Zhao, X.; Li, Z. Energy Schedule Setting Based on Clustering Algorithm and Pattern Recognition for Non-Residential Buildings Electricity Energy Consumption. Sustainability 2023, 15, 8750. [Google Scholar] [CrossRef]
- Beale, E.M.L. Cluster Analysis; Scientific Control Systems: London, UK, 1969. [Google Scholar]
- Rocchi, L.; Ricciolini, E.; Massei, G.; Paolotti, L.; Boggia, A. Towards the 2030 Agenda: Measuring the Progress of the European Union Countries through the SDGs Achievement Index. Sustainability 2022, 14, 3563. [Google Scholar] [CrossRef]
- Barbier, E.B.; Burgess, J.C. Institutional Quality, Governance and Progress towards the SDGs. Sustainability 2021, 13, 11798. [Google Scholar] [CrossRef]
- Radulović, M.; Kostić, M. Are EU Members’ Economies an “Engine” of the EU Candidates’ Economies? Folia Oecon. Stetin. 2021, 21, 97–117. [Google Scholar] [CrossRef]
- Stanujkic, D.; Popovic, G.; Zavadskas, E.K.; Karabasevic, D.; Binkyte-Veliene, A. Assessment of Progress towards Achieving Sustainable Development Goals of the “Agenda 2030” by Using the CoCoSo and the Shannon Entropy Methods: The Case of the EU Countries. Sustainability 2020, 12, 5717. [Google Scholar] [CrossRef]
- Bąk, I.; Tarczyńska-Łuniewska, M.; Barwińska-Małajowicz, A.; Hydzik, P.; Kusz, D. Is Energy Use in the EU Countries Moving toward Sustainable Development? Energies 2022, 15, 6009. [Google Scholar] [CrossRef]
- Skvarciany, V.; Astikė, K. Decent work and economic growth: Case of EU. In Proceedings of the 12TH International Scientific Conference Business and Management 2022, Vilnius, Lithuania, 12–13 May 2022; pp. 184–190. [Google Scholar] [CrossRef]
- Grzebyk, M.; Stec, M.; Hejdukova, P. Implementation of sustainable development goal 8 in European Union countries—A measurement concept and a multivariate comparative analysis. Sustain. Dev. 2023, 31, 2758–2769. [Google Scholar] [CrossRef]
- Carlsen, L. Decent Work and Economic Growth in the European Union. A partial order analysis of Eurostat SDG 8 data. Green Financ. 2021, 3, 483–494. [Google Scholar] [CrossRef]
- Kuc-Czarnecka, M.; Markowicz, I.; Sompolska-Rzechuła, A. SDGs implementation, their synergies, and trade-offs in EU countries–Sensitivity analysis-based approach. Ecol. Indic. 2023, 146, 109888. [Google Scholar] [CrossRef]
- D’Adamo, I.; Gastaldi, M.; Morone, P. Economic sustainable development goals: Assessments and perspectives in Europe. J. Clean. Prod. 2022, 354, 131730. [Google Scholar] [CrossRef]
- Chamusca, P. Public Policies for Territorial Cohesion and Sustainability in Europe: An Overview. Sustainability 2023, 15, 6890. [Google Scholar] [CrossRef]
- Anselmi, D.; D’Adamo, I.; Gastaldi, M.; Lombardi, G.V. A comparison of economic, environmental and social performance of European countries: A sustainable development goal index. Environ. Dev. Sustain. 2023; in press. [Google Scholar] [CrossRef]
- Shuai, C.; Zhao, B.; Chen, X.; Liu, J.; Zheng, C.; Qu, S.; Zou, J.-P.; Xu, M. Quantifying the impacts of COVID-19 on Sustainable Development Goals using machine learning models. Fundam. Res. 2022; in press. [Google Scholar] [CrossRef]
Disclaimer/Publisher’s Note: The statements, opinions and data contained in all publications are solely those of the individual author(s) and contributor(s) and not of MDPI and/or the editor(s). MDPI and/or the editor(s) disclaim responsibility for any injury to people or property resulting from any ideas, methods, instructions or products referred to in the content. |
© 2023 by the authors. Licensee MDPI, Basel, Switzerland. This article is an open access article distributed under the terms and conditions of the Creative Commons Attribution (CC BY) license (https://creativecommons.org/licenses/by/4.0/).