Abstract
Together with the research and development of belt conveyors, diagnostic methods for their reliable operation have been developed. Our research is focused on the development of a diagnostic system and method of sensing the magnetic markers implemented directly into the conveyor belt, as in this way, it is possible to determine the velocity of the conveyor belt, which can be a source of information about the potential malfunction of the drive unit, control system, or of the belt itself. The magnetic markers can be also used to mark the particular segments of the conveyor belt, which can significantly enhance maintenance procedures thanks to the identification of damaged segments and the possibility to stop the conveyor belt in the maintenance area. However, problems can occur with the implementation of the magnetic markers. To prevent the magnetic markers from falling out, FEM (finite element method) simulations and analyses of commercially available magnetic markers with different dimensions were performed to analyze the nominal and friction force and related average contact pressure acting on the magnetic markers implemented into holes drilled into the conveyor belt in the curved state when passing through the drum.
1. Introduction
Conveyor belt transportation systems have been widely used in many applications, from simple belt conveyors that can be found in supermarkets, to complex airport belt conveyor systems. In general, belt conveyors support the idea of sustainable transportation, as according to many sources, they make a positive contribution to environmental and economic issues; as belt conveyors in general produce only limited emissions, they can use renewable resources for their operation, while minimizing the impact on the environment and the generation of noise. Furthermore, considering pipe conveyor belts, they can be used for the transportation of dust materials and eliminate air pollution, which is especially important in urban areas. Their economic sustainability lies mainly in their operation; conveyor belts represent a cost-efficient transportation mode, and support not only logistics inside companies, but also sustainable transportation at the regional level.
In some cases, mainly considering belt conveyor utilization in industrial applications, difficult operational conditions have to be considered. To avoid outages of the belt conveyors that can cause significant financial losses, together with the development of belt conveyors, convenient diagnostic methods have to also be developed as diagnostics allows obtaining information about the technical condition of the main components of the belt conveyor, using the results of which the control system can adapt to changing conditions [1]. Research in the area of diagnostics is focused on the different components and parts of belt conveyors and also on the different diagnostic methods based on various physical principles. The most characteristic design feature is the fact that thousands of idlers support the moving belt. One of the critical elements of an idler is the rolling element bearing, which requires monitoring and diagnostics to prevent potential failure. Roller damage detection can be analyzed using, for example, a measurement of the jacket’s vibrations of rollers [2] or the transverse vibrations [3]. Research is also focused on the diagnostics of the technical condition of gearboxes of belt conveyors because they can increase the reliability of the conveyor belt system significantly, especially considering gear units for variable-frequency drives [4]. In practice, the most convenient seems to be the integrated approach of diagnostics based on vibration and television methods; a method of analyzing impurity in greasing liquid is given in [5], particularly in connection with the appropriate information systems for the rational management of the belt conveyor [6]. The utilization possibilities of inspection robots for the autonomous monitoring of conveyor belt conditions also hold a great deal of potential and are much discussed. They can perform, for example, noninvasive vibration [7] or acoustic [8,9] measurements on the gearbox housing even in harsh operational conditions; applying diagnostic features based on time-frequency analysis and the suitable filtering method based on the developed diagnostic algorithms, the diagnostic results can enhance the functionalities of the diagnostic system and the resistance to demanding operational conditions [10]. One of the novel methods for the inspection of idlers is based on rotational speed measurement and related image data analysis [11]. The relation is assumed to be that the rotation speed decreases due to internal defects. As this methodology is also based on remote sensing, it can be effectively applied in mobile inspection robots such as unmanned aerial vehicles (UAVs) or unmanned ground vehicles (UGVs). Together with the advances in remote sensing methods and utilization of robots and unmanned systems, it is necessary to develop energy-efficient technologies and possibilities for their application in machinery condition monitoring, including long-range, reliable, and cost-effective radio modules; mesh networking capabilities; contactless battery systems allowing convenient and safe infield battery replacement; and systematic approaches to data processing including signal conditioning and validation [12].
Other research is focused on the fault diagnostics of the drive units. The actual condition of the conveyor power unit can be determined, for example, from thermal images [13] obtained with a thermal imaging camera or from optoelectronic current transformers used as information sensors for the control and protection systems of induction motors [14]. Another possibility is to retrieve information from current sensors and/or voltage sensors located in the input line of the motor to detect irregular behaviors [15]. Considering the approach based on multisensor information fusion, the challenge is also to correctly recognize the current state and to design an intelligent decision-making system based on the combination of the multisource information [16,17]. Consequently, it is possible to effectively describe the fault type and to achieve strong operability in the systems. Monitoring the belt conveyor drive motor electrical parameters [18] or the reductors [19] can also serve as a basis for predictive diagnostics to detect anomalies and possible defects, so it is possible to fix them before they result in a failure.
However, the working element of any conveyor is the belt. Damage to this element causes costly downtimes in the operation of the transport system. Due to the working conditions, which can be highly demanding if we consider industrial applications, and contact with the material, it is exposed to damage. Proper operation can be the way to effectively extend the life cycle of a belt. An overview of the types of belt damage, together with a classification of their causes and methods of prevention and condition monitoring, is presented in [20]. Conducting conveyor belt diagnostics without the need to take the belt off the conveyor and test it in laboratory conditions is a very important aspect. One of the possibilities allowing on-site diagnostics is current testing, and thus, obtaining knowledge about the current thickness of the conveyor belt is necessary [21].
Together with the development of diagnostics methods, methods for the evaluation of conveyor belt damage have also been studied. For example, in [22], an artificial-intelligence-based approach based on the two-layer neural network implemented in MATLAB using the Deep Learning Toolbox set is presented. Other method is based on the support vector machine, which is a powerful supervised machine learning algorithm for classification in fault diagnosis that uses the grey wolf optimizer approach for optimizing the support vector machine’s parameters [23].
Some of the very promising methodologies used for the monitoring and/or diagnostics of belt conveyors are methods based on magnetic sensors. They can be very effectively used for the monitoring of magnetic materials (for example, steel cords based on weak magnetic field constant nondestructive testing) and adopt a sensor array with horizontal and vertical transducers to guarantee accuracy in the fault location and amplitude [24]. A similar approach is also presented in [25,26], a belt conveyor monitoring system that measures and processes data from an array of magnetic sensors using automatic algorithms to process them, in order to obtain information about the beginning of the belt loop, the location of joints of particular belt segments, and the final location and size of corrosion or cutting damage to the steel cords inside the belts. Digital magnetic imaging technology of steel cord belts based on magnetic imaging technology with a multisensor array called MYRIAD is described in detail in [27]. A very interesting solution is based on a vibration sensor that relies on mechanical vibration to monitor its operational stability, for the purpose of preventing mechanical failure using a self-powered mechanical vibration sensor, and based on the coupling of an electromagnetic generator with a magnetic levitation system that can easily respond to tiny external mechanical vibrations for energy harvesting and a triboelectric nanogenerator for active sensing [28]. The magnetic module of the DiagBelt system, also involving a vision, prediction, rip detective (prevention), and safety factor module, is able to automatically and precisely detect the location of defects along the belt axis and on the belt section [29]. However, in addition to using a magnetic sensor for the diagnostics of magnetic materials used to construct the belt conveyors, magnetic sensors can be also used for the diagnostics of the hyperelastic parts of conveyor belts, for example, using the magnetic markers, e.g., in the form of magnetic microwires [30].
The main advantages of magnetic sensing lie in the possibility of contactless sensing, the possibility of the nondestructive diagnostics or inspection, and the reliability of the obtained data. Therefore, attention in this area is paid to the development of different types of magnetic sensors based, for example, on eddy current sensing [31], the giant magnetoresistance phenomenon [32], or electromagnetic encoders [33], and also related methods used for increasing the resolution of obtained data [34,35] to reveal hidden defects [36] and damage [37] of different materials.
Our research is focused on a diagnostic system of conveyor belts, which is based on magnetic markers implemented directly into the conveyor belt. In this way, it is possible to also monitor nonmagnetic hyperelastic belts and to evaluate parameters such as operational load monitoring, monitoring the wear or damage of conveyor belts, and also for the effective planning of maintenance procedures. Another application possibility in regard to belt conveyors is the utilization of the magnetic markers, for example, for the determination of the velocity of conveyor belts or to mark particular segments of the belt conveyor, which enables a quick identification of the damaged segments. Another application can be stopping the conveyor belt directly in the maintenance area, which can reduce the maintenance time significantly. Furthermore, the measurement of the velocity of the conveyor belt’s movement can also indicate the potential problems with the conveyor belt’s power or control systems. However, considering the application of magnetic markers in practice, several issues have to be solved. Our research has been focused on the implementation of magnetic microwires in the role of magnetic markers, directly into the conveyor belt during the manufacturing process. These kinds of magnetic markers have several advantages: they can be implemented directly into the structure of the belt, and thanks to the dimensions of the magnetic microwires (for our purposes, the diameter of the microwire was up to several tenths of a micrometer with a length of approximately 2 cm), they cause no significant structural changes to the conveyor belt and, furthermore, thanks to the glass coating of the magnetic microwires [30], their reliable utilization during the whole operational life of the conveyor belt can be expected.
To support the idea of sustainable transportation, there is also a need to monitor belt conveyors that have already been in operation to prevent failures and malfunctions, and to increase their operational time as one of the key economic parameters. In this case, the implementation of magnetic microwires is not a suitable solution. The most convenient solution for this situation seems to be the implementation of magnetic markers directly into the conveyor belt. However, the placement of magnetic markers in practice can be a very challenging task. Although magnetic markers were embedded into the conveyor belt and glued, due to the demanding operational conditions of many types of industrial conveyor belts and also due to the passing of the belt through the conveyor belt drums, the experimental operation showed that the magnetic markers can drop out from their position, which can result in a serious problem in the diagnostic system. Therefore, the main goal of this part of our research presented in the article was to analyze the most convenient dimensions of the magnetic markers, together with the methodology of their implementation into the conveyor belt transportation systems.
2. Materials and Methods
2.1. Belt Conveyor
Our experimental research was performed on the belt conveyor located at the Faculty of Mining, Ecology, Process Control and Geotechnologies of the Technical University of Košice. The whole experimental system was modular; therefore, it was possible to mount and demount the structural parts of the system, including the drum, and to place the parts into the desired positions. In our case, the drum diameter was 400 mm; the maximum width of the installed belt was 400 mm and its thickness was 8 mm. The details of the drum of the experimental belt conveyor, together with the CAD model of the belt conveyor drum, can be seen in Figure 1.
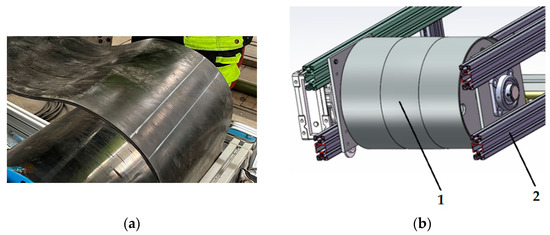
Figure 1.
Experimental belt conveyor. (a) Conveyor belt drum; (b) CAD (computer-aided design) model of the drum of the experimental belt conveyor. 1. Drive drum (Ø 400 mm/469 mm) with a 1.1 kW bevel gearbox, allowing smooth speed regulation in the range of 0–1.6 m·s−1. 2. The modular aluminum frame of the belt conveyor ensures sufficient rigidity in the entire belt conveyor transportation system.
2.2. FEM (Finite Element Method) Model of the Conveyor Belt Segment with the Implemented Magnetic Marker
The calculation model consists of a magnetic marker created from a cylindrical neodymium magnet with a diameter of 4 mm and a length of 4 mm inserted into a cylindrical hole of the same dimensions. The hole was created by drilling into the hyperelastic material of the conveyor belt in a curved state when passing through the drum of the belt conveyor, as can be seen in Figure 2. Consequently, the hole was glued. When the conveyor belt was straightened after passing through the drum, the creation of pressure on the magnet was ensured, which also helped to keep the magnet in the desired position to prevent it from falling out.
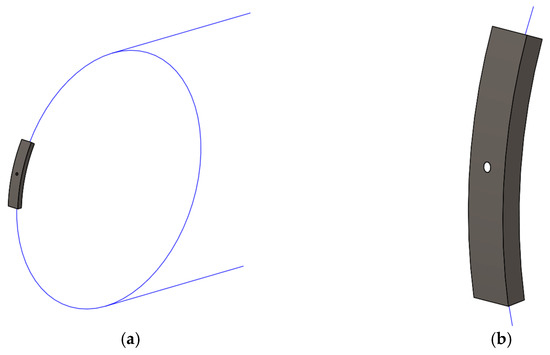
Figure 2.
CAE (computer-aided engineering) model. (a) Conveyor belt with the embedded magnetic marker in a curved state when passing through the drum; (b) Detail of the hole with the magnetic marker drilled into the conveyor belt.
The strength calculations in the Creo-Simulate module are based on the method of geometric element analysis, the principle of which is based on dividing the analyzed volume into the elements that precisely respect the created 3D model. The Creo-Simulate Structure module involves the possibility of generating the mesh from the elements automatically. The AutoGEM tool includes various settings that allow adjusting the created finite element mesh. In our case, as can be seen in Figure 3, for the calculation model with the magnetic marker of a diameter of 4 mm, 8605 volume elements of the tetra type with a size of 3 mm were used in total.
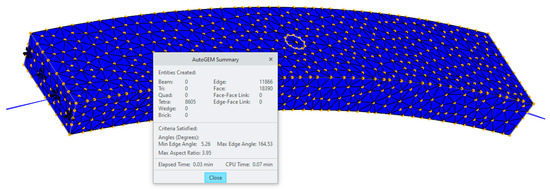
Figure 3.
Created 3D mesh model of the conveyor belt with the embedded magnetic marker in a curved state when passing through the drum.
To achieve the required accuracy in the calculation results by applying the method of geometric elements, adaptive P-technology was used. To ensure high-quality results, the adaptive finite element methods use the methodology based on error theory, modifying the finite element network during the solution process in order to determine the approximate solution within certain ranges from the “real” solution of a continuous problem. In practice, it means that during the calculation, the calculated values a, b, c, corresponding to the deformation, stress energy, and root mean square value of the stress, respectively, are compared. The edges of the particular elements are divided into the same number of segments, and the verification is performed in these particular points.
In Figure 4, the principle of edge dividing, together with the principle of increasing the calculation accuracy by increasing the polynomial degree of the base functions, is shown. The calculated values in the n-th iteration are compared with the values from the previous iteration step until the set convergence accuracy is achieved. If not, the polynomial degree is gradually increased up to the maximum value of 9. The default value of the polynomial degree is 6 and the accuracy of the calculation (convergence) is 10%. If necessary, these values can be adjusted.
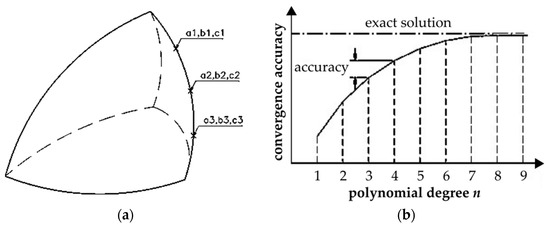
Figure 4.
Principle of (a) Edge dividing; (b) Increasing the calculation accuracy by increasing the polynomial degree.
As can be seen in Figure 5, the calculation model was loaded with the deformation caused by the straightening of the conveyor belt after its passing through the drum. Considering the drum diameter of 400 mm, this deformation Dy was equal to 23 mm.
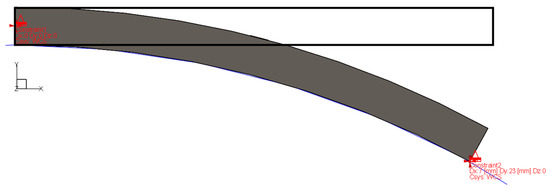
Figure 5.
The 3D calculation model with the applied deformation.
Considering the created calculation model, for the magnetic marker, the isotropic material properties were chosen and for the conveyor belt, the isotropic hyperelastic material properties from the PTC material library of the Creo-Simulate 7.0 software were chosen. The applied material characteristics of isotropic and isotropic hyperelastic materials are summarized in Table 1.

Table 1.
Applied material characteristics.
As can be seen from Table 1, for the calculations in our case, the Mooney–Rivlin hyperelastic material law was applied:
where W is the strain energy function; I1 and I2 are stretch invariants; C10, C01, and D1 are material constants determined by tests; and Je is the elastic volume ratio.
In general, the strain energy density function in the hyperelastic material is a function of the stretch invariants or principal stretch ratios. The constraints on the strain energy function W are as follows:
- Zero strain = Zero energy: W(0) = 0 (no energy is stored if not loaded).
- Zero strain = Zero stress: W′(0) = 0 (unloaded condition).
- The second derivative must be positive: W″(ε) = σ′(ε) > 0 for all ε, because stress σ always increases if strain ε increases; otherwise, it means instability.
If the D1 value is zero, it means that the material is incompressible. Creo-Simulate internally used D1 = 1/(500 × G0), which corresponds to a Poisson ratio of 0.4995. The elastic volume ratio Je can be calculated as follows:
where J is the total volumetric ratio and Jth is the thermal volume ratio.
The initial shear and initial bulk modulus can be described with the help of the material constants. For the Mooney–Rivlin material model, the initial shear modulus G0 becomes:
The Poisson ratio used in the analysis can be determined from the used values for the initial shear modulus G0 and initial bulk modulus K0 using the equation:
Finally, Creo-Simulate uses the above-mentioned p-degree finite element implementation to analyze hyperelastic materials. One of the advantages is that no special procedure is needed when the Poisson’s ratio approaches 0.5. If the value specified for D1 = 2/K0 is less than 1/500 × G0, Creo-Simulate uses this value as the limit for D1. So, we obtain the following for the maximum possible Poisson’s ratio used to approximate the ideal incompressibility:
2.3. Diagnostic System of the Conveyor Belt
The diagnostic system of the conveyor belt is based on the 4th generation of VEMA magnetometers, which is an original result of the research and development activities of the Faculty of Aeronautics of the Technical University of Košice in cooperation with the company EDIS vvd, Košice, Slovakia. From the point of view of the functional principle, the VEMA magnetometer belongs to the fluxgate magnetometers, which use a sharp transition of the magnetic core into the saturation region, i.e., so-called magnetic flux gating. Compared to other types of fluxgate magnetometers, the relaxation principle of the magnetic field sensing in the VEMA magnetometers uses the conversion of the magnetic field measurement to a measurement of the difference in the time intervals of the relaxation of the accumulated energy in the sensor core to the connected load. The laboratory tests and the optimization of the new VEMA magnetometer electronics are currently in progress and use directly integrated diodes in the digital optocoupler for the relaxation, thus reducing the complexity of the sensing chain [38]. A new sensor excitation system is also integrated in the tested electronics, which uses a three-state current source based on a single excitation current reference and a complementary bridge of the field-controlled transistors, which suppresses noise more effectively when using the time interval difference measurement.
Thanks to the construction, it is possible to use both resistive and capacitive loads, but so far, the best results have been achieved with a parametric load in the form of two anti-parallel-connected diodes, whose signals are accordingly demasked with respect to the excitation signals. A new sensor excitation system is also integrated in the tested electronics, which uses a three-state current source based on a single excitation current reference and a complementary bridge of field-controlled transistors, which more fully suppresses noise when using a time interval difference measurement.
The relaxation principle of the VEMA magnetometer provides, thanks to its functional principle and electronics, the possibility of applying a part of the conveyor belt diagnostic systems, while advanced digital processing algorithms related to the simultaneity of measurements of anomalous magnetic fields are used for the signal processing. In this application, it serves as the basis of a technology verified in laboratory conditions for detecting the magnetic markers embedded in the belt conveyor.
The main advantage of this solution in comparison to the other methods of magnetic marker sensing is that the VEMA series of magnetometers, that have been developed in our department, have been applied in practice in industrial applications for more than 30 years [39]. Transferring the technology of the VEMA series magnetometers into practice is performed in co-operation with the EDIS vvd. company, Košice, Slovakia. Currently, the VEMA magnetometers have been used not only for laboratory measurements in the role of the precise four-channel magnetometers with a resolution better than 1 × 10⁻⁹ T, a min. frequency range of 250 Hz, direct range without sensitivity switching of 100 µT, and a linearity better than 0.5% FS, but they have also been used in HFT systems (indicators of ferromagnetic objects), which are computer-controlled magnetometric digital devices equipped with algorithms for recognizing the presence of ferromagnetic objects on the belt conveyors. They are designed for extremely difficult environmental, vibrational, dusty, and above all magnetic, operating conditions. The main task of the HFT system is to protect the belt conveyors and the technological devices from the damage caused by pieces of iron found in the transported material. As the HFT systems based on the developed magnetometers have been in operation for more than 30 years, for detecting the magnetic markers, the same measurement principle was also chosen in our diagnostic systems in spite of the higher price in comparison, for example, with the different types of MEMS (Micro-Electro-Mechanical System) devices because, in our case, the reliability of the whole systems was the key factor.
For the experimental measurements, neodymium cylindrical magnets in the role of magnetic markers were used. The magnetic properties are characterized according to the manufacturer-MAGSY, Púchov, Slovakia as VMM4-N35 and the cylinders were magnetized in parallel with their axis. The temperature resistivity was 80 °C. The distance between the magnetic markers in the practical operation has to be set according to the operational conditions of the conveyor belt and is mainly dependent on the velocity of the conveyor belt. The expected mechanical or impact loading of the conveyor belt belongs to the other important factors.
3. Results
The proof-of-concept measurements were performed on the experimental belt conveyor and confirmed the assumption that the magnetic marker must have a sufficient magnetic moment to be reliably detected. The measurement results visualized in Figure 6 show a part of the measurement record representing the change in the magnetic field measured on the inner side of the tension roller of the conveyor belt.
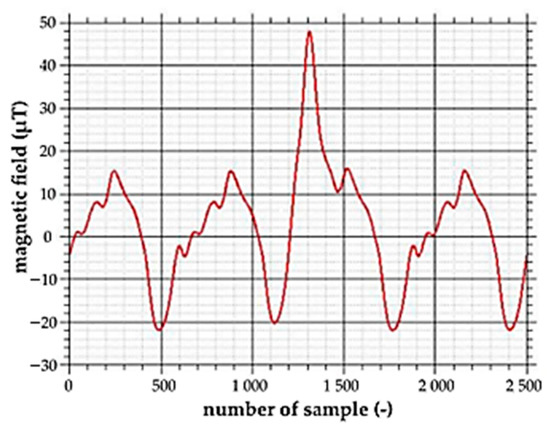
Figure 6.
Measurement of the magnetic field on the experimental conveyor belt with the embedded magnetic marker.
From the measurement results, it can be seen that the amplitude of the magnetic field signal, which was induced by the passing of the magnetic marker, is almost twice that of the signal induced by the rotation of the belt conveyor cylinder. It is, therefore, possible to reliably detect the passing of magnetic markers implemented with the required spacings even in demanding operational conditions with significant interference or noise caused by the movable or rotating ferromagnetic parts of the belt conveyors. The obtained information can be consequently used to calculate the distances between the magnetic markers, and from these distances, it is possible to determine the speed of the conveyor belt, to detect the overloading of the conveyor belt, or to determine areas where there is a risk of conveyor belt damage, which are important factors for the predictive maintenance of the conveyor belt. Furthermore, thanks to the magnetic markers, the conveyor belt can be stopped directly at the intended place for its maintenance.
However, during the experimental operation of the belt conveyor with the embedded magnetic markers, the problem of the magnets falling out occurred. Therefore, further research was focused on the integration of the magnetic markers into the hyperelastic material of the conveyor belt.
After passing the conveyor belt through the drum, the belt was straightened, which caused contact pressure on the cylindrical magnet inserted into the belt. The created stress–strain state was analyzed using FEM (finite element method) analysis in the Creo-Simulate 7.0 software, the results of which can be seen in the following figures.
In Figure 7, the segment of the conveyor belt with the implemented magnetic marker can be seen, along with a visualization of the deformation created after straightening the belt. From the calculated simulation results, it is clear that from the initial curving of the conveyor belt segment until its straightening, the deformation reached a value of 24.13 mm.
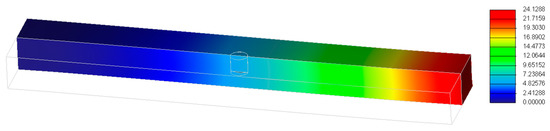
Figure 7.
Deformation (in mm) of the conveyor belt segment after passing through the drum.
The corresponding calculated von Mises stress from straightening the conveyor belt segment with the integrated magnetic marker after passing through the drum can be seen in Figure 8. From the simulation results, it can be seen that higher values of the stresses can be observed in the upper part of the magnetic marker, which were caused by the contact pressure created after straightening the conveyor belt and by the creation of pressure on the magnet from the hyperelastic material of the belt in the specified position. The values of the corresponding contact pressure on the contact surfaces created between the magnet and the hyperelastic material are shown in Figure 9.
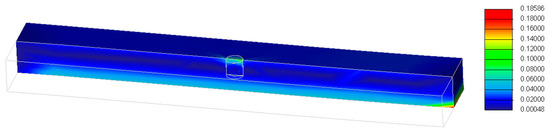
Figure 8.
Von Mises stress (in MPa) of the conveyor belt segment after passing through the drum.
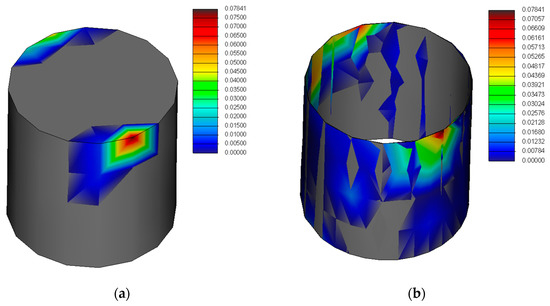
Figure 9.
Contact pressure (in MPa). (a) On the wall of the cylindrical magnetic marker (diameter 4 mm, height 4 mm); (b) On the contact surfaces between the magnetic marker and the cylindrical hole, into which the magnetic marker is inserted.
The highest value of the contact pressure was in the upper part of the magnet, in the same area, where the von Mises stress value also increased. This area represents the surface, where the greatest pressure is acting on the magnetic marker exerted by the hyperelastic material of the conveyor belt after its passing through the drum and its subsequent straightening.
The contact cylindrical surface between the magnet and the hole in the hyperelastic material of conveyor belt A had a size of 50.2655 mm2. The average value of the calculated contact pressure p on this surface was approximately 0.04 MPa. The size of the normal force N in this case would be:
This means that the normal force would be 2 N. The size of the friction force F between the contact surfaces of the magnet and the cylindrical hole, into which the magnet is inserted, with the assumed coefficient of friction f = 0.6 in terms of shear, can be calculated as:
which represents a value of 1.2 N. It is the minimum force that must be overcome to eject the magnet from the hole, considering the conditions that the magnet is not additionally secured against ejection in another way, for example by using glue or the vulcanization of the belt.
For a comparison, the numerical analyses and simulations were also performed with magnetic markers of different dimensions. In Figure 10, the simulation results of the cylindrical magnetic marker with a height of 2.5 mm and a diameter of 19 mm can be seen.
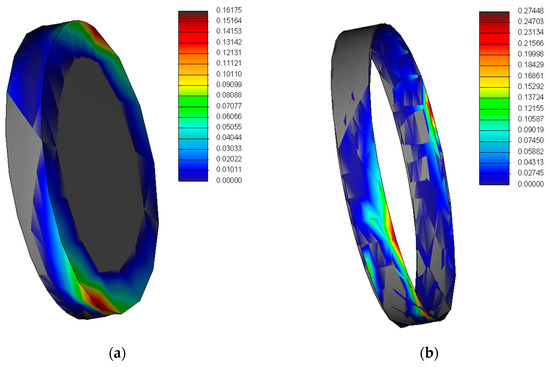
Figure 10.
Contact pressure (in MPa) (a) on the wall of the cylindrical magnetic marker (diameter 19 mm, height 2.5 mm); (b) on the contact surfaces between the magnetic marker and the cylindrical hole, into which the magnetic marker is inserted.
In this case, the contact surface between the magnetic marker and the conveyor belt was three times larger in comparison to the reference magnetic marker. The calculated normal force was 22.38 N and the friction force in this case was much higher—it reached a value of 13.4 N. The average contact pressure of this magnetic marker was 0.15 MPa. In Figure 11, the simulation results of other commercially available cylindrical magnetic markers with a diameter of 2 mm and a height of 5 mm can be seen. From the performed analysis, it was determined that the nominal force was only 1.57 N, the friction force was 0.9 N, and the average contact pressure in this case reached a value of 0.05 MPa.
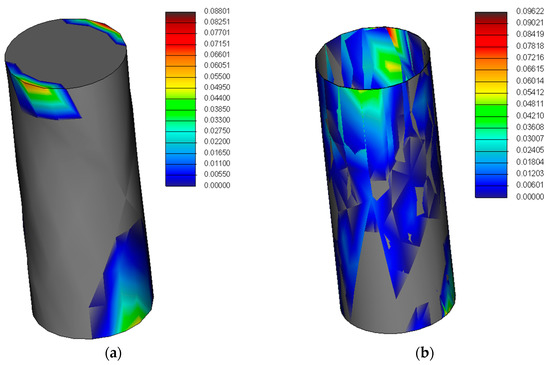
Figure 11.
Contact pressure (in MPa) (a) on the wall of the cylindrical magnetic marker (diameter 2 mm, height 5 mm); (b) on the contact surfaces between the magnetic marker and the cylindrical hole, into which the magnetic marker is inserted.
An overview of the FEM analysis results of the cylindrical magnetic markers with different dimensions is summarized in Table 2.
Table 2.
Comparison of magnetic markers with different dimensions.
4. Discussion
Sustainable belt conveyors have many environmental and economic benefits that can accelerate sustainable development at a company but also at the regional level. However, their fair and efficient operation is dependent on their continuous and reliable operation. Therefore, many types of monitoring and diagnostic systems have been developed. Our goal is to support the idea of sustainability not only with the design and implementation of a diagnostic system into new belt conveyors, but also by offering a solution to existing belt conveyors that have already been in operation. Therefore, modifying the developed monitoring system, which is based on the implementation of magnetic microwires to also sense magnetic markers created from permanent magnets, was necessary.
Experimental measurements performed on the experimental belt conveyor confirmed the assumption that the magnetic markers with the chosen dimensions can be reliably detected by the developed magnetometer, even in the presence of significant interference. Furthermore, due to the applied modified induction method of sensing, magnetic markers can also be applied in difficult operational and environmental conditions that are often present during industrial use.
However, problems occurred during the long-term operation of the belt conveyor, when it was found out that the magnetic markers could fall out of the conveyor belt. As the experimental conveyor belt transportation system is modular—which means that different types of belts with different widths, various belt velocities, and also different positions of the support parts of the systems were tested—we have not statistically evaluated the specific indexes or alert index values yet. Additionally, although the magnetic markers falling out has not been a common phenomenon in the laboratory conditions, because of the conveyor belt operating in difficult environmental conditions with wide temperature, humidity, and dust ranges, or in conditions with expected high values of mechanical or impact loading, this infrequent problem also has to be considered. This is important not only due to the implementation of the verification algorithm into the signal and data processing algorithms during evaluation of the distances between the magnetic markers, but also because the magnetic markers, when falling out, can be attracted to the ferromagnetic part of the belt conveyor transportation system and cause serious problems in terms of mechanical damage to the power systems, bearings, etc.; significant interference; or even the malfunction of electronic or control devices.
Therefore, our further research was focused on the implementation of magnetic markers into the conveyor belt. First, the magnetic markers were implemented into the hole that was drilled into the conveyor belt in the curved state when passing through the drum of the belt conveyor, instead of the holes in the straight part of the conveyor belt. Another considered possibility was to enhance the drilled hole, for example, with a stepped hole to prevent the magnetic marker from falling out; however, considering the on-site implementation of the magnetic markers into the existing belt conveyor systems, this possibility would be difficult to apply in practice.
The next part of the research was focused on the selection of the most suitable dimensions of the magnetic markers. From the performed numerical analyses, it can be concluded that from the tested magnetic markers, the most convenient was the magnetic marker with the largest contact surface. It was the flattest magnetic marker with a height of only 2.5 mm; however, the simulation results showed that the friction force that had to be overcome by the magnet was several times higher in comparison to the higher magnetic markers with smaller diameters. Additionally, the average contact pressure was, in this case, four times higher in comparison to the reference magnetic marker and three times higher in comparison to the third tested magnetic marker.
The results of the performed simulations and calculations can be summarized as the dependence of the contact surface on the forces—see Figure 12, where they are presented after the application of the linear regression model on the obtained datasets. During the calculations, no weighting methods were applied. In the related Table 3, the linear regression coefficients are overviewed. It can be seen that the simulation results confirmed the theoretical assumptions that with increasing contact surface, the normal and friction force would also increase. The deviation from the linear dependence was evaluated in the form of the RMSE (root mean square error) and RSS (residual sum of squares).
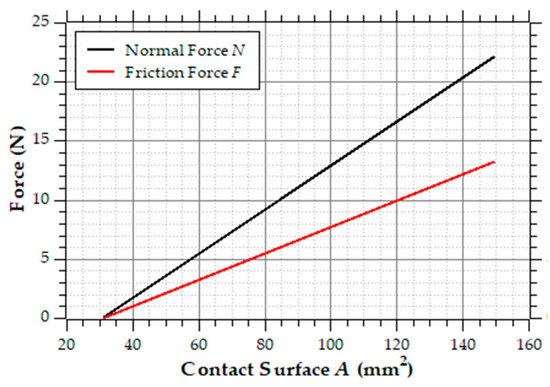
Figure 12.
Dependence of the contact surface on the normal and friction force.
Table 3.
Linear regression model coefficients of the dependence of the contact surface on the normal and friction force.
Another advantage of the flat magnetic marker is that it can be glued more easily because the contact surface is larger. However, in our opinion, problems can occur regarding dirt or even humidity, which can affect the magnetic markers with a larger contact surface more significantly than smaller magnetic markers, mainly considering wear to the glue or the conveyor belt’s hyperelastic material where the hole was drilled. The glue can be also affected by the vibrations caused by the power systems of belt conveyors. However, considering the advances in this area, newly developed power systems only have low levels of vibrations and noise.
Another problem that can occur is the material falling to the conveyor belt from a certain height. In the case of dynamic stress, the conveyor belt is loaded by the impact stress. This means that the value of the load changes in a short time interval and stresses that are several times higher in comparison to the corresponding static stresses are quickly generated. These can be expressed by the dynamic impact factor, which determines the ratio in which the deformation increases in comparison to the static deformation of the system. The issue of the dynamic impact loading was analyzed in detail in [40]. From the theoretical assumptions, it is obvious that even when the material is released from no height, the static value of the deformation and stresses increases by two times.
5. Conclusions
Together with the development of belt conveyors as a very environmentally friendly and cost-effective solution for material and freight transportation, diagnostic methods of belt conveyors have been developed, as the experience of users shows that the majority of belt damage is caused by the improper operation of the conveyor or by the technical condition of the belt conveyor components. The diagnostic methods are focused mainly on the drive units, gear boxes and rollers, and for diagnostic purposes, many different types of physical principles can be used. They are usually based on the measurement of vibrations or acoustic signals, on optical principles using cameras or thermal cameras, and even on the combination of inspection robots or unmanned vehicles. This research was also focused on an improvement in the signal and data processing to improve the measurement results.
Our research is focused on the development of a diagnostic system based on magnetic markers implemented directly into the conveyor belt. Thanks to this system, it is possible to monitor the velocity of the conveyor belts because of the known distance between the magnetic markers, which can indicate potential problems not only with the powering of the conveyor belt or with the control systems, but also with the wear of the belt. The magnetic markers can also be applied to mark particular segments of the conveyor belt, and in this way, it is possible to quickly identify the damaged segments and, consequently, directly stop the damaged part of the conveyor belt in the maintenance area. In this way, it is possible to reduce the maintenance time significantly, even with nonmagnetic hyperelastic conveyor belts. The findings obtained from the magnetic markers can also be a valuable source of information for predictive maintenance, as it is possible to avoid emergency stoppages during the operation of the conveyor belt and to economically plan the maintenance of the conveyor belt in operation. Another advantage is that the magnetic measurements are contactless, and for the evaluation of the obtained measurement results, simple and effective algorithms can be used.
However, to support the idea of sustainable transportation, the monitoring and diagnostic system based on the magnetic microwires was modified so that it can be used not only in new conveyor belts—into which the magnetic microwires can be easily implemented during the manufacturing process—but also for conveyor belts that have been directly in operation already. For this reason, it was necessary to modify the system for sensing magnetic markers in the form of the cylindrical permanent magnets. Although it was proved that magnetic measurements can also be used in demanding operational conditions with different types of interferences, considering the utilization of this diagnostic system in practice, several tasks still need to be solved. One of them is the implementation of the magnetic markers into the conveyor belt, as during the experimental operation of the model belt conveyor, problems to do with the magnetic markers falling out can occur. From the ongoing research, it can be concluded that the one of the preventive actions is to drill holes for the magnetic markers, not in the straight part of the conveyor belt, but in the curved state when the magnetic marker is passing through the drum. In this way, it is possible to increase the average contact pressure acting on the magnetic marker passing during the most critical part of the conveyor belt. Attention was also paid to the dimensions of the magnetic markers. From the simulation and analysis results, it can be concluded that as the friction force and related average contact pressure acting on the magnetic marker is dependent on the contact surface between the magnetic marker and the conveyor belt, for our purposes, the flatter magnet, the more easily it can be glued to the conveyor belt and the more suitable it is to fill the role of a magnetic marker.
Author Contributions
Conceptualization, K.S. and K.D.; methodology, K.S. and K.D.; validation, K.S. and K.D.; formal analysis, K.S. and K.D.; data curation, K.S. and K.D.; writing—original draft preparation, K.D.; writing—review and editing, K.D.; visualization, K.S.; project administration, K.S.; funding acquisition, K.S. All authors have read and agreed to the published version of the manuscript.
Funding
This research was funded by the Slovak Research and Development Agency, grant number APVV-18-0248; by the VEGA 1/0101/22 project; and by the Research Agency ITMS (code number 313011T557), co-funded by the European Regional Development Fund under the Operational Program Integrated Infrastructure.
Institutional Review Board Statement
Not applicable.
Informed Consent Statement
Not applicable.
Acknowledgments
We would like to acknowledge the company EDIS vvd. for the opportunity to use their sensing equipment and for the assistance during the implementation of the magnetic markers into the conveyor belt.
Conflicts of Interest
The authors declare no conflict of interest.
References
- Dzhundibayev, V.E.; Kochetkov, A.V.; Bobeev, A.B. Belt conveyors: Principles of building control and diagnostics systems. IOP Conf. Ser. Mater. Sci. 2021, 1047, 012041. [Google Scholar] [CrossRef]
- Perun, G. Attempt to evaluate the technical condition of the rollers of the belt conveyor by vibration measurements. Vibroeng. Procedia 2014, 3, 296–299. [Google Scholar]
- Bortnowski, P.; Król, R.; Ozdoba, M. Roller damage detection method based on the measurement of transverse vibrations of the conveyor belt. Eksploat. Niezawodn. 2022, 24, 510–521. [Google Scholar] [CrossRef]
- Kuzin, E.G.; Gerike, B.L. Monitoring the condition of gear units for variable-frequency drives of mine belt conveyors. Min. Sci. Technol. 2016, 2016, 14–19. [Google Scholar] [CrossRef]
- Gerike, B.; Drozdenko, Y.; Kuzin, E.; Ananyin, I.; Kuziev, D. Formation of Comprehensive Service System of Belt Conveyor Gearboxes. E3S Web. Conf. 2018, 41, 03011. [Google Scholar] [CrossRef]
- Yefimenko, L.; Tykhanskyi, M.; Shcherbina, O. Analysis of the defect diagnostics methods and scanning for instructive parameters of the belt conveyor gear. Metall. Min. Ind. 2015, 7, 39–44. [Google Scholar]
- Stefaniak, P.; Anufriiev, S. Method of Defining Diagnostic Features to Monitor the Condition of the Belt Conveyor Gearbox with the Use of the Legged Inspection Robot. In Proceedings of the Intelligent Information and Database Systems: 12th Asian Conference, ACIIDS 2020, Phuket, Thailand, 23–26 March 2020; Volume 1178, pp. 158–167. [Google Scholar] [CrossRef]
- Skoczylas, A.; Stefaniak, P.; Anufriiev, S.; Jachnik, B. Belt conveyors rollers diagnostics based on acoustic signal collected using autonomous legged inspection robot. Appl. Sci. 2021, 11, 2299. [Google Scholar] [CrossRef]
- Shiri, H.; Wodecki, J.; Ziętek, B.; Zimroz, R. Inspection robotic UGV platform and the procedure for an acoustic signal-based fault detection in belt conveyor idler. Energies 2021, 14, 7646. [Google Scholar] [CrossRef]
- Wodecki, J.; Zdunek, R.; Wyłomańska, A.; Zimroz, R. Local fault detection of rolling element bearing components by spectrogram clustering with Semi-Binary NMF. Diagnostyka 2017, 18, 3–8. [Google Scholar]
- Dąbek, P.; Krot, P.; Wodecki, J.; Zimroz, P.; Szrek, J.; Zimroz, R. Measurement of idlers rotation speed in belt conveyors based on image data analysis for diagnostic purposes. Measurement 2022, 202, 111869. [Google Scholar] [CrossRef]
- Barszcz, T.; Jabłoński, A.; Worek, C.; Krzak, Ł.; Mrówka, R. New technologies for wireless energy-efficient machinery diagnostic system. In Advances in Technical Diagnostics; Springer: Cham, Switzerland, 2018; Volume 10, pp. 139–149. [Google Scholar] [CrossRef]
- Szurgacz, D.; Zhironkin, S.; Vöth, S.; Pokorný, J.; Sam Spearing, A.J.S.; Cehlár, M.; Stempniak, M.; Sobik, L. Thermal imaging study to determine the operational condition of a conveyor belt drive system structure. Energies 2021, 14, 3258. [Google Scholar] [CrossRef]
- Adilov, Y.T.; Khabibullaev, M.M. Application of fiber-optic measuring current transformer in control and relay protection systems of belt conveyor drives. IOP Conf. Ser. Earth Environ. Sci. 2020, 614, 012022. [Google Scholar] [CrossRef]
- Gonzalez-Jimenez, L.E.; Arriaga-Mendez, F.J.; Mendiola-Meza, O.F. Vargas-Mascorro, E. Embedded Diagnostics of Conveyor Belts Actuated by Induction Motors. IEEE Lat. Am. Trans. 2021, 19, 107–114. [Google Scholar] [CrossRef]
- Lu, Y. DC Motor Control Technology Based on Multisensor Information Fusion. Comput. Intell. Neurosci. 2022, 2022, 1447333. [Google Scholar] [CrossRef] [PubMed]
- Kruczek, P.; Sokołowski, J.; Obuchowski, J.; Sawicki, M.; Wyłomańska, A.; Zimroz, R. Fault detection in belt conveyor drive unit via multiple source data. In Cyclostationarity: Theory and Methods III; Springer: Cham, Switzerland, 2017; Volume 6, pp. 173–186. [Google Scholar] [CrossRef]
- Anikanov, D.; Kipervasser, M.; Simakov, V.; Qi, D. Belt conveyor predictive diagnostics based on the monitoring of the drive motor electrical parameters. E3S Web. Conf. 2021, 330, 03010. [Google Scholar] [CrossRef]
- Gerike, B.; Panachev, I.; Kuzin, E. Development of the preventive maintenance system for belt conveyors reducers. E3S Web. Conf. 2017, 15, 03008. [Google Scholar] [CrossRef]
- Bortnowski, P.; Kawalec, W.; Król, R.; Ozdoba, M. Types and causes of damage to the conveyor belt - Review, classification and mutual relations. Eng. Fail. Anal. 2022, 140, 106520. [Google Scholar] [CrossRef]
- Kirjanów-Błażej, A.; Błażej, R.; Jurdziak, L.; Kozłowski, T.; Rzeszowska, A. Innovative diagnostic device for thickness measurement of conveyor belts in horizontal transport. Sci. Rep. 2022, 12, 7212. [Google Scholar] [CrossRef] [PubMed]
- Kirjanów-Błażej, A.; Rzeszowska, A. Conveyor belt damage detection with the use of a two-layer neural network. Appl. Sci. 2021, 11, 5480. [Google Scholar] [CrossRef]
- Li, X.; Li, Y.; Zhang, Y.; Liu, F.; Fang, Y. Fault Diagnosis of Belt Conveyor Based on Support Vector Machine and Grey Wolf Optimization. Math. Probl. Eng. 2020, 2020, 1367078. [Google Scholar] [CrossRef]
- Zhao, S.S.; Guo, B.J.; Yang, X. Development of on-line automatic monitoring system for the steel belt conveyor. Key Eng. Mater. 2011, 455, 462–466. [Google Scholar] [CrossRef]
- Blazej, R.; Jurdziak, L.; Zimroz, R. Novel approaches for processing of multi-channels NDT signals for damage detection in conveyor belts with steel cords. Key Eng. Mater. 2013, 569, 978–985. [Google Scholar] [CrossRef]
- Błażej, R.; Jurdziak, L.; Kozłowski, T.; Kirjanów, A. The use of magnetic sensors in monitoring the condition of the core in steel cord conveyor belts—Tests of the measuring probe and the design of the DiagBelt system. Measurement 2018, 123, 48–53. [Google Scholar] [CrossRef]
- Alport, M.; Basson, J.F.; Padayachee, T. Digital magnetic imaging of steel cord belts. Bulk Solids Handl. 2008, 28, 182–185. [Google Scholar]
- Fang, L.; Zheng, Q.; Hou, W.; Zheng, L.; Li, H. A self-powered vibration sensor based on the coupling of triboelectric nanogenerator and electromagnetic generator. Nano Energy 2022, 97, 107164. [Google Scholar] [CrossRef]
- Olchowka, D.; Blaaej, R.; Jurdziak, L. Selection of measurement parameters using the DiagBelt magnetic system on the test conveyor. J. Phys. Conf. Ser. 2022, 2198, 012042. [Google Scholar] [CrossRef]
- Semrád, K.; Draganová, K. Non-Destructive Testing of Pipe Conveyor Belts Using Glass-Coated Magnetic Microwires. Sustainability 2022, 14, 8536. [Google Scholar] [CrossRef]
- Farag, H.E.; Toyserkani, E.; Khamesee, M.B. Non-Destructive Testing Using Eddy Current Sensors for Defect Detection in Additively Manufactured Titanium and Stainless-Steel Parts. Sensors 2022, 22, 5440. [Google Scholar] [CrossRef]
- Touil, D.R.; Daas, A.; Helifa, B.; Lahrech, A.C.; Khaldoun, L.I. Simple Giant Magnetoresistance Probe Based Eddy Current System of Defect Characterization for Non-Destructive Testing. Adv. Electromagn. 2022, 11, 43–48. [Google Scholar] [CrossRef]
- Paredes, F.; Herrojo, C.; Martín, F. Position sensors for industrial applications based on electromagnetic encoders. Sensors 2021, 21, 2738. [Google Scholar] [CrossRef]
- Kumar, A.; Arnold, W. High resolution in non-destructive testing: A review. J. Appl. Phys. 2022, 132, 100901. [Google Scholar] [CrossRef]
- Sun, K.; Qi, P.; Tao, X.; Zhao, W.; Ye, C. Vector Magnetic Field Imaging with High-Resolution TMR Sensor Arrays for Metal Structure Inspection. IEEE Sens. J. 2022, 22, 14513–14521. [Google Scholar] [CrossRef]
- Jiang, S.; Lu, X.; Wang, H.; Song, K.; Jiang, Y. Simulation and experimental study of remote field current testing for hidden defects of aluminum alloy plate with damping coating. Sens. Rev. 2022, 42, 365–376. [Google Scholar] [CrossRef]
- Teng, Y.; Zhang, R.; Yang, J.; Qiu, Z.; Chen, X. Comprehensive evaluation of damages in ferromagnetic materials based on integrated magnetic detection. Insight Non-Destr. Test. Cond. Monit. 2022, 64, 206–212. [Google Scholar] [CrossRef]
- Lipovský, P.; Šmelko, M.; Fiľko, M.; Draganová, K.; Blažek, J.; Hudák, J.; Andoga, R.; Szabo, S. Relax-Type Magnetometer with Direct Optocoupler Relaxation. Acta Phys. Pol. A 2020, 137, 681–683. [Google Scholar] [CrossRef]
- Praslicka, D.; Blazek, J.; Hudák, J.; Mikita, I.; Moucha, V. Industrial Applications of Magnetometry. J. Electr. Eng. 2015, 66, 190–192. [Google Scholar]
- Semrád, K.; Marasová, D.; Ambriško, Ľ.; Caban, Ľ.; Spodniak, M. Numerical and experimental analysis of innovative support system of belt conveyor. Metalurgija 2020, 59, 385–388. [Google Scholar]
Disclaimer/Publisher’s Note: The statements, opinions and data contained in all publications are solely those of the individual author(s) and contributor(s) and not of MDPI and/or the editor(s). MDPI and/or the editor(s) disclaim responsibility for any injury to people or property resulting from any ideas, methods, instructions or products referred to in the content. |
© 2023 by the authors. Licensee MDPI, Basel, Switzerland. This article is an open access article distributed under the terms and conditions of the Creative Commons Attribution (CC BY) license (https://creativecommons.org/licenses/by/4.0/).