Article

Development of Kampung Susun Akuarium Based on Sustainable Housing Principles

1
Master Program on Sustainability Science, Graduate School, Universitas Padjadjaran, Bandung 40132, Indonesia
2
Center for Environment & Sustainability Science-CESS, Universitas Padjadjaran, Bandung 40132, Indonesia
3
Department of Anthropology, Faculty of Social and Political Sciences, Universitas Padjadjaran, Sumedang 45363, Indonesia
4
Department of Biology, Faculty of Mathematics and Natural Sciences, Universitas Padjadjaran, Sumedang 45363, Indonesia
*
Author to whom correspondence should be addressed.
Sustainability 2023, 15(11), 8673; https://doi.org/10.3390/su15118673
Submission received: 1 April 2023 / Revised: 25 May 2023 / Accepted: 25 May 2023 / Published: 26 May 2023

Abstract

:
Adequate housing is one of the rights of Indonesian citizens. Nevertheless, forced eviction is something familiar in Indonesia. One of the areas that experienced forced evictions was Kampung Akuarium. In April, the Provincial Government of DKI Jakarta evicted Kampung Akuarium settlement area residents. As a form of demonstration, they survived on the rubble from the evictions and built tents to carry out their activities in the Kampung Akuarium area. The DKI Jakarta Provincial Government began to rebuild the site into an adequate residential area called Kampung Susun Akuarium (KSA) as a solution for the residents. Based on the government’s solution, the study aims to determine whether the KSA meets the principles of sustainable housing. Sustainable housing promotes environmental preservation, social equality, and economic development to improve the residents’ quality of life. This study conducts a preliminary study to compile sustainable housing variables and indicators. The variables used in this research are community development, environment, social, and economy. Data analysis using Structural Equation Modeling was performed with SmartPLS software, based on the data collected, with an intensive study by distributing questionnaires to 102 residents. The findings indicate that KSA residents have performed most of the sustainable housing and community development indicators well and can still be improved by considering solutions related to poorly implemented indicators. This study’s results also emphasize that community development is a significant variable in building sustainable housing to be used in subsequent studies.

1. Introduction

The Human Settlements Program UN-Habitat 2016 in Ecuador launched a global agreement called The New Urban Agenda, where the concept of “right to the city” emerged [1]. The notion of “right to the city” [1] is associated with the “city for all.” This notion refers to every community’s right and chance to attain equality and a better living in the city to establish a sustainable town [1]. The word “all” in this idea includes the current and future generations [1]. A municipality has the characteristic of openness [2]. Every society and community can express their aspirations to make a better city without conflict, chaos, and violence [2].
In NUA, the United Nations Human Settlements Program (UN-Habitat) expresses a commitment to offering equal chances for all community groups, particularly marginalized populations, to access urban facilities [3]. The access includes housing, public space, primary education, health facilities, and services [3].
In contrast to the above statements, forced evictions are common in Indonesia, especially in big cities [4]. Forced evictions in Indonesia have caused numerous marginalized residents to lose their homes and livelihoods [5]. Based on a report by the Lembaga Bantuan Hukum Jakarta, in the total cases of evictions recorded, 46% of expulsions were forced and carried out without deliberation, using force and involving a joint force, namely, the police and the army [6,7].
Evictions are typically carried out in a specific manner, generally initiated with the involvement of regional rules to carry out evictions, followed by a letter informing residents to leave their houses [4]. Finally, combined officers, such as the Municipal Police, the Indonesian Police, and the Indonesian Army, are involved in evictions. Kampung Akuarium, whose inhabitants had occupied the city for around 50 years (for generations), was one of the locations that faced forceful evictions. In contrast to Pasal 62 Ayat 3 Undang-Undang Nomor 1 Tahun 2011 of Housing and Residential Areas [8], “continuing to protect residents in the same location” aims to guarantee the right to reside without displacing existing residents.
On 11 April 2016, the DKI Jakarta Provincial Government conducted an order evicting the occupants of Kampung Akuarium. The DKI Jakarta Provincial Government conducted the evictions for several reasons. The first reason is based on Peraturan Daerah No. 1 Tahun 2014 of Detailed and Spatial Planning [9], regarding land ownership in the Kampung Akuarium area. Second, there was a coastal embankment project for the National Capital Integrated Coastal Development (NCICD) phase A in the Kampung Akuarium area. Third, during the eviction, the DKI Jakarta Provincial Government discovered a valuable cultural heritage and excavated future examination. The discovery of this cultural heritage precluded the Governor of DKI Jakarta from reorganizing and reconstructing Kampung Akuarium. Finally, the Kampung Akuarium area is scheduled to be integrated into the Kota Tua, as outlined in Peraturan Gubernur No. 36 Tahun 2014 [10], and the building of Kampung Akuarium is integrated with the Museum Bahari and Masjid Luar Batang.
During the eviction, the government provided alternative housing for Kampung Akuarium residents, public housing called Rumah Susun. Residents of Kampung Akuarium were compelled to migrate to Rumah Susun Rawa Bebek and Rumah Susun Marunda Baru, the public housing the Provincial Government of DKI Jakarta had prepared. Nevertheless, most Kampung Akuarium residents decided to live, settle in fishing boats, and survive in the rubble of demolished buildings. The residents stayed as an act of demonstration against the government and built tents to carry out their activities in the Kampung Akuarium area. Kampung Akuarium residents, on 3 October 2016, filed a lawsuit against forced evictions assisted by Lembaga Bantuan Hukum Jakarta to acquire their rights as citizens. However, Kampung Akuarium residents officially withdrew the case on 16 June 2018.
The residents of Kampung Akuarium gained optimism when the Provincial Government of DKI Jakarta agreed to rebuild Kampung Akuarium through a political contract [11]. The government of DKI Jakarta answered the political agreement and gave the residents of Kampung Akuarium Area a solution by building a public housing called the Kampung Susun Akuarium (KSA) in 2022. The purpose of this research, based on the government’s solution, is to analyze if Kampung Susun Akuarium (KSA) meets the principles of sustainable housing and can be replicated in other regions in Jakarta or other Indonesian cities.
Kampung Susun Akuarium is an intriguing issue, since it is one of the popular eviction cases in Jakarta that carries a community fighting for their right to own adequate housing. The residents have a strong sense of belonging to what they have earned after living in the habitable rubble of the eviction until the government builds decent public housing in their initial settlement area.
The following chapter provides a review of the literature of housing issues in urban areas, sustainable housing, and community development. The third chapter is on materials and methods, which include preliminary studies, intensive studies, and data analysis. The fourth chapter is the results and discussion of this research, consisting of measurement model testing, structural model testing, and hypothesis testing. The last chapter is the conclusion and recommendation of this research.

2. Literature Review

2.1. Housing Issues in Urban Areas

The right to adequate housing is the right of all citizens without exception. However, the urbanization process of population growth in the capital keeps increasing. The urbanization process in Indonesia and urban population growth occurred rapidly since the beginning of the country’s independence and increased around 1970 [12]. The negative impact of urbanization is that population growth outweighs economic and industrial development [13,14]. Some settlement problems are housing needs, limited land, marginalized local communities, and environmental degradation due to expansion. The demand for decent housing is indeed one of the issues from the past until now [15].
Due to the increasing population of Jakarta, the government could not provide adequate housing, which has led to numerous illegal houses being traded or rented without a permit and forming slum settlements [16]. Slum settlements are densely populated settlements located on land not by its spatial layout and built on state land or other people’s land, which is against the applicable laws and regulations [17,18]. Infrastructure and social facilities in slum settlements do not meet technical and health requirements, which can endanger the survival and livelihood of their residents [14,17,18].

2.2. Sustainable Housing

The global agenda that each country must achieve is to meet the needs of each family and develop sustainable housing [19]. Murbaintoro asserts that Indonesia must participate in carrying out the global agenda to support access to sustainable housing, particularly the basic need to provide affordable housing for low-income people [20]. In providing access to urban facilities and adopting the New Urban Agenda, according to Saroso, cities in Indonesia must plan and manage urban areas to achieve more sustainable and inclusive cities [1]. Implementing urban planning considers sociocultural conditions and the socio-economic-environmental linkages in the city and surrounding areas [1].
Sustainable housing promotes environmental preservation, economic development, and social equality to improve the quality of life in the community [21,22]. Sustainable housing also reduces huge urbanization problems that lead to population growth, deprivation, scarcity of sustainable energy, and climate change [23,24]. Sustainable housing is built and designed to meet several criteria: it must be affordable, healthy, safe, and comfortable, with easy access to energy, water, sanitation facilities, jobs, health, and education [25].
A study by Shama and Motlak formulated several indicators of sustainable housing, incorporating the availability of electricity and public facilities, support for low-income communities, quality of public transportation, security of residential areas, access to open space, health services, schools, mixed-use land, and waste management, including recycling of local materials [26].
Sustainability principles by Newman [27] are divided into two factors: the foundation principle consists of a healthy long-term economy, human rights and equality, ecological and biodiversity integrity, quality of life, community sense of place, the net benefit from development and equitable distribution of public resources; the process principles consist of the integration of the triple bottom line, information transparency, precaution, and strategic vision for the future.
The difference between eco-friendly and sustainable housing is that the former only focuses on the direct impact on the environment [28]. Meanwhile, sustainable housing focuses on the implications for current and future generations and provides economic, social, and environmental benefits [28]. The triple-bottom-line framework establishes three sustainable housing targets: environmental, social, and economic sustainability [25,26,27]; as mentioned in the UN-Habitat report [25], sustainable housing policies for settlements are classified on a micro-scale and divided into social, environmental, and economic dimensions, as shown in Table 1.

2.3. Community Development

According to Robinson and Green [29], community development is defined as “communities of place”, namely, residents or occupants with the same interests related to a region or a place. Bundimanta stated that community development is a development activity to increase community access to achieve better social and economic conditions. Community development is a commitment to empowering the marginal community to obtain options to continue their future [30].
Community development has three primary characteristics: sustainable, community-based, and local resource-based. There are two goals of community development, capacity and community welfare, which can be attained through several aspects: empowerment, equality, security, sustainability, and cooperation [31]. Looking further at the empowerment aspect, ref. [32] starts from an individual’s or community’s needs and aspirations by considering capacity and resources. Indicators for empowerment consist of awareness, connecting & learning, mobilization and action, and contribution [32].

3. Materials and Methods
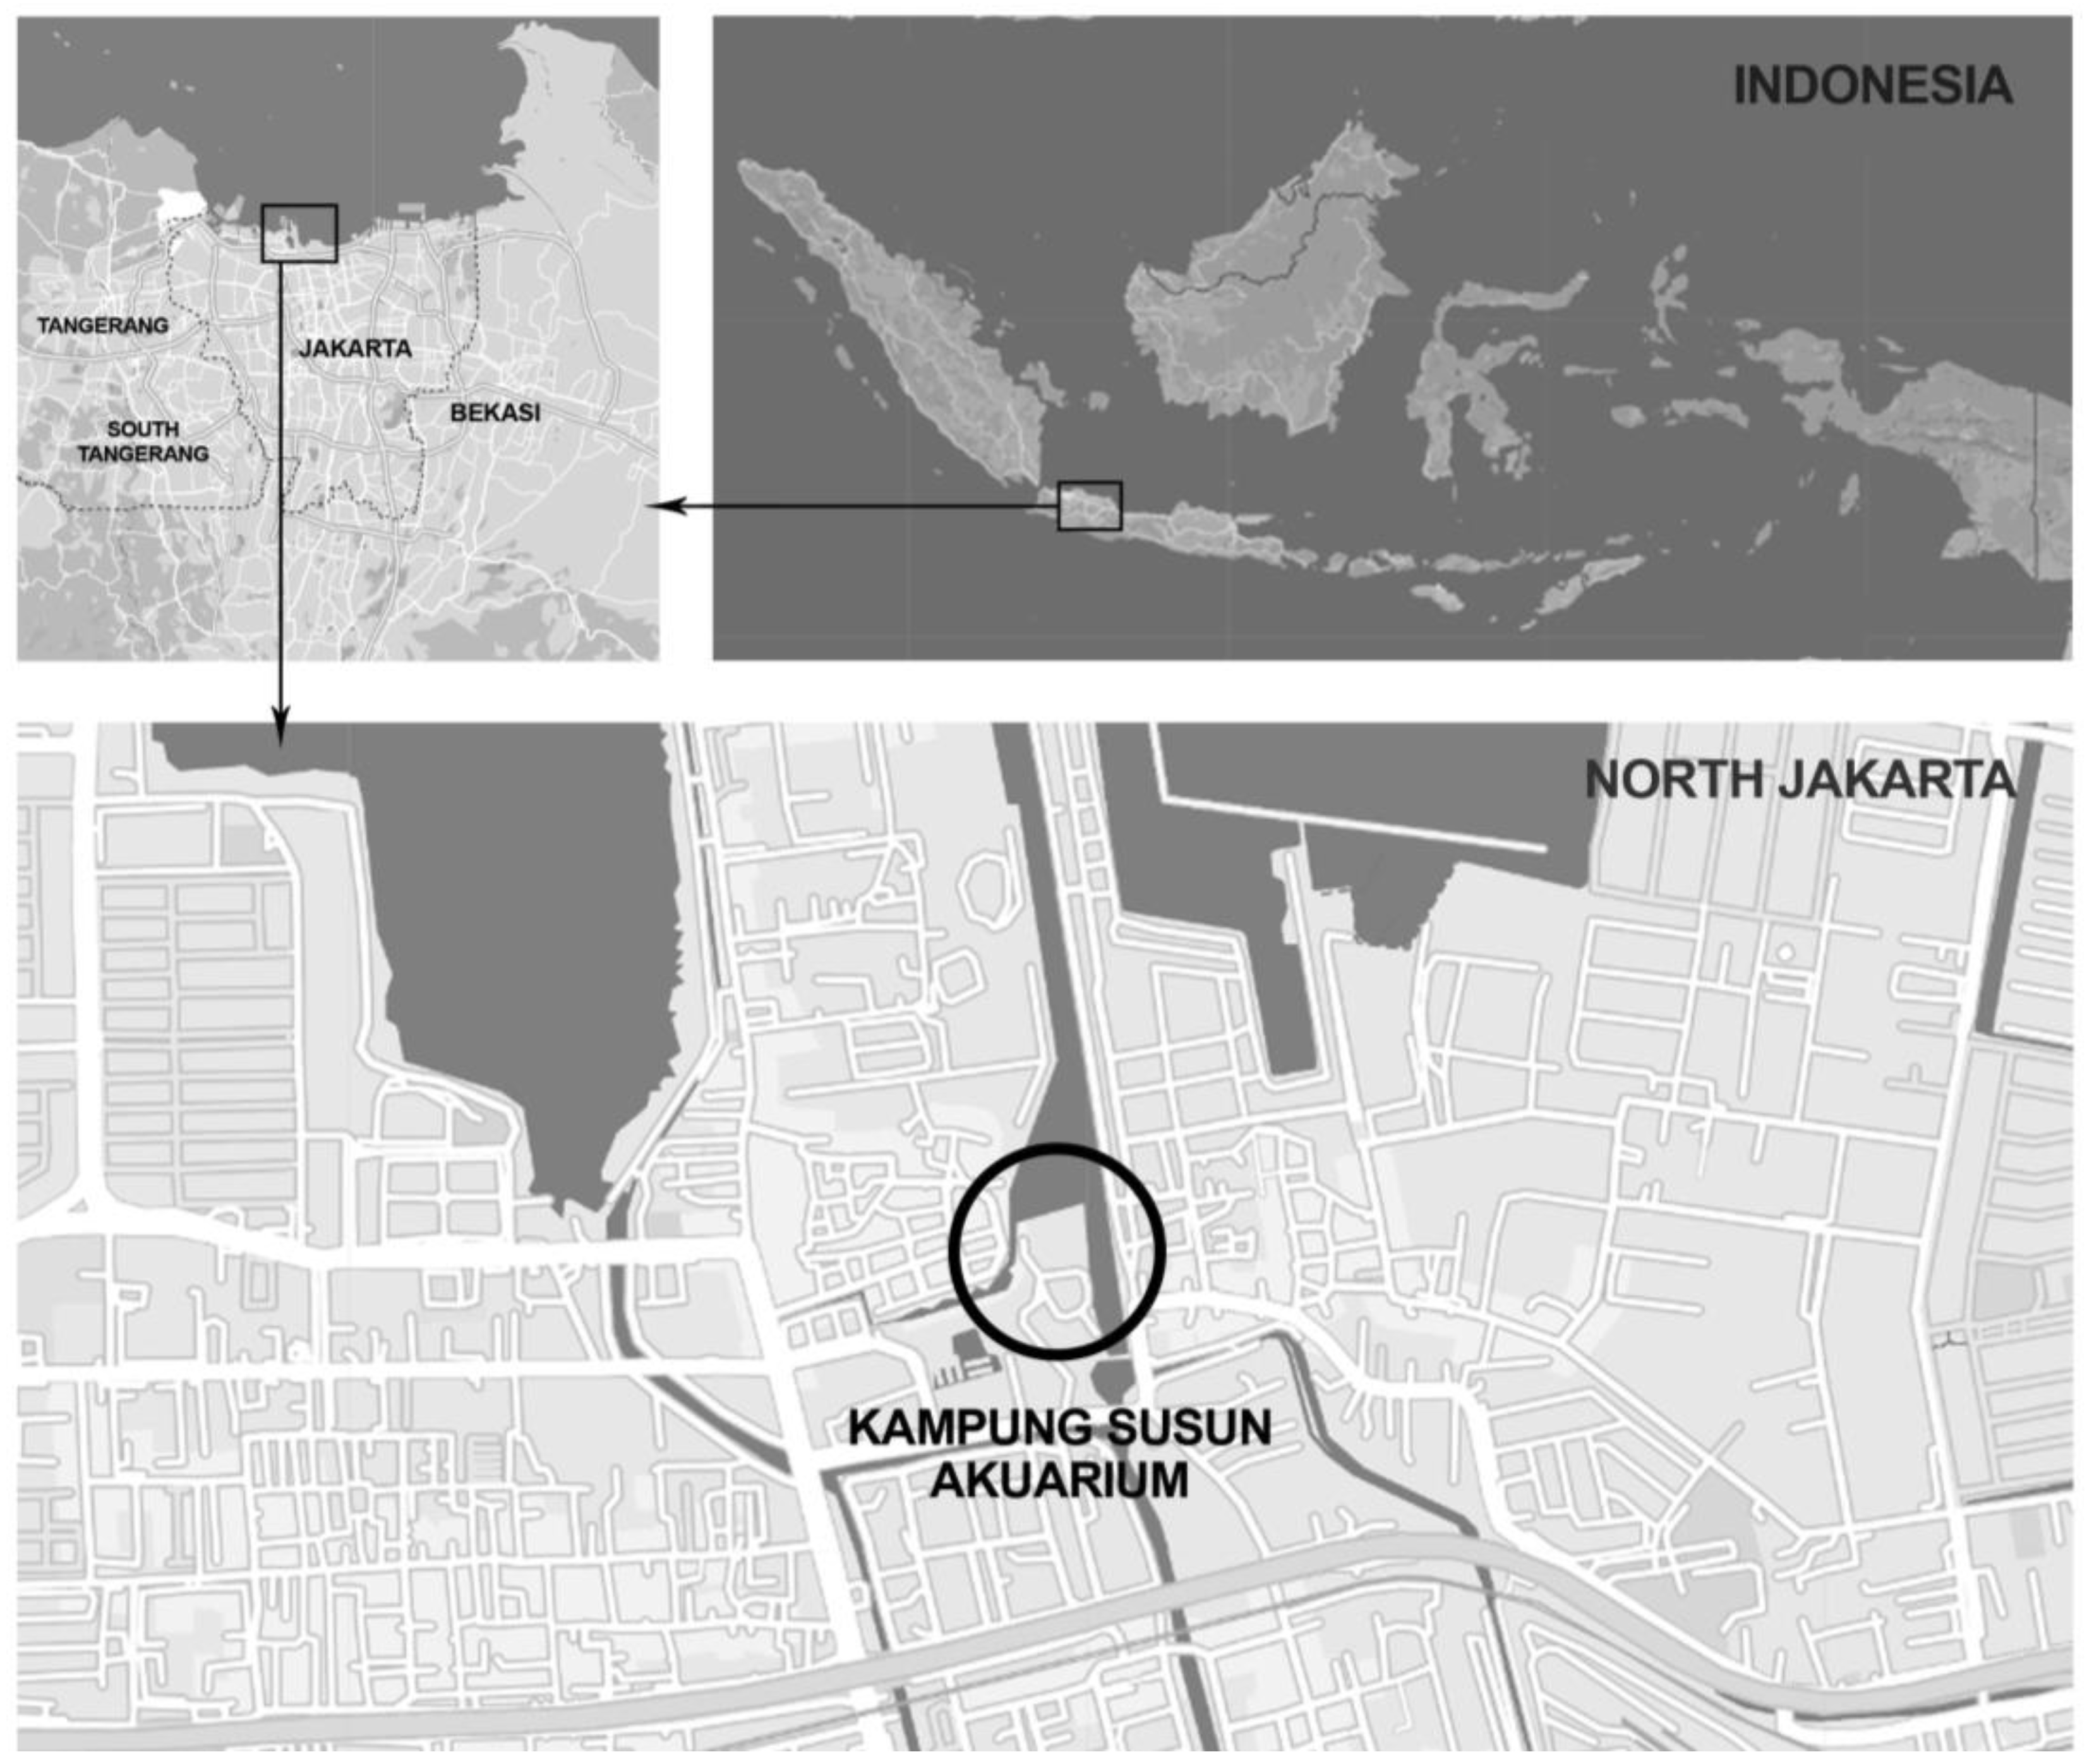
3.1. Study Area

Kampung Susun Akuarium (KSA) is one of the public housings in Indonesia located in the north of Jakarta, specifically on Jalan Pasar Ikan. The area of Kampung Akuarium is 10,557 m2 [33]. Figure 1 shows the map of the study area. The KSA development plan consists of 5 blocks; A, B, C, D, and E, with 241 total units [34]. This research boundary is blocks built since 2021, as well as B and D blocks, with 102 total units occupied.

3.2. Preliminary Study

Preliminary research was undertaken at the Kampung Akuarium site to develop indicators by interviewing key informants and synthesizing the literature on community development and sustainable housing variables. Purposive sampling was used to choose key informants based on the requirements for this study, including the head of the community, the cooperative heads of Bangkit Aquarium, cooperative supervisors, and one of the KSA residents. Several questions related to variables and indicators were asked using semi-structured interviews. The literature on the variables of SH (economy, environment, and social) and community development is collected to be synthesized.

3.3. Intensive Study

Indicators are developed, and the following step of intensive study is to spread the questionnaires. Respondents were selected by purposive sampling, specifically representative of each 102 residential units. Respondents are residents who have lived in the Kampung Akuarium housing area for about 50 years (for generations) before being evicted and have lived in KSA for approximately a year.

3.4. Data Analysis

The questionnaire was used to measure the behavior of KSA residents in implementing sustainable housing indicators. Guttman was used in this study to obtain a definite result between “Yes” or “No”. The answers “Yes” and “No” will each receive a value of 1 and 0.
There will be multiple parts to the questionnaire. First, the identity of the Kampung Akuarium respondents is considered. The following section of the questionnaire consists of questions representing Kampung Akuarium residents’ behavior towards the indicators of community development and sustainable housing aspects (environmental, social, and economic).
This study used the Structural Equation Model (SEM) for data analysis. A multivariate statistical framework called Structural Equation Model (SEM) is used to model complex relationships between manifest variables that are directly observed and latent variables that cannot be directly observed [35,36]. The hypothesis between the latent variables is shown in Table 2.

4. Results and Discussion

The variables used in this study are community development, economy, social, and environment. The following indicators are listed in Table 3. As stated in the previous chapter, the indicators below are compiled from a preliminary study on the research site, interviews, and a synthesis of the literature on community development and sustainable housing aspects and policies.
One thing that distinguishes this research from other studies is that the variables considered for sustainable housing are not only the three aspects of sustainability: environmental, social, and economic, but also community development.
The development of Kampung Susun Akuarium (KSA) involves the residents of KSA, which is why community development is one of the variables considered in this study. KSA residents are fighting for their livelihood and adequate housing. In this case, the government of DKI Jakarta involves them in the community action plan. The community action plan organized by the government is part of the community empowerment program [41]. The residents of KSA as a village community, according to Herlianto [42], have the characteristics of togetherness in everyday life and are described as “guyub”.
The involvement of residents or the community in improving the quality of the environment in slum settlements is essential, even influential [43,44]. One of the sustainable housing policies [45] that must be considered is the community’s involvement and willingness to design, build, and maintain improvements.
The KSA residents’ empowerment inspires the first indicator: CD1, how they empower their community members to cooperate in operational activities. The indicators CD5, CD6, and CD7 are adapted to community development aspects [31]. The following community development indicators—CD2, CD3, and CD4—are compiled from empowerment indicators [32].
One of the process principles of sustainable housing is integrating the triple bottom line [27]. Three dimensions are used in this study considered in sustainability: planet (environmental), people (social), and profit (economic) [46,47,48]. Several factors of sustainable housing are the housing location, how good the construction and design are, and how well the community’s environmental, social, cultural, and economic order is formed [22]. Sustainable housing targets environmental, economic, and social sustainability [26] according to the triple bottom line framework, from planning to implementation.
Regarding the economic variable, the first indicator, ECON1, is adapted to one of the sustainable housing principles conveyed [27], long-term economic health to increase productivity that leads to future economic stability. The indicator ECON2 is adapted to one of the criteria of sustainable housing is to have easy access to resident’s workplaces [25] and also inspired by how the KSA residents stayed and survived on the uninhabitable remains from the evictions to continue working regularly, which is not far from where they live. The indicator ECON3 is linked to the subsequent indicator to support ECON2.
The ECON4 indicator indicates how residents can utilize the area for home-based enterprises, such as retail or service centers. The indicator is adapted and inspired by the concept of a mixed-use area. One area has several building functions that provide added value and income for the community [37]. Adyla [49] conveys that building and maintaining the environment of flats is closely related to community empowerment. The ECON5 indicator studies how residents can use local natural resources to develop enterprises. ECON4 and ECON5 adapted to one of the UN-Habitat Sustainable Housing Policy: to support economic activities and home-based enterprises [25] and the sustainable housing indicator. A local economy built from a high-quality environment and efficiency of land-use [24] adds economic value [38].
The indicator ECON6 is to see residents’ participation in training to see community participation in training held either by the government or non-governmental organizations, which is adapted to the sustainable housing indicator: a local economy to increase the residents’ quality of life [38]. ECON6 is inspired by the government in Surabaya, which held a structural training, called the Independent Business Incubation Facility, to increase the income of the community in Surabaya [50,51].
Regarding the social variable, the indicator SOC1 is adapted to the concept of the outer area of public housing in Singapore designed as a communal space that is friendly to be used collectively. The following indicators—SOC2, SOC3, and SOC1—are compiled from sustainability housing indicators in social aspects: to ensure residents’ participation and increase social contribution with structural activities regularly [25,38].
The “Equality between individuals” is not only shown in CD5, but also in SOC4, which is adjusted to a fundamental principle of sustainable housing to discover the potential in each individual to decrease the gap and give equal opportunity to the community [27]. The following indicators, SOC5, SOS6, and SOS7, are compiled from the criteria of sustainable housing: to have easy access to health services and education and guarantee community health, safety, and comfort [25,27]. The two last indicators of social aspects are SOS8 and SOS9, adapted to the sustainability housing policy in social aspect: to provide access to essential housing services, power grids, transportation services, [26] infrastructure, and public spaces [25].
Regarding the environmental variable, ENV1 is inspired by how KSA residents keep their neighborhoods clean and are committed to daily collective cleaning. The following indicators, ENV3, ENV4, and ENV6, are compiled from the environmental aspect of sustainable housing: waste processing [25], which is adjusted to the results of the interviews with the key informant to investigate the waste processing indicators.
The ENV5 indicator is adapted to sustainable housing on the environmental aspect: to implement reuse, reduce, and recycle [38]. The following indicators are ENV2, ENV7, and ENV8, compiled from one of the UN-Habitat Sustainable Housing Policy: energy and water efficiency [25] and hygiene of housing aspects: to provide clean water and sanitation [39]. The indicator ENV9 shows how the residents can consume the resources they harvest. ENV9 is adapted from the sustainability housing policy: to use affordable resources [25]. Lastly, ENV10 and ENV11 indicators are adapted to the environmental aspect of sustainable housing: the environmental health of owning and expanding green open space [25,38,39].

4.1. Measurement Model Testing

The outer model’s design outlines the relationship between each indicator and its variables. In Figure 2, the various indicators for each variable are denoted by the arrows in each box.
Figure 2 shows that the outer model path diagram design has nine indicators for the community development variables (CD1 to CD9), six indicators for the economic aspects (ECON1 to ECON6), nine indicators for the social aspects (SOC1 to SOC9), and eleven indicators for the environmental aspects (ENV1 to ENV11). The path diagram description is listed and shown in Table 3.
The measurement model is evaluated during the initial SmartPLS 3.0 test. Validity tests and reliability tests are carried out. Convergent validity and discriminant validity are part of validity tests, while composite reliability and Cronbach’s alpha are part of reliability tests.
Convergent validity is carried out by evaluating the reliability indicator values, namely, Outer Loading and Average Variance Extracted (AVE) values. Internal reliability is described by the outer loadings’ value, indicating the relationship or correlation between indicators and latent variables. Internal reliability determines the valid indicators and will go through the following analysis stage.
To be considered valid, most outer loading values must be at least 0.60 or 0.70 [52]. Hulland [53] asserts that indicators with an outer loading value of less than 0.40 or 0.50 must typically be removed. Using the PLS Algorithm method, outer loading can be obtained from the SmartPLS software. Table 4 shows the first iteration that these calculations produced.
When removing indicators with a lower threshold, it is necessary to consider the effect on other values. If removing an indicator can increase the value of composite reliability and average variance extracted (AVE), it should be considered for deletion. Indicators with outer loadings below 0.40 should be considered for deletion [54,55].
The data in Table 4 indicate an outer loading value of ENV5 (−0.079) and ENV9 (−0.0239), less than 0.40. Based on the data obtained, the 3R activity (ENV5) implementation has yet to be carried out by most of the residents of Kampung Akuarium; it is suspected to be the reason why this indicator has the weakest relationship with the environment variable. In addition, only a few plants can be harvested for consumption in the KSA area. It has resulted in the utilization of local natural resources (ENV9) for consumption by residents needing to be carried out optimally in the future. The ENV5 and ENV9 indicators are removed from the subsequent calculation to boost the composite reliability and AVE values in the subsequent iteration.
However, it is essential to consider the effect on other values to remove indicators with a lower threshold in the subsequent calculation. If removing an indicator can increase the value of composite reliability and average variance extracted (AVE), it should be considered for deletion.
In the first iteration, the four variables’ composite reliability and AVE values did not meet the threshold. Indicator deletion was calculated gradually in each iteration for the composite reliability and AVE values to reach the specified threshold.
After eliminating several indicators in the model, Table 5 shows the outer loading values that have gone through several iterations until the outer loading, composite reliability, and AVE values meet the threshold criteria. The outer loadings value of each indicator has been sorted from the smallest value in the variable to the largest.
Indicators with correlation values with the smallest to largest community development variables are CD3, CD6, CD9, CD1, and CD7, with outer loading values of 0.572, 0.692, 0.695, 0.762, and 0.835, respectively. The values show that community convenience (CD7) strongly correlates with community development variables. Indicators with correlation values with the smallest to largest economy variables are ECON3, ECON4, ECON2, and ECON1, with outer loading values of 0.586, 0.625, 0.858, and 0.867, respectively. The values show that the work productivity of the community (ECON1) strongly correlates with economic variables.
Indicators with correlation values with the smallest to largest environment variables are ENV8, ENV1, ENV2, ENV10, and ENV7, with outer loading values of 0.572, 0.681, 0.746, 0.754, and 0.778, respectively. The values show that access to drinking water and clean water sanitation (ENV7) strongly correlate with environmental variables. Indicators with correlation values with the smallest to largest social variables are SOC5, SOC3, SOC1, SOC2, and SOC4, with outer loading values of 0.598, 0.721, 0.775, 0.786, and 0.800, respectively. The values show that equality between individuals (SOC4) strongly correlates with social variables.
Examining the value of the Average Variance Extracted (AVE) is the next step in the test. The AVE value below the threshold of 0.50 indicates a greater error variance than the variable variance [56]. Therefore, indicators and variables with an AVE value greater than 0.50 are considered valid [54]. The average variance extracted (AVE) values for each variable are shown in Table 6.
The community development variable has an AVE value of 0.513, the economic variable has an AVE value of 0.556, the environmental variable has an AVE value of 0.504, and the social variable has an AVE value of 0.547, as shown in Table 5, and, as all variables and indicators are valued above the threshold, they are considered valid.
Several strategies to assess discriminant validity are the Fornell-Larcker criterion, cross-loadings, and Heterotrait–Monotrait ratio (HTMT) [31]. Henseler [55] conveyed a new approach suggested by experts to evaluate discriminant validity using the Heterotrait–Monotrait ratio (HTMT). Hence, the strategy used in this study is the Heterotrait–Monotrait ratio (HTMT).
The HTMT value that is obtained is compared to the threshold that has been specified. A HTMT value that is higher than 0.90 indicates that there is no discriminant validity [34]. The results of the Heterotrait–Monotrait ratio (HTMT) are shown in Table 7.
As shown in Table 6 and compared to the threshold, all of the HTMT values for social, economic, environmental, and community development variables are less than 0.90. According to Hair [31], the value below the threshold indicates that variables can capture phenomena not represented by other variables.
The following test is internal consistency reliability analyzed with the composite reliability and Cronbach’s alpha value. Composite reliability ranges from 0 to 1, with a higher value indicating greater reliability. Cronbach’s alpha and composite reliability between 0.70 and 0.90 are considered satisfactory [54]. Table 8 displays the composite reliability and Cronbach’s alpha calculations’ outcomes.
As shown in Table 8, the composite reliability for community development, economy, environment, and social factors are 0.839, 0.829, 0.834, and 0.857, respectively. Furthermore, Cronbach’s alpha values of community development, economy, environment, and social factors are 0.758, 0.722, 0.761, and 0.790, respectively. The values have met the threshold value specifically between 0.70 and 0.90 and are considered reliable [54].
Figure 3 illustrates the design of the external model in the path diagram after the validation and reliability tests are calculated.

4.2. Structural Model Testing

The following data are processed with structural model analysis to test the outer model. The measurement is known as the coefficient of determination (value of R2) and is frequently used to evaluate structural models using endogenous variables. R2 values can be anywhere from 0 to 1, with higher values indicating greater prediction accuracy [54]. The R2 value is considered high if greater than 0.75, moderate if less than 0.50, and weak if greater than 0.25 [57]. The result of calculating R2 for the Sustainable Housing variable is 0.963, showing that community development, economic, social, and environmental variables influence 0.963 or 96.3% of sustainable housing variables.

4.3. Hypothesis Testing

Using SmartPLS 3.0 software, the research hypothesis was tested. The outcomes of the bootstrapping procedure are used to determine the values for this hypothesis test. Original Sample Estimates (O), also known as the path coefficient values, are some of the outcomes of the hypothesis testing process and are used to tell the direction of the relationship between variables. A positive relationship is indicated if O’s value is close to +1. On the other hand, a negative relationship is indicated when O’s value is close to −1 [58]. p-Values and T-Statistics are terms used to measure the significance of a relationship between variables. Table 9 displays the hypothesis test calculation results obtained from SmartPLS bootstrapping.
For the two-tailed test, the most common critical value is a t-value of 1.65 for α (significance level) of 10%, 1.96 for α (significance level) of 5%, and 2.57 for α (significance level) of 1%. For instance, if the empirical t-statistic measure has a value greater than 1.96, the indicator’s weight is statistically significant [57].
An empirical t-statistic value of 5.858, which is greater than 2.57, indicates that the weight of the community development indicator is statistically significant. A p-value of 0.000, which is lower than 0.01, indicates that the hypothesis of the relationship between community development and sustainable housing is acceptable. With a positive path coefficient value, it indicates that there is a direct positive linear relationship between the community development variable and sustainable housing of 0.521. Increasing community development will increase sustainable housing by 52.1%.
An empirical t-statistic value of 1.722, which is greater than 1.65, indicates a statistically significant economic indicator weight. A p-value of 0.086, which is lower than 0.10, indicates that the hypothesis of the relationship between economic variables and sustainable housing is acceptable. With a positive path coefficient value, it indicates that there is a direct positive linear relationship of economic variables to sustainable housing of 0.155. The increasing social will increase sustainable housing by 15.5%.
An empirical t-statistic value of 2.023, which is greater than 1.96, indicates a statistically significant environmental indicator weight. A p-value of 0.044, which is lower than 0.50, indicates that the hypothesis of the relationship between environmental variables and sustainable housing is acceptable. With a positive path coefficient value, it indicates that there is a linear positive direct relationship with environmental variables on sustainable housing of 0.290. Increasing the environment will increase sustainable housing by 29%.
An empirical t-statistic value of 2198 which is greater than 1.96, indicates a statistically significant social indicator weight. A p-value of 0.028, which is lower than 0.50, indicates that the hypothesis of the relationship of social variables to sustainable housing is acceptable. With a positive path coefficient value, it indicates that there is a direct positive linear relationship of social variables to sustainable housing of 0.335. The increasing social will increase sustainable housing by 33.5%.
The results of hypothesis testing indicate that sustainable housing positively correlates with all variables. In this case, community development has the most significant relationship with sustainable housing compared to other variables. The community development variable is followed by the social variable, environmental variable, and economic variable.

5. Conclusions and Recommendations

In this study, several indicators were compiled from four variables. What distinguishes this research from other studies is that variables considered for sustainable housing involve community development and the triple bottom line aspects: environmental, social, and economic. Indicators were compiled by conducting a preliminary study of Kampung Akuarium locations, interviews with key informants, and synthesis of the literature studies. An intensive study was conducted to collect the data from the questionnaires and then analyzed using Structural Equation Modeling (SEM), and several conclusions can be drawn.
Several indicators were eliminated because they had an outer loading value below the threshold. As mentioned in the previous section, ENV5 (the implementation of 3R) and ENV9 (utilization of existing resources) have yet to be carried out optimally, causing the indicators to obtain a weak correlation value with their latent variables. The findings indicate that KSA residents have performed most of the SH and community development indicators well and can be improved by considering solutions related to poorly implemented indicators.
The results of this study indicate that sustainable housing is positively correlated with all variables, showing that community development has a significant relationship with sustainable housing. In this case, community development has the most significant relationship compared to other variables. The social, environmental, and economic variables follow community development variables, emphasizing that community development is a significant variable in building sustainable housing to be used in subsequent studies.
KSA is still under development and building the next building block, causing some activities and plans to be paused. This is a challenge for the researcher since the work in progress influences the selection of indicators in this study.
In further studies, researchers and scholars are challenged to investigate Kampung Susun Akuarium with a complete building block area with a larger population. The recommendation for future research is to use initial indicators to evaluate and compare the current and future state of Kampung Susun Aquarium to see whether there has been an improvement over time.
As an example, the subsequent investigation is to evaluate the implementation of 3R (ENV5), which is yet to be implemented, as well as access to public transportation by the government (SOC8), which is yet optimally provided in the area. In addition, researchers in the future are recommended to use the indicators associated with access to pedestrian and internet network access, which are not currently available in the Kampung Susun Akuarium area due to the construction.

Author Contributions

Conceptualization, A.P. and S.W.; methodology, A.P. and B.G.; software, A.P.; validation, B.G. and S.W.; formal analysis, A.P.; investigation, A.P.; resources, A.P.; data curation, A.P.; writing—original draft preparation, A.P. and S.W.; writing—review and editing, A.P. and S.W.; visualization, A.P.; supervision, B.G.; project administration, A.P.; funding acquisition, S.W. All authors have read and agreed to the published version of the manuscript.

Funding

This research received no external funding.

Institutional Review Board Statement

Not applicable.

Informed Consent Statement

Informed consent was obtained from all subjects involve in the study.

Data Availability Statement

Data sharing is not applicable due to privacy restrictions.

Acknowledgments

This manuscript was supported by Direktorat Riset, Pengabdian Kepada Masyarakat dan Inovasi (DRPMI) Universitas Padjadjaran.

Conflicts of Interest

The authors declare no conflict of interest.

References

  1. Sarosa, W. Kota Untuk Semua: Hunian Yang Selaras Dengan Sustainable Development Goals dan New Urban Agenda; Expose: Jakarta, Indonesia, 2020. [Google Scholar]
  2. Harvey, D. Debates and Developments the Right to the City. Int. J. Urban Reg. Res. 2003, 27, 939–941. [Google Scholar] [CrossRef]
  3. Amirtahmasebi, R.; Vuova, Z.; Fox, E.O. The New Urban Agenda; UN-Habitat: Quito, Ecuador, 2020. [Google Scholar]
  4. Andri, A. Festival Jogokali: Resistensi Terhadap Penggusuran dan Gerakan Sosial-Kebudayaan Masyarakat Urban. J. Sosiol. Islam 2011, 1, 25. [Google Scholar]
  5. COHRE. Forced Evictions; COHRE: Geneva, Switzerland, 2009. [Google Scholar]
  6. Charlie, M.; Rizki, N.; Afiat, N. Mengais Di Pusaran Janji Laporan Penggusuran Paksa di Wilayah DKI Jakarta Tahun 2017; Penerbit Lembaga Bantuan Hukum Jakarta: Jakarta, Indonesia, 2017. [Google Scholar]
  7. Felix, A.; Castor, J.; Iqbalini, C. Seperti Puing Laporan Penggusuran Paksa di Wilayah DKI Jakarta Tahun 2016; Penerbit Lembaga Bantuan Hukum Jakarta: Jakarta, Indonesia, 2017. [Google Scholar]
  8. Indonesia, P.R. Undang-Undang Republik Indonesia Nomor 1 Tahun 2011 Tentang Perumahan dan Kawasan Permukiman; DPR RI: Jakarta, Indonesia, 2011. [Google Scholar]
  9. Gubernur Provinsi Daerah Khusus Ibukota Jakarta. Peraturan Daerah Provinsi Daerah Khusus Ibukota Jakarta Nomor 1 Tahun 2014 Tentang Rencana Detail Tata Ruang Dan Peraturan Zonasi; DPRD DKI Jakarta: Jakarta, Indonesia, 2014. [Google Scholar]
  10. Gubernur Provinsi Daerah Khusus Ibukota Jakarta. Peraturan Gubernur Provinsi Daerah Khusus Ibukota Jakarta Nomor 36 Tahun 2014 Tentang Rencana Induk Kawasan Kota Tua; DPRD DKI Jakarta: Jakarta, Indonesia, 2014. [Google Scholar]
  11. Hukum, L.B. Warga Kampung Akuarium Cabut Gugatan Class Action. 2018. Available online: https://bantuanhukum.or.id/warga-kampung-akuarium-cabut-gugatan-class-action/ (accessed on 22 January 2022).
  12. Mardiansjah, F.H.; Rahayu, P. Urbanisasi Dan Pertumbuhan Kota-Kota Di Indonesia: Suatu Perbandingan Antar-Wilayah Makro Indonesia. J. Pengemb. Kota 2019, 7, 91–110. [Google Scholar] [CrossRef]
  13. Harahap, F.R. Dampak Urbanisasi bagi Perkembangan Kota di Indonesia. Society 2013, 1, 35–45. [Google Scholar] [CrossRef]
  14. Pacione, M. Urban Geography: A Global Perspective, 3rd ed.; Routledge: London, UK, 2009. [Google Scholar]
  15. Ritohardoyo, S. Strategi Pembangunan Rumah Susun Berkelanjutan. J. Patrawidya 2015, 16, 391–405. [Google Scholar]
  16. Eni, S.P. Upaya-Upaya Pemerintah Daerah Provinsi DKI Jakarta dalam Mengatasi Masalah Permukiman Kumuh di Perkotaan. Scale 2015, 2, 243–252. [Google Scholar]
  17. Aditantri, R.; Fika, R. Program Perbaikan Kampung di Kampung Deret Petogogan, Jakarta Selatan. J. Urban Plan. Dep.-Podomoro Univ. 2019, 2, 33–43. [Google Scholar]
  18. Wijaya, A.; Ardalia, F.; Puspita, E. Pemanfaatan Ruang Komunal Pada Kawasan Permukiman Kumuh Perkotaan di Manggarai Jakarta Selatan. IKRA-ITH Teknol. 2019, 3, 17–26. [Google Scholar]
  19. Butters, C. Sustainable Human Settlements—Challenges for CSD; Nabu Press Publisher: New York, NY, USA, 2003. [Google Scholar]
  20. Murbaintoro, T.; Sutjahjo, S.H.; Saleh, I. Model Pengembangan Hunian Vertikal Menuju Keberlanjutan. J. Permukim. 2009, 4, 72–87. [Google Scholar] [CrossRef]
  21. Ingrao, C.; Messineo, A.; Beltraino, R.; Yigiticanlar, T.; Ioppolo, G. How can lifecycle thinking support assessment applications for energy efficiency and environmental performance. J. Clean. Prod. 2018, 201, 556–569. [Google Scholar] [CrossRef]
  22. Ioppolo, G.; Cucurachi, S.; Salovione, R.; Shi, L.; Yigitcanlar, T. Integrating strategic environmental assessment and material flow accounting A novel approach for moving towards sustainable urban futures. Int. J. Life Cycle Assess. 2019, 24, 1269–1284. [Google Scholar] [CrossRef]
  23. Ibiwumi, S.; Akiomon, E. Sustainable Housing in Developing Countries: A Reality or a Mirage; IntechOpen: London, UK, 2022. [Google Scholar] [CrossRef]
  24. Islam, N. Sustainability issues in urban housing in a low-income country: Bangladesh. Habitat Int. 1996, 20, 377–388. [Google Scholar] [CrossRef]
  25. Golubchikov, O.; Badyina, A. Sustainable Housing for Sustainable Cities; UN Habitat: Istanbul, Turkey, 2012. [Google Scholar]
  26. Shama, Z.S.; Motlak, J.B. Indicators for Sustainable housing. IOP Conf. Ser. Mater. Sci. Eng. 2019, 518, 022009. [Google Scholar] [CrossRef]
  27. Newman, P. Sustainability and Housing: More Than a Roof over Head; Australian Housing and Urban Research Institute: Melbourne, Australia, 2002. [Google Scholar]
  28. Bridges, R. Sustainable Home vs. Eco Friendly Home—What’s the Difference? Electricity Plans. 2022. Available online: https://electricityplans.com/eco-friendly-sustainable-home/#:~:text=While%20they%20are%20similar%2C%20they,the%20impact%20on%20future%20gen-era-tions (accessed on 5 January 2023).
  29. Robinson, J.W.; Green, G.P. Introduction to Community Development: Theory Practice and Service-Learning; SAGE: Newcastle upon Tyne, UK, 2011. [Google Scholar]
  30. Zubaedi. Pengembangan Masyarakat; Kencana: Jakarta, Indonesia, 2013. [Google Scholar]
  31. Tenriwaru. Kesejahteraan Tanpa Sekat: Sebuah Kritik Terhadap Akuntansi CSR, CV; Tohar Media: Makassar, Indonesia, 2019. [Google Scholar]
  32. Arai, S. Empowerment: From The Theoretical To The Personal. J. Leis. 1997, 24, 3–11. [Google Scholar]
  33. Kemal, Y. Executive Summary Evaluasi Kebijakan dan Pengelolaan Perumahan Kota Studi Kasus Kampung Akuarium di Jakarta Utara; Universitas Gajah Mada: Yogyakarta, Indonesia, 2022. [Google Scholar]
  34. Ashadi, A.; Nur’aini, R.D.; Lissimia, F.; Anisa, A.; Wahab, S.N.A. Perubahan Tata Ruang dan Fungsi Kampung Akuarium Jakarta. J. Ilm. Arsit. Dan Lingkung. Binaan 2022, 20, 51–64. [Google Scholar] [CrossRef]
  35. Stein, C.M.; Morris, N.J.; Hall, N.B.; Nock, N.L. Structural Equation Modeling. Methods Mol. Biol. 2017, 1666, 557–580. [Google Scholar] [CrossRef]
  36. Garson, G.D. Partial Least Squares: Regression & Structural Equation Models; Statistical Associates Publishing: Raleigh, NC, USA, 2016. [Google Scholar]
  37. Rachelle, L.; Schwanke, D. Mixed-Use Development Handbook; Urban Land Institute: Washington, DC, USA, 2003. [Google Scholar]
  38. Sudarwanto, B.; Pandelaki, E.E.; Soetomo, S. Pencapaian Perumahan Berkelanjutan ‘Pemilihan Indikator Dalam Penyusunan Kerangka Kerja Berkelanjutan’. Modul 2014, 14, 105–112. [Google Scholar]
  39. Budiharjo, E. Sejumlah Masalah Permukiman Kota; Alumni: Bandung, Indonesia, 1998. [Google Scholar]
  40. Wong, T.-C.; Yuen, B.; Goldblum, C. Spatial Planning for a Sustainable; Springer: Singapore, 2009. [Google Scholar]
  41. Muhtadi, M.; Anggara, A. Evaluasi Proses Program Community Action Plan Dalam Upaya Meningkatkan Kualitas Lingkungan di Kampung Akuarium Jakarta Utara. J. Al-Ijtimaiyyah Media Kaji. Pengemb. Masy. Islam 2019, 6, 31–52. [Google Scholar] [CrossRef]
  42. Herlianto. Urbanisasi, Pembangunan dan Kerusuhan Kota; Alumni: Bandung, Indonesia, 1987. [Google Scholar]
  43. Noegroho, N. Partisipasi Masyarakat Dalam Penataan Permukiman Kumuh di Kawasan Perkotaan: Studi Kasus Kegiatan PLP2K-BK di Kota Medan dan Kota Payakumbuh. Jkt. ComTech 2012, 3, 23–33. [Google Scholar] [CrossRef]
  44. Simbang, A.; Suandi, R. Keterkaitan Partisipasi Masyarakat Terhadap Kualitas Lingkungan Permukiman Kumuh Di Kelurahan Rajawali Dan Kelurahan Budiman Kecamatan Jambi Timur Kota Jambi. J. Pembang. Berkelanjutan 2019, 2, 74–81. [Google Scholar]
  45. Choguill, C.L. The search for policies to support sustainable housing. Habitat Int. 2007, 31, 143–149. [Google Scholar] [CrossRef]
  46. Elkington, J. Enter the Triple Bottom Line; Earths Can Publications Ltd.: London, UK, 2004. [Google Scholar]
  47. Savitz, A.W.; Weber, K. The Triple Bottom Line; Jossey-Bass: San Francisco, CA, USA, 2006. [Google Scholar] [CrossRef]
  48. Goel, P. Triple Bottom Line Reporting: An Analytical Approach for Corporate Sustainability. J. Financ. Account. Manag. 2010, 1, 27–42. [Google Scholar]
  49. Adyla, N.; Santoso, L.; Osman, W.W. Konsep Mixed Use pada Kawasan Rumah Susun Kecamatan Mariso Kota Makassar. J. Wil. Dan Kota Marit. 2013, 1, 49–54. [Google Scholar]
  50. Rizqiawan, H. Fasilitasi Inkubasi Usaha Mandiri Kecamatan Lakarsantri Kota Surabaya Tahun 2018. Pros. PKM-CSR 2019, 2, 1138–1146. [Google Scholar] [CrossRef]
  51. Rodhiyah, R. Peningkatan Perekonomian Rumah Tangga Miskin Melalui Fasilitasi Inkubasi Usaha Mandiri Pada Warga Rumah Susun Dupak Bandarejo. Pros. PKM-CSR 2019, 2, 1451–1458. [Google Scholar] [CrossRef]
  52. Chin, W.W. Issues and opinion on structural equation modeling. MIS Q. Manag. Inf. Syst. 1998, 22, vii–xvi. [Google Scholar]
  53. Hulland, J. Use of partial least squares (PLS) in strategic management research: A review of four recent studies. Strateg. Manag. J. 1999, 20, 195–204. [Google Scholar] [CrossRef]
  54. Hair, J.F.; Hult, G.T.M.; Ringle, C.M.; Sarstedt, M. A Primer on Partial Least Squares Structural Equation Modeling (PLS-SEM); SAGE Publications Inc.: Thousand Oaks, CA, USA, 2016. [Google Scholar]
  55. Henseler, J.; Ringle, C.M.; Sarstedt, M. A new criterion for assessing discriminant validity in variance-based structural equation modeling. J. Acad. Mark. Sci. 2015, 43, 115–135. [Google Scholar] [CrossRef]
  56. Fornell, C.; Larcker, D.F. Evaluating Structural Equation Models with Unobservable Variables and Measurement Error. J. Mark. Res. 1981, 18, 39–50. [Google Scholar] [CrossRef]
  57. Hair, J.F.; Hult, G.T.M.; Ringle, C.; Sarstedt, M.; Danks, N.; Ray, S. Partial Least Squares Structural Equation Modeling (PLS-SEM) Using R: A Workbook; Springer: Berlin/Heidelberg, Germany, 2021. [Google Scholar]
  58. Hair, J.F.; Ringle, C.M.; Sarstedt, M. PLS-SEM: Indeed a silver bullet. J. Mark. Theory Pract. 2011, 19, 139–152. [Google Scholar] [CrossRef]
Figure 1. Study area Kampung Akuarium.
Sustainability 15 08673 g001
Figure 2. Initial outer model path diagram.
Sustainability 15 08673 g002
Figure 3. Path diagram outer model.
Sustainability 15 08673 g003
Table 1. UN-Habitat sustainable housing policies.
NoEnvironmentSocialEconomy
1Energy, water, and resource efficiencyResident’s empowerment and public participationAffordability for marginal society
2Sustainable local material and constructionResident’s safety, health, and wellbeingLabour productivity, integrated housing, and employment
3Prevention of pollutants and unsafe materials in sanitationSense of community, place, and identityDomestic economic enterprise and activity assistance
4Housing resilience and adaptionSpecific housing needs and desireHousing management and maintenance
5Use of resources at a reasonable costAccess to infrastructure and public spacesHousing resilience and future-proof factors
Table 2. The hypothesis between the latent variables.
No.Hypothesis
1H0There is no relationship between community development and sustainable housing
H1There is a relationship between community development and sustainable housing
2H0There is no relationship between the economy and sustainable housing
H1There is a relationship between the economy and sustainable housing
3H0There is no relationship between the environment and sustainable housing
H1There is a relationship between the environment and sustainable housing
4H0There is no relationship between social and sustainable housing
H1There is a relationship between social and sustainable housing
Table 3. Latent variables and indicators.
Latent
Variables
IndicatorDescription
Community developmentCD1Residents’ participation in obtaining decent housing [31]
CD2Residents’ awareness for better change [32]
CD3Active search for information and knowledge [32]
CD4Residents’ contribution in an activity [32]
CD5Equality between individuals [31]
CD6Safety of the residents [31]
CD7The convenience of the residents [31]
CD83 aspects of sustainability [31]
CD9Collaboration between residents and other stakeholders [31]
EconomyECON1Work productivity of the community [27]
ECON2Workplace access [25]
ECON3Residents’ income
ECON4Utilization of the village area [25,27,37]
ECON5Utilization of existing resources [25,27,37]
ECON6Training to increase skills [38]
SocialSOC1Access to communal space [25]
SOC2Formation of community among residents [25,38]
SOC3Residents’ participation in an event [25,38]
SOC4Equality between individuals [27]
SOC5Access to health services [25,38]
SOC6Residents’ safety and convenience [25,38]
SOC7Access to education [25,38]
SOC8Public transportation access [25,26]
SOC9Access to the electricity network [25,26]
EnvironmentENV1Cleanliness of the village area
ENV2Electrical energy efficiency [25]
ENV3Collection of bottle waste [38]
ENV4Waste bank [38]
ENV5Implementation of 3R (Reduce, Reuse, Recycle) [27,38]
ENV6Collection of used cooking oil [38]
ENV7Access to drinking water and clean water sanitation [25,39]
ENV8Use of clean water [25,39]
ENV9Use of local natural resources [25]
ENV10Green open space access [25,38,40]
ENV11Cleanliness and maintenance of green open space [25,38,40]
Table 4. Results of outer loading iteration 1.
IndicatorCommunity DevelopmentEconomyEnvironmentSocial
CD10.729
CD20.456
CD30.604
CD40.420
CD50.459
CD60.623
CD70.811
CD80.483
CD90.670
ECON1 0.802
ECON2 0.782
ECON3 0.532
ECON4 0.688
ECON5 0.423
ECON6 0.410
SOC1 0.642
SOC2 0.693
SOC3 0.706
SOC4 0.777
SOC5 0.632
SOC6 0.434
SOC7 0.541
SOC8 0.439
SOC9 0.654
ENV1 0.603
ENV2 0.702
ENV3 0.465
ENV4 0.706
ENV5 −0.079
ENV6 0.652
ENV7 0.704
ENV8 0.446
ENV9 0.239
ENV10 0.586
ENV11 0.433
Table 5. Results of outer loading.
Community DevelopmentOuter Loading
CD3Active search for information and knowledge0.572
CD6Safety of the residents0.692
CD9Collaboration between residents and other stakeholders0.695
CD1Residents’ participation in obtaining decent housing0.762
CD7The convenience of the residents0.835
Economy
ECON3Residents’ income0.586
ECON4Utilization of the village area0.625
ECON2Workplace access0.858
ECON1Work productivity of the community0.867
Environment
ENV8Use of clean water0.572
ENV1Cleanliness of the village area0.681
ENV2Electrical energy efficiency0.746
ENV10Green open space access0.754
ENV7Access to drinking water and clean water sanitation0.778
Social
SOC5Access to health services0.598
SOC3Residents’ participation in an event0.721
SOC1Access to shared space0.775
SOC2Formation of community among residents0.786
SOC4Equality between individuals0.800
Table 6. Results of Average Variance Extracted (AVE).
VariableAverage Variance Extracted (AVE)
Community Development0.513
Economy0.556
Environment0.504
Social0.547
Table 7. Results of Heterotrait–Monotrait (HTMT).
VariableCommunity DevelopmentEconomyEnvironmentSocial
Community
Development
Economy0.262
Environment0.8760.159
Social0.5730.3270.283
Table 8. Results of internal consistency reliability.
VariableCronbach’s AlphaComposite Reliability
Community Development0.7580.839
Economy0.7220.829
Environment0.7610.834
Social0.7900.857
Table 9. Results of the hypothesis test.
VariableOriginal
Sample (O)
T Statistics (|O/STDEV|)p Values
Community Development →
Sustainable Housing
0.5215.8580.000
Economy → Sustainable Housing0.1551.7220.086
Environment → Sustainable Housing0.2902.0230.044
Social → Sustainable Housing0.3352.1980.028
Disclaimer/Publisher’s Note: The statements, opinions and data contained in all publications are solely those of the individual author(s) and contributor(s) and not of MDPI and/or the editor(s). MDPI and/or the editor(s) disclaim responsibility for any injury to people or property resulting from any ideas, methods, instructions or products referred to in the content.

