Article

Tunnel Face Stability Considering the Influence of Excess Slurry Pressure

1
School of Civil Engineering, Central South University, Changsha 410075, China
2
School of Geosciences and Info-physics, Central South University, Changsha 410075, China
3
School of Architecture, Tianjin University, Tianjin 300072, China
*
Author to whom correspondence should be addressed.
Sustainability 2023, 15(10), 8230; https://doi.org/10.3390/su15108230
Submission received: 9 April 2023 / Revised: 5 May 2023 / Accepted: 16 May 2023 / Published: 18 May 2023

Abstract

:
With excess slurry pressures exerted on the tunnel face, slurry particles tend to infiltrate into the soil in front of the tunnel. There will be excess pore pressure ahead of the tunnel in the case of infiltration, leading to an impairment in the supporting effect contributed by the excess slurry pressure. Corresponding to three slurry infiltration scenarios distinguished by the forms of the filter cake, different pressure transfer models are employed to describe the pore pressure distribution. Using the kinematic approach of limit analysis and the numerically simulated seepage field, the study of tunnel face stability under different slurry infiltration cases is extended by employing a 3D discretization-based failure mechanism. In addition, two simple empirical formulas describing the pore pressure distributions above the tunnel and in advance of the tunnel are established and verified. Combined with the dichotomy method and strength reduction method, the safety factors yielding rigorous upper-bound solutions are obtained by optimization. The proposed method is validated by a comparative analysis. The developed framework allows considering the influence of excess pore pressure on the whole failure mechanism and the three-dimensional characteristics of seepage. A parameter analysis is performed to study the effect of the excess slurry pressure, hydraulic conditions, soil strength properties, and pressure drop coefficient. The results show that the steady-state flow model leads to much more conservative results than the full-membrane model. The safety factor increases with the increasing excess slurry pressure and the decreasing pressure drop coefficient. The present work provides an effective framework to quickly assess the face stability of tunnels under excess slurry pressure considering different filter cake scenarios.

1. Introduction

For shield-driven tunnels, it is very crucial to accurately evaluate the tunnel face stability and determine the necessary slurry support pressure [1,2]. Scholars [3,4] usually assessed the face stability of slurry shield tunnels using the full-membrane model, in which the slurry pressure is transferred to the soil skeleton by forming a dense filter cake in front of the TBM, and the applied slurry supporting force is assumed to completely support the soil skeleton. However, the full-membrane model is only suitable for some exceptional cases, such as opening the chamber to repair the slurry shield [5,6]. Due to the slurry pressure exceeding the soil’s pore pressure, the slurry is expected to permeate the leading soil, inducing a fluid flow and causing excess pore pressure in advance of the tunnel [7]. The existence of excess pore water pressure in front of the slurry shield tunnels has been widely measured and reported [8,9]. The excess pore pressure will considerably reduce the slurry-supporting effect, thereby reducing tunnel face stabilities [8,10,11]. When infiltration occurs, the total slurry pressure shall be divided into three components, namely, the component that combats the hydrostatic pressure in t soils, the excess pore pressure, and the effective support pressure to resist the earth pressure [10,12]. For decades, the slurry infiltration process, including the maximum range of slurry penetrations [13], the development of filter cakes [14], and the prediction of excess pore pressure distributions [15], has attracted much research interest. To explore the slurry infiltration process, slurry filtration column tests are widely conducted [16,17]. Several analytical studies have also given significant attention to delineating the progression of slurry infiltrations, and various models have been developed [8]. According to the filter cake forms and the types of potential flow motivated by the excess slurry pressure, the slurry infiltration cases can be generally divided into three types: full filter cake, partial filter cake, and no filter cake [10]. The filter cake forms are controlled by the relation between the slurry infiltration velocity V sl and the TBM velocity V TBM . In addition, the formation of the filter cake is also affected by the properties of slurry and soils, including the permeability of soil masses, permeability of slurry, the rheological properties of slurry (density and viscosity), and the particle size distribution [10]. Coefficient α ( 0 α 1 ) is introduced to model the pressure change within the filter cake. When α approaches the lower limit of 0, it indicates the formation of a dense filter cake, where the slurry pressure is entirely exerted over the cake. Conversely, when α approaches the maximum value 1, it implies that no cake is formed. In the case where α lies between 0 and 1, a partial filter cake is formed, and there will be a partial pressure drop over the cake. The coefficient α can be determined according to the measurement [18]. In addition, with the assumption that the velocities of TBM and slurry infiltration are equal, Steenken [19] presented an equation to determine α , namely the following:
α = n R V TBM ( φ m φ ) k
where n is the porosity of the soil, R denotes the tunnel radius, and k denotes the permeability of the soil.
A reasonable assessment of the stability of the tunnel face is always a changing task, especially in complex conditions [20,21]. In recent years, the concept of sustainable development has been increasingly emphasized in practical engineering, such as green materials and green buildings [22,23]. To be in line with the concept of sustainability, it is of practical importance to reasonably evaluate the stability of engineering structures to achieve savings in support [24,25,26,27]. There have been few studies examining the stability of tunnel faces in light of slurry infiltration. To address this, the wedge model incorporating the infiltrated zone has been employed, utilizing limit equilibrium theory to evaluate tunnel face stability [5,9]. In these studies, the slurry infiltration leads to a mass force applied on the soil skeleton, and the total slurry support can be derived by the integration of the mass force over the zone of the wedge (i.e., the triangle soil column). However, it should be noted that this method has theoretical defects: First of all, the infiltration is described by a one-dimensional formula for the entire tunnel face, whereas in practice, seepage occurs in three dimensions. Secondly, it only considers the excess pore pressure in the circular area in front of the tunnel. However, the excess pore pressure exists not only in the front of the tunnel face but also above the tunnel, acting on the whole failure mechanism, not just the lower part of the wedge model (i.e., triangle soil column). In addition, several failure mechanisms better than the wedge model have been successfully employed in the studies on tunnel face stability, such as the horn failure mechanism proposed by Subrin and Wong [28], the improved multi-block mechanism proposed by Mollon et al. [29] and the advanced 3D rotational failure mechanism using the spatial discrete technology proposed by Mollon et al. [30]. Concerning the numerical methods, Bezuijen et al. [31] used the finite element program DIANA to calculate the critical slurry pressure in different cases of pressure drop over the filter cake. Kaalberg et al. [32] performed a 3D FEM analysis in 3D PLAXIS and derived the safety factors. In these analytical and numerical studies, the effect of slurry infiltration is typically confined to a cylindrical range ahead of the tunnel face, and the slurry pressure acting on the tunnel surface is usually assumed uniform. Moreover, the variation of the slurry pressure in the vertical direction should be considered. There is also a lack of comparison of the results of tunnel surface stability under different slurry infiltration cases. The objective of this work is to develop a useful framework for assessing the stability of tunnel faces under excess slurry pressure. Since the framework is developed from a discrete aspect, it allows the effects of slurry infiltration to be considered over the entire potential failure area.
The primary objective of this paper is to evaluate the stability of tunnel faces driven by slurry shields, taking into account the impact of excess slurry pressure exerted on the tunnel face. The ideal full-membrane model and steady-state model are introduced to describe the impact of slurry infiltration, in which the results of the steady-state model are analyzed emphatically, and the full-membrane model serves as a reference. Firstly, a numerical simulation is performed to model the slurry infiltration. In addition, two empirical formulas are established through trial and error to model the pore pressure development in front of and above the tunnel. Then, based on pore pressure distributions derived from the numerical simulation and empirical formulas, an interpolation based on the extracted numerical results is performed in Matlab to determine the pore pressure of each discrete point in the 3D rotational failure mechanism. Combined with the strength reduction method and dichotomy method, the safety factors corresponding to different filter cake models, various tunnel geometry, excess slurry pressure, hydraulic conditions, and soil properties can be obtained through optimization. The results of the pore pressure distribution and the tunnel face stability are verified by a comparison with previous research. Through the analysis process established in this work, the influence of excess pore pressure on the whole failure mechanism, the variation of slurry pressure in the vertical direction, and the three-dimensional characteristics of seepage are all involved. A parameter analysis is then performed to study the effect of excess slurry pressure, hydraulic conditions, pressure drop coefficient, and soil strength properties. Finally, several design charts are given for practical reference.

2. Problem and Methodology

2.1. Depiction of Tunnel Faces Subjected to Excess Slurry Pressures

As shown in Figure 1, a circular tunnel having a diameter of d and buried at depth C is being excavated beneath the water table while experiencing linear excess slurry pressure acting on its face. The chamber filled with pressurized bentonite slurry can provide counterpressure to the excavated tunnel face. Hw denotes the location of water table with respect to the tunnel crown. P 0 refers to a typical point ahead of the tunnel face. h e and h 0 represent the piezometric head and the groundwater level elevation measured from the point P 0 ( h e > h 0 ). The sketch of the slurry pressure is also presented in Figure 1, in which the average slurry pressure can be written as p + γ slu R + γ w H w , where p represents the excess slurry pressure at the tunnel crown; γ slu and γ w are the unit slurry weight and the unit water weight; R is the tunnel radius. Several necessary assumptions are made in this paper: the soil and slurry are both considered homogeneous and isotropic in the analysis.
Under pressure, the bentonite slurry penetrates into the soil mass and tries to form a cake. After a distinct pressure drop within the filter cake, the slurry keeps infiltrating forwards a certain distance, defined as the infiltration zone, beyond which the pore pressure progressively drops to the hydrostatic pressure [10,13]. Throughout the process of infiltration, the excess pore pressure undergoes a continuous dissipation, while the slurry pressure undergoes a continuous transfer to the effective support. Based on different slurry infiltration cases, Figure 2 illustrates three excess slurry pressure transfer models, where the pressure drop trend and the accumulation of the transferred excess slurry pressure during infiltration away from the tunnel face are sketched. The primary distinctions among these three models reside in the extent of pressure reduction within the filter cake range and the subsequent flow after the pressure drop, which leads to the difference in the efficiency of the excess slurry pressure transfer.
As shown in Figure 2a, a complete filter cake is usually developed under the condition of V TBM = 0 (i.e., the standstill stage), and the permeability of the slurry through soil masses is very small [19]. In this case, the slurry particles can only penetrate a small distance through the cutter head and accumulate to form a dense filter cake. The filter cake’s permeability is much less than the soil’s permeability, and thus the fluid is prevented from infiltration, which can be regarded as the case of no flow [33]. For this particular scenario, the full-membrane model can be utilized to depict the pressure change, wherein the entire excess slurry pressures are transferred to the effective support through the full filter cake.
In Figure 2b, no filter cake is formed; and the excess pressure gradually decreases ahead of the tunnel face. The excess slurry pressure is transferred only through the flow. The case of no filter cake usually occurs when the velocity of TBM V TBM is faster than that of slurry infiltration V sl but slower than that of the water infiltration [19]. In this situation, the slurry particles are continually mixed with the soil in the chamber and removed. Thus, there is no filter cake formed ahead of the tunnel face, and only the water is continuously infiltrated into soil masses ahead [7]. Bezuijen et al. [31] proposed the steady-state flow model to model the pressure transfer in the case of no filter cake, in which an approximate one-dimensional expression is used to predict the distribution of excess pore pressure and has been verified by mode tests and measured data [19,34]. The steady-state flow model is mainly suitable in homogeneous soils in unconfined aquifers. It assumes that the tunneling process conforms to the quasi-static condition; that is, the flow from the tunnel face remains steady, and the tunnel face maintains a constant excess slurry pressure [19].
Figure 2c shows a partially formed filter cake, which is usually formed when V sl > V TBM . The pressure transfer is processed through the filter cake and the flow, which results in a distinct pressure drop over the partial filter cake. The remaining pressure will lead to a flow in front of the cake. There exist two methods to describe the pressure transfer of the partial cake. One is the transient flow model, where a linearly varied pressure drop is assumed across the “average cake” by computing the maximum infiltration distance and time span [13]. Within the theory of elastic storage, it assumes a transient flow in a semi-confined aquifer. Employing the transient flow model of the whole excavation cycle, including the drilling and intermediate standstill stages, the increase and dissipation of excess pore pressure ahead of the tunnel can be expressed. Combined with the estimation of the flow rate from the working chamber, the transient flow model can well predict the excess pore pressure under the condition of a multi-layered case [7]. The other is the reduction coefficient-based steady-state model, where the coefficient α ( 0 < α < 1 ) represents the pressure drop.
In the present study, the cases of full filter cake, no filter cake, and partial filter cake are considered. As stated in Bezuijen et al. [31], the excess pore pressure distribution derived from the transient flow and the reduction coefficient-based steady-state flow model is similar in the range of 2 to 3 times the diameter ahead of the tunnel face. Meanwhile, the failure mechanism is generally confined in the 1-diameter range in advance of the tunnel. Consequently, it is assumed that the solution from the reduction coefficient-based steady-state flow model is similar to that assessed by the transient flow model. In addition, the full-membrane model is only suitable for the rare cases where the filter cake is formed well and can completely transform the slurry pressure to stabilize tunnel faces.

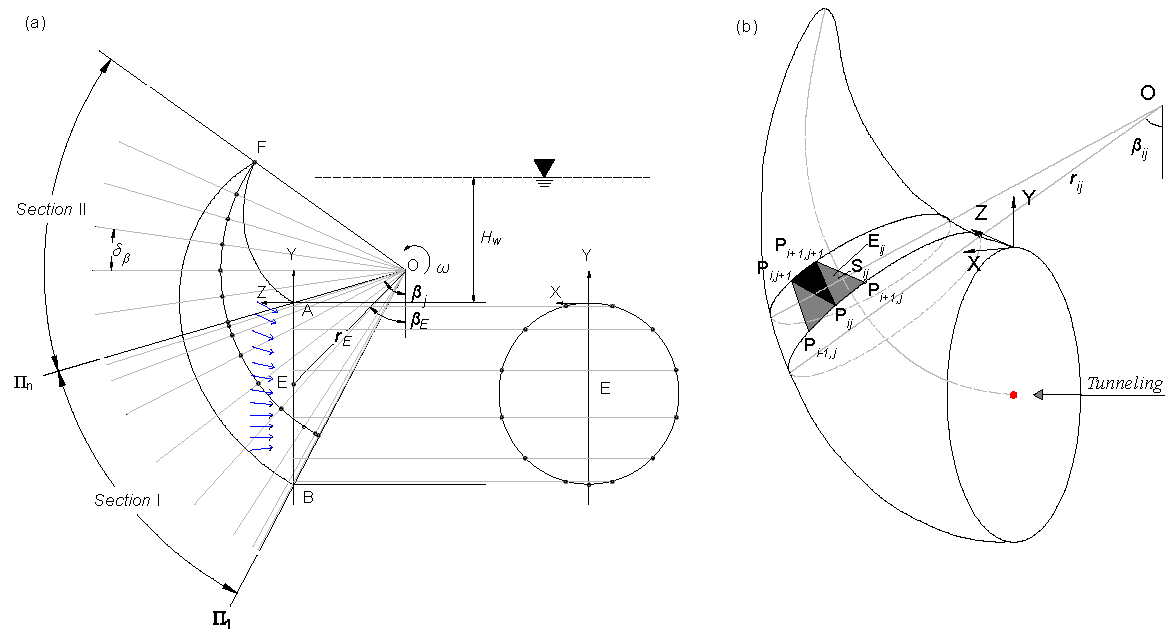
2.2. Kinematical Analysis of the Tunnel Face

Here, the tunnel face stability is evaluated using the 3D discretization-based failure mechanism proposed by Mollon et al. [30], as illustrated in Figure 3. The process of generating discrete points can be divided into Section I and Section II, where the discrete accuracy is controlled by parameters n and δβ, as shown in Figure 3. For the specific process of generating discrete points, please refer to Mollon et al. [30]. The rotational center is expressed by β E and r E , which also serves as optimization parameters used to identify the critical failure state.
In the considered problem, the external work includes the following items: pore pressure, soil gravity, and slurry pressure. The calculation of the limit analysis is performed by equaling the internal energy dissipation rates and external work rates [35,36,37,38,39]. To balance the work rate equation, an index σf representing the extra required uniform support pressure, in addition to the applied slurry pressure to maintain the tunnel face stability, is introduced. By calculating the work rates of pore pressure, soil weight, slurry pressure, and internal energy dissipation, the critical extra supporting pressure σf can be derived as follows:
σ f = γ sat d N γ + γ w H w N p p c N c σ s p N s p
with c and γ sat being the soil cohesion and the unit saturated weight; σ s p being the average slurry pressure over the tunnel face; N γ , N c , N s p , and N p p being the dimensionless coefficients denoting the contribution of soil gravity, cohesion, slurry pressure, and pore pressure. The expression of N γ , N c , N p p , and N s p are [30,40] as follows:
N c = cos φ i j ( R i j S i j ) j ( j S j R j cos β j )
N γ = i j ( R i j V i j sin β i j ) d j ( j S j R j cos β j )
N p p = sin φ i j ( p p i j R i j S i j ) j ( j S j R j cos β j )
N s p = j ( j σ s p j S j R j cos β j ) σ s p j ( j S j R j cos β j )
in which S i j , V i j , and ( β i j , R i j ) are the area, volume, and the corresponding local coordinate of the discrete elements of the failure surface (see Figure 3); while Sj and ( β j , R j ) are the area and corresponding local coordinate of the discrete elements of the tunnel face; and σ s p j and p p i j are the slurry pressures and pore pressures corresponding to a discrete element, as shown in Figure 3. Please note that for the work rate of pore pressure, due to the assumption that the block rotation is rigid, the volumetric strain is zero in the rotational mechanism, and the work rate of pore pressure with respect to the volumetric strain is neglected. The work rate of pore pressure at the tunnel face has been involved as the slurry pressure; thus, only the work rates of the pore pressure on the velocity discontinuity of the failure mechanism are considered here.

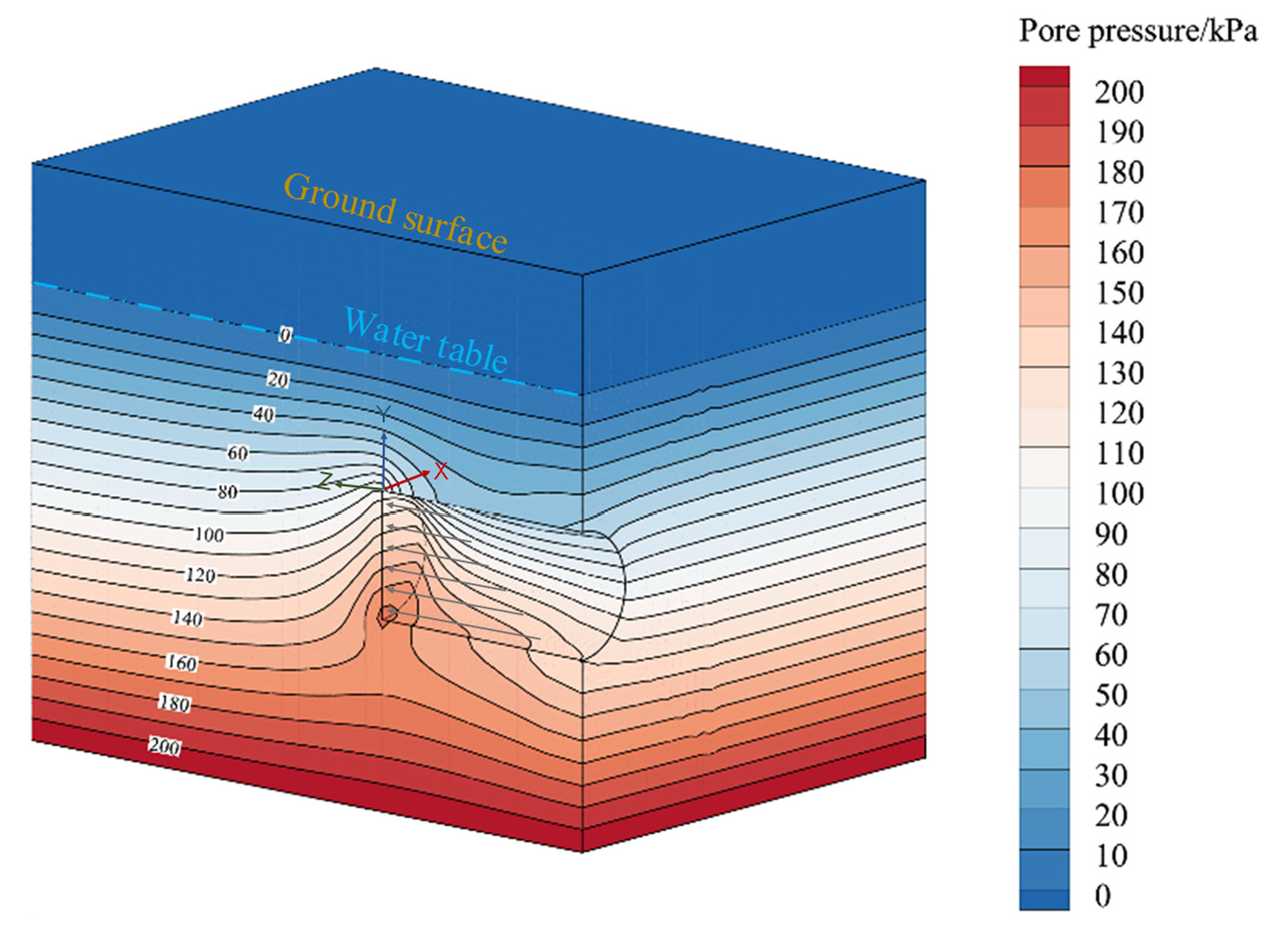
2.3. Numerical Simulation of Seepage Flow Due to Excess Slurry Pressure

To obtain the hydraulic field induced by the excess slurry pressure, a numerical computation simulating the steady-state flow is progressed in the software FLAC3D6.0, which is based on finite difference techniques. Similar process of the steady-state seepage analysis has been successfully employed in previous studies for simulating the seepage during tunnel excavations [31]. For the case of homogeneous soils in unconfined aquifers with constant excess slurry pressure, it can be regarded that the tunneling process conforms to the quasi-static condition, and, therefore, it is feasible to adopt the steady-state flow model in the numerical simulation for the considered problem. A 3D numerical model, as illustrated in Figure 4, is built, in which only half of the tunnel is regarded on account of vertical symmetry. It is made up of 73,656 zones and 78,204 grid points. The diameter of the tunnel is fixed at d = 6   m , and the buried depth amounts to C/d = 2. The area neighboring the tunnel is notably encrypted. To eliminate the size effect, the size of the model is set large enough, which is 4D for X-axis direction, 4.5D for Y-axis direction, and 5.5D for Z-axis direction. The permeability coefficient of the soil, as well as the water table and excess slurry pressure, are assumed to remain constant. The lining element is configured to be impermeable, thus limiting seepage to the tunnel face alone. With reference to the experimental investigations conducted in Zizka [41], other parameters are set as follows: γslu = 12 kN/m3 and k , the permeability coefficient, is 5 × 10 8 m/s. The groundwater level H w and excess slurry pressure p differ from the working conditions.
The numerical pore pressure distribution of a typical case is presented in Figure 5, where Hw/d = 1.0, p = 50 kPa. As a result of the influence of excess slurry pressure, the hydraulic conditions have undergone a significant alteration, and the pore pressures ahead of the tunnel are noticeably greater than the hydrostatic pressures, particularly in the vicinity of the tunnel face. Therefore, it is imperative to incorporate this factor into assessing the tunnel face.

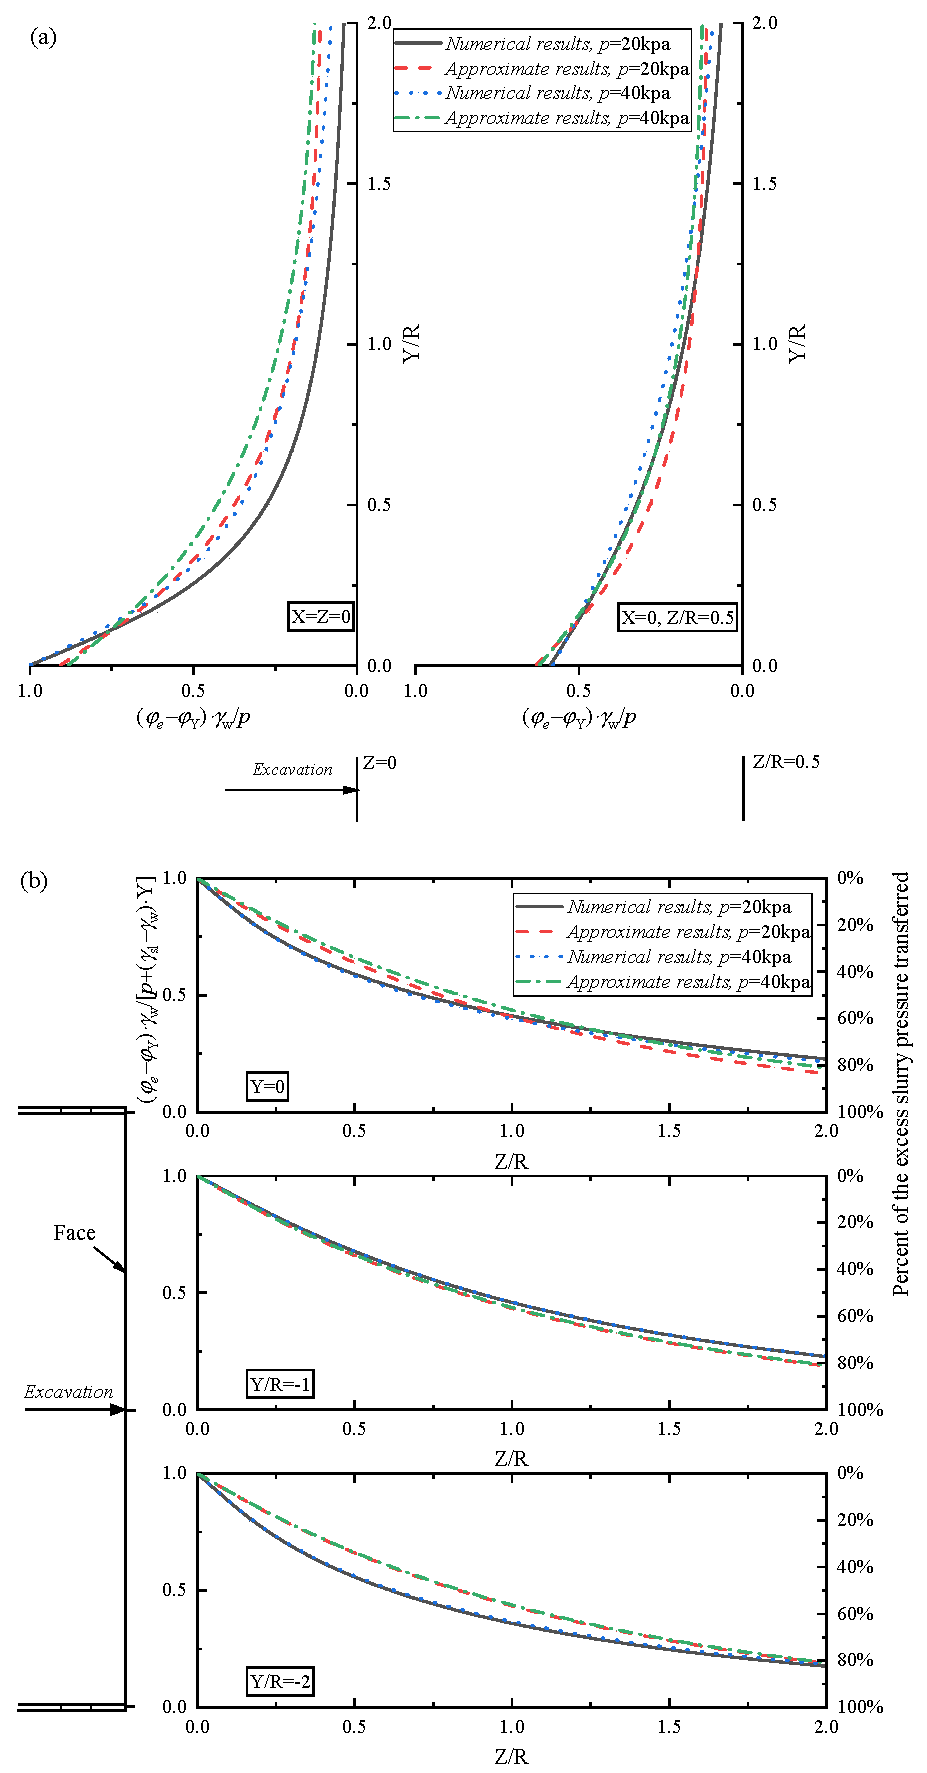
2.4. Empirical Formulas for Approximating the Piezometric Head under the Slurry Infiltration

Since it requires a lot of calculation cost to obtain the pore pressure distribution through numerical simulation, this part attempts to establish an empirical formula to describe the pore pressure development. According to a large number of numerical results, it can be found that the variation of the excess piezometric head within the potential range of the failure mechanism is mainly related to the geometric conditions of the tunnel and the initial excess piezometric head but has little relationship with the hydrostatic level and the buried depth. As the pressure head is uniform in the X direction and the seepage gradient in the X direction is very small, the influence of the X coordinate is ignored. In general, the piezometric head of a specified point can be fitted as follows:
φ e ( X , Y , Z ) = f ( Y , Z , R , p , γ slu )
where X, Y, and Z denote the coordinates based on the coordinate system shown in Figure 3: R represents the radius of the tunnel; p is the excess slurry pressure in the tunnel crown; and γ slu is the unit weight of the slurry.
Through a large amount of trial and error and verification, the piezometric head ahead of the tunnel ( y < 0 ) can be approximately fitted as
φ e ( X , Y , Z ) = φ Y + [ p ( γ slu γ w ) Y ] / γ w e m 1 Z R
The piezometric head above the tunnel ( y   >   0 ) can be approximately fitted as
φ e ( X , Y , Z ) = φ Y + n 1 p / γ w e m 1 Z m 2 Y R + n 2
where φ Y denotes the hydrostatic head and m 1 ,   m 2 ,   n 1 , and n 2 are the fitting parameters that depend on the numerical results. It should be noted that Equations (9) and (10) are only suitable for the case of steady-state flow. With regard to the case of partial filter cake, the items denoting the initial excess slurry pressure, [ p ( γ slu γ w ) Y ] in Equation (9) and p in Equation (10), should be multiplied with the coefficient α ( 0 < α < 1 ) to consider the pressure drop within the partial cake.
As shown in Figure 6, the numerical solution of the normalized excess piezometric head contour and the empirical equation solution are compared, in which two typical vertical lines ( Z = 0 and Z / R = 0.5 ) and three typical horizontal lines ( Y = 0 , Y / R = 1 , and Y / R = 2 ) in the symmetry plane ( X = 0 ) of the tunnel are selected for comparisons. In addition, the proportion of the effective slurry pressure transferred ahead of the tunnel is also illustrated in Figure 6. With the fitting parameters set as m 1 = 0.840 , m 2 = 2.213 , n 1 = 0 . 805 , and n 2 = 2 . 039 for the case of p = 20 kPa and m 1 = 0.832 , m 2 = 1.801 , n 1 = 0 . 776 , and n 2 = 4 . 295 for the case of p = 40 kPa , the approximate results of the excess piezometric head generally agree well with the numerical results. In Figure 7, it can be observed that the excess pore pressure will experience a great decrease near the tunnel face, and the excess pore pressure far away from the tunnel will decrease more and more slowly and gradually tends to a stable value. During this process, an increasing proportion of excess slurry pressure is converted to effective support pressure, eventually stabilizing at about 80% at the position of Z/R = 2. The results of pore pressure derived from the empirical equation are incorporated into the assessment of the tunnel face stability in the following analysis for comparisons.

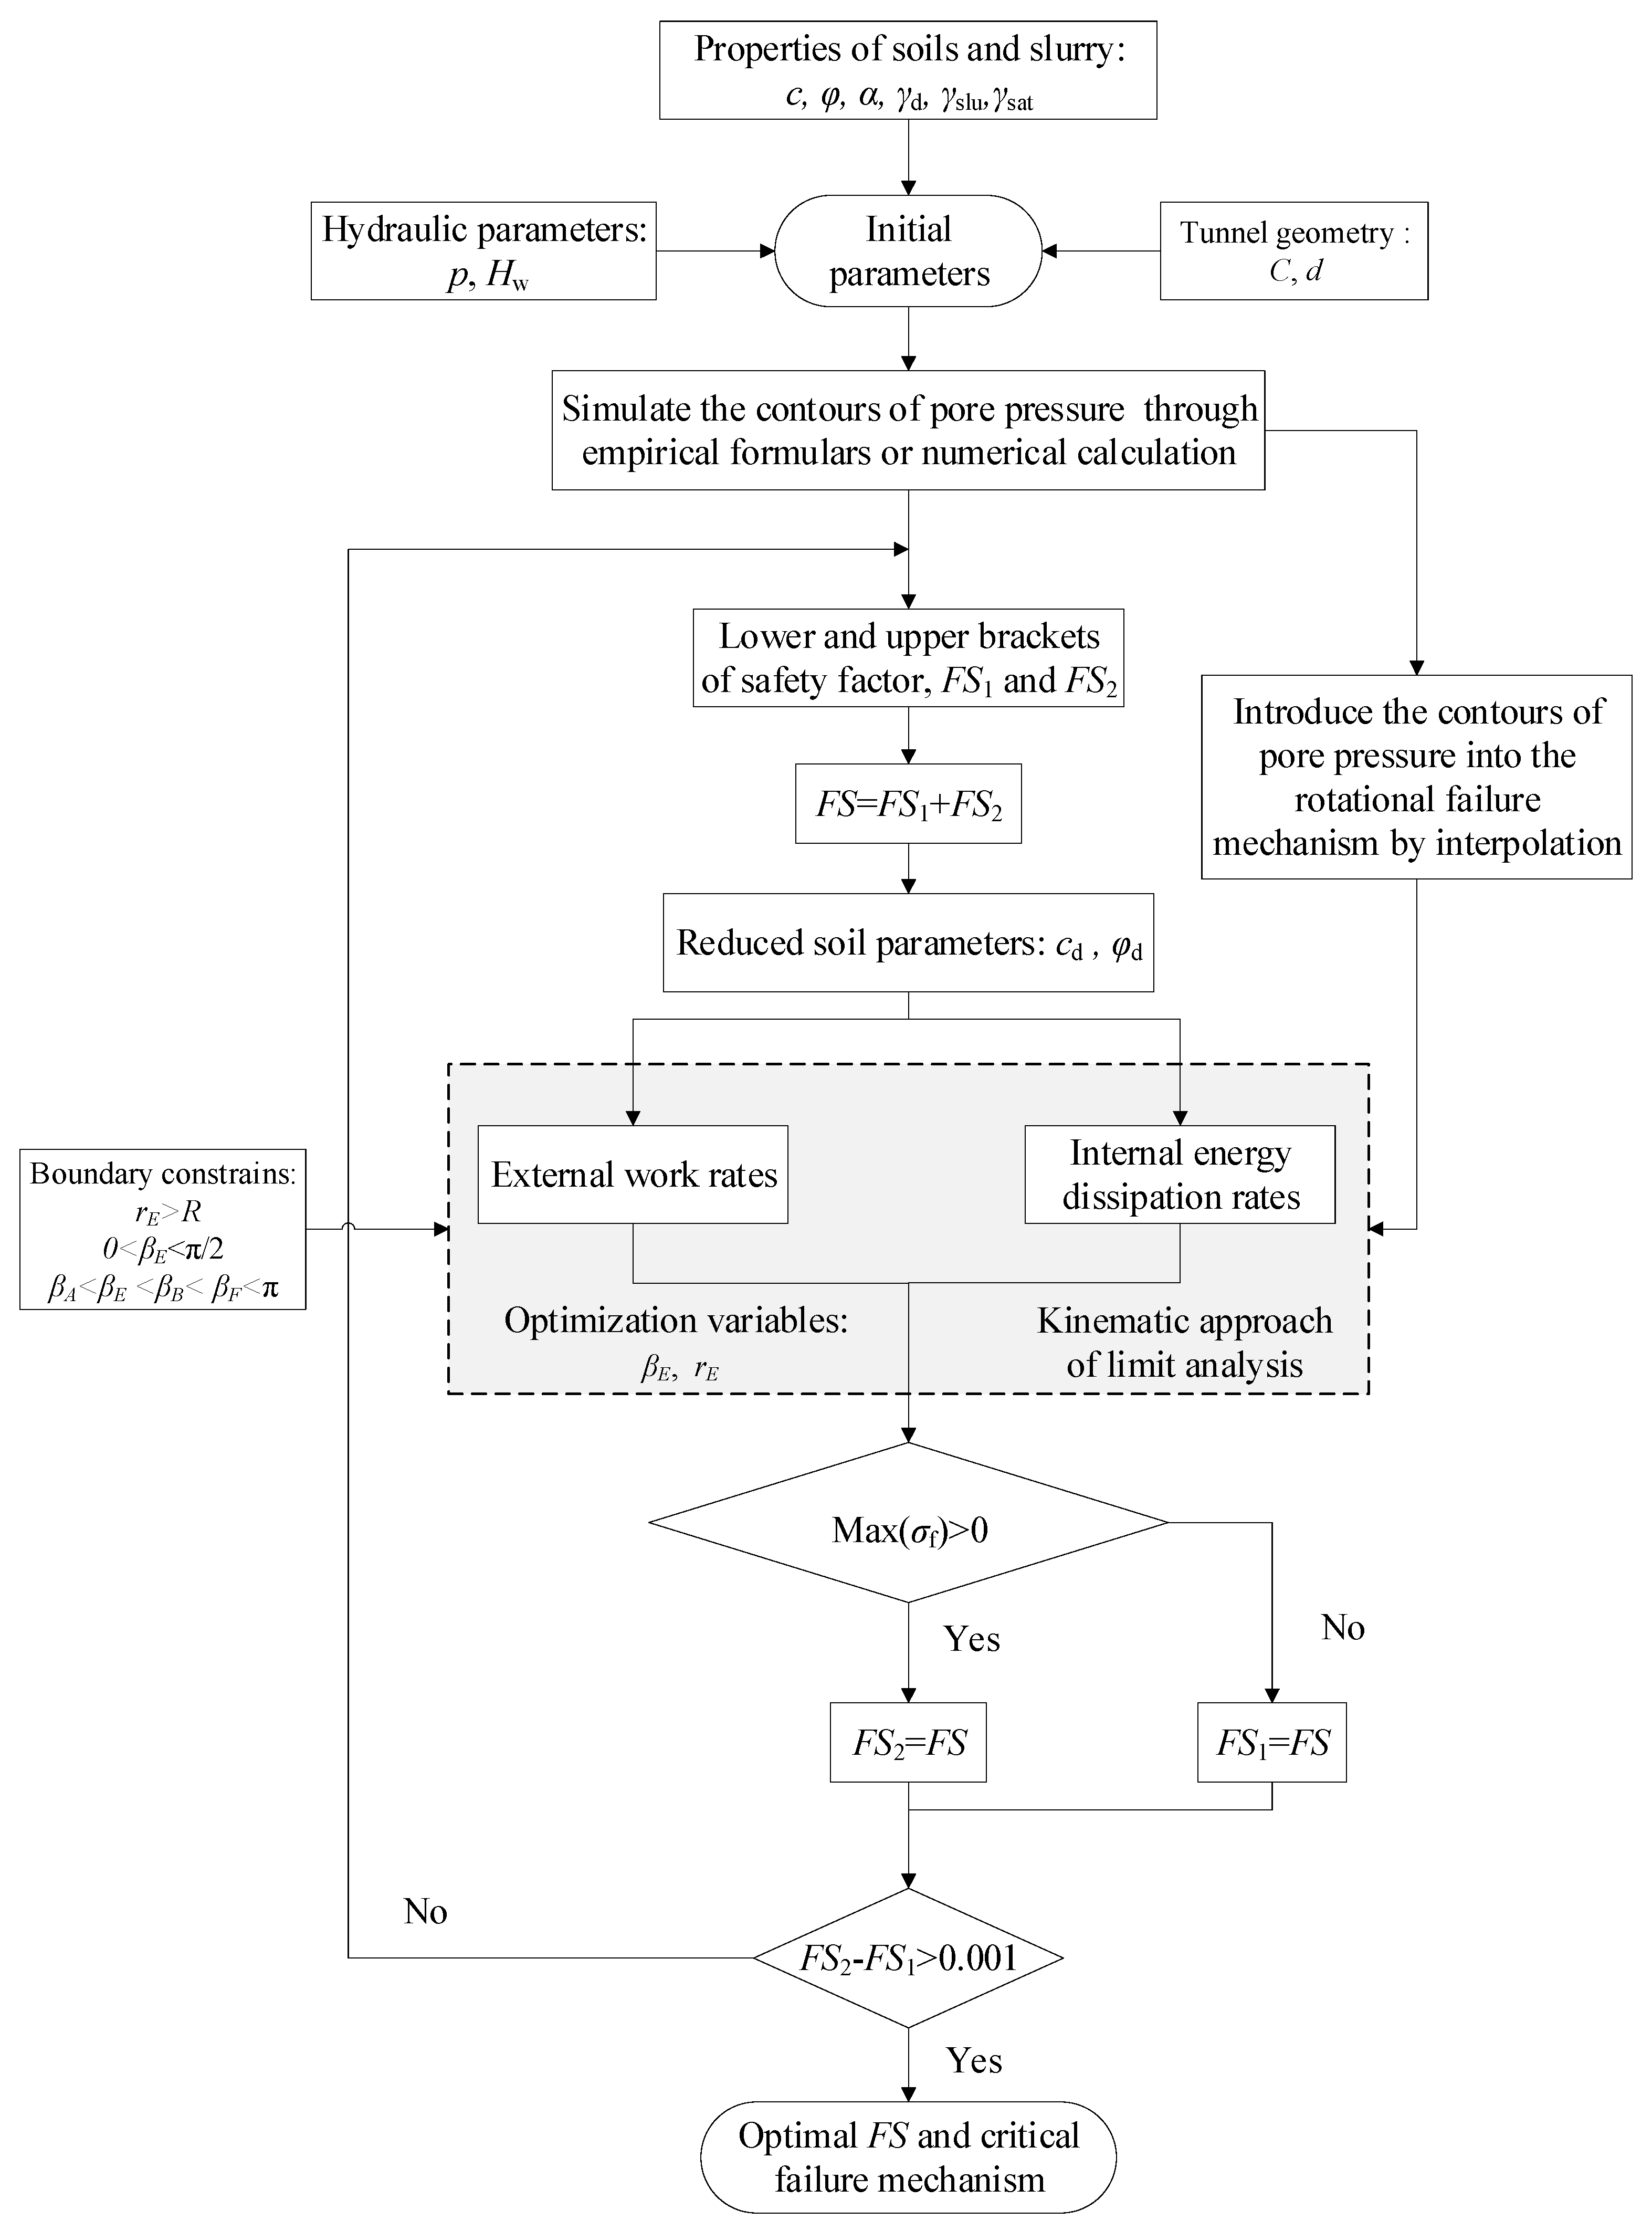
2.5. Flow Diagram of Solving Safety Factor

Figure 7 depicts the entire flow diagram of computing the safety factor. The pore pressure is calculated for the predetermined hydraulic parameters and tunnel geometry using either empirical formulas or numerical simulations. From the obtained results, the pore pressures of discrete elements can be interpolated. Subsequently, within the context of the kinematic approach and strength reduction method, a dichotomy process is utilized to solve for the optimal safety factor. With the FS as the mean value of the initial upper and lower limit safety factors being input, soil strengths c and φ reduce to c / F S and arctan ( tan φ / F S ) . To better understand the judging conditions of dichotomy, the index σ f in Equation (2) is introduced, and the entire process is depicted in Figure 7. It is worth noting that with the aid of the Intel(R) Xeon(R) CPU W-2145 3.7 GHz PC, conducting seepage simulation using FLAC3D and subsequently solving the safety factor in MATLAB takes approximately 12 h. Conversely, employing the empirical expression for pore water pressure distribution to solve the safety factor in MATLAB takes merely about 10 min. Therefore, the developed limit analysis framework paired with the empirical formulas expressing the pore water pressure can allow rapid estimation of the tunnel face stability.

3. Comparison

In order to validate the present approach, this study compares the pore pressures ahead of the tunnel and the stability of the tunnel face. Bezuijen et al. [31] deduced a one-dimensional analytical equation for predicting the pore pressure ahead of the tunnel face,
ϕ e = ϕ 0 ( Z / R + 1 + ( Z / R ) 2 )
with Z being the distance from the tunnel face; ϕ e being the excess piezometric head at location Z in advance of the tunnel; and ϕ 0 , the excess piezometric head at the tunnel face, takes a value of ϕ 0 = α ( ϕ m ϕ ) , with the coefficient α ( 0 α 1 ) representing the pressure drop within the cake, where ϕ m represents the piezometric head in the chamber while φ represents the piezometric head in infinity.
As presented in Bezuijen et al. [31], the analytical results based on Equation (10) have been compared with the numerical results from the finite element program DIANA and the measurements from the 2nd Heinenoord tunnel [42], which have shown good agreement. The results of Equation (10) will also be compared with the numerical and empirical results of this work. For comparison, two scenarios with different pressure drops are selected from Bezuijen et al. [31], namely the 1% pressure drop ( α = 0.99 ) and 10% pressure drop ( α = 0.90 ). The parameters are set the same as Bezuijen et al. [31], with d = 10 m, c = 1   kPa and φ = 32.5 ° , H w / d = 1.5 , C / d = 1 . 5 , and saturated unit weight γsat = 20 kN/m3. To maintain consistency with Bezuijen et al. [31], an initial uniform excess piezometric head is assumed. For the scenario of α = 0.99 , the critical average slurry pressure is p u = 24 . 5   kPa , and for the scenario of α = 0.90 , p u = 18 . 0   kPa . Figure 8 compares the solutions of the pore pressure obtained through the proposed method and the analytical solutions based on Bezuijen et al. [31] along the tunnel axis. The fitting parameters are taken as m 1 = 901 , m 2 = 3.352 , n 1 = 0.717 , and n 2 = 1.548 for p u = 24 . 5   kPa and m 1 = 0.867 , m 2 = 3.883 , n 1 = 0.761 , and n 2 = 0.458 for p u = 18 . 0   kPa . It can be seen that the analytical solution of Bezuijen et al. [31] differs very little from the numerical solution and empirical solution in this paper.
Secondly, the tunnel face stability results obtained through the proposed approach are compared with the published investigation based on the pore pressure calculated from numerical simulations and empirical formulas. The two scenarios in Bezuijen et al. [31], as mentioned earlier, are selected for comparison. Different from Bezuijen et al. [31], whose entire process is solved in numerical software, only the fluid calculation is processed in the numerical simulation in this paper. Based on the extracted results, the pore pressure of each point in the proposed failure mechanism can be obtained by interpolation. As shown in Table 1, the results of this work corresponding to the two limit cases in Bezuijen et al. [31] are close to 1.0. This indicates that in the cases of the critical slurry pressures calculated in Bezuijen et al. [31], the model proposed in this paper also reaches the critical state.

4. Parametric Study

This section investigates the impact of excess slurry pressure and pressure drop coefficient, with C / d = 2, d = 6 m, φ = 25 ° , γ sat = 25 kN / m 3 , and γ sl = 12 kN / m 3 . Since the scenario of a partial filter cake can be addressed by adjusting the reduction coefficient based on the steady-state flow model, parametric analyses regarding the flow case primarily focus on this model. For the flow case, the results based on the numerical and empirical distribution of pore pressure are calculated for analysis. Table 2 summarizes the fitting parameters for different excess slurry pressure p . It is found that with the increase in p , the parameters m 1 , m 2 , and n 1 increase while the parameter n 2 decreases, which can provide a reference for the approximation of fitting parameters.

4.1. The Impact of Excess Slurry Pressure

Figure 9 demonstrates the impact of excess slurry pressure. It can be observed that with the increase in p , the stability of the tunnel face definitely increases. The trend of the safety factor increasing with p is non-linear in the small cohesion case, while the safety factor almost increases linearly with p in the large cohesion case. From the comparison between the results derived from the numerical distribution and empirical distribution, it can be observed that the safety factors derived from the empirical distribution are slightly smaller than the results derived from the numerical distribution, especially in the case of small cohesion and large p .

4.2. The Impact of the Coefficient α

In situations where partial filter cakes are present, a noticeable pressure drop occurs over the cake, which reduces the initial excess piezometric head of the flow and logically influences the infiltration process. A larger α indicates a smaller proportion of effective support. To explore how the pressure drop affects tunnel face stability, Figure 10 illustrates the relationship between the coefficient α and the normalized safety factor for H w / d = 2 . The solutions based on the empirical distribution generally agree well with those based on the numerical distribution. It is observed that as α increases, normalized safety factors decrease almost linearly, particularly for cases with higher cohesion. Therefore, based on the results of the full-membrane model and the steady-state flow model, safety factors considering the pressure drop can be approximated by linear interpolation according to the value of α .
Figure 11 plots the failure mechanism of two typical p s with c / γ sat d = 0.04 and H w / d = 2, where both the results derived from the empirical distribution and numerical distribution are presented. For ease of understanding, the geometric details associated with the discrete failure block are marked in Figure 11a. Comparing the four graphs, it is found that the changes in excess slurry pressure result in alterations to the critical collapse mechanisms. As the excess slurry pressure increases, the optimized collapse mechanism will be larger and more extended to the ground. Furthermore, similar to the little difference in the safety factor, the failure mechanism obtained from the empirical distribution is slightly smaller than that from the failure mechanism from the numerical distribution.

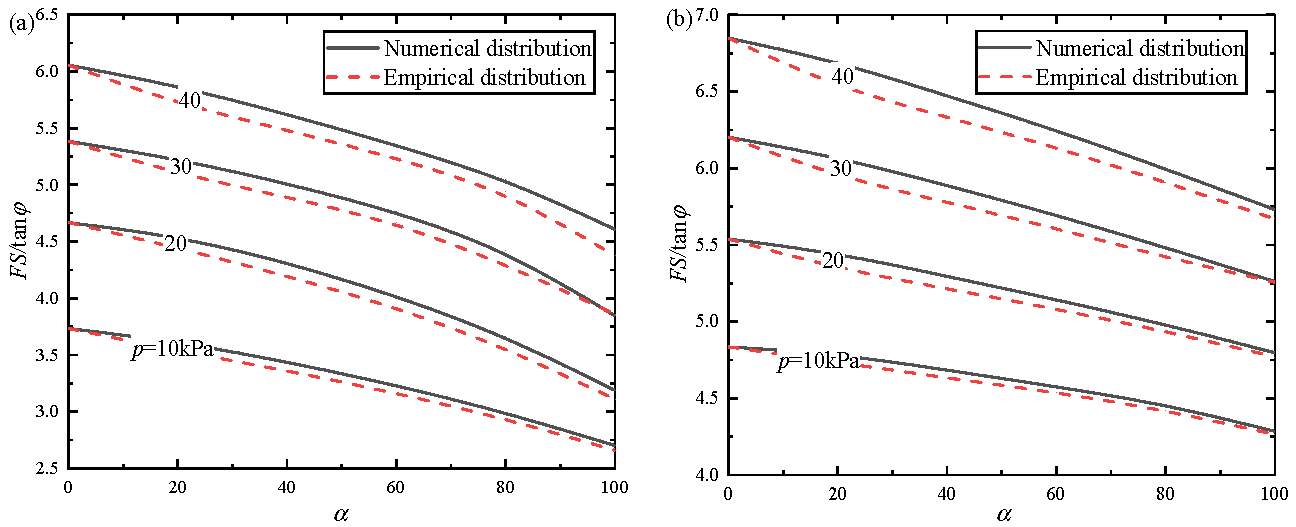
4.3. Design Diagrams of Normalized Safety Factor

In order to facilitate practical engineering applications, a set of normalized charts is provided in Figure 12, Figure 13, Figure 14 and Figure 15. As previous research has shown that the stability of tunnel faces tends to remain constant when the ratio of cover depth exceeds a certain value [43], the parameter C / d takes a value of 2 in this study. The support effect provided by excess slurry pressures may be easily controlled by adjusting the air-cushion pressure in a hydro-shield [5]. Therefore, the influence of the variability of the slurry unit weight γ slu is ignored, and here γ slu takes a constant value of 12 kN / m 3 . The outcomes of the partial cake, which accounts for the partial pressure drop, can be estimated through interpolation based on the value of α . Therefore, only the outcomes of the full-membrane model and steady-state flow model are presented. The charts cover the range of p from 0 to 40 kPa, H w / d from 1 to 4, and c / γ sat d from 0.0 to 0.12.
Upon comparing the outcomes derived from the two models, the outcomes assessed through the full-membrane model are found to be more positive than that evaluated through the steady-state flow model, particularly for cases where the cohesion is relatively small. In addition, the safety factor results obtained from the empirical distribution and numerical distribution are in good agreement, proving the effectiveness of the proposed empirical formulas.
The steady-state flow model exhibits a clear non-linear relationship between normalized safety factors and normalized cohesion, particularly in cases where p is large. When the cohesion is relatively low, normalized safety factors increase rapidly with increasing cohesion, and the growth trend gradually becomes slower and almost linear. Moreover, it is evident that the increase in p has a negligible impact on enhancing the tunnel face stability. When the normalized cohesion reaches a certain threshold (around 0.06), normalized safety factors will increase almost linearly with the augmentation of p . As for the full-membrane outcomes, FS/tanφ generally increases linearly with normalized cohesions.

4.4. Discussion

The present work can provide an effective framework for assessing the safety factor of the tunnel face subjected to the excess slurry pressure from a discrete perspective. The variation of the three-dimensional seepage induced by the excess slurry pressure and its impact within the entire potential failure block are incorporated. The exploration of empirical equations for describing the slurry infiltration helps to quickly assess the pore water pressure distribution under steady-state flow conditions induced by the excess slurry pressure, which in turn enables rapid assessment of the tunnel face stability. In practical applications, the selection of the appropriate model should depend on the formation of the filter cake. If there is no filter cake present, the steady-state flow results should be considered. On the other hand, when there is no flow paired with a full cake, it is suggested to adopt the full-membrane results. The safety factors of partial filter cake may be estimated using interpolations based on α . The current work is limited to the simplification of using a coefficient α to represent the pressure drop on the potential filter cake, ignoring the non-homogeneity and dynamics of the filter cake. Rationally determining the coefficient α is also a challenging task. In addition, the tunnel face stability at a micro scale, such as the interaction between soil particles and slurry particles [44], is beyond the scope of this study. Similar to some existing studies [45,46], the focus of the present work is on the global stabilization of the tunnel face under slurry infiltration.

5. Conclusions

When excess slurry pressure is applied to the tunnel face, it can lead to slurry infiltration forward into the soil, resulting in excess pore pressure in front of the tunnel. This excess pore pressure can greatly impair the supporting effect of the excess slurry pressure, ultimately having a significant impact on the stability of the tunnel face. According to the filter cake forms, the slurry infiltration cases can be distinguished as full filter cake, partial filter cake, and no filter cake. Various slurry infiltration scenarios correspond to distinct pressure transfer mechanisms and various types of pore pressure distribution. The present study extends the kinematic approach, which incorporates a 3D discretization-based failure mechanism, to investigate the impact of excess slurry pressures on tunnel face stability, taking into account various infiltration scenarios. To obtain the pore pressure distribution influenced by the excess slurry pressure, a numerical calculation is carried out. In addition, two simple empirical formulas describing the development of pore pressure ahead of the tunnel and above the tunnel are established and verified, which is helpful for a quick estimation of the pore pressure distribution. Then, an interpolation is performed based on the extracted results; thus, the pore pressure of each point of the failure mechanism is obtained. Combined with the strength reduction method and dichotomy method, the safety factors corresponding to different tunnel geometry, hydraulic conditions, soil properties, excess slurry pressures, and pressure drop can be obtained through an optimization program. Through the analysis process established in this work, the influence of excess pore pressure on the whole failure mechanism, the variation of the slurry pressure in the vertical direction, and the three-dimensional characteristics of seepage are all involved. A comparative analysis between the proposed method and previous research has been carried out to validate the effectiveness of the research process presented in this work. A parameter analysis is presented in this study, based on both numerical and empirical pore pressure distributions, to explore the influence of various factors, including pressure drop coefficient, excess slurry pressure, soil strength, and groundwater level. Some conclusions can be drawn:
(1)
The results based on the empirical distribution are a little more conservative than those based on the numerical distribution, which verifies the effectiveness of the proposed empirical formulas. Compared to numerically simulating the seepage, employing the empirical distribution allows a significantly higher computational efficiency with acceptable accuracy;
(2)
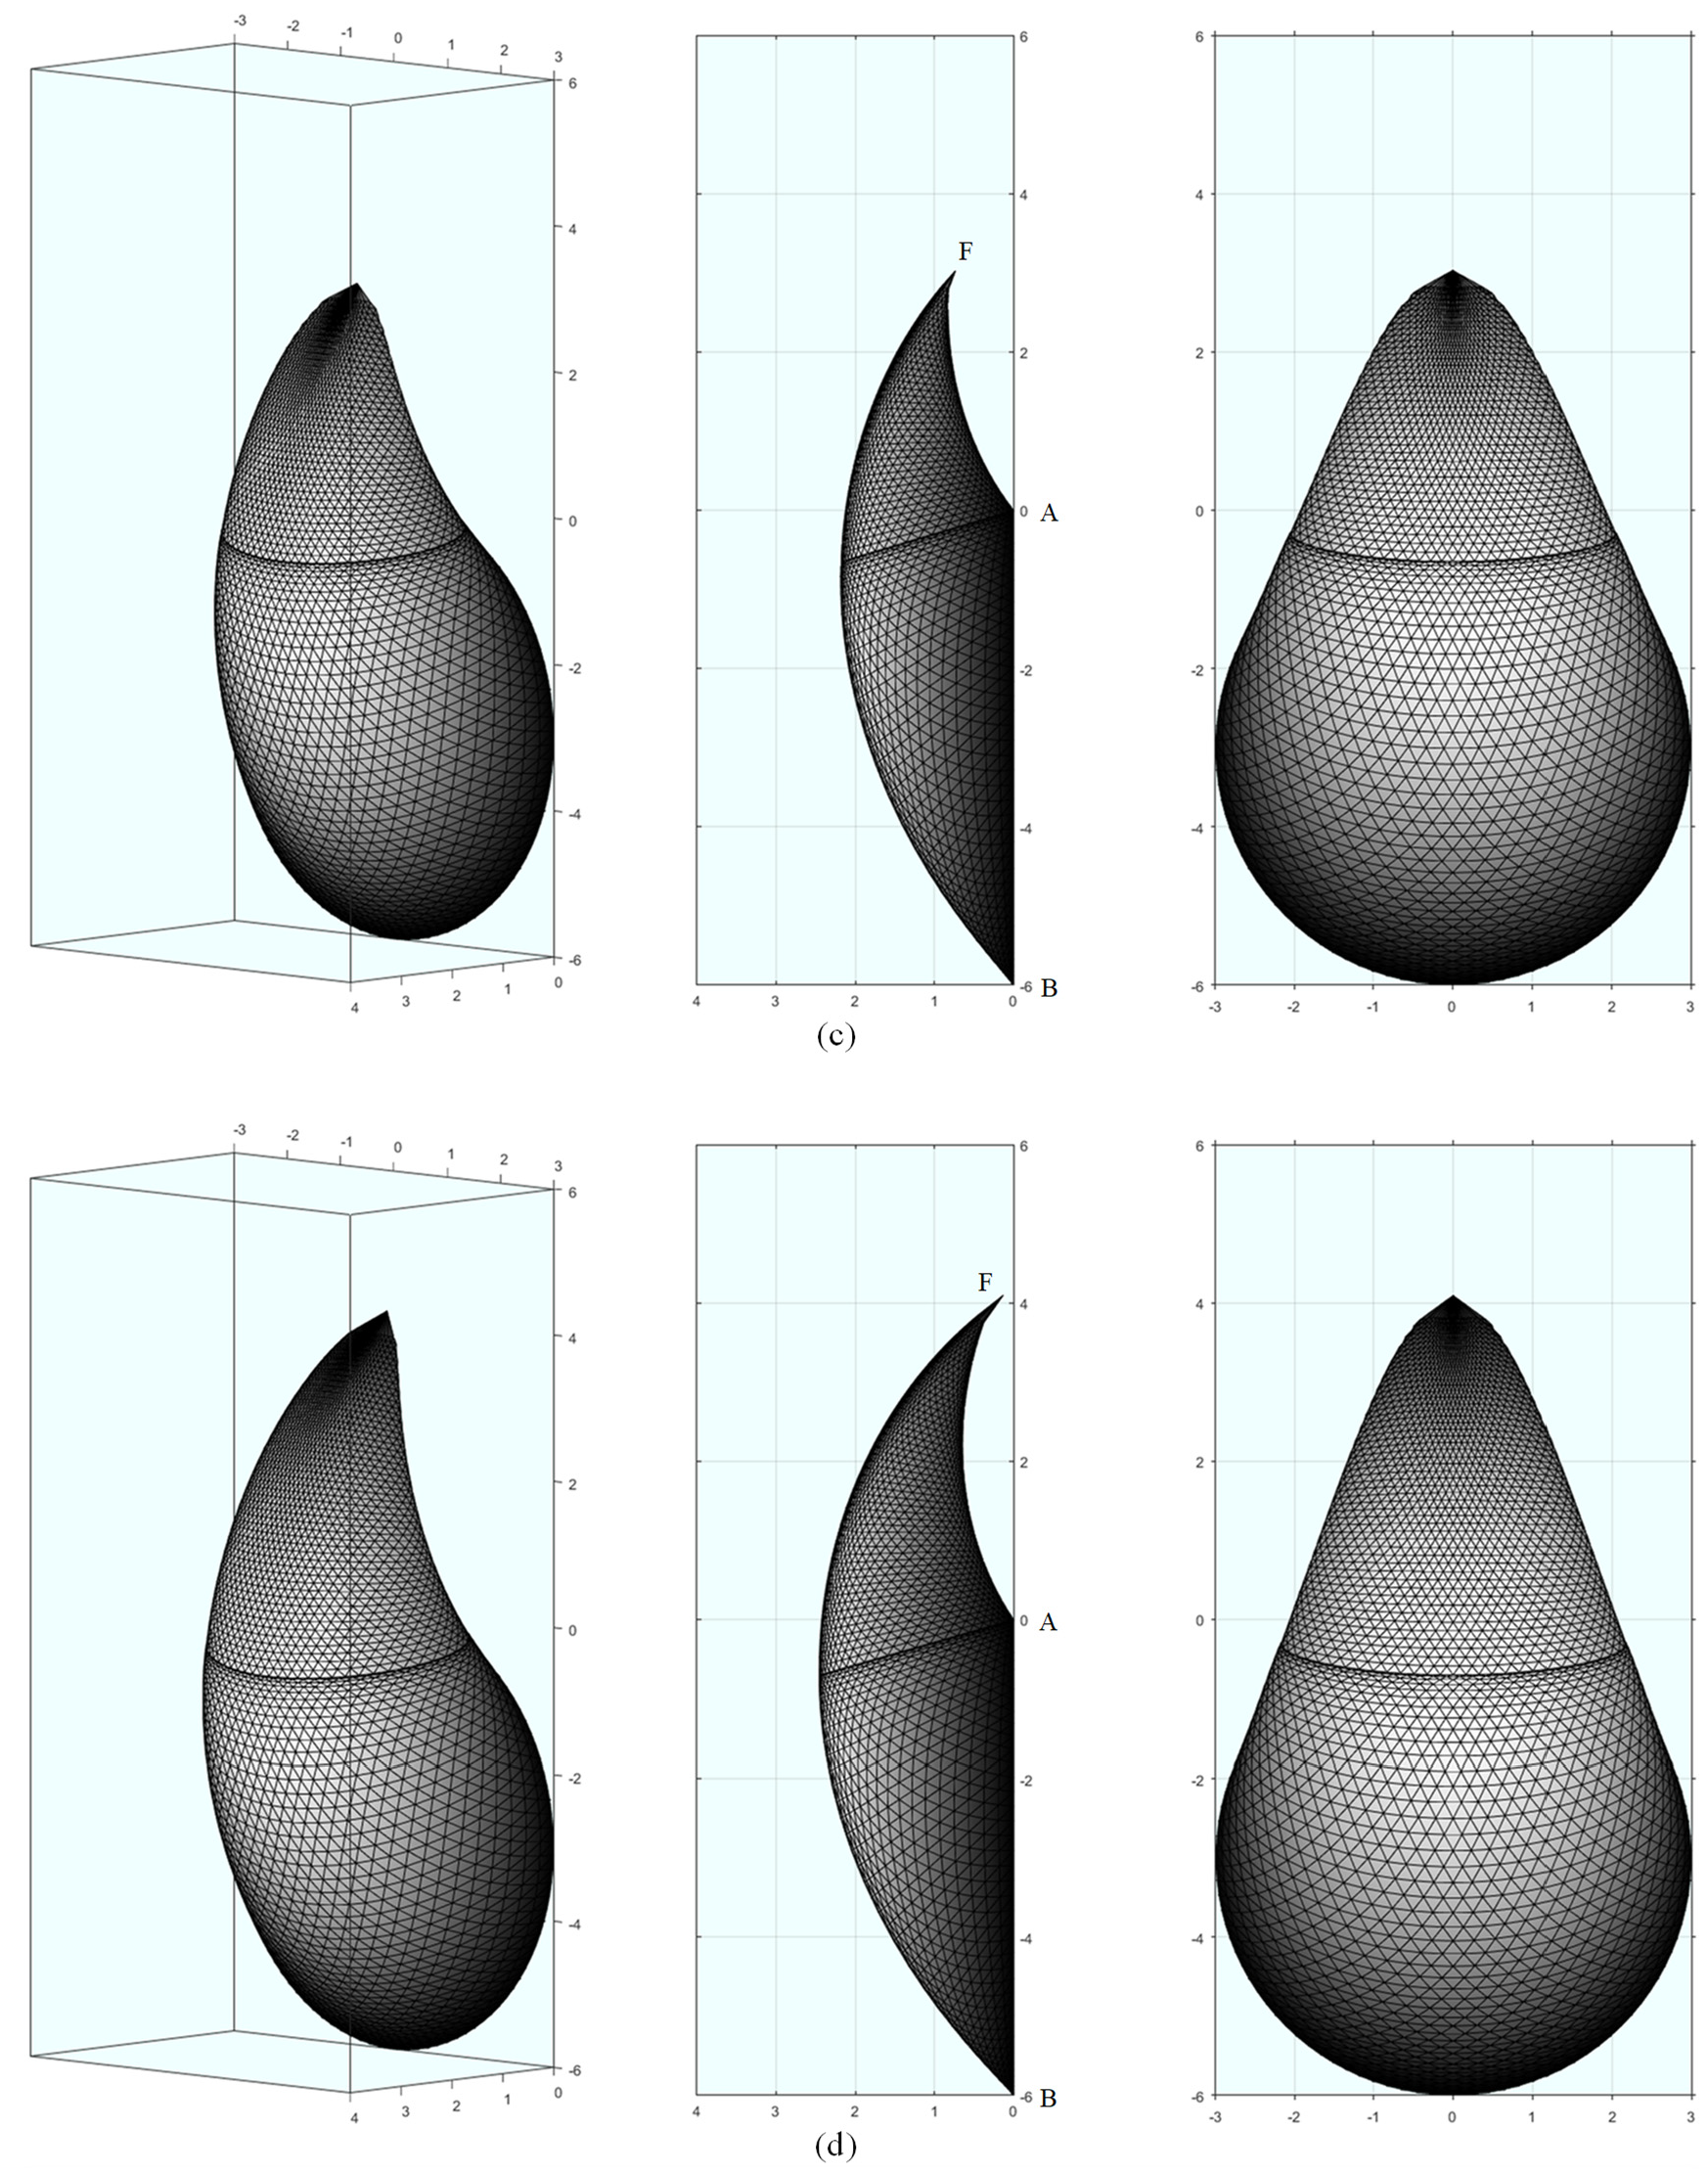
The results of the flow case show that with increasing excess slurry pressures, the safety factor shows a noticeable non-linear increasing trend in low cohesion cases, which turns into a linear increasing trend in large cohesion cases. As the excess slurry pressure increases, the critical failure mechanism becomes closer to the tunnel face and the ground;
(3)
Compared to the full-membrane model, safety factors of the steady-state flow model are much more conservative and exhibit a more distinct non-linearity with the increasing normalized cohesion, particularly for the low normalized cohesion cases. With the increase in α , a coefficient representing the residual excess slurry pressure after the pressure drop over the filter cake, the safety factor decreases almost linearly. According to the state of the filter cakes in practical engineering, the tunnel face stability can be referenced with the results of the normalized charts.

Author Contributions

Conceptualization, C.H.; methodology, J.Z.; formal analysis and investigation, J.Z. and C.H.; funding acquisition, C.H.; writing—original draft preparation, S.Z. and C.H.; writing—review and editing, C.H. and P.W. All authors have read and agreed to the published version of the manuscript.

Funding

This research was funded by Fundamental Research Funds for the Central Universities of Central South University (2021zzts0217).

Institutional Review Board Statement

Not applicable.

Informed Consent Statement

Not applicable.

Data Availability Statement

The data that support the findings of this study are available from the corresponding author upon reasonable request.

Conflicts of Interest

The authors declare no conflict of interest.

Abbreviations

α Pressure drop coefficient
β E , r E Polar coordinates of point E
c , φ Effective cohesion and internal friction angle
CBuried depth
D,RTunnel diameter and tunnel radius
δ β Angular interval of Section II in the failure mechanism
FSSafety factor
H w Location of water table with respect to the tunnel crown
k Permeability coefficient
N c , N γ , N p p , N s p Dimensionless coefficients denoting contribution of cohesion, soil gravity, pore pressure, and slurry pressure
φ e Piezometric head of a point ahead of the tunnel
p Excess slurry pressure at tunnel crown
p u Uniform excess slurry pressure
σ f Extra required uniform support pressure
σ s p Average slurry pressure over the tunnel face
V sl Slurry infiltration velocity
V TBM TBM velocity
γ slu ,   γ w ,   γ sat Unit slurry weight, unit water weight, and unit saturated weight

References

  1. Chen, R.; Li, J.; Kong, L.; Tang, L. Experimental Study on Face Instability of Shield Tunnel in Sand. Tunn. Undergr. Space Technol. 2013, 33, 12–21. [Google Scholar] [CrossRef]
  2. Jin, D.; Yuan, D.; Li, X.; Zheng, H. Analysis of the Settlement of an Existing Tunnel Induced by Shield Tunneling Underneath. Tunn. Undergr. Space Technol. 2018, 81, 209–220. [Google Scholar] [CrossRef]
  3. Li, Y.; Emeriault, F.; Kastner, R.; Zhang, Z.X. Stability Analysis of Large Slurry Shield-Driven Tunnel in Soft Clay. Tunn. Undergr. Space Technol. 2009, 24, 472–481. [Google Scholar] [CrossRef]
  4. Kim, S.H.; Tonon, F. Face Stability and Required Support Pressure for TBM Driven Tunnels with Ideal Face Membrane—Drained Case. Tunn. Undergr. Space Technol. 2010, 25, 526–542. [Google Scholar] [CrossRef]
  5. Anagnostou, G.; Kovári, K. The Face Stability of Slurry-Shield-Driven Tunnels. Tunn. Undergr. Space Technol. 1994, 9, 165–174. [Google Scholar] [CrossRef]
  6. Thewes, M.; Schoesser, B.; Zizka, Z. Transient Face Support in Slurry Shield Tunneling Due to Different Time Scales for Excavation Sequence of Cutting Tools and Penetration Time of Support Fluid. In Proceedings of the ITA World Tunnel Congress, San Francisco, CA, USA, 22–28 April 2016. [Google Scholar]
  7. Xu, T.; Bezuijen, A. Analytical Methods in Predicting Excess Pore Water Pressure in Front of Slurry Shield in Saturated Sandy Ground. Tunn. Undergr. Space Technol. 2018, 73, 203–211. [Google Scholar] [CrossRef]
  8. Bezuijen, A.; van Lottum, H. (Eds.) Tunnelling: A Decade of Progress: GeoDelft 1995–2005; Taylor & Francis: London, UK; New York, NY, USA, 2006; ISBN 978-0-415-39133-7. [Google Scholar]
  9. Broere, W. Infuence of Excess Pore Pressures on the Stability of the Tunnel Face. Reclaiming the Underground Space. 2002, Volume 2, pp. 759–765. Available online: https://www.taylorfrancis.com/chapters/edit/10.1201/9780203741177-31/influence-excess-pore-pressures-stability-tunnel-face-broere (accessed on 4 April 2023).
  10. Min, F.; Zhu, W.; Han, X. Filter Cake Formation for Slurry Shield Tunneling in Highly Permeable Sand. Tunn. Undergr. Space Technol. 2013, 38, 423–430. [Google Scholar] [CrossRef]
  11. Zhou, Z.; Ling, T.; Huang, F.; Zhang, M. The Face Stability Analysis of Shield Tunnels Subjected to Seepage Based on the Variational Principle. Sustainability 2022, 14, 16538. [Google Scholar] [CrossRef]
  12. Anagnostou, G.; Kovári, K. Face Stability in Slurry and EPB Shield Tunnelling; Progressive Media Markets, Ltd.: London, UK, 1996. [Google Scholar]
  13. Broere, W.; van Tol, A.F. Time-Dependant Infiltration and Groundwater Flow in a Face Stability Analysis. In Modern Tunneling Science and Technology; Adachi, T., Tateyama, K., Kimura, M., Eds.; CRC Press: Boca Raton, FL, USA, 2020; pp. 629–634. ISBN 978-1-00-307753-4. [Google Scholar]
  14. Talmon, A.M.; Bezuijen, A. Simulating the Consolidation of TBM Grout at Noordplaspolder. Tunn. Undergr. Space Technol. 2009, 24, 493–499. [Google Scholar] [CrossRef]
  15. Zizka, Z.; Schoesser, B.; Thewes, M.; Schanz, T. Slurry Shield Tunneling: New Methodology for Simplified Prediction of Increased Pore Pressures Resulting from Slurry Infiltration at the Tunnel Face Under Cyclic Excavation Processes. Int. J. Civ. Eng. 2019, 17, 113–130. [Google Scholar] [CrossRef]
  16. Talmon, A.M.; Mastbergen, D.R.; Huisman, M. Invasion of pressurized clay suspensions into granular soil. J. Porous Media 2013, 16, 351–365. [Google Scholar] [CrossRef]
  17. Xu, T.; Bezuijen, A. Bentonite Slurry Infiltration into Sand: Filter Cake Formation under Various Conditions. Geotechnique 2019, 69, 1095–1106. [Google Scholar] [CrossRef]
  18. Bezuijen, A.; Steeneken, S.P.; Ruigrok, J.A.T. Monitoring and analysing pressures around a tbm. In Proceedings of the 13th International Conference Underground Construction, Prague, Czech Republic, 23–25 May 2016; Volume 1, pp. 1–9. [Google Scholar]
  19. Steeneken, S.P. Excess Pore Pressures Near a Slurry Tunnel Boring Machine: Modelling and Measurements. 2016. Available online: https://repository.tudelft.nl/islandora/object/uuid:b8f3db81-7143-4b93-a059-c9bd4d92210a (accessed on 4 April 2023).
  20. Soranzo, E.; Guardiani, C.; Wu, W. A Soft Computing Approach to Tunnel Face Stability in a Probabilistic Framework. Acta Geotech. 2022, 17, 1219–1238. [Google Scholar] [CrossRef]
  21. Qin, C.; Li, Y.; Yu, J.; Chen Chian, S.; Liu, H. Closed-Form Solutions for Collapse Mechanisms of Tunnel Crown in Saturated Non-Uniform Rock Surrounds. Tunn. Undergr. Space Technol. 2022, 126, 104529. [Google Scholar] [CrossRef]
  22. Wang, C.; Xiao, J.; Liu, W.; Ma, Z. Unloading and Reloading Stress-Strain Relationship of Recycled Aggregate Concrete Reinforced with Steel/Polypropylene Fibers under Uniaxial Low-Cycle Loadings. Cem. Concr. Compos. 2022, 131, 104597. [Google Scholar] [CrossRef]
  23. Wang, C.; Wu, H.; Li, C. Hysteresis and Damping Properties of Steel and Polypropylene Fiber Reinforced Recycled Aggregate Concrete under Uniaxial Low-Cycle Loadings. Constr. Build. Mater. 2022, 319, 126191. [Google Scholar] [CrossRef]
  24. Qin, C.; Zhou, J. On the Seismic Stability of Soil Slopes Containing Dual Weak Layers: True Failure Load Assessment by Finite-Element Limit-Analysis. Acta Geotech. 2023, 1–23. [Google Scholar] [CrossRef]
  25. Qin, C.-B.; Chian, S.C. Kinematic Analysis of Seismic Slope Stability with a Discretisation Technique and Pseudo-Dynamic Approach: A New Perspective. Géotechnique 2018, 68, 492–503. [Google Scholar] [CrossRef]
  26. Gong, W.; Juang, C.H.; Wasowski, J. Geohazards and Human Settlements: Lessons Learned from Multiple Relocation Events in Badong, China—Engineering Geologist’s Perspective. Eng. Geol. 2021, 285, 106051. [Google Scholar] [CrossRef]
  27. Li, T.Z.; Pan, Q.; Dias, D. Active Learning Relevant Vector Machine for Reliability Analysis. Appl. Math. Model. 2021, 89, 381–399. [Google Scholar] [CrossRef]
  28. Subrin, D.; Wong, H. Tunnel face stability in frictional material: A new 3D failure mechanism. C. R. Mec. 2002, 330, 513–519. [Google Scholar] [CrossRef]
  29. Mollon, G.; Dias, D.; Soubra, A.-H. Face Stability Analysis of Circular Tunnels Driven by a Pressurized Shield. J. Geotech. Geoenviron. Eng. 2010, 136, 215–229. [Google Scholar] [CrossRef]
  30. Mollon, G.; Dias, D.; Soubra, A.-H. Rotational Failure Mechanisms for the Face Stability Analysis of Tunnels Driven by a Pressurized Shield. Int. J. Numer. Anal. Meth. Geomech. 2011, 35, 1363–1388. [Google Scholar] [CrossRef]
  31. Bezuijen, A.; Pruiksma, J.P.; van Meerten, H.H. Pore Pressures in Front of Tunnel, Measurements, Calculations and Consequences for Stability of Tunnel Face. Modern Tunneling Science and Technology. 2001. Available online: https://www.taylorfrancis.com/chapters/edit/10.1201/9781003077534-35/pore-pressures-front-tunnel-measurements-calculations-consequences-stability-tunnel-face-adam-bezuijen-jitse-pruiksma-hans-van-meerten (accessed on 4 April 2023).
  32. Kaalberg, F.J.; Ruigrok, J.A.T.; De Nijs, R. TBM face stability & excess pore pressures in close proximity of piled bridge foundations controlled with 3D FEM. In Proceedings of the 8th International Symposium on Geotechnical Aspects of Underground Construction in Soft Ground, London, UK, 25–27 August 2014; pp. 555–560. [Google Scholar]
  33. Bezuijen, A. Keynote Lecture: Soil-water-tunnel interaction at the front face of a TBM. In Geotechnics for Sustainable Infrastructure Development; Springer: Singapore, 2020; pp. 207–220. [Google Scholar]
  34. Xu, T.; Bezuijen, A. Experimental Study on the Mechanisms of Bentonite Slurry Penetration in Front of a Slurry TBM. Tunn. Undergr. Space Technol. 2019, 93, 103052. [Google Scholar] [CrossRef]
  35. Rotaru, A.; Bejan, F.; Almohamad, D. Sustainable Slope Stability Analysis: A Critical Study on Methods. Sustainability 2022, 14, 8847. [Google Scholar] [CrossRef]
  36. Qin, C.; Chian, S.C.; Du, S. Revisiting Seismic Slope Stability: Intermediate or below-the-Toe Failure? Géotechnique 2020, 70, 71–79. [Google Scholar] [CrossRef]
  37. Li, T.; Gong, W.; Tang, H.; Zhang, L. A Meshed Kinematical Approach for 3D Slope Stability Analysis. Num. Anal. Meth. Geomech. 2022, 46, 2913–2930. [Google Scholar] [CrossRef]
  38. Zhang, Z.L.; Zhu, J.Q.; Yang, X.L. Three-Dimensional Active Earth Pressures for Unsaturated Backfills with Cracks Considering Steady Seepage. Int. J. Geomech. 2023, 23, 04022270. [Google Scholar] [CrossRef]
  39. Zhang, Z.L.; Yang, X.L. Pseudodynamic Analysis of Three-Dimensional Fissured Slopes Reinforced with Piles. Int. J. Geomech. 2023, 23, 04022315. [Google Scholar] [CrossRef]
  40. Hou, C.; Zhong, J.; Yang, X. Three-Dimensional Stability Assessments of a Non-Circular Tunnel Face Reinforced by Bolts under Seepage Flow Conditions. Tunn. Undergr. Space Technol. 2023, 131, 104831. [Google Scholar] [CrossRef]
  41. Zizka, Z. Stability of Slurry Supported Tunnel Face Considering the Transient Support Mechanism during Excavation in Non-Cohesive Soil. 2019. Available online: https://hss-opus.ub.ruhr-uni-bochum.de/opus4/frontdoor/index/index/docId/6514 (accessed on 4 April 2023).
  42. Bakker, K.J.; de Boer, F.; Kuiper, J.C. Extensive independent research programs on second Heinenoord Tunnel and Botlek Rail Tunnel. In Proceedings of the Twelfth European Conference on Soil Mechanics and Geotechnical Engineering, Amsterdam, The Netherlands, 7–10 June 1999. [Google Scholar]
  43. Leca, E.; Dormieux, L. Upper and Lower Bound Solutions for the Face Stability of Shallow Circular Tunnels in Frictional Material. Géotechnique 1990, 40, 581–606. [Google Scholar] [CrossRef]
  44. Qin, S.; Xu, T.; Zhou, W.-H.; Bezuijen, A. Infiltration Behaviour and Microstructure of Filter Cake from Sand-Modified Bentonite Slurry. Transp. Geotech. 2023, 40, 100963. [Google Scholar] [CrossRef]
  45. Hou, C.; Pan, Q.; Xu, T.; Huang, F.; Yang, X. Three-Dimensional Tunnel Face Stability Considering Slurry Pressure Transfer Mechanisms. Tunn. Undergr. Space Technol. 2022, 125, 104524. [Google Scholar] [CrossRef]
  46. Zizka, Z.; Schoesser, B.; Thewes, M. Investigations on Transient Support Pressure Transfer at the Tunnel Face during Slurry Shield Drive Part 1: Case A—Tool Cutting Depth Exceeds Shallow Slurry Penetration Depth. Tunn. Undergr. Space Technol. 2021, 118, 104168. [Google Scholar] [CrossRef]
Figure 1. The schematic diagram for a tunnel driven under the excess slurry pressure: (a) Slurry infiltration ahead of the tunnel; (b) Slurry pressure on the tunnel face.
Sustainability 15 08230 g001
Figure 2. Sketch of pressure transfer models under different slurry infiltration cases.
Sustainability 15 08230 g002
Figure 3. Diagram of the 3D discretization-based failure mechanism: (a) Cross-sectional schematic; (b) Failure block and failure facet.
Sustainability 15 08230 g003
Figure 4. Three-dimensional numerical model for seepage simulation.
Sustainability 15 08230 g004
Figure 5. The 3D pore pressure distribution obtained from numerical simulation.
Sustainability 15 08230 g005
Figure 6. Comparison of normalized excess piezometric heads on (a) two typical vertical lines above the tunnel and (b) three typical horizontal lines ahead of the tunnel.
Sustainability 15 08230 g006
Figure 7. Flow diagram for finding optimal FS.
Sustainability 15 08230 g007
Figure 8. The excess pore pressure from Bezuijen et al. [31] and the current paper.
Sustainability 15 08230 g008
Figure 9. Normalized safety factor versus excess slurry pressure with different groundwater levels: (a) c/γsatd = 0.02; (b) c/γsatd = 0.04; and (c) c/γsatd = 0.10.
Sustainability 15 08230 g009
Figure 10. Normalized safety factor versus the pressure drop coefficient: (a) c / γ sat d = 0.04 ; (b) c / γ sat d = 0.08 .
Sustainability 15 08230 g010
Figure 11. Illustration of failure mechanism under various excess slurry pressures when α = 80%. Empirical pore pressure: (a) p = 10   kpa and (b) p = 30   kpa ; numerical pore pressure: (c) p = 10   kpa and (d) p = 30   kpa .
Sustainability 15 08230 g011aSustainability 15 08230 g011b
Figure 12. Versus c / γ sat d when H w / d = 1.0 : (a) Steady-state flow model; (b) Full-membrane model.
Sustainability 15 08230 g012
Figure 13. Versus c / γ sat d when H w / d = 2.0 : (a) Steady-state flow model; (b) Full-membrane model.
Sustainability 15 08230 g013
Figure 14. Versus c / γ sat d when H w / d = 3.0 : (a) Steady-state flow model; (b) Full-membrane model.
Sustainability 15 08230 g014
Figure 15. Versus c / γ sat d when H w / d = 4.0 : (a) Steady-state flow model; (b) Full-membrane model.
Sustainability 15 08230 g015
Table 1. Comparison of the safety factor.
ScenariosSolution of Bezuijen et al. [31]Presented Solution with Numerical Pore PressurePresented Solution with Empirical Pore Pressure
p u = 24.5   kPa , c = 1   kPa , φ = 32.5 ° , α = 0.99 1.001.000.97
p u = 18.0   kPa , c = 1   kPa , φ = 32.5 ° , α = 0.90 1.000.970.95
Table 2. Fitting parameters of empirical formulas corresponding to different excess slurry pressure p with d = 6 m.
Parametersp = 10 kPap = 20 kPap = 30 kPap = 40 kPa
m 1 0.8560.8400.8340.832
m 2 2.9692.2131.9401.801
n 1 0.8820.8050.7840.776
n 2 0.7582.0393.1934.295
Disclaimer/Publisher’s Note: The statements, opinions and data contained in all publications are solely those of the individual author(s) and contributor(s) and not of MDPI and/or the editor(s). MDPI and/or the editor(s) disclaim responsibility for any injury to people or property resulting from any ideas, methods, instructions or products referred to in the content.

