Next Article in Journal
Modeling and Predicting Land Use/Land Cover Change Using the Land Change Modeler in the Suluh River Basin, Northern Highlands of Ethiopia
Previous Article in Journal
Mapping of Energy Communities in Europe: Status Quo and Review of Existing Classifications
 
 
Correction published on 27 September 2023, see Sustainability 2023, 15(19), 14254.
Article

Dynamic Scenario Simulations of Sustainable Rural and Towns Development in China: The Case of Wujiang District

1
Business College, Southwest University, Chongqing 400715, China
2
School of Management Science and Real Estate, Chongqing University, Chongqing 400044, China
3
College of Civil Engineering, Longdong University, Qingyang 745000, China
4
School of Management Science and Engineering, Guizhou University of Finance and Economics, Guiyang 550025, China
*
Authors to whom correspondence should be addressed.
Sustainability 2023, 15(10), 8200; https://doi.org/10.3390/su15108200
Submission received: 16 April 2023 / Revised: 5 May 2023 / Accepted: 15 May 2023 / Published: 18 May 2023 / Corrected: 27 September 2023

Abstract

:
Increasing urbanization in China threatens the sustainable rural development of villages and towns. The siphoning effect of cities on the surrounding rural areas is increasing, resulting in the more severe problem of a “rural disease” and a widening gap between urban and rural areas. Implementing China’s rural revitalization strategies for urban–rural integration to alleviate these problems is crucial for sustainable rural development. Based on field research materials from Wujiang District, Suzhou City, China, this paper uses an explanatory structural model to screen the factors influencing sustainable rural development. A system dynamics model is used to identify the sustainable rural development trends of Chinese villages and towns under different scenarios. The results demonstrate that under the sustainable development model, consolidating the development of primary industries and increasing tertiary section investments can promote the development of the local economy. These are also conducive to environmental protection, and they improve the quality of the local living environment. The results can be used to formulate rural revitalization policies and promote urban–rural integration.

1. Introduction

Villages and towns are territorial complexes with natural, economic, and social characteristics that combine multiple functions, such as production and living. They co-exist with cities to form a virtual space for human life [1,2,3]. However, China’s dual urban–rural structure, unique reform and opening-up policies, urbanization, and industrialization continuously widen the urban–rural gap [4,5,6]. Because of these external factors, rural resources, labor, and capital have been continuously seized, resulting in the loss of rural resources and the emergence of a series of “rural integration” problems, including rural aging, poverty, environmental pollution, and deagrarianisation of agricultural land [7,8,9]. Currently, China’s urbanization rate is 64%, and nearly 0.5 billion people live in rural areas. Subsequently, the sustainable development of villages and towns (sustainable rural development) is crucial for China to achieve urban–rural integration. In response, the Government of China has developed a series of rural revitalization strategies to promote sustainable rural development [10,11,12].
Based on urbanization experiences outside China [13,14,15,16] and the Northam curve, when urbanization reaches a relatively stable stage, it will be driven to a more advanced stage by “rural revitalization” [17,18]. Rural revitalization, countryside development, and sustainable rural development can narrow the gap between urban and rural areas, reduce talent and capital loss in rural areas caused by the dual structure of urban and rural areas, and promote the integrated development of urban and rural areas [19,20,21].
The current research on sustainable rural development can be divided into two main categories. While scholars in developed countries have focused more on rural education, agricultural science and technology, and rural climate and environment [22,23,24], research scholars in developing countries have focused more on rural poverty and rural assets [25,26,27]. Despite the lack of comprehensive research on rural China, based on foreign developments and studies, Chinese scholars have achieved fruitful results in exploring sustainable rural development. These provide theoretical support for this paper on the exploration of the optimal path of sustainable rural development under the rural revitalization strategy [12,28,29,30,31,32,33]. However, most current studies on rural development have mainly focused on rural planning, housing, and habitats [34,35,36]. Fewer systematic studies have focused on multi-faceted and multi-factor sustainable rural development.
Many researchers have highlighted the analytical approaches proposed for rural revitalization. However, the research methods are relatively homogeneous, with most articles using qualitative analyses [37,38]. These include, for example, conceptual and theoretical discussions on rural revitalization components, indicators, or focus areas [6,39] and subjective and flexible indicator approaches [40]. Additionally, static analyses of sustainable rural development from a qualitative perspective lack empirical rigor.
To explore the sustainable rural development pathways under China’s rural revitalization strategy and solve the problems related to “rural disease”, this study aims, first, to identify the key factors influencing sustainable rural development. A system dynamics model of sustainable rural development was constructed based on these identified factors. Taking Wujiang District as an example, the model explores the path of sustainable development by constructing economic, population, and resource environment subsystems and proposes a scientific optimization model. This paper describes the future development path dynamically and quantitatively from the perspective of combining quantitative and qualitative research, which can improve the scientific accuracy and rigor of research conclusions.
The rest of this paper is structured as follows: Section 2 presents the model structure and data sources, Section 3—Results and Analyses, Section 4—Discussion, and Section 5 presents the Conclusions.

2. Methods and Materials

2.1. Study Area

In 2019, Wujiang District in southeast Jiangsu Province, China, included 9 towns, 249 administrative villages, and a resident population of 785,000, with a GDP (gross domestic product) of CNY 27.97 billion. Wujiang District has a good foundation for rural economic development, and the development in the area has now entered the sustainable development stage. Furthermore, researching the green and livable development of its villages and towns can provide reference opinions for constructing villages and towns in other regions of China. Additionally, while Wujiang District has the most significant number of villages in Suzhou, there are still many sustainable development problems. The gap between urban and rural development is still significant, the resources and environmental constraints are becoming increasingly prominent, the task of ecological development is arduous, the population is aging faster, and there is a large gap between the level of public infrastructure services and the needs of the residents. Other aspects of the problems facing Wujiang District are contradictory. Consequently, higher-quality sustainable rural development is still an issue being explored in the region, and a study on sustainable rural development in the region can provide a reference for improving these processes.

2.2. Interpretative Structural Model

In this study, we reviewed 31 papers published in journals between 2005 and 2022, which mainly focus on sustainable development, livable development, and rural revitalization [41,42,43,44,45,46,47,48,49,50,51,52,53,54,55]. The influencing factors involving sustainable rural development aspects were categorized by combining the above studies (see Table 1), and then based on the interpretative structural model (ISM), a binary set of relationships was established for 20 influencing factors extracted through expert interviews. A directed graph of the system elements was clarified, and an adjacency matrix was established. Then, a reachability matrix was obtained using a Boolean operation. The explanatory model of the influencing factors of sustainable rural development was constructed using the normalization method, and the hierarchical relationship between the influencing factors was clarified.

2.2.1. Construction of a System of Factors Influencing Sustainable Rural Development

The system of influencing factors for sustainable rural development is a complex system structure. The influencing factors are identified and categorized as the components of the system, where S1 is the target element of the system (Table 1). This establishes the set of elements of the system of influencing factors.
S = S 1 , S 2 , S 3 , , S 20

2.2.2. Construction of a Binary Set of Relationships of the Elements of the Influence Factor System

There are several elements in the system of influencing factors for sustainable rural development, with corresponding logical relationships ( R i j ) between each element ( S i , S j ), including their causal, supportive, constraining, encompassing, and influencing relationships, and other binary relationships. To avoid the expression of binary relations between the influencing factors being too subjective (from one’s own experience), expert interviews were used to establish the binary relations and, based on consultations with seven experts familiar with the field, a set of binary relations of the elements of the system of influencing factors for sustainable rural development was constructed.
R b = S 3 , S 1 S 5 , S 1 S 7 , S 1 S 9 , S 3 S 11 , S 3 S 4 , S 5 S 2 , S 5 S 13 , S 5 S 6 , S 13 S 8 , S 13 S 10 , S 13 S 12 , S 13 S 14 , S 13 S 18 , S 13 S 9 , S 13 S 15 , S 7 S 17 , S 7 S 18 , S 17 S 11 , S 4 S 15 , S 2 S 2 , S 15 S 20 , S 15 S 16 , S 15 S 18 , S 15 S 19 , S 15
When S i and S j have a logical relationship, as described above, that is, a binary relationship, the two elements S i and S j are noted as S i R S j . When Si and Sj have no binary relationship, as described above, or the relationship between the two elements is unclear, they are noted as S i R S j .

2.2.3. Expression of the Adjacency Matrix of System Elements

The binary relationship between the system elements in the system of factors influencing sustainable rural development is expressed quantitatively, specifically in the form of an adjacency matrix A, defined as follows:
A = a i j n × n
a i j = 1 , S i R S j 0 , S i R S j
The adjacency matrix A of the system elements of the system of factors influencing the sustainable construction of villages and towns.

2.2.4. Accessible Matrix Representation of System Elements

The basis for the establishment of the expression of the reachable matrix of the system elements is the transferability of the interrelationships between the system elements, that is, the transferability of the logical relations between the system elements of the system of factors influencing sustainable rural development established through the explanatory structural model, as illustrated in Equation (6)
S i R S j S j R S k = S i R S k
By applying the rules of Boolean algebraic operations to the adjacency matrix, the reachable matrix M can be obtained as follows.
M = A + I r
The road length r is calculated by the formula
A + I A + I 2 A + I r = A + I r + 1 = = A + I n
where element 0 in the ( A + I ) matrix indicates that there are no direct and indirect relationships between non-diagonal elements; element 1 in the matrix indicates two types of relationships, one between non-diagonal elements that can be pointed to after passing; that is, there is a direct or indirect relationship between the elements. The other category is diagonal elements, mainly represented as properties of the elements that can be pointed to without passing.
By performing the above step of the Boolean operation on the adjacency matrix, we obtain A + I 3 = A + I 4 , the reachable matrix M.

2.2.5. Systematic Explanatory Structural Model Development

The set S of the system of factors influencing sustainable rural development was divided into regions, and the system elements were first divided into several independent regions.
(1)
Reachable set R ( S i ) is mainly the set of all other elements in the system affected by element S i , that is, the set of all elements in the j t h column corresponding to the elements in the row in which element S i is in the reachable matrix M with value 1.
R ( S i ) = S i S i S , m i j = 1 i , j = 1 , 2 , 3 , , n
(2)
Precedence set A ( S i ) is mainly the set of all elements in the reachable matrix M elements of the system that has a value 1 in the column where the element Si is located and whose corresponding element in the jth row constitutes the set.
A ( S i ) = S i S i S , m j i = 1 i , j = 1 , 2 , 3 , , n
(3)
Common set C ( S i ) is mainly the intersection of two sets, the reachable set R of elements ( S i ) and the last set A of elements ( S i ), which mainly represents the relationship between elements that influence each other.
C ( S i ) = R ( S i ) A ( S i ) = S j S j S ,   m i j = 1 i , j = 1 , 2 , 3 , , n
The elements that have binary relationships in the bitmap of the above-delineated system element hierarchy are connected with directed arrows. The target elements of system S 1 are added; finally, the recursive structural model can be obtained.

2.3. System Dynamics and Interpretive Structural Model

2.3.1. Overall Framework

Figure 1 illustrates the general framework of the system dynamics and interpretive structural model (SD-ISM) developed in this paper, which divides sustainable rural development into three major subsystems, namely the economic development subsystem, the social development subsystem, and the resource and environment subsystem. Moreover, the ISM model of sustainable rural development impact factors is integrated into the SD model to establish a complete dynamic quantitative simulation model.

2.3.2. Causal Loop Diagram

The SD-ISM model focuses on the complex system of sustainable rural development and can better reflect the interaction and feedback mechanisms between elements. The primary purpose of the SD-ISM model is to provide a scientific basis for macroscopic decision making by explaining the internal structure of complex systems, the interactions between structures, and the feedback and control mechanisms between them. The main variables include economic development (GDP), social development (financial expenses, FE), and resource environment (pollution index, PI). This is achieved by building a system simulation model, and the causal loop diagram is illustrated in Figure 2.

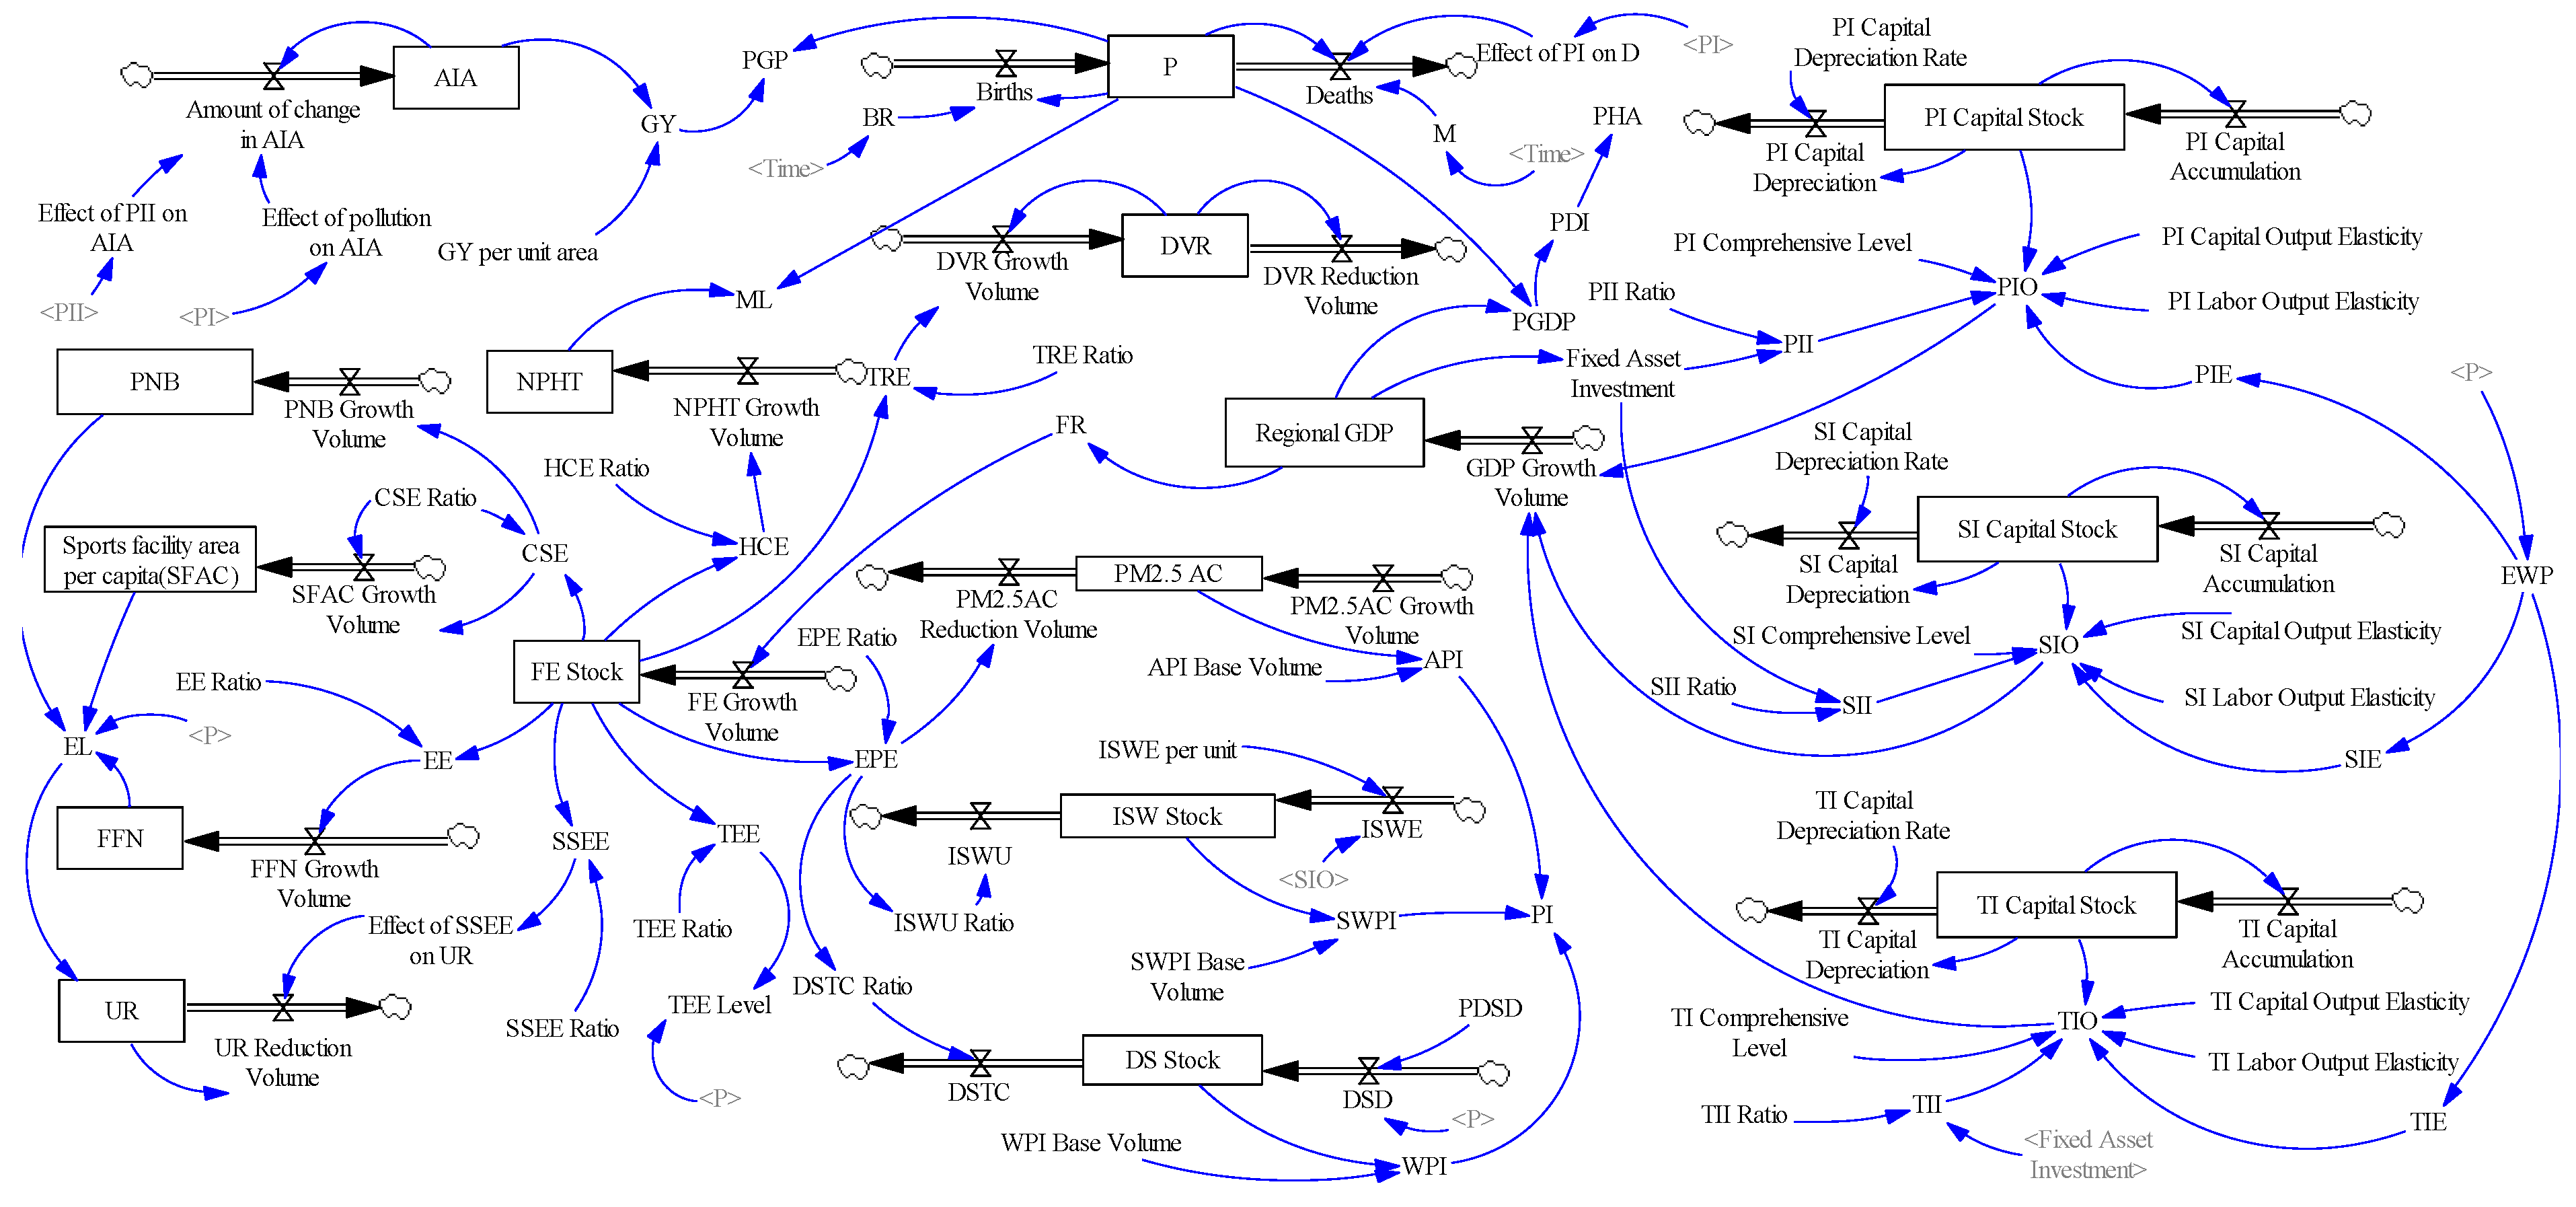
2.3.3. Stock Flow Diagram

Based on the cause–effect relationship of the sustainable rural development system, VENSIM software was used to map the feedback stock flow (Figure 3). In this section, the mathematical relationships between the main parameters of the factors in the inventory flow diagram are systematically constructed and described. This is used to explore the changes in the factors of the subsystem in sustainable rural development with the behavioral characteristics and trends of the system performance.
The inputs and outputs of gross production are determined according to the Cobb–Douglas production function on the factor input–output relationship of gross regional product, jointly proposed by the American mathematician Cobb and the economist Douglas. This is illustrated in Equation (11).
Y = A L α K β
where Y is regional GDP, A is the combined technology level, L is labor input, α is the labor output elasticity, K is the capital stock, and β is the labor output elasticity.
According to Li et al. (2021) [31], the ratio of fixed-asset investment to capital formation in the system is estimated to be between 0.4 and 0.6 due to the absence of total fixed-asset formation in the statistics, and the most significant formation ratio is derived from the P-test through relevant regression tests. The depreciation coefficient of capital formation of fixed assets in each industry is taken as 10% by the minimum years of depreciation of machinery and other production equipment for ten years, as stipulated in the People’s Republic of China on Enterprise Income Tax Regulations.
Managing the average cumulative concentration of PM2.5, the discharge and extensive use of industrial solid waste, and the discharge and treatment of domestic sewage were selected as indicators of environmental pollution. While rural areas may lack statistics on the amount of pollution within a particular area, the air and water are mobile between regions, and the level of environmental pollution does not vary significantly. Therefore, the data for solid waste emissions per unit of secondary industrial output value are calculated through an analogy with the ratio of solid waste to a secondary industrial output value in local counties and cities. Data related to the average cumulative concentration of PM2.5 are also analogous to the data released by local counties and cities. The per capita domestic wastewater discharges are based on the 141 L/d/person of rural domestic wastewater discharges in areas with little difference in economic levels.

2.3.4. Scenario Design

To study the sustainable development status of towns and cities from 2014 to 2030, this study simulates different scenarios of sustainable development of towns and cities based on the SD-ISM model. This study first sets up a baseline scenario of changes in explanatory variables for each year based on the rate of economic development, the current state of rural development, and the effectiveness of implementing rural revitalization policies. No adjustment was made to the parameters in the model, and the system was simulated under the current development policy of sustainable rural development using system dynamics software to simulate the system according to the existing development trend, hereafter referred to as Scenario 1.
Industrial optimization development model. Industry optimization refers to the current economic development of Zhenze Town and is mainly based on secondary industries. To further optimize the industrial development structure of the region, it is proposed to adjust the proportion of social fixed-assets investment in different industries to carry out a simulation of Scenario 1 [56,57]. According to the social fixed-assets investment in Zhenze town in recent years, the average proportion of primary industry investment is 0.03%, which accounts for a relatively low proportion, the average proportion of secondary industry investment is 37.79%, and the proportion of tertiary industry investment is 62.18%. Since the research area of this paper is a rural area, this is combined with the current development strategy of rural revitalization and local documents, such as “Implementing Rural Revitalization to Accelerate the Integrated Development of Urban and Rural Areas”, “Making Every Effort to Create a Three-Year Action Plan for the Benchmark of Jiangnan Water Township”, and “Adhering to the Wired Development of Agriculture and Rural Areas to Accelerate the Promotion of Rural Revitalization”. The low proportion of primary industry investment is not conducive to developing primary industries in rural areas. Therefore, two scenarios were adopted to optimize the industrial structure. First, the direction of improving rural primary industry development while promoting rural tourism in the tertiary industry is designed to increase the investment ratio of primary and tertiary industries. Second, the direction of further promoting economic development by developing rural pillar industries is designed to increase the proportion of investment in the secondary industry.
In Scenario 2, the share of primary sector investment is increased to 0.1%, and the share of tertiary sector investment is increased to 65%, while the share of secondary-sector investment is reduced.
In Scenario 3, the proportion of investment in the secondary sector is increased to 40.68%, and the proportion in the primary sector remains unchanged. In contrast, the proportion of investment in the tertiary sector is reduced.
The development model for the human living environment refers to increasing the proportion of investment in infrastructure and public services based on maintaining the economic development of the existing industrial structure, upgrading its development level, and thus improving the human living environment. Through the preliminary field research in Zhenze Town, the current residents of Zhenze Town think there is still room for improvement. They stated a need to improve education, cultural and sports facilities, medical care, transportation, and environmental protection. Therefore, Scenario 4 of this paper is to raise the investment ratio of financial expenditure in education, culture and sports, medical and health, environmental protection, and transportation to 1.2-times the original level.
The sustainable development model is based on the idea that economic, resource–environmental, and social development in the system are in harmony, that is, combining Scenarios 2–4 with the following specific scenarios.
Scenario 5: The proportion of investment in the primary sector is raised to 0.1%, and the proportion in the tertiary sector is raised to 65%. In contrast, the proportion of investment in the secondary sector is reduced. The proportion of fiscal expenditure on education, culture, sports, health care, environmental protection, and transportation is increased to 1.2-times the original proportion.
Scenario 6: The proportion of investment in the secondary sector is increased to 40%, and the proportion of investment in the primary sector remains unchanged. In contrast, the proportion of investment in the tertiary sector is reduced. The fiscal expenditure on education, culture and sports, health care, environmental protection, and transportation is increased to 1.2-times the original proportion.
The details of the specific adjustment parameters are illustrated in Table 2.

2.4. Data Sources

Due to the limitation of research space, Zhenze Town was selected as the object of the system simulation and analyzed in this paper only in the research area of Wujiang District. The data for the system model were mainly obtained from the Wujiang District Statistical Yearbook, the Wujiang District Yearbook, the Zhenze Town Government Work Report, the Zhenze Town Budget Execution and Draft Budget Report, and government documents, such as the Suzhou City Environmental Bulletin, as well as information obtained from field research. From the preliminary field research results, 60% of local village cadres and residents believe that the fastest period of rural development in the last 20 years was between 2015 and 2019. Subsequently, based on the data collected, historical rural development data from 2014 to 2018 were used to simulate system dynamics, and the system model timeframe was set as 2014–2030.

3. Results and Analyses

3.1. System Verification

3.1.1. Historicity Test of the System Model

To ensure that the system model simulation results match the data of the existing system, a history check of the system model was carried out. Thus, the model was repeatedly modified and adjusted to ensure the scientific validity of the model. The regional GDP and total population were selected for the historical testing.
According to Table 3 and Table 4, the model simulation data are consistent with the historical statistics, with a relative error of about ±5%. For the other variables in the model, the same method as the historical test was used, and again, the simulation data were consistent with the historical statistics, with an error of about ±5%. This means that the simulation effect of the system is close to the historical statistics and can better reflect the development condition of Zhenze Town, and the test is passed.

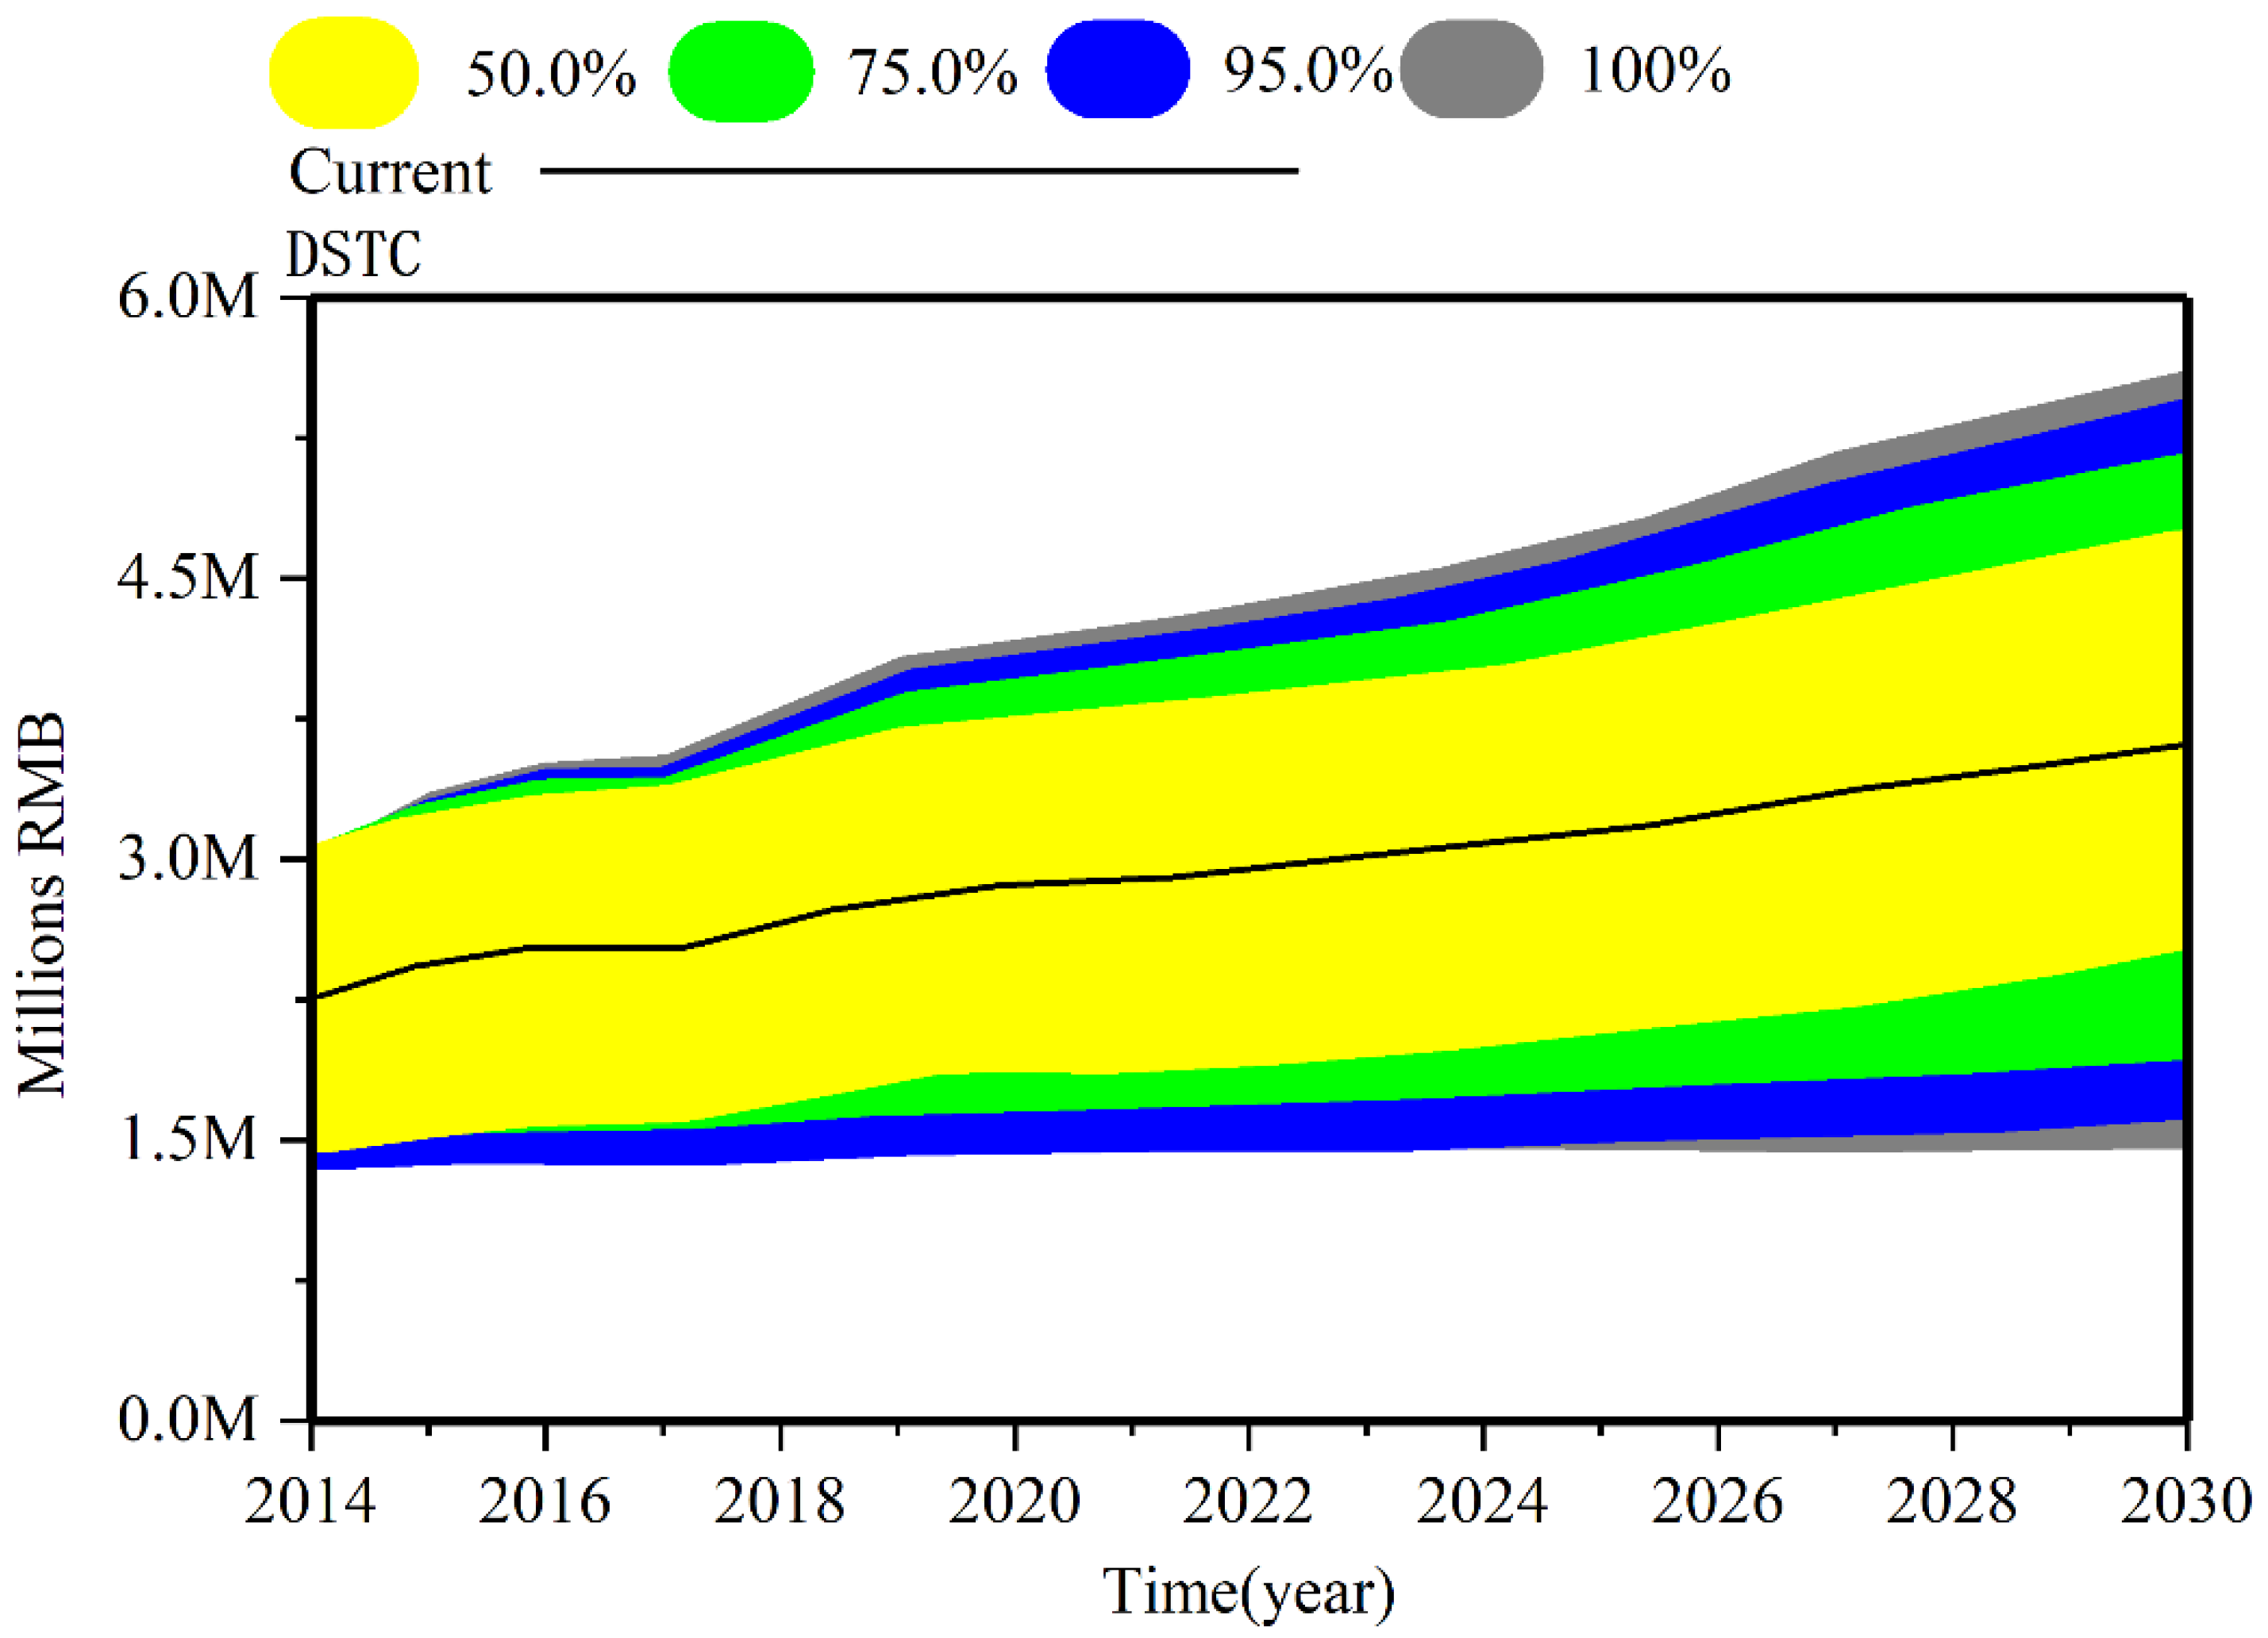
3.1.2. Sensitivity Test of the System Model

A sensitivity analysis of a system refers mainly to the degree to which changes in the system’s state or specific parameters are sensitive to changes in other parameters. A sensitivity analysis can help policymakers identify the system’s sensitive factors and provide a corresponding basis for policy formulation. Due to the space limitation, the investment rates for secondary production and environmental protection expenditure were selected for the sensitivity test.
Sensitivity test 1: The model secondary industry investment rate is 0.3779, and using a Monte Carlo random uniform distribution, 200 simulations, and noise seed 1234, the observed secondary industry investment rate fluctuates around 50%. The simulation results of the model are illustrated in Figure 4. As the economy develops, the secondary investment rate’s impact on the secondary sector’s output value gradually expands and is distributed proportionally, indicating that the secondary investment rate has a significant and stable impact.
Sensitivity test 2: The model environmental protection expenditure proportion is 0.0362. Using Monte Carlo random uniform distribution with 200 simulations and noise seed 1234, it fluctuates around 100%. The simulation results of the model are illustrated in Figure 5, from which the proportion of expenditure on environmental protection significantly impacts the amount of domestic wastewater treatment. However, its distribution still demonstrates a regular proportional distribution, indicating that the proportion of expenditure on environmental protection has a significant and stable impact on the number of pollutants treated.
The analyses in Figure 4 and Figure 5 illustrate that changing the rate of investment in secondary production and the proportion of expenditure on environmental protection will have a significant and stable effect on the model. The same method is also followed to test the sensitivity of other parameters, and the test results all pass the sensitivity test. Furthermore, the corresponding policy simulation can be completed by adjusting the parameters of the investment rate of each industry and ratio of various infrastructure and public service expenditures.

3.2. Simulation Results

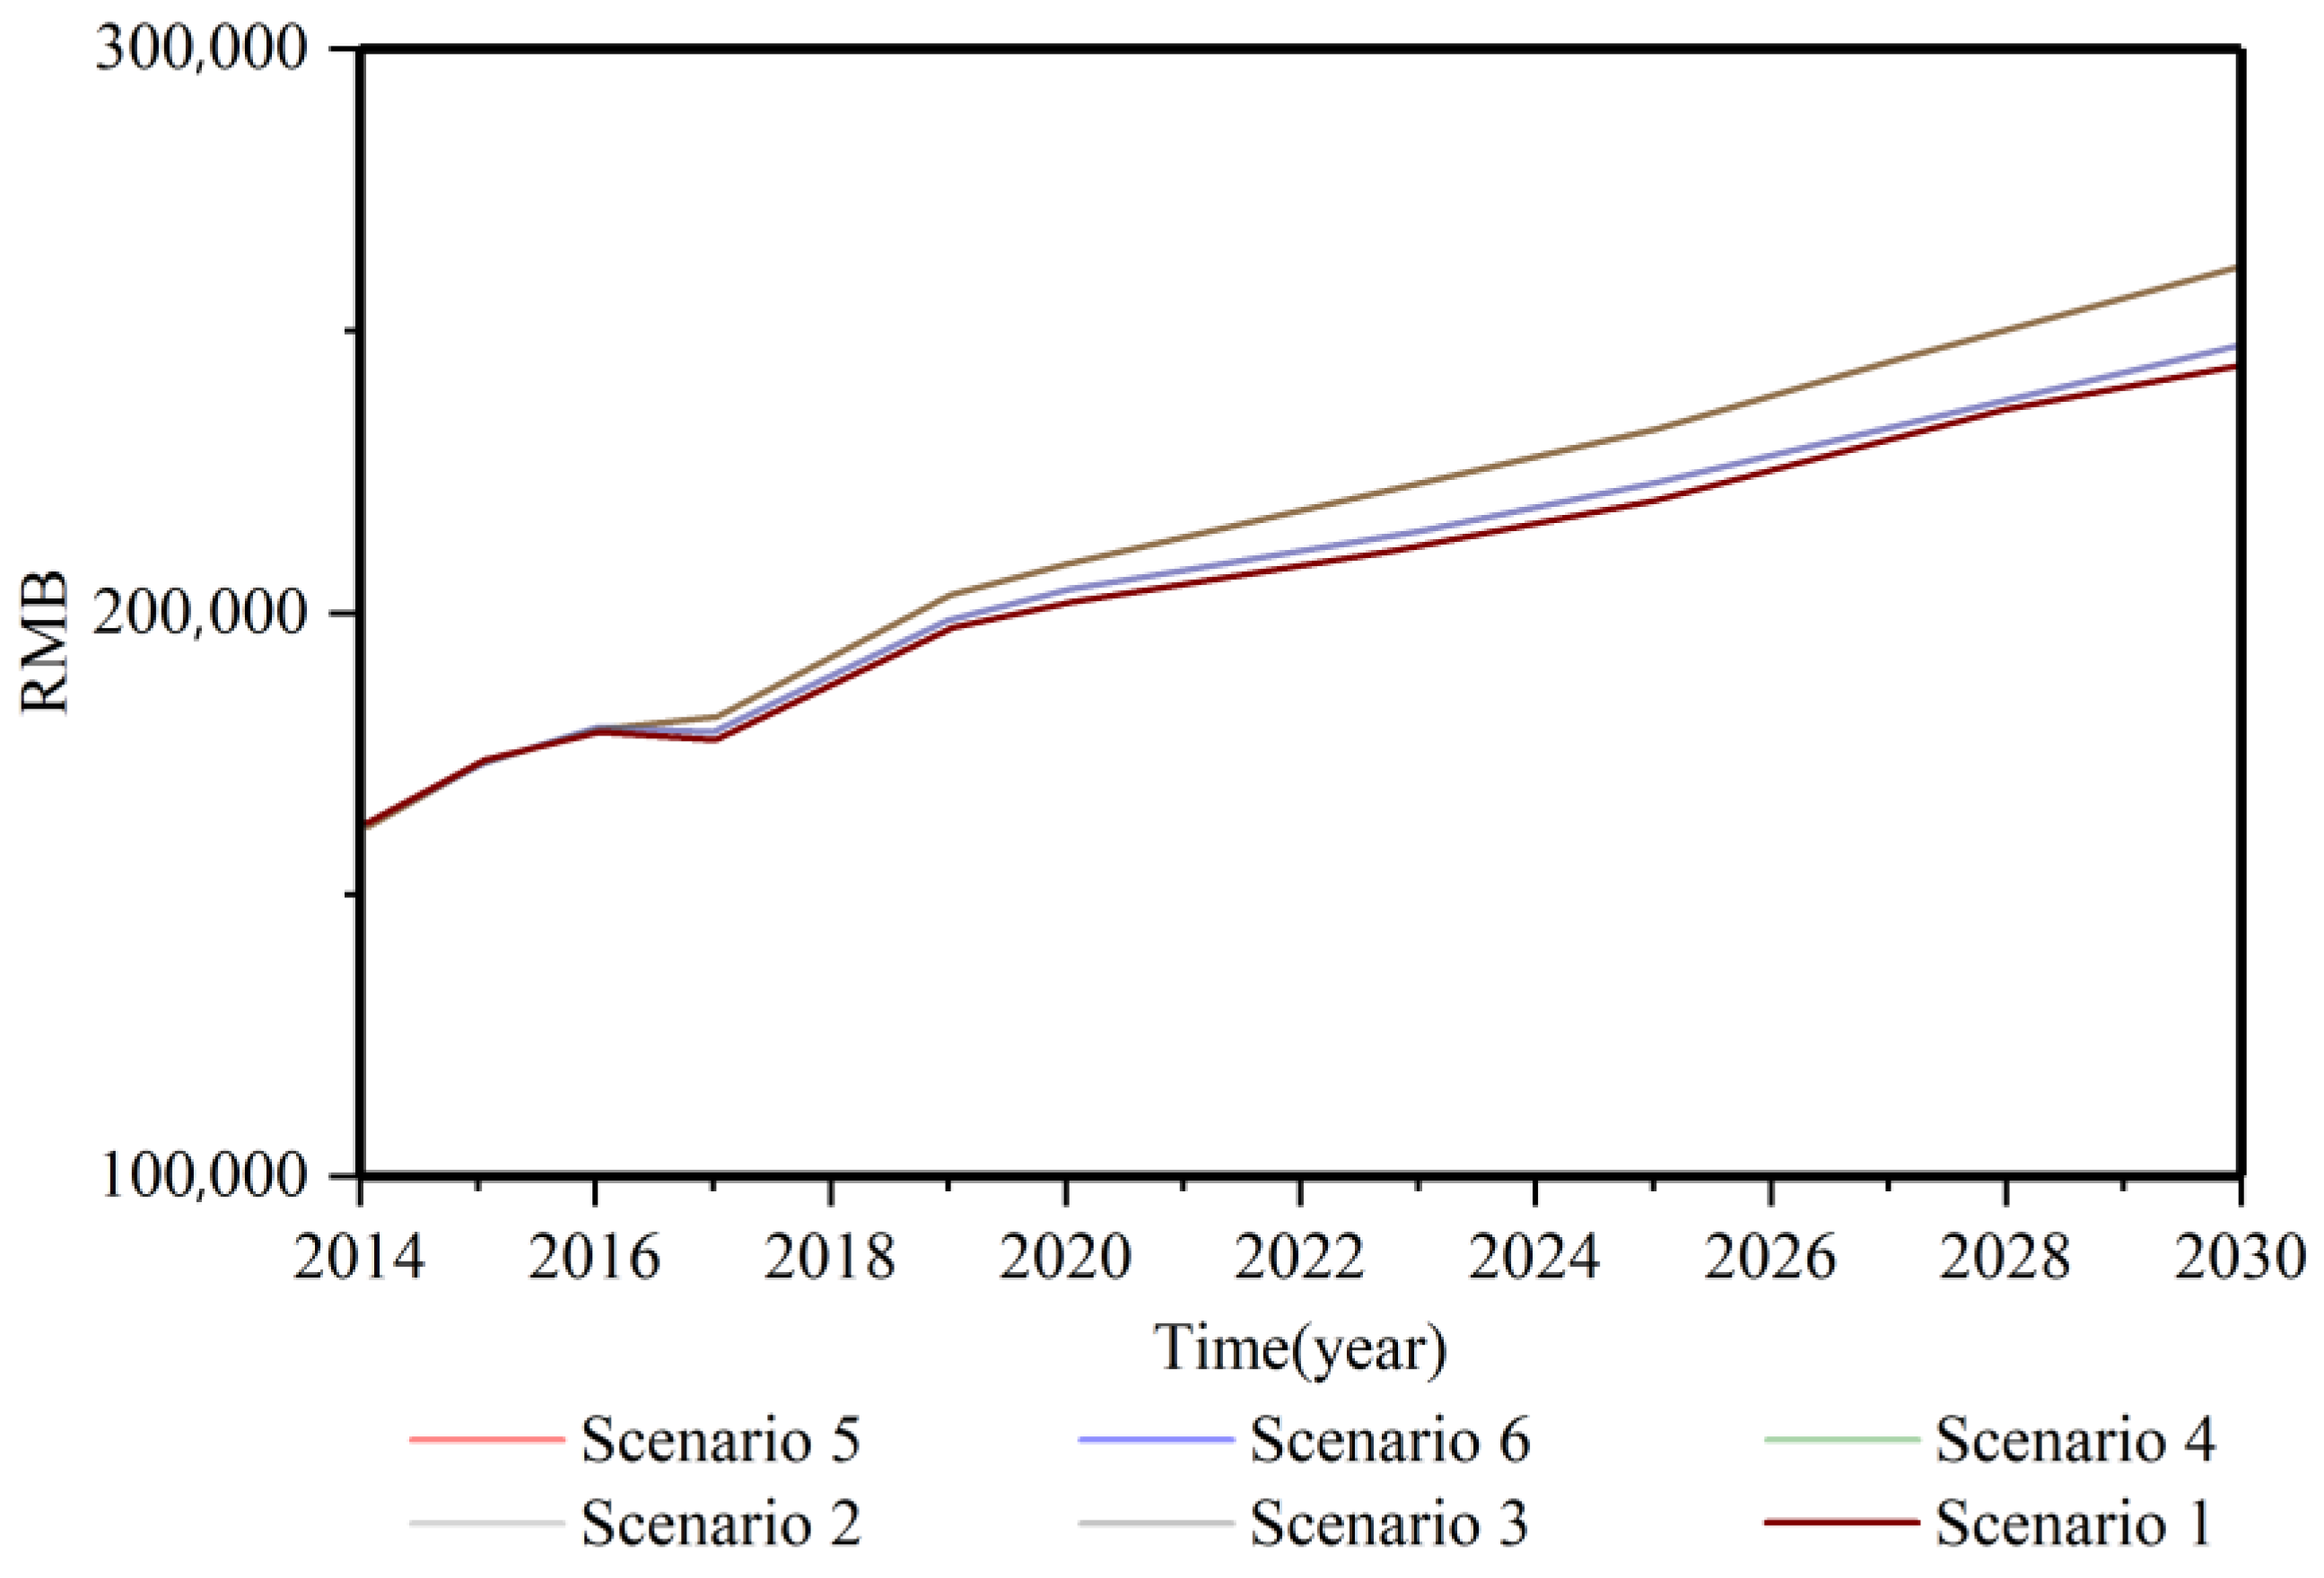
3.2.1. Economic Development Future Trends

As illustrated in Figure 6, the future regional GDP of Zhenze Town increases continuously under all six scenarios. The regional GDP is based on the CD production function in the natural development model. However, the data from 2017 illustrate fluctuations that do not match reality due to the labor input spillover when the production function is regressed. The model demonstrates errors with reality, but the error is around ±5%, indicating that the model has a good simulation effect. Scenario 2 is a policy regulation based on increasing the proportion of investment in the primary and tertiary sectors, with some increase in regional GDP compared to the natural development model. Scenario 2 is designed to strengthen the current dominant industry, the secondary industry. There is also some increase in GDP compared to the natural development model. Scenario 2 is compared with Scenario 3, and the change in GDP growth in Scenario 2 is more significant than the change in growth in Scenario 3. Thus, the industrial optimization model of increasing the ratio of investment in primary and tertiary sectors and increasing the development of the primary sector while driving the tertiary sector is better than the development policy of increasing investment in the secondary sector.
The remaining scenario development curves appear to overlap in two ways. Scenario 6 is slightly higher than Scenario 3, Scenario 5 is slightly higher than Scenario 2, and Scenario 4 is slightly higher than Scenario 1, because the current regional GDP of those two scenarios has the same financial input in the gross product. The labor input receives the impact of the population size, while habitat enhancement has less impact on population size growth. Therefore, the regional GDP of Scenarios 1 and 4, Scenarios 2 and 5, and Scenarios 3 and 6 largely overlaps in the graph.
As illustrated in Figure 7, the GDP of Zhenze Township is growing under all scenarios. The variation in GDP per capita does not differ much from the variation in GDP under the natural development pattern, further indicating that the area’s population size is more stable, and the GDP mainly determines the value of GDP per capita. In line with the GDP trend, the growth rate of GDP per capita from fast to slow is: Scenario 5 > Scenario 2 > Scenario 6 > Scenario 3 > Scenario 4 > Scenario 1. Optimizing the structure of industrial development at this stage, especially by increasing the development of the primary and tertiary industries, can promote GDP per capita growth. At the same time, improving the human environment also contributes to improving GDP per capita but to a lesser extent.

3.2.2. Resource Environment Future Trends

As an essential rural resource, arable land is an important source of national food output and an essential resource for ensuring food availability for the population. As illustrated in Figure 8, the arable land area first decreases and then slowly increases under different scenarios. Under the natural development pattern, that is, the development pattern of Scenario 1, the arable land area declines and then slowly increases, which is more consistent with the historical data. The main reason for this is that the local government attached importance to the status of secondary industries as pillar industries and vigorously developed secondary industries, and arable land resources were destroyed. Subsequently, to maintain the unique rural scenery of Zhenze Town, the local government introduced relevant funding policies. It strongly supported the development of the local plantation industry, resulting in the gradual recovery of arable land. The growth of cultivated land from fast to slow is as follows: Scenario 5, Scenario 2, Scenario 6, Scenario 3, Scenario 4 and Scenario 1. Among them, the growth rate of Scenario 2 and Scenario 5 was much faster than Scenario 1, Scenario 3, Scenario 4 and Scenario 6, which indicates that increasing the proportion of investment in primary industries has a promotion effect on the recovery of cultivated land. For Scenarios 2 and 5 and Scenarios 1, 3, 4 and 6, the curves overlap with very little difference, which indicates that environmental pollution has a negligible impact on the change in the arable land area. However, Scenarios 5, 6 and 4 are all slightly higher than Scenarios 2, 3 and 6, which indicates that environmental pollution has a particular impact on the change in arable land area. However, the magnitude of the impact is smaller.
During the period of rapid economic development, Zhenze Town focused on the development of the economy and neglected rural development, resulting in the current development of Zhenze Town being restricted by the land resources, and the arable land area gradually declined in 2016. In the face of the current conflict between the protection of arable land resources and rural development, the optimization of village planning should be strengthened, and the land built during the period of rough economic growth should be included as reserve space for sustainable rural development. Protecting arable land and other resources is also necessary to ensure food production.
The pollution index in the system is mainly used to reflect the region’s environmental pollution level, and it is mainly a relative number obtained by comparing the accumulated pollutant stock with the baseline pollutant stock. The pollution index only reflects the environmental pollution trends in the region, where the more significant the pollution index, the more serious the environmental pollution in the region. As illustrated in Figure 9, under the six development scenarios, the growth of the pollution index in the region gradually stabilizes, and the environmental quality improves. Under the natural development condition, that is, the development pattern of Scenario 1, the growth rate of the pollution index gradually reduces, and environmental quality gradually improves. Scenario 1 is consistent with the local environmental performance of reducing air pollutants, indicating that the model is a good simulation.
The pollution index is slow to fast in the following order: Scenario 5, Scenario 6, Scenario 4, Scenario 2, Scenario 3 and Scenario 1, where Scenarios 5, 6 and 4 are slower than Scenarios 2, 3 and 1. This indicates that improving the habitat environment, that is, increasing the expenditure on environmental protection, improves environmental quality. The pollution index in Scenario 3 is lower than in Scenario 1, according to the current proportion of investment in environmental protection and the appropriate development of the secondary industry, prompting the economic level to improve while increasing the environmental management, demonstrating that the environmental pollution index difference is not significant. Scenario 2 is higher than Scenarios 3 and 4, which demonstrates that the development of the primary and tertiary industries is conducive to improving environmental quality.

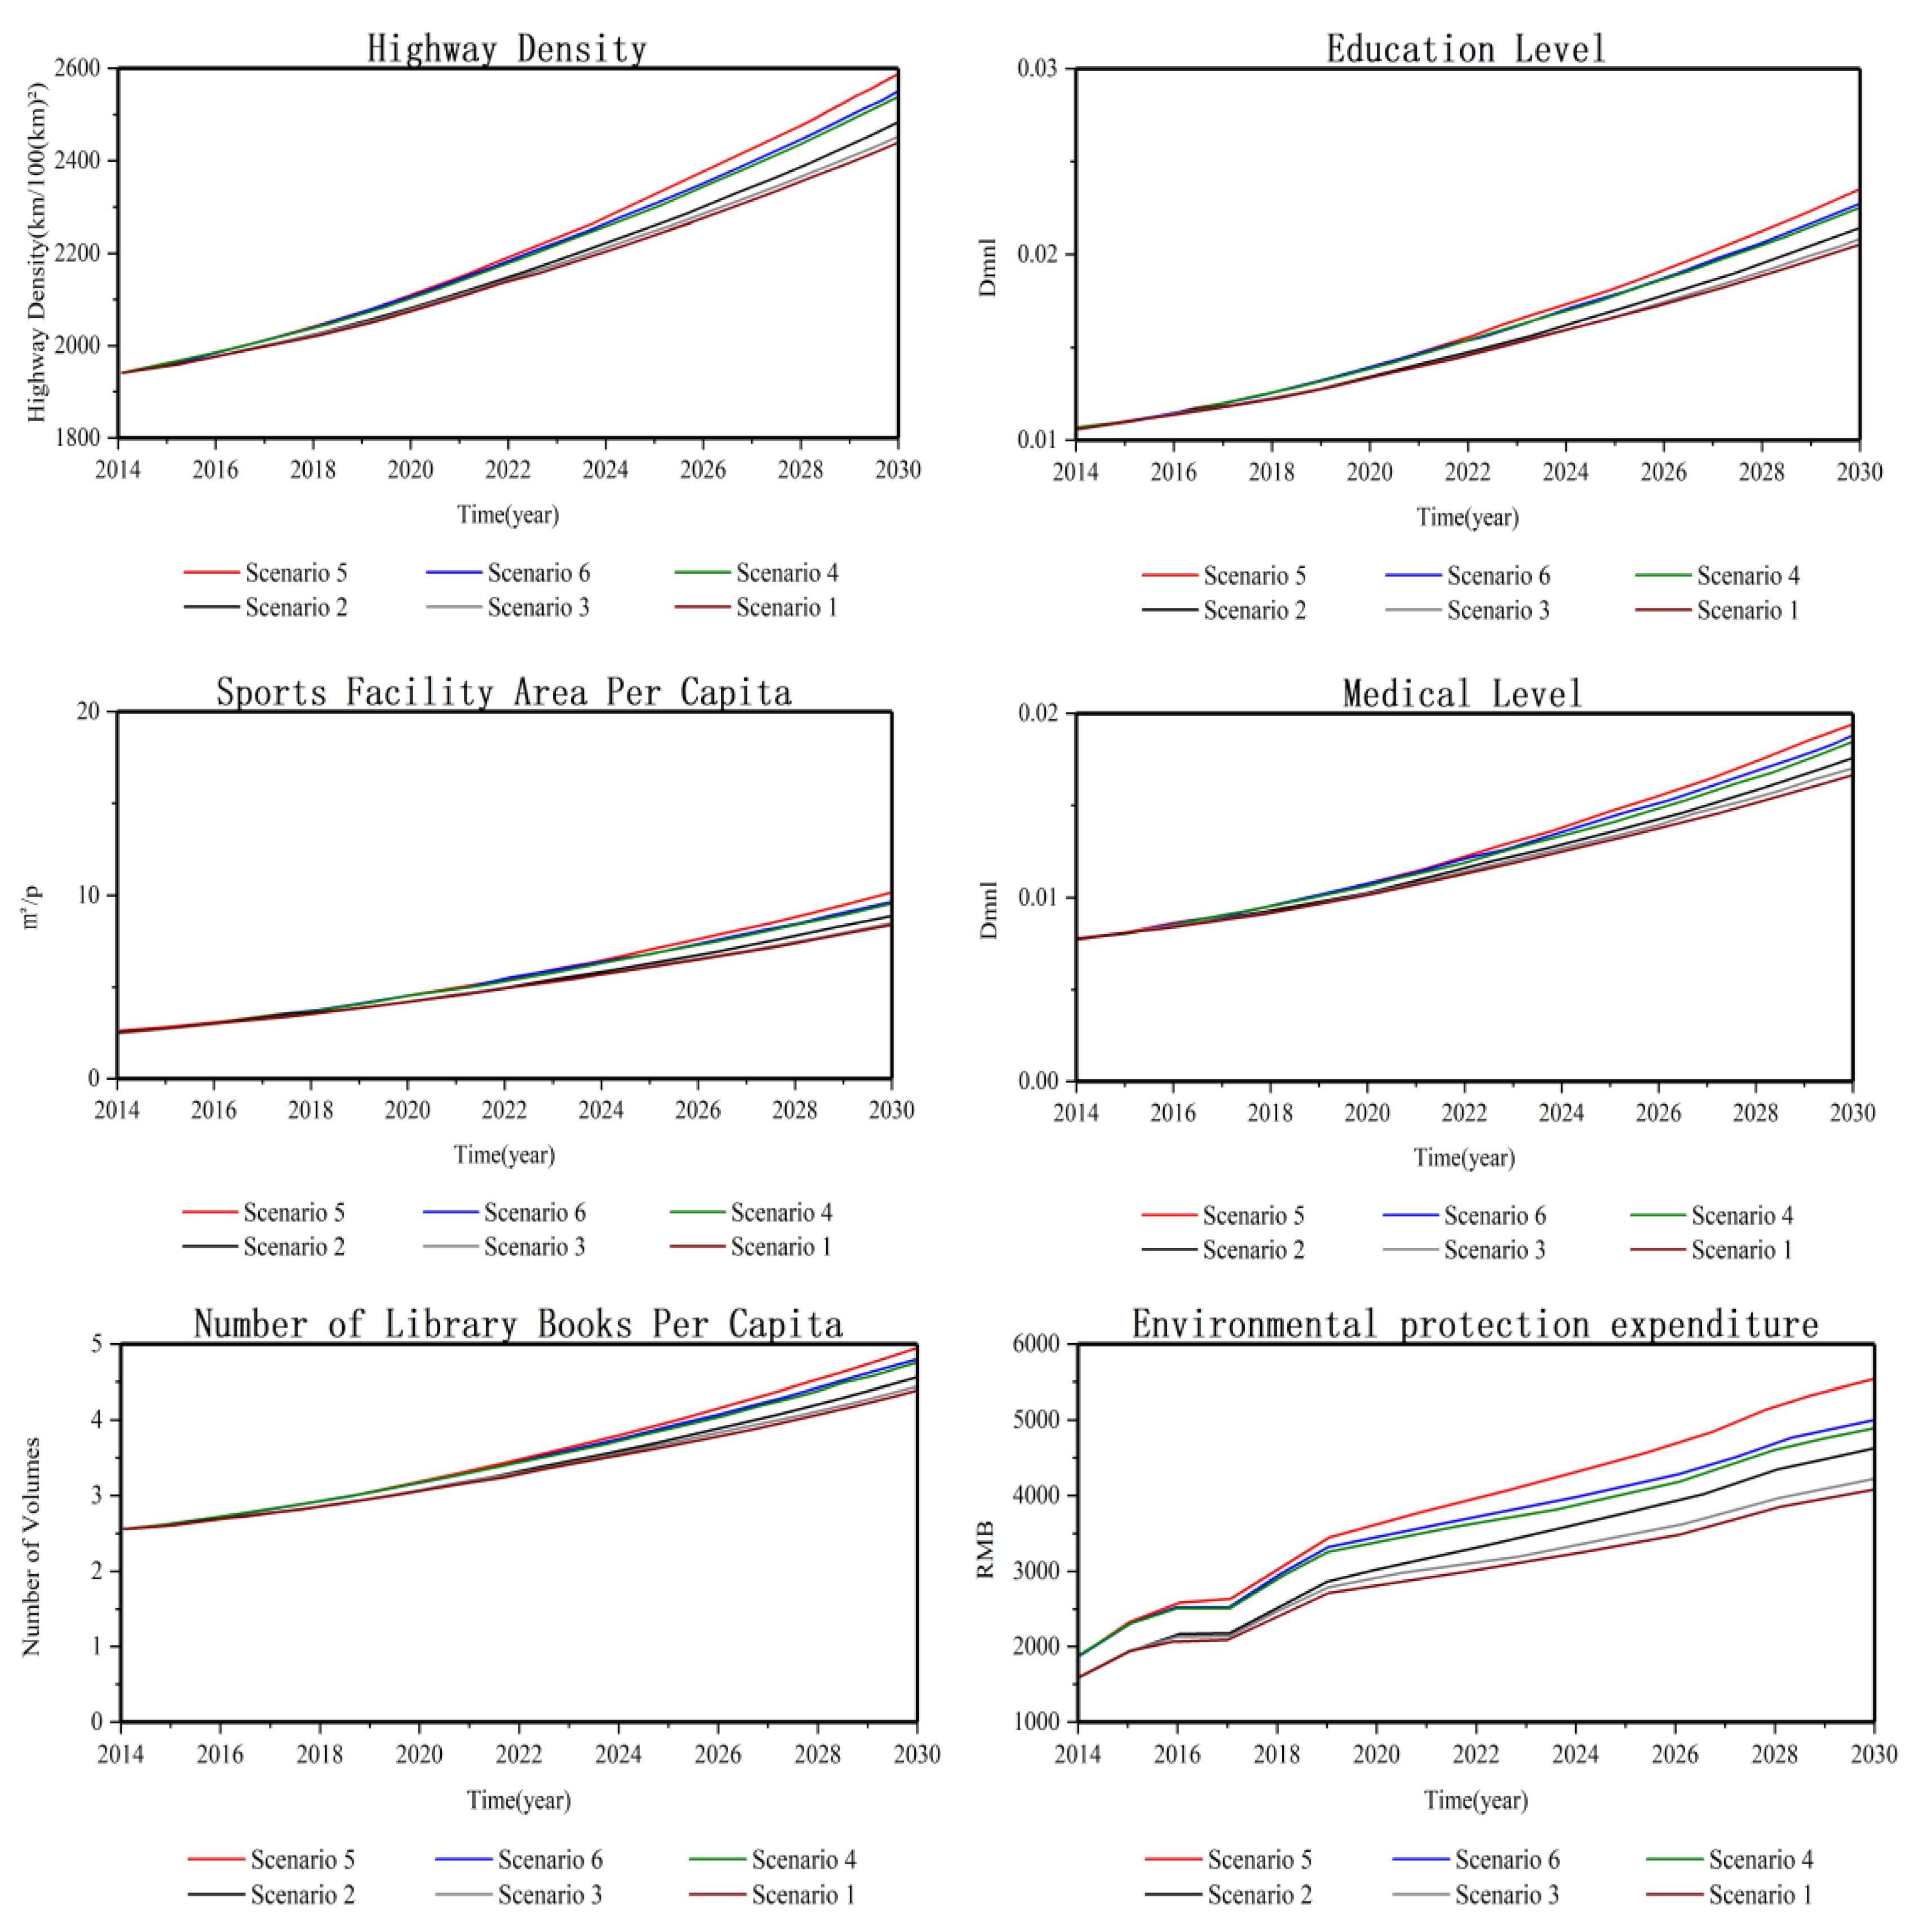
3.2.3. Social Development Trends

According to the field research, the residents believe in habitat improvement and sustainable village development. The main areas with room for improvement are transportation, education, cultural and sports facilities, medical care, and environmental protection. Therefore, for the text simulation study, road density, education level, the number of library books per capita, the area of sports facilities per capita, medical care level, and environmental protection expenditure were selected for the simulation.
The changes in road density, education level, number of library books per capita, area of sports facilities per capita, health-care level, and expenditure on environmental protection are illustrated in Figure 10. Under all six different development scenarios, a gradual upward trend in the habitat environment is observed. Under the natural development condition, that is, the development pattern of Scenario 1, road density, education level, number of library books per capita, area of sports facilities per capita, medical care level, and expenditure on environmental protection, the results are more in line with the actual changes and have been improved. The growth in road density, education level, number of library books per capita, area of sports facilities per capita, medical care level, and environmental protection expenditures is from fast to slow in the order of Scenario 5, Scenario 6, Scenario 4, Scenario 2, Scenario 3 and Scenario 1. Scenarios 4, 5 and 6 all have higher growth rates than Scenarios 1, 2 and 3, indicating that increased investment in improving the human environment can meet the growing needs. Scenarios 2 and 3 have higher growth rates than Scenario 1, indicating that the level of the local economy has a catalytic effect on improvements in the human environment.
According to the current policy and the proportion of investment in environmental protection, the appropriate development of the secondary industry improved the economic level while increasing environmental management. The difference in the environmental pollution index is not significant, and Scenario 2 is higher than Scenarios 3 and 4, indicating that the increased development of the primary and tertiary industries improves the environmental quality.

4. Discussion

A village or town is not only a place for residents to live but also a comprehensive spatial platform for production and living. Economic development can provide financial support and a material basis for sustainable rural development. Different economic development strategies and differences in industrial structural development have different impacts on sustainable rural development. Through the development trend of sustainable rural development under different development scenarios, the industrial structure needs to be optimized to enhance the sustainability level of Zhenze Town. The production factors, such as labor, technology, and capital, are transferred reasonably from the previous industrial sectors with low efficiency and high consumption to those with high efficiency and low consumption. As an essential part of sustainable rural development, the quality of the ecological environment is closely related to residents’ quality of life. Therefore, sustainable rural development should be carried out alongside protecting the environment and preventing reductions in the arable land area in 2016.
(1)
To promote industrial structure optimization with sustainability as the main line. The industrial structure of Zhenze Town in 2018 was 5:54:41, which has a significant advantage through the development of the secondary industry in the industrial structure compared with most rural villages and towns. However, compared with other sustainable rural villages and towns with a high level of development in China, the proportion of primary and tertiary industries is low, and the development of the economy is overly dependent on the development of secondary industries. However, the growth rate of secondary industry development slowed down in 2019, and the growth rate of the tertiary industry has gradually accelerated, gradually increasing its contribution to the local economy. Industries must support sustainable rural development, and the current industrial development of Zhenze town has local characteristics. For example, the local silk and textile industry has a deep history of development and has a good foundation for the development of the tertiary industry, which requires some guidance from the government. This should include upgrading the level of development of the primary industry, protecting local arable land resources, and creating a beautiful rural landscape. Increasing investment in the tertiary industry, such as rural tourism, with the development of the silk industry and the creation of high-quality accommodation rich in regional characteristics, can enhance the attractiveness of rural tourism. Further steps should include focusing on the development of technological innovation in the agricultural industry, seeking higher levels of industrial technology cooperation, improving the scale and mechanization of agricultural development, developing agricultural parks, cultivating new momentum for rural development, promoting the transformation and upgrading of modern agricultural development, and laying the industrial foundation for the development of green and livable rural villages and towns.
(2)
Improving industrial technology and expanding brand influence. Zhenze Town’s economic development currently relies on the development of industrial manufacturing, mainly fiber-optic silk, silk quilts, equipment manufacturing, and other major products. However, industrial manufacturing development needs to be further optimized for economic transformation and development, for example, by strengthening the current manufacturing base, increasing investment in technological innovation and technology upgrading, eliminating low-end manufacturing industries with low efficiency and severe environmental damage, and improving manufacturing production efficiency. Other improvements could include formulating policies to introduce talent, increasing the attraction for industrial talents, and providing academic support for industrial development. Enhancing the brand influence of enterprises, increasing product quality control, uniting the development power of related industries in surrounding villages and towns, and enhancing the influence of local brands should also be considered.
(3)
Strengthening joint development between villages and towns. Zhenze Town has 23 administrative villages under its jurisdiction, with different levels of economic development at the village level. They should be planned sufficiently in advance, and linkage development should be carried out based on the strengths of each village to create sustainable rural development. The modernization and development of agriculture should be comprehensively enhanced, and the development and optimal layout of unique industries should be further promoted to expand the scale effect and influence.
(4)
Optimizing village and town planning and improving the utilization rate of land resources. During the period of rapid economic development, Zhenze Town focused on economic development and neglected the development planning of villages and towns, which led to the current development of Zhenze Town being restricted by the space of land resources. The arable land area also demonstrated a gradual decline before 2015. In the face of the current conflict between protecting arable land resources and village development land, we should strengthen the optimization of village planning, organize the land built during the rough economic growth, and reserve space for village development and development land. Protecting arable land and other resources is also necessary to ensure food production.
In addition to the main aspects mentioned above, other aspects need to be further optimized and improved:
(5)
For a long time, environmental protection activities have been carried out mainly under government guidance, mainly because of their public interest nature. Therefore, we should focus on improving public participation and raising public awareness of environmental protection, which will significantly improve the environment.
(6)
There are many enterprises in Zhenze, and establishing an effective environmental protection mechanism is conducive to improving the environmental quality of the regional rural villages and towns. We should actively innovate the mechanisms for environmental protection and play the role of the market’s main body.
(7)
Sustainable rural development cannot be achieved without investing in human resources and academic support. The current development of Zhenze Town has a large demand gap for talent, and the introduction of talent needs to be improved to bring new vitality to sustainable rural development. Therefore, active talent introduction policies should encourage college students in rural villages and towns to return to their hometowns, attract more talent for sustainable rural development, and promote rural economic and social development.
(8)
Zhenze Town has an aging population, and public demand for infrastructure, such as medical care, retirement, and transportation facilities, is increasing annually. The government should increase its development efforts, and infrastructure development should be combined with public demand to meet the changes in the population’s age structure.

5. Conclusions

This study embeds the ISM model into the SD model by combining it with Monte Carlo simulation methods to develop a complete SD-ISM model for sustainable rural development. Considering the uncertainty of various factors, the study explored the sustainable rural development trends of Zhenze town during 2014–2030 by developing six combined scenarios with field research cases. This has important implications for rural revitalization and provides practical experience and theoretical guidance for other villages and towns to achieve urban–rural integration.
(1)
In total, 19 key influencing factors related to sustainable rural development were extracted based on the SD-ISM. There are apparent hierarchical and causal relationships among the factors, which can be used as an index system for evaluating the current state of sustainable rural development and providing an optimization path. Industry 4.0 enables precision agriculture, which uses remote sensing, GPS, data analysis, and other scientific methods for more pragmatic farming, thereby increasing agricultural productivity and reducing potential environmental damage. It can also use image recognition software, artificial neural networks, and various other technologies to identify plant anomalies at an early stage.
(2)
According to the actual situation and policy environment of village development in the case area, six different development scenarios were designed: the natural development mode, industrial optimization development mode, habitat enhancement development mode, and sustainable development mode. Among them, the sustainable development scenario is the ideal development method for Zhenze Town. Furthermore, according to the actual situation of Zhenze town development, relevant suggestions are made in terms of economic development, resources, environment, and social development, which provide support and direction for the future development of Zhenze town. These suggestions and development scenarios can lead to more integrated urban–rural development in Wujiang District, which has essential reference value and significance for rural revitalization.
This paper analyzed the factors influencing sustainable rural development in the context of rural revitalization in China and simulated possible trends for future sustainable rural development in combination with a quantitative analysis model. Furthermore, the conclusions and recommendations are of practical significance for promoting sustainable rural development in China. Rural revitalization (sustainable rural development) is an important strategy for rural development and narrows the gap between urban and rural areas. Understanding the development status of rural areas and possible future trends is necessary to formulate rural revitalization plans. Presently, policymakers have insufficient knowledge about sustainable rural development, resource endowments vary significantly among regions, there are few experiences to draw on, and policies and procedures for sustainable rural development in various regions are still inadequate. All these issues may lead to deviations from the goals of rural revitalization strategies.
Various types of rural field research data were used in this paper to measure the level of rural development and provide a quantitative analysis of rural development evaluation and scientific reference for using quantitative methods to explore rural revitalization methods and optimize sustainable rural development pathways. The findings demonstrated that industrial upgrading, technological innovation, mechanism reform, and talent guarantees are fundamental measures for sustainable rural development. Moreover, this study focuses on the development trends of sustainable rural development at the micro level. Future research should shift from data research to the attributes of rural revitalization policies and explore the effects of policies on sustainable rural development.
The sustainable construction of villages and towns is a complex process involving many influencing factors. There is a possibility of deviation between the data collected in this paper and the actual situation. In the future, emerging big data, such as Gaode POI data, Baidu POI data, and road network data, can be combined with GIS to supplement development data to optimize the model further. In addition, due to the limitation of the length of the study, only one of the towns was selected as the simulation object, and the subsequent research will select multiple towns in the same region for simulation analysis to form a horizontal comparison.

Author Contributions

Formal analysis, Q.S.; investigation, Q.S.; resources, T.Y.; data curation, Z.L.; writing—original draft preparation, Y.X.; writing—review and editing, Q.S.; visualization, M.C.; funding acquisition, M.C. All authors have read and agreed to the published version of the manuscript.

Funding

The authors would like to acknowledge financial support provided by the National Social Science Fund of China (20CGL065).

Institutional Review Board Statement

Not applicable.

Informed Consent Statement

Not applicable.

Data Availability Statement

Not applicable.

Acknowledgments

The authors are grateful to the editors and the anonymous reviewers for their insightful comments and suggestions.

Conflicts of Interest

The authors declare that they have no known competing financial interest or personal relationships that could have appeared to influence the work reported in this paper.

References

  1. Lazzarini, L. The role of planning in shaping better urban-rural relationships in Bristol City Region. Land. Use Policy 2018, 71, 311–319. [Google Scholar] [CrossRef]
  2. Shen, J.; Chou, R. Rural revitalization of Xiamei: The development experiences of integrating tea tourism with ancient village preservation. J. Rural. Stud. 2022, 90, 42–52. [Google Scholar] [CrossRef]
  3. Long, H.; Ma, L.; Zhang, Y.; Qu, L. Multifunctional rural development in China: Pattern, process and mechanism. Habitat. Int. 2022, 121, 102530. [Google Scholar] [CrossRef]
  4. Liu, Y.; Li, Y.; Chen, C. Pollution: Build on success in China. Nature 2015, 517, 145. [Google Scholar] [CrossRef] [PubMed] [Green Version]
  5. Liu, Y.; Peñuelas-Rivas, C.G.; Tenorio-Borroto, E.; Rivas-Guevara, M.; Buendía-Rodríguez, G.; Tan, Z.; González-Díaz, H. Chemometric approach to fatty acid metabolism-distribution networks and methane production in ruminal microbiome. Chemom. Intell. Lab. 2016, 151, 1–8. [Google Scholar] [CrossRef]
  6. Wang, J.; Cao, Y.; Fang, X.; Li, G.; Cao, Y. Identification of the trade-offs/synergies between rural landscape services in a spatially explicit way for sustainable rural development. J. Environ. Manag. 2021, 300, 113706. [Google Scholar] [CrossRef]
  7. Li, J.; Liu, Y.; Yang, Y.; Jiang, N. County-rural revitalization spatial differences and model optimization in Miyun District of Beijing-Tianjin-Hebei region. J. Rural. Stud. 2021, 86, 724–734. [Google Scholar] [CrossRef]
  8. López-Penabad, M.C.; Iglesias-Casal, A.; Rey-Ares, L. Proposal for a sustainable development index for rural municipalities. J. Clean. Prod. 2022, 357, 131876. [Google Scholar] [CrossRef]
  9. Liu, J.; Liu, Y.; Yan, M. Spatial and temporal change in urban-rural land use transformation at village scale—A case study of Xuanhua district, North China. J. Rural. Stud. 2016, 47, 425–434. [Google Scholar] [CrossRef]
  10. Liu, C.; Dou, X.; Li, J.; Cai, L.A. Analyzing government role in rural tourism development: An empirical investigation from China. J. Rural. Stud. 2020, 79, 177–188. [Google Scholar] [CrossRef]
  11. Wilson, G.A.; Hu, Z.; Rahman, S. Community resilience in rural China: The case of Hu Village, Sichuan Province. J. Rural. Stud. 2018, 60, 130–140. [Google Scholar] [CrossRef] [Green Version]
  12. Zhang, R.; Yuan, Y.; Li, H.; Hu, X. Improving the framework for analyzing community resilience to understand rural revitalization pathways in China. J. Rural. Stud. 2022, 94, 287–294. [Google Scholar] [CrossRef]
  13. Albaladejo, C.; Couix, N.; Barthe, L. Learning in Agriculture: Rural Development Agents in France Caught between a Job Identity and a Professional Identity. J. Agric. Educ. Ext. 2007, 13, 95–106. [Google Scholar] [CrossRef]
  14. Herzik, E.B. The continuing importance of agriculture in american rural development. Agric. Adm. 1985, 19, 29–41. [Google Scholar] [CrossRef]
  15. Ranson, B. Rural Education and Economic Development in China, Mexico, Japan, and the United States. Comp. Educ. Rev. 1988, 32, 213–225. [Google Scholar] [CrossRef]
  16. Schrader, H. Impact assessment of the EU structural funds to support regional economic development in rural areas of Germany. J. Rural. Stud. 1994, 10, 357–365. [Google Scholar] [CrossRef]
  17. Yan, J.; Chen, H.; Xia, F. Toward improved land elements for urban–rural integration: A cell concept of an urban–rural mixed community. Habitat. Int. 2018, 77, 110–120. [Google Scholar] [CrossRef]
  18. Yang, J.; Yang, R.; Chen, M.; Su, C.J.; Zhi, Y.; Xi, J. Effects of rural revitalization on rural tourism. J. Hosp. Tour. Manag. 2021, 47, 35–45. [Google Scholar] [CrossRef]
  19. Akroyd, H.D. Agriculture and rural development planning: A process in transition. Eur. Rev. Agric. Econ. 2017, 32, 289–291. [Google Scholar]
  20. Du, J.; Bai, X.; Lu, Y.; Wang, H.; Zhao, J.; Liu, J.; Wang, H.; Sui, X.; Fang, Q. Diagnostic Efficacy of Ultrasonographic Characteristics of Thyroid Carcinoma in Predicting Cervical Lymph Node Metastasis. Ultrasound Med. Biol. 2016, 42, 68–74. [Google Scholar] [CrossRef]
  21. Tian, Q.; Holland, J.H.; Brown, D.G. Social and economic impacts of subsidy policies on rural development in the Poyang Lake Region, China: Insights from an agent-based model. Agr. Syst. 2016, 148, 12–27. [Google Scholar] [CrossRef]
  22. Hawthorne, W. Sacred rice: An ethnography of identity, environment, and development in rural West Africa. J. Peasant. Stud. 2016, 44, 497–499. [Google Scholar] [CrossRef]
  23. Khajehei, H.; Haddadzade, M.; Ahmadi, A. Optimal opportunistic tamping scheduling for railway track geometry. Struct. Infrastruct. Eng. 2021, 17, 1299–1314. [Google Scholar] [CrossRef]
  24. Thorburn, C.C.; Kull, C.A. Peatlands and plantations in Sumatra, Indonesia: Complex realities for resource governance, rural development and climate change mitigation. Asia Pac. Viewp. 2015, 56, 153–168. [Google Scholar] [CrossRef] [Green Version]
  25. Guo, Y.; Liu, Y. Poverty alleviation through land assetization and its implications for rural revitalization in China. Land. Use Policy 2021, 105, 105418. [Google Scholar] [CrossRef]
  26. Long, H.; Liu, Y. Rural restructuring in China. J. Rural. Stud. 2016, 47, 387–391. [Google Scholar] [CrossRef]
  27. Yin, Q.; Sui, X.; Ye, B.; Zhou, Y.; Li, C.; Zou, M.; Zhou, S. What role does land consolidation play in the multi-dimensional rural revitalization in China? A research synthesis. Land. Use Policy 2022, 120, 106261. [Google Scholar] [CrossRef]
  28. Fan, J. Frontier approach of the sustainable process and pattern of human-environment system. Dili Xuebao/Acta Geogr. Sin. 2014, 69, 1060–1068. [Google Scholar] [CrossRef]
  29. Liu, Y.; Hu, Z.; Li, Y. Process and cause of urban-rural development transformation in the Bohai Rim Region, China. J. Geogr. Sci. 2014, 24, 1147–1160. [Google Scholar] [CrossRef] [Green Version]
  30. Long, H.; Zou, J.; Pykett, J.; Li, Y. Analysis of rural transformation development in China since the turn of the new millennium. Appl. Geogr. 2011, 31, 1094–1105. [Google Scholar] [CrossRef]
  31. Li, X.; Yang, H.; Jia, J.; Shen, Y.; Liu, J. Index system of sustainable rural development based on the concept of ecological livability. Environ. Impact Assess. 2021, 86, 106478. [Google Scholar] [CrossRef]
  32. Yang, R.; Xu, Q.; Long, H. Spatial distribution characteristics and optimized reconstruction analysis of China’s rural settlements during the process of rapid urbanization. J. Rural. Stud. 2016, 47, 413–424. [Google Scholar] [CrossRef]
  33. Yin, X.; Chen, J.; Li, J. Rural innovation system: Revitalize the countryside for a sustainable development. J. Rural. Stud. 2022, 93, 471–478. [Google Scholar] [CrossRef]
  34. Cheng, L.; Brown, G.; Liu, Y.; Searle, G. An evaluation of contemporary China’s land use policy-The Link Policy: A case study from Ezhou, Hubei Province. Land. Use Policy 2020, 91, 104423. [Google Scholar] [CrossRef]
  35. Shi, Z.H.; Ma, L.B.; Zhang, W.B.; Gong, M. Differentiation and correlation of spatial pattern and multifunction in rural settlements considering topographic gradients: Evidence from Loess Hilly Region, China. J. Environ. Manag. 2022, 315, 115127. [Google Scholar] [CrossRef] [PubMed]
  36. Li, H.; Yuan, Y.; Zhang, X.; Li, Z.; Wang, Y.; Hu, X. Evolution and transformation mechanism of the spatial structure of rural settlements from the perspective of long-term economic and social change: A case study of the Sunan region, China. J. Rural. Stud. 2022, 93, 234–243. [Google Scholar] [CrossRef]
  37. Wen, T.J. The Evolution of the “three Rural” Issues in the 40 Years of Reform and Opening up and the Proposal of Rural Revitalization Strategy. Theor. Discuss. 2018, 5, 6–9. [Google Scholar]
  38. Zhou, Y.; Li, Y.; Liu, Y. The nexus between regional eco-environmental degradation and rural impoverishment in China. Habitat. Int. 2020, 96, 102086. [Google Scholar] [CrossRef]
  39. Ye, Q.; Zhong, Z. Have we been ready for rural construction: Research on the theoretical framework of rural construction system. Geogr. Res. Aust. 2017, 36, 1843–1858. [Google Scholar]
  40. Feng, G.; Zhang, M. The Coupling Coordination Development of Rural E-commerce and Rural Revitalization: A Case Study of 10 Rural Revitalization Demonstration Counties in Guizhou. Procedia Comput. Sci. 2022, 199, 407–414. [Google Scholar] [CrossRef]
  41. Gao, J.; Wu, B. Revitalizing traditional villages through rural tourism: A case study of Yuanjia Village, Shaanxi Province, China. Tour. Manag. 2017, 63, 223–233. [Google Scholar] [CrossRef]
  42. Hu, S.; Yang, Y.; Zheng, H.; Mi, C.; Ma, T.; Shi, R. A framework for assessing sustainable agriculture and rural development: A case study of the Beijing-Tianjin-Hebei region, China. Environ. Impact Assess. 2022, 97, 106861. [Google Scholar] [CrossRef]
  43. Huang, Y.; Hui, E.C.M.; Zhou, J.; Lang, W.; Chen, T.; Li, X. Rural Revitalization in China: Land-Use Optimization through the Practice of Place-making. Land. Use Policy 2020, 97, 104788. [Google Scholar] [CrossRef]
  44. Jeong, J.S.; Ramírez-Gómez, Á. Development of a web graphic model with fuzzy-decision-making Trial and Evaluation Laboratory/Multi-criteria-Spatial Decision Support System (F-DEMATEL/MC-SDSS) for sustainable planning and construction of rural housings. J. Clean. Prod. 2018, 199, 584–592. [Google Scholar] [CrossRef]
  45. Kan, K. Creating land markets for rural revitalization: Land transfer, property rights and gentrification in China. J. Rural. Stud. 2021, 81, 68–77. [Google Scholar] [CrossRef]
  46. Ma, L.; Liu, S.; Tao, T.; Gong, M.; Bai, J. Spatial reconstruction of rural settlements based on livability and population flow. Habitat. Int. 2022, 126, 102614. [Google Scholar] [CrossRef]
  47. Teng, Y.; Lin, P.; Chen, X.; Wang, J. An analysis of the behavioral decisions of governments, village collectives, and farmers under rural waste sorting. Environ. Impact Asses. 2022, 95, 106780. [Google Scholar] [CrossRef]
  48. Wang, Y.; Zhu, Y.; Yu, M. Evaluation and determinants of satisfaction with rural livability in China’s less-developed eastern areas: A case study of Xianju County in Zhejiang Province. Ecol. Indic. 2019, 104, 711–722. [Google Scholar] [CrossRef]
  49. Wang, D.; Zhu, Y.; Zhao, M.; Lv, Q. Multi-dimensional hollowing characteristics of traditional villages and its influence mechanism based on the micro-scale: A case study of Dongcun Village in Suzhou, China. Land. Use Policy 2021, 101, 105146. [Google Scholar] [CrossRef]
  50. Shi, Q.; Cai, R.; Huo, T.; You, K.; Cai, W. A fairly and effectively analysis for the sharing of CO2 emissions reduction responsibility in China’s provincial building sectors. Environ. Impact Asses. 2023, 99, 106984. [Google Scholar] [CrossRef]
  51. Yurui, L.; Luyin, Q.; Qianyi, W.; Karácsonyi, D. Towards the evaluation of rural livability in China: Theoretical framework and empirical case study. Habitat. Int. 2020, 105, 102241. [Google Scholar] [CrossRef]
  52. Yang, Y.; Bao, W.; Wang, Y.; Liu, Y. Measurement of urban-rural integration level and its spatial differentiation in China in the new century. Habitat. Int. 2021, 117, 102420. [Google Scholar] [CrossRef]
  53. Zhao, J.; Yan, J.; Ran, Q.; Yang, X.; Su, X.; Shen, J. Does the opening of high-speed railways improve urban livability? Evidence from a quasi-natural experiment in China. Soc. Econ. Plan. Sci. 2022, 82, 101275. [Google Scholar] [CrossRef]
  54. Zhou, Q.; Liu, Y.; Qu, S. Emission effects of China’s rural revitalization: The nexus of infrastructure investment, household income, and direct residential CO2 emissions. Renew. Sustain. Energy Rev. 2022, 167, 112829. [Google Scholar] [CrossRef]
  55. Zhong, Z.; Chen, Z. Urbanization, green development and residents’ happiness: The moderating role of environmental regulation. Environ. Impact Asses. 2022, 97, 106900. [Google Scholar] [CrossRef]
  56. Jiang, Y.; Long, H.; Ives, C.D.; Deng, W.; Chen, K.; Zhang, Y. Modes and practices of rural vitalisation promoted by land consolidation in a rapidly urbanising China: A perspective of multifunctionality. Habitat. Int. 2022, 121, 102514. [Google Scholar] [CrossRef]
  57. Liu, Y.; Dai, L.; Long, H.; Woods, M.; Fois, F. Rural vitalization promoted by industrial transformation under globalization: The case of Tengtou village in China. J. Rural. Stud. 2022, 95, 241–255. [Google Scholar] [CrossRef]
Figure 1. The SD-ISM model framework for China’s sustainable rural development.
Sustainability 15 08200 g001
Figure 2. Causal loop diagram of the SD-ISM model.
Sustainability 15 08200 g002
Figure 3. The stock flow diagram of the SD-ISM model.
Sustainability 15 08200 g003
Figure 4. Sensitivity test of secondary industry investment rate.
Sustainability 15 08200 g004
Figure 5. Sensitivity test of environmental protection expenditure ratio.
Sustainability 15 08200 g005
Figure 6. Simulation of regional GDP.
Sustainability 15 08200 g006
Figure 7. Simulation of GDP per capita.
Sustainability 15 08200 g007
Figure 8. Simulation of arable land area.
Sustainability 15 08200 g008
Figure 9. Simulation of the pollution index.
Sustainability 15 08200 g009
Figure 10. Simulation of critical indicators for sustainable rural development.
Sustainability 15 08200 g010
Table 1. The influencing factors of sustainable rural development.
Variable SymbolInfluencing Factors (Frequency)Variable SymbolInfluencing Factors (Frequency)
S1Sustainable rural development (30)S2Population (6)
S3Economic development (22)S4Housing conditions (21)
S5Social development (13)S6Education (5)
S7Resource environment (19)S8Cultural and sports facilities (10)
S9Industrial structure (12)S10Transport (13)
S11Gross regional product (13)S12Medical care (5)
S13Infrastructure and public services (24)S14Employment and social security levels (5)
S15Ecology (26)S16Water pollution (8)
S17Land resources (6)S18Environmental governance (11)
S19Air pollution (7)S20Soil contamination (9)
Table 2. Parameter adjustment.
Adjusting ParametersScenario 1Scenario 2Scenario 3Scenario 4Scenario 5Scenario 6
Proportion of investment in primary production0.03%0.1%0.03%0.03%0.1%0.03%
Proportion of investment in secondary production37.79%34.9%40.68%37.79%34.9%40.68%
Proportion of investment in three industries62.18%65%59.29%62.18%65%59.29%
Proportion of expenditure on education17.4%17.4%17.4%20.88%20.88%20.88%
Proportion of expenditure on culture and sports1.03%1.03%1.03%1.24%1.24%1.24%
Proportion of expenditure on health care7.42%7.42%7.42%8.09%8.09%8.09%
Environmental protection ratio3.62%3.62%3.62%4.34%4.34%4.34%
Proportion of expenditure on transport2.98%2.98%2.98%3.576%3.576%3.576%
Table 3. Comparison of population simulation values and statistical values.
YearStatistical ValueSimulation ValueInaccuracies
201467,45867,4580.00%
201567,31967,292−0.04%
201667,17867,1970.03%
201767,04767,2020.23%
201866,83667,0030.25%
Table 4. Comparison of regional GDP simulation values and statistical values.
YearStatistical Value
($ Million)
Simulated Value
($ Million)
Inaccuracies
20141,107,9001,098,760−0.82%
20151,126,1701,167,7303.69%
20161,183,5951,203,4701.68%
20171,264,6601,202,510−4.91%
20181,355,4101,279,320−5.61%
Disclaimer/Publisher’s Note: The statements, opinions and data contained in all publications are solely those of the individual author(s) and contributor(s) and not of MDPI and/or the editor(s). MDPI and/or the editor(s) disclaim responsibility for any injury to people or property resulting from any ideas, methods, instructions or products referred to in the content.

