Article

Abandonment of Cropland and Seminatural Grassland in a Mountainous Traditional Agricultural Landscape in Japan

1
Faculty of Regional Environmental Science, Tokyo University of Agriculture, Sakuragaoka 1-1-1, Setagaya-ku 156-8502, Tokyo, Japan
2
Toyota City Museum of Local History, Jinnakacho 1-21-2, Toyota 471-0079, Aichi, Japan
3
Japan Wildlife Research Center, Kotobashi 3-3-7, Sumida-ku 130-8606, Tokyo, Japan
4
NPO Tama Genryu Kosuge, Kosuge 1911, Kitatsuru-gun 401-0211, Yamanashi, Japan
*
Author to whom correspondence should be addressed.
These authors contributed equally to this work.
Sustainability 2023, 15(10), 7742; https://doi.org/10.3390/su15107742
Submission received: 30 March 2023 / Revised: 29 April 2023 / Accepted: 5 May 2023 / Published: 9 May 2023
(This article belongs to the Special Issue Sustainable Development in Mountain Areas)

Abstract

:
The abandonment of traditional agricultural land is a global phenomenon, especially in mountainous areas. Although there are many mountainous villages where traditional agriculture, based on wild-plant mulching systems, is still practiced in Japan, the extent of land use change in these areas has not been quantitatively assessed. Economic theory predicts the systematic allocation of land to its maximum net value in response to distance from residential centres or demand. We tested this theory to determine whether: (1) grassland and cropland abandonment occurs far from residential centres and (2) new grassland becomes established near residential centres because its products (i.e., wild plants) are essential to traditional agriculture. We interviewed farmers from the traditional mountain village of Kosuge, Japan, to examine land use change at a parcel scale over the period 1940–2019. Our predictions were confirmed in that cropland and grassland were abandoned, while regrowth forests and plantations became established thereafter in the more inaccessible areas, in terms of distance from the village centre and slope aspect. Furthermore, new grassland developed near the centre of the village, leading to the ‘advance’ of grassland into the residential centre. Our results indicate that spatiotemporal patterns of land use change in traditional agricultural landscapes can be predicted and used to inform policies designed to sustainably maintain these landscapes and their ecosystem function.

1. Introduction

There has been a rapid global decline in traditional agricultural landscapes, including in Europe [1,2,3], South Asia [4], Southeast Asia [5,6], and East Asia, including China [7] and Japan [8,9,10,11]. A traditional agricultural landscape is a landscape in which traditional sustainable agricultural practises are currently carried out and where biological diversity, including agrobiodiversity, is thereby conserved [12]. For example, in Japan, the traditional agricultural landscape known as ‘Satoyama’ [13] extends between the cities and the deep mountains and combines various environments such as vegetable fields, rice paddies, grassland, irrigation ponds, ditches, woodland, and residential areas [9]. This Satoyama is located mostly in forested hilly or mountainous areas and covers roughly 67% of the total area of the country [8]. However, this traditional agricultural landscape is declining rapidly because it is usually located in hilly or mountainous areas that are strongly affected by the factors that lead to agricultural abandonment, such as unfavourable environmental conditions (e.g., remote and isolated areas, higher elevations, steeper slopes, poorer soils, and poorly ameliorated agricultural fields), farms with smaller areas, and land owned by part-time farmers and older landowners [14]. Although the abandonment of traditional agricultural land may have positive effects on ecosystem services, such as an increase in carbon storage due to forest regrowth, it also has significant negative effects, such as soil erosion, a reduction in biodiversity, water provisioning, landscape heterogeneity, and cultural and aesthetic amenity [15,16].
The economic model developed by von Thünen [17] can be used to predict spatial patterns of land use and its abandonment. This model is based on the assumption that land is allocated to the activity that provides the maximum net value (‘rent’ in economic terms), which, in turn, is the largest gain from the land minus the costs incurred to obtain that gain [18,19]. Figure 1a shows bid–rent curves and land use derived from the von Thünen model, illustrated by [19]. The upper part of the figure shows the equilibrium bid–rent curves; i.e., the rent that farmers would be willing to pay at any given distance from the isolated town, for three crops. The solid line, the envelope of the rent curves, defines the rent gradient. Along each of the three segments of these lines, growers of one of the crops are willing to pay more for land than the others. Therefore, concentric circles of cultivation develop, with the bottom half of the figure showing a quarter section of the layout [19]. Similarly, the model can be applied to a Japanese mountain village with traditional mulching agriculture in the past (before ca. 1950) (Figure 1b). The landscape consists of several land use types providing products of different value and laid out in concentric circles as follows: a central residential area surrounded by cultivated areas such as rice fields and cropland for vegetables and millet, followed by seminatural grassland that provides wild plants for fodder, roofing, and mulching materials, and this is enclosed by managed woodland that provides firewood and charcoal (Figure 1b) [8].
The model can also predict spatial patterns of land abandonment (e.g., [20]), and furthermore, can also predict the differences in land abandonment patterns between a village that uses conventional agriculture relying on chemical fertiliser (Figure 1c) and a village that uses traditional agriculture based on wild-plant-derived organic fertiliser (Figure 1d). In both figures (Figure 1c,d), the rent in the residential centre (i.e., intercept) has been arbitrarily reduced to two-thirds of the original value, because the economic value of agricultural and wood products has been declined. On the other hand, the relationship between rent and distance from the village (i.e., slope) was assumed to remain unchanged, because transportation costs did not change significantly over time in the mountain village on steep slopes with negligible road density. As a result, in both types of village, cropland still surrounds the residential area because of its relatively high value, and the woodland on the outermost fringe, previously used to produce firewood, has been converted to tree plantations and now has the second highest economic value following the shift from wood to oil as fuel.
In a village using conventional agriculture, all of the grassland will have been converted to tree plantations because the wild plants produced from the grassland are no longer needed (Figure 1c). By contrast, grassland will be maintained in a village using traditional agriculture (Figure 1d). Figure 1e, which shows an enlarged image of the lower half of Figure 1d, specifically indicates that the grasslands will either be maintained as grassland (zone 3) or converted into tree plantations (zone 4). Surprisingly, new grassland will be rather established on the abandoned cropland just outside the current cropland (zone 2 in Figure 1d,e). This new grassland is created because the products from the grassland (i.e., wild plants) are essential for the traditional mulching practises.
Seminatural grassland is one of the essential components of a traditional agricultural landscape in the temperate zone, and is an ecosystem rich in biodiversity with a high conservation value [21,22]. However, in line with the global trend of agricultural abandonment, grassland has also declined rapidly. Grassland declined by 47% between 1960 and 2013 in England [23], and by 21% between 2002 and 2019 on the Iberian Peninsula [24]. Grassland covered 14% of Japan’s total land area at the beginning of the 20th century, but had decreased to 1% by 2010 [25,26]. The decline in economic value (and therefore the area) of grassland in Japan can be attributed to societal, economic, and technological changes that began between the 1950s and 1970s, such as the change from wild-plant-based organic fertilisers to chemical fertilisers as agricultural inputs, a shift from draft animals to oil-fuelled machinery for both farming and transportation, and a decrease in thatched-roof houses [26]. Although many studies have reported the spatiotemporal patterns associated with the abandonment of seminatural grassland (e.g., [24,27]), no study has reported the model-predicted spatiotemporal pattern of the new establishment of grassland, even during the ongoing process of agricultural abandonment. The temporal continuity of grasslands increases plant diversity and can be an indicator of grasslands with a high conservation priority [21]. This indicates that recently established “young” grassland (zone 2 in Figure 1d,e) and long-standing “old” grassland (zone 3) may have relatively lower and higher conservation priorities, respectively. Understanding not only the total area of grassland, but also the relative area and spatial patterns of young and old grasslands is important for land use planning and identification of grasslands with a high conservation priority, but this has rarely been examined.
Studying past land use allows us to understand the direction of change, dynamics and sustainability of landscape, providing practical and useful information to aid today’s conservation planning [28]. In traditional Japanese agricultural landscapes in mountainous areas, land use type usually varies at a small parcel scale (often less than 100 m2). To our knowledge, no study has examined past land use at a parcel scale for a long term (more than around 50 years), because land use change studies usually used the historical land use maps and aerial photographs with spatial scales coarser than the parcel scale [28,29,30,31]. Interviews with elderly farmers can be one effective way to overcome this gap in spatial resolution. Many studies on long-term vegetational succession have used the interview for confirming the past land use in a few specific locations. However, it rarely used for elucidating the long-term land use change in each of the parcels at settlement to village scales.
The aims of this study are to elucidate whether abandonment patterns of different valued land in mountainous agricultural landscape follows the prediction based on the Thünen model, and determine which factors were effective in regulating changes in the landscape structure. Land use change of the village of Kosuge, central Japan, at parcel scale over the period 1940–2019 were determined by GIS analysis of past land use data obtained from interviews with farmers and other residents of the village. Given the rapid and extensive decline of mountainous agricultural lands in Japan as well as across the world [32], studying past land use in Kosuge, a typical mountainous village with traditional agriculture, can provide the useful knowledge about future direction of change and planning of the landscape. We hypothesised as follows. (1) The area of cropland and grassland decreased, whereas that of tree plantations and abandoned secondary forest increased during the study period. (2) Such agricultural abandonment occurs mainly in areas with unfavourable environmental conditions (e.g., steeper slopes, further from residential areas, or cooler north-facing slopes), smaller farms, and land owned by older farmers. (3) New grassland develops just outside the current cropland, even under the ongoing process of such agricultural abandonment. By exploring the hypotheses, we elucidate the model predictability in agricultural abandonment at typical mountainous areas and put forward countermeasures and management strategies, providing a reference for the research ideas of cropland and grassland abandonment in similar mountainous areas.

2. Materials and Methods

2.1. Study Sites

2.1.1. The Village of Kosuge

This study was conducted in four settlements within the village of Kosuge, Yamanashi Prefecture, which is about 70 km west of Tokyo, Japan (35°45′ N, 138°56′ E, 660 m above sea level (asl) at village office, Figure 2). The mean annual temperature for the period 1991–2020 was 12.3 °C (range 11.2–13.2 °C, n = 30) at the nearest meteorological station (~10 km from the village: Ogouchi station, 530 m asl). Over the same period, the mean monthly temperatures in January (the coldest month) and July or August (the warmest months) were 1.3 °C (range 0.0–3.2 °C) and 23.8 °C (range 20.9–25.4 °C), respectively. Mean annual precipitation was 1592 mm (range 1121–2478 mm). The region forms part of the Chichibu tectonic belts in which most of the rocks are derived from Jurassic to Cretaceous accretionary deposits [33]. Kosuge is an isolated, rural mountain village of 5265 ha in area, of which 95% is covered by forest, mainly secondary forest and coniferous plantations. The secondary forests are dominated by Pinus densiflora forest and oak (Quercus serrata subsp. serrata var. serrata and Q. crispula var. crispula) coppice forest, and they have been managed by periodic tree cutting and are used for firewood and charcoal. The revolutionary change to the widespread use of propane gas drastically decreased the use of firewood and charcoal (Figure S1), leading to abandonment of the Pinus and oak coppice forests in the early 1970s. The natural vegetation types in these mountainous areas are Fagus crenata and F. japonica, which dominate the slopes, Fraxinus spaethiana and Pterocarya rhoifolia, which dominate the valleys, and Tsuga densiflora, which dominates the ridges, but such natural forests cover only a limited area [34].
Kosuge is situated in steep mountainous terrain, where the small areas of flat or gently sloping land are used mainly for housing (Figure 3a). As the croplands in Kosuge are too steep for terracing, the cropland is set directly on the steep slopes without terracing (Figure 3b, Figure S1 and S2). Farmers have cultivated vegetables, millet, and ‘Konjac’ (a type of yam: Amorphophallus konjac) on this steeply sloping cropland and often practise shifting cultivation [35,36,37]. Konjac, which is native to subtropical Asia, is cultivated mainly on warm south-facing slope in the village [36] (Figure S2c). Traditional agriculture in Kosuge relies on mulching with cut wild plants such as small shrubs, silvergrass (Miscanthus sinensis, Poaceae), and other herbaceous species, which contribute to soil formation, help to prevent weeds, soil erosion, and frost damage, and provide organic fertiliser [35,36]. In the seminatural grassland near the cropland, farmers mow grassland, leave it in ca. 3 m high mounds to dry (locally called ‘Kapposhi’, or ‘Boushi’ if containing mainly silvergrass) from October to November, and use it as mulch on their cropland from June to September (Figure 3c,d). Such mulching cultivation set directly on the steep slopes can be found in other mountainous areas in Japan, for example in Nishi-Awa in Tokushima Prefecture, which was registered by the UN Food and Agriculture Organization (FAO) as a Globally Important Agricultural Heritage System (GIAHS) [32].
The residential areas are located at about 600–760 m asl and are surrounded by steep mountains. There were 2244 residents with 376 households in 1955, but the population had diminished to 726 residents with 337 households by 2015, indicating a decline in the number of residents per household from 6.0 to 2.2 between the two periods (Figure S3a). The proportion of people aged 65 and over increased rapidly from 4.9% to 45.2% during the same period. The total area of cropland (mostly for vegetables, konjac, and ‘Wasabi’ (Eutrema japonicum; Figure S2e), paddy fields, orchards, and mulberry (a primary food of silkworms)) decreased rapidly from 117 to 4 ha between 1965 and 2015 (Figure S3b). In contrast, the area of fast-growing Japanese cedar and cypress plantations (Cryptomeria japonica and Chamaecyparis obtusa, respectively) increased from the 1950s to the 1970s (Figure S3c), following a reforestation programme promoted by the Japanese government after World War II to rebuild the country’s wood stocks. There are no statistical data on area change in seminatural grassland.
Various policies for rural development have been implemented in Kosuge, including subsidies for agriculture and forestry, infrastructure development, and the attraction of public facilities and private companies over the study period. Specifically, two unique initiatives, a roadside station (‘Michinoeki’) and rural revitalisation volunteers (‘Chiiki okoshi kyōryokutai’), which have widely been acknowledged as important models for rural revitalisation, have been implemented since 2015 and 2011, respectively. Michinoeki, a government-designated roadside station in rural areas that began in Japan in the mid-1990s, sells local foods and crafts, promotes local tourism, and provides a resting place for drivers [38]. The village office is also set up beside the michinoeki, both a hot spring and a Forest Adventure, a profitable adventure park where visitors walk between standing trees in the forests using ropes, boards, and ladders [39]. Chiiki okoshi kyōryokutai, launched by the government in 2009, targets urbanites in their 20s to 40s and financially supports them in working with the local government for 1–3 years to revitalise rural areas and create a niche livelihood [40]. Similarly, diverse policies on rural development have globally been implemented by a variety of stakeholders, for example, community-level rural revitalisation through arts and cultural development [41] and various financial supports for agricultural programmes by the EU [42].
Accordingly, Kosuge is an isolated, rural village located on a steep slope, where traditional agriculture incorporating a wild-plant mulching system has long been practiced [35,36,43]. The village is composed of eight small settlements with the different rates of depopulation (see below). The typical land use pattern of concentric circles changing from a residential centre to cropland, then seminatural grassland, and woodland in the outermost ring can be seen in aerial photographs taken in 1948 (Shimojima et al. unpublished). Despite conventional agriculture having been applied to most agricultural land in Japan, traditional agriculture using the wild-plant mulching system has continued until the present day in all the settlements of Kosuge. This unique setting (i.e., several isolated settlements, carrying out the traditional agriculture, with varying demographic characteristics) enables us to examine the predictability of the Thünen model on land abandonment, and the relationship between the rate of agricultural abandonment and its causative factors in mountainous traditional agricultural landscape.

2.1.2. Four Blocks Studied

We studied four of the eight settlements that comprise the village of Kosuge; i.e., Nagasaku (NG), Hashidate (HS), Shirasawa (SR), and Nakagumi (NK) (Figure 2c). The demographic characteristics differ among the four settlements. NG has showed the rapid depopulation, while NK has showed the unchanged population, rather increased number of households over the period 1950–2020 (Figure S3d). As of 2020, there were 17–61 households and 44–125 residents in each settlement (Table 1). The average age was the highest in NG (61 years old) while the lowest in NK (47 years old) in 2020 (Table 1). The demographic characteristics of HS and SR are intermediate between those of NG and NK.
Each settlement consists of several smaller blocks, and we studied the blocks called Kurahone in NG, Kamiwarima in HS, Shirasawa in SR, and Mafujikubo in NK. Hereafter, we consistently use the names of the four study sites as follows: NG, HS, SR, and NK. Land area of the four blocks ranges between 2.1 and 3.4 ha (Table 1). All four blocks are located adjacent to the residential area. Each block is divided into many parcels of land (90–252 parcels per block, with 710 parcels in total; Table 1, Figure 4 and Figure 5). A parcel is the minimum unit of land use. The mean size of a parcel ranges from 142 to 382 m2 among the four blocks. Several parcels have been owned and inherited by a household. For example, in NG, 90 parcels have been owned by 25 households (Table 1).

2.2. Interviews

We carried out a series of semi-structured interviews with landowners to obtain information regarding land use changes in the four blocks at the parcel scale over five periods (i.e., 1940–1959, 1960–1979, 1980–1999, 2000–2009, and 2010–2019). For simplicity, hereafter, we will refer to these five periods as the 1940–1950s, the 1960–1970s, the 1980–1990s, the 2000s, and the 2010s. Although we divided the study period unevenly (i.e., 20 year spans for the 1940–1950s, 1960–1970s, and 1980–1990s, but then 10 year spans for the 2000s and 2010s), the effect of these uneven time periods (i.e., using these five time spans rather than four periods of the same length) was minimised by using the rate of change in the cropland areas (% year−1) when analysing different time periods in the same statistical analysis [44].
We conducted these interviews during the off-season for the farmers (i.e., winter) over the periods of November 2010 to January 2011 and November 2019 to March 2020. Interviews lasted between 1 and 4 h each, averaging 2 h for most interviews. Most interviewees were elderly farmers in their 70s and 80s who had been engaged in agriculture for much of their lives. In NG, HS, SR, and NK, the number of interviewees was 9, 9, 9, and 10, respectively, for the first interview and 2, 2, 4, and 3 for the second. We used both a questionnaire and maps of each block showing the parcels. We first asked about the land use type in each parcel that they owned during each of the five periods and then asked for more detailed information. For example, in the case of cropland, information on products, techniques, management, and fertilisation was obtained. We also asked about the land use type of the parcels adjacent to their own parcels to act as a cross-check. The interviewees were interviewed in their homes, but we confirmed the parcel boundaries together in the field when the boundary was unclear. We took photographs of all of the parcels in the four blocks and also obtained old photographs, especially from the 1940–1950s and 1960–1970s (Figure S1). We showed these photographs to the interviewees to increase the accuracy of the data obtained for the older periods.
Based on these interviews, as well as our field observations and the aerial photographs, the land use types for each parcel were separated into the following seven types: cropland, orchard, grassland, woodland, abandoned land, plantations, and village land use. In this classification, ‘cropland’ is agricultural land used to grow vegetables, konjac, wasabi, millet, and rice; ‘orchard’ contained fruit trees, managed mulberry, and bamboo forest; ‘grassland’ is seminatural grassland managed by mowing a few times per year; ‘woodland’ is woodland dominated by oak and managed by periodic tree cutting; ‘abandoned land’ is cropland, orchard, grassland, or woodland abandoned for various time periods; ‘plantations’ are coniferous plantations of Japanese cedar and cypress; and ‘village land use’ is farm roads, farm sheds, and (in a few cases) residential areas.
The four blocks studied were occupied mostly by cropland and seminatural grassland in the 1940–1950s (see Results). Based on the aerial photographs taken in 1948, grassland was also distributed to the more mountainside beyond the four blocks (Shimojima et al. unpublished). This indicates that this study cannot directly demonstrate the model-predicted spatiotemporal pattern of the conversion from grassland to coniferous plantations (zone 4 in Figure 1d,e) or from woodland to coniferous and secondary forest (zones 5 and 6) on an absolute area basis. Instead, this study focused on the pattern of change in the area of cropland and grassland (zones 1, 2, 3, and part of zone 4). It is expected that our approach of interviewing the landowners from these blocks is the best technique that is currently available for quantifying long-term spatiotemporal changes in the extent of cropland and grassland at the parcel scale.

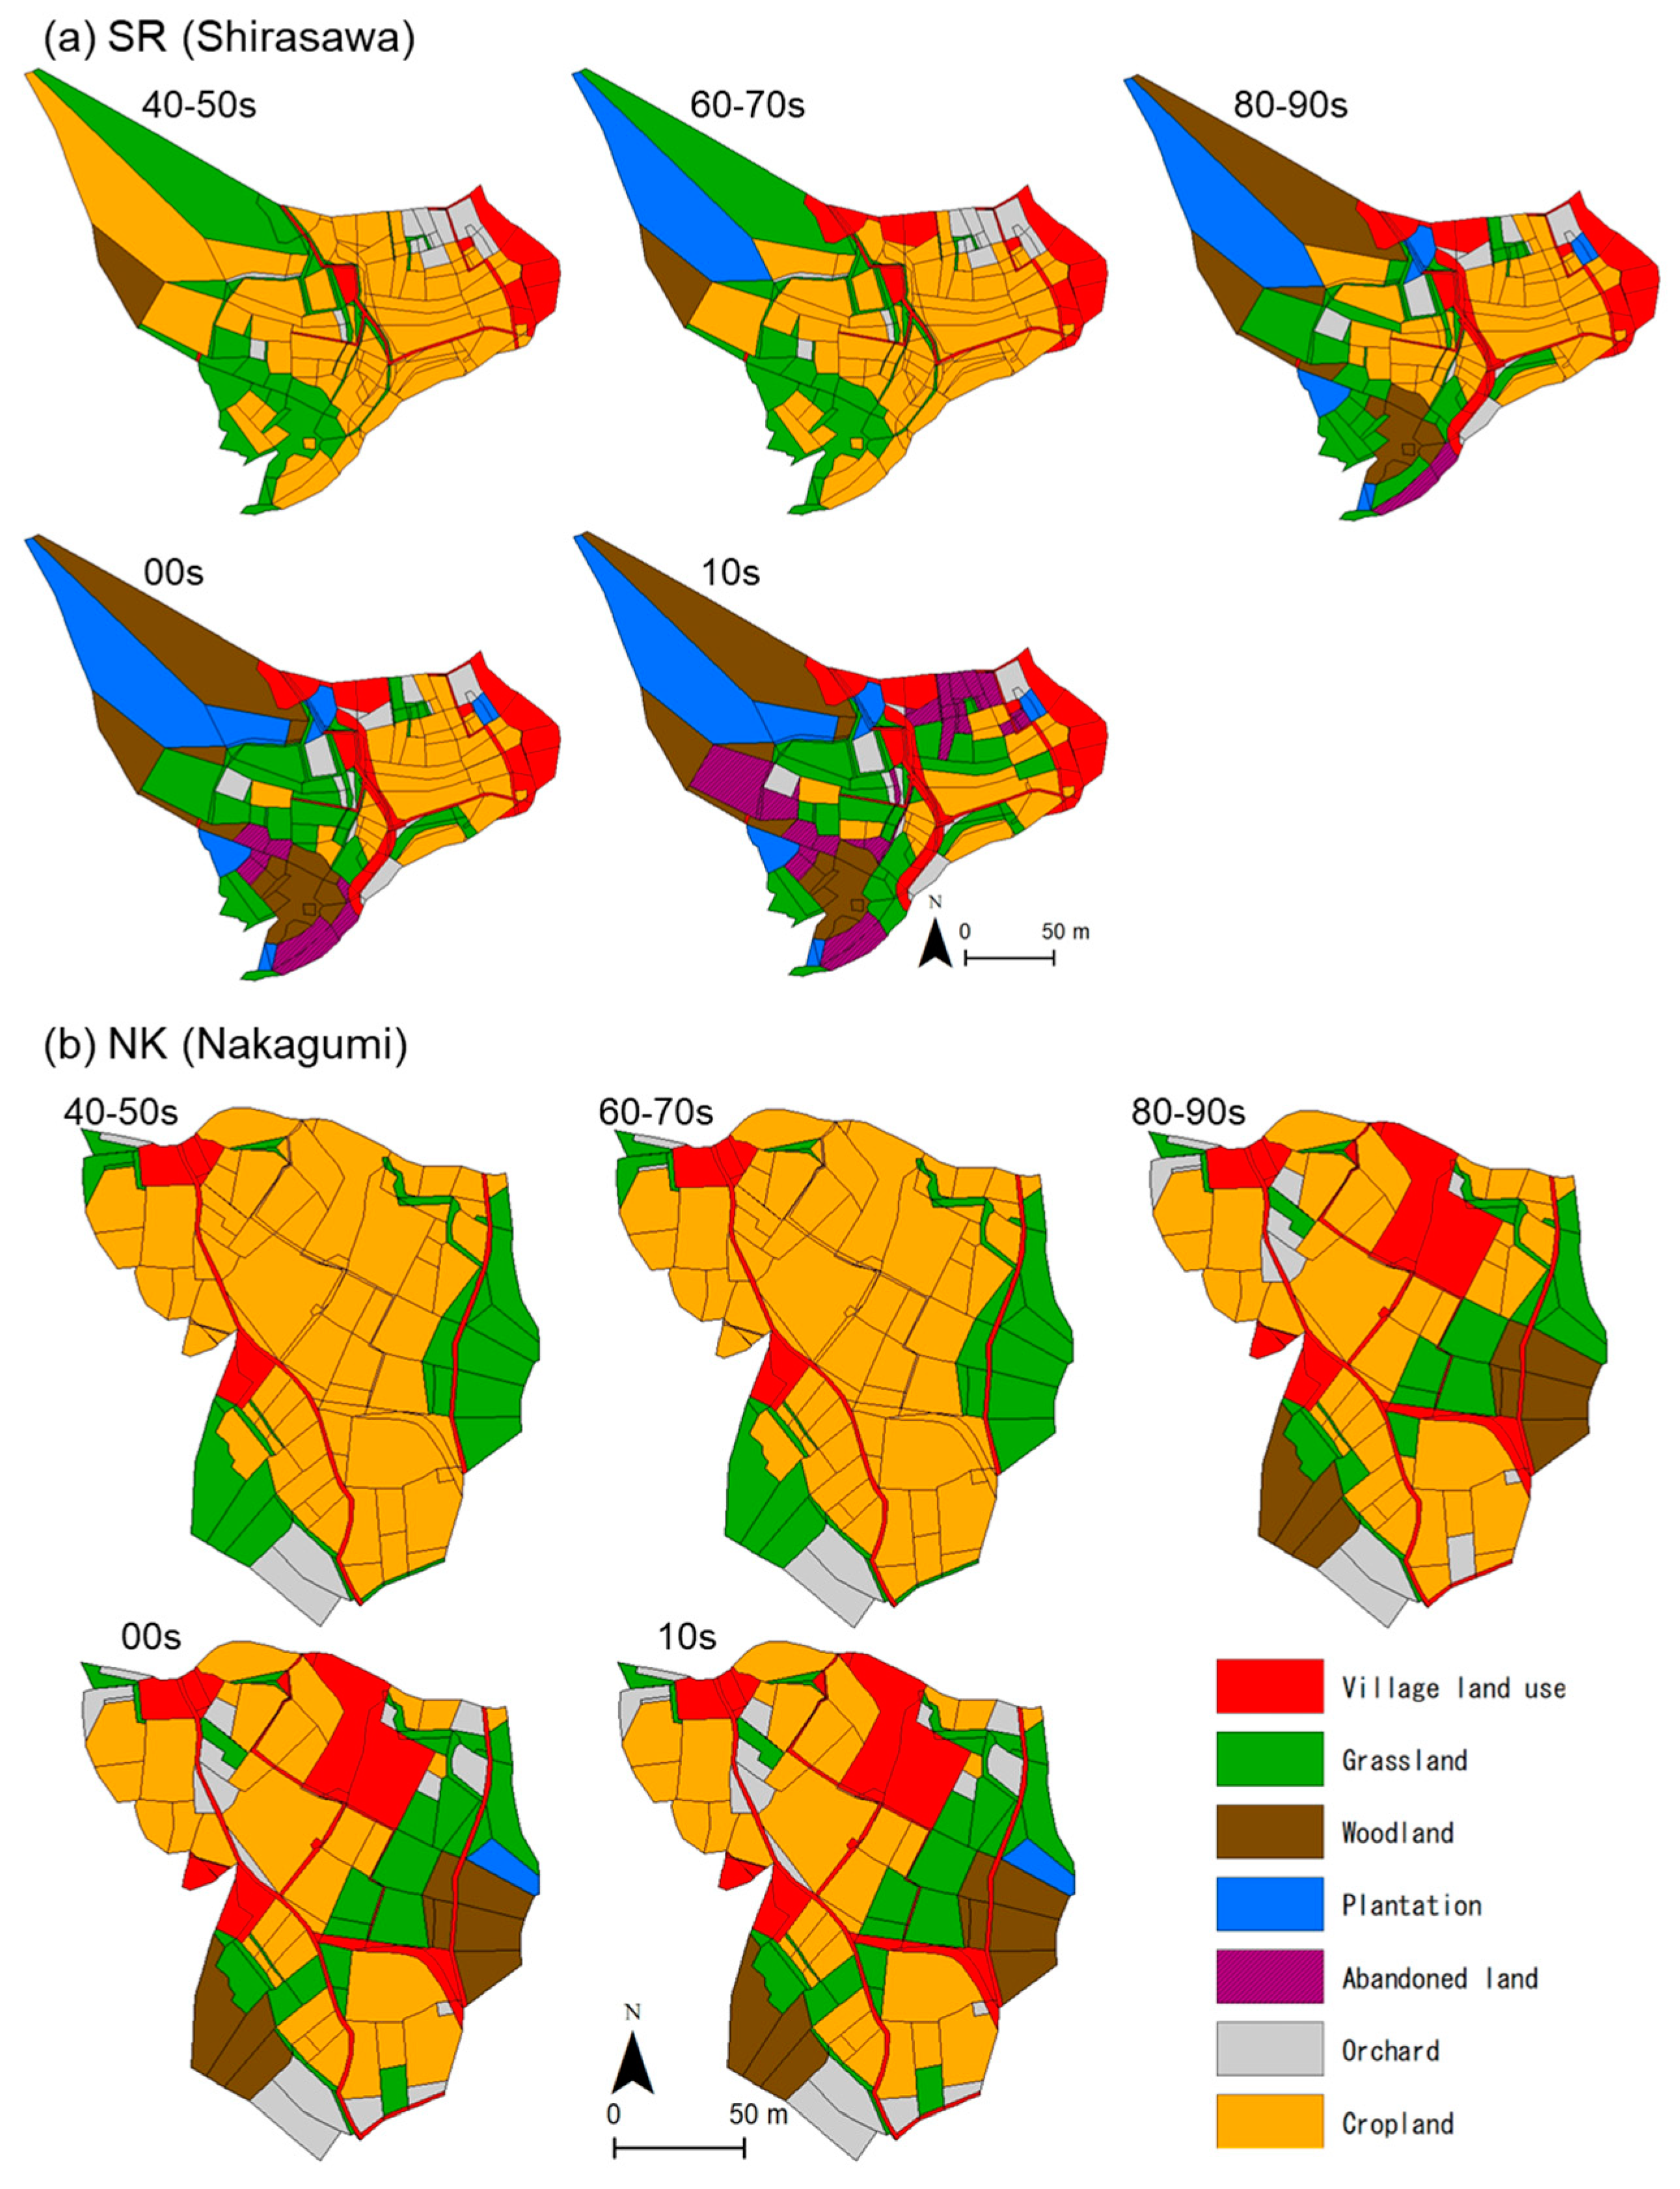
2.3. Land Use Change

To produce the land use maps for our five study periods in the four blocks, we used a cadastral map delimited by parcel and created by the village office using the AutoCAD software (Autodesk, San Francisco, CA, USA). These maps were transferred to the geographical information systems (GIS) software and georeferenced to the universal transverse mercator (UTM) coordinates. We took aerial photographs of the four blocks using a multi-spectrum camera attached to an unmanned aerial vehicle (UAV: Phantom 4, DJI, Shenzhen, China) in October 2019 and used these images as reference maps for georeferencing (Figure S4). The number of photographs, altitude, and ground sampling distance fell within the ranges of 36–173 per block, 54–146 m, and 1.5–3.8 cm per pixel (n = 4), respectively. The geometric correction was achieved with the aid of a set of ground control points, with two points per block at road junctions and land use boundaries in the locality. The estimation error ranged between 24 and 300 cm per 99.8–103.0 m (n = 4). It is expected that the error was negligible for the subsequent analysis because the area covered by the blocks was small, and the aim of this study was to demonstrate the change in the area of each land use type in each block, but not to directly compare the rate of area change between blocks.
The parcel boundaries were traced on the maps of five time periods, preparing vector data. Based on the interview data, data related to the land use type, landowner name, and parcel number were assigned to each polygon (i.e., parcel) as attribute information.

2.4. Causative Factors of Land Use Change

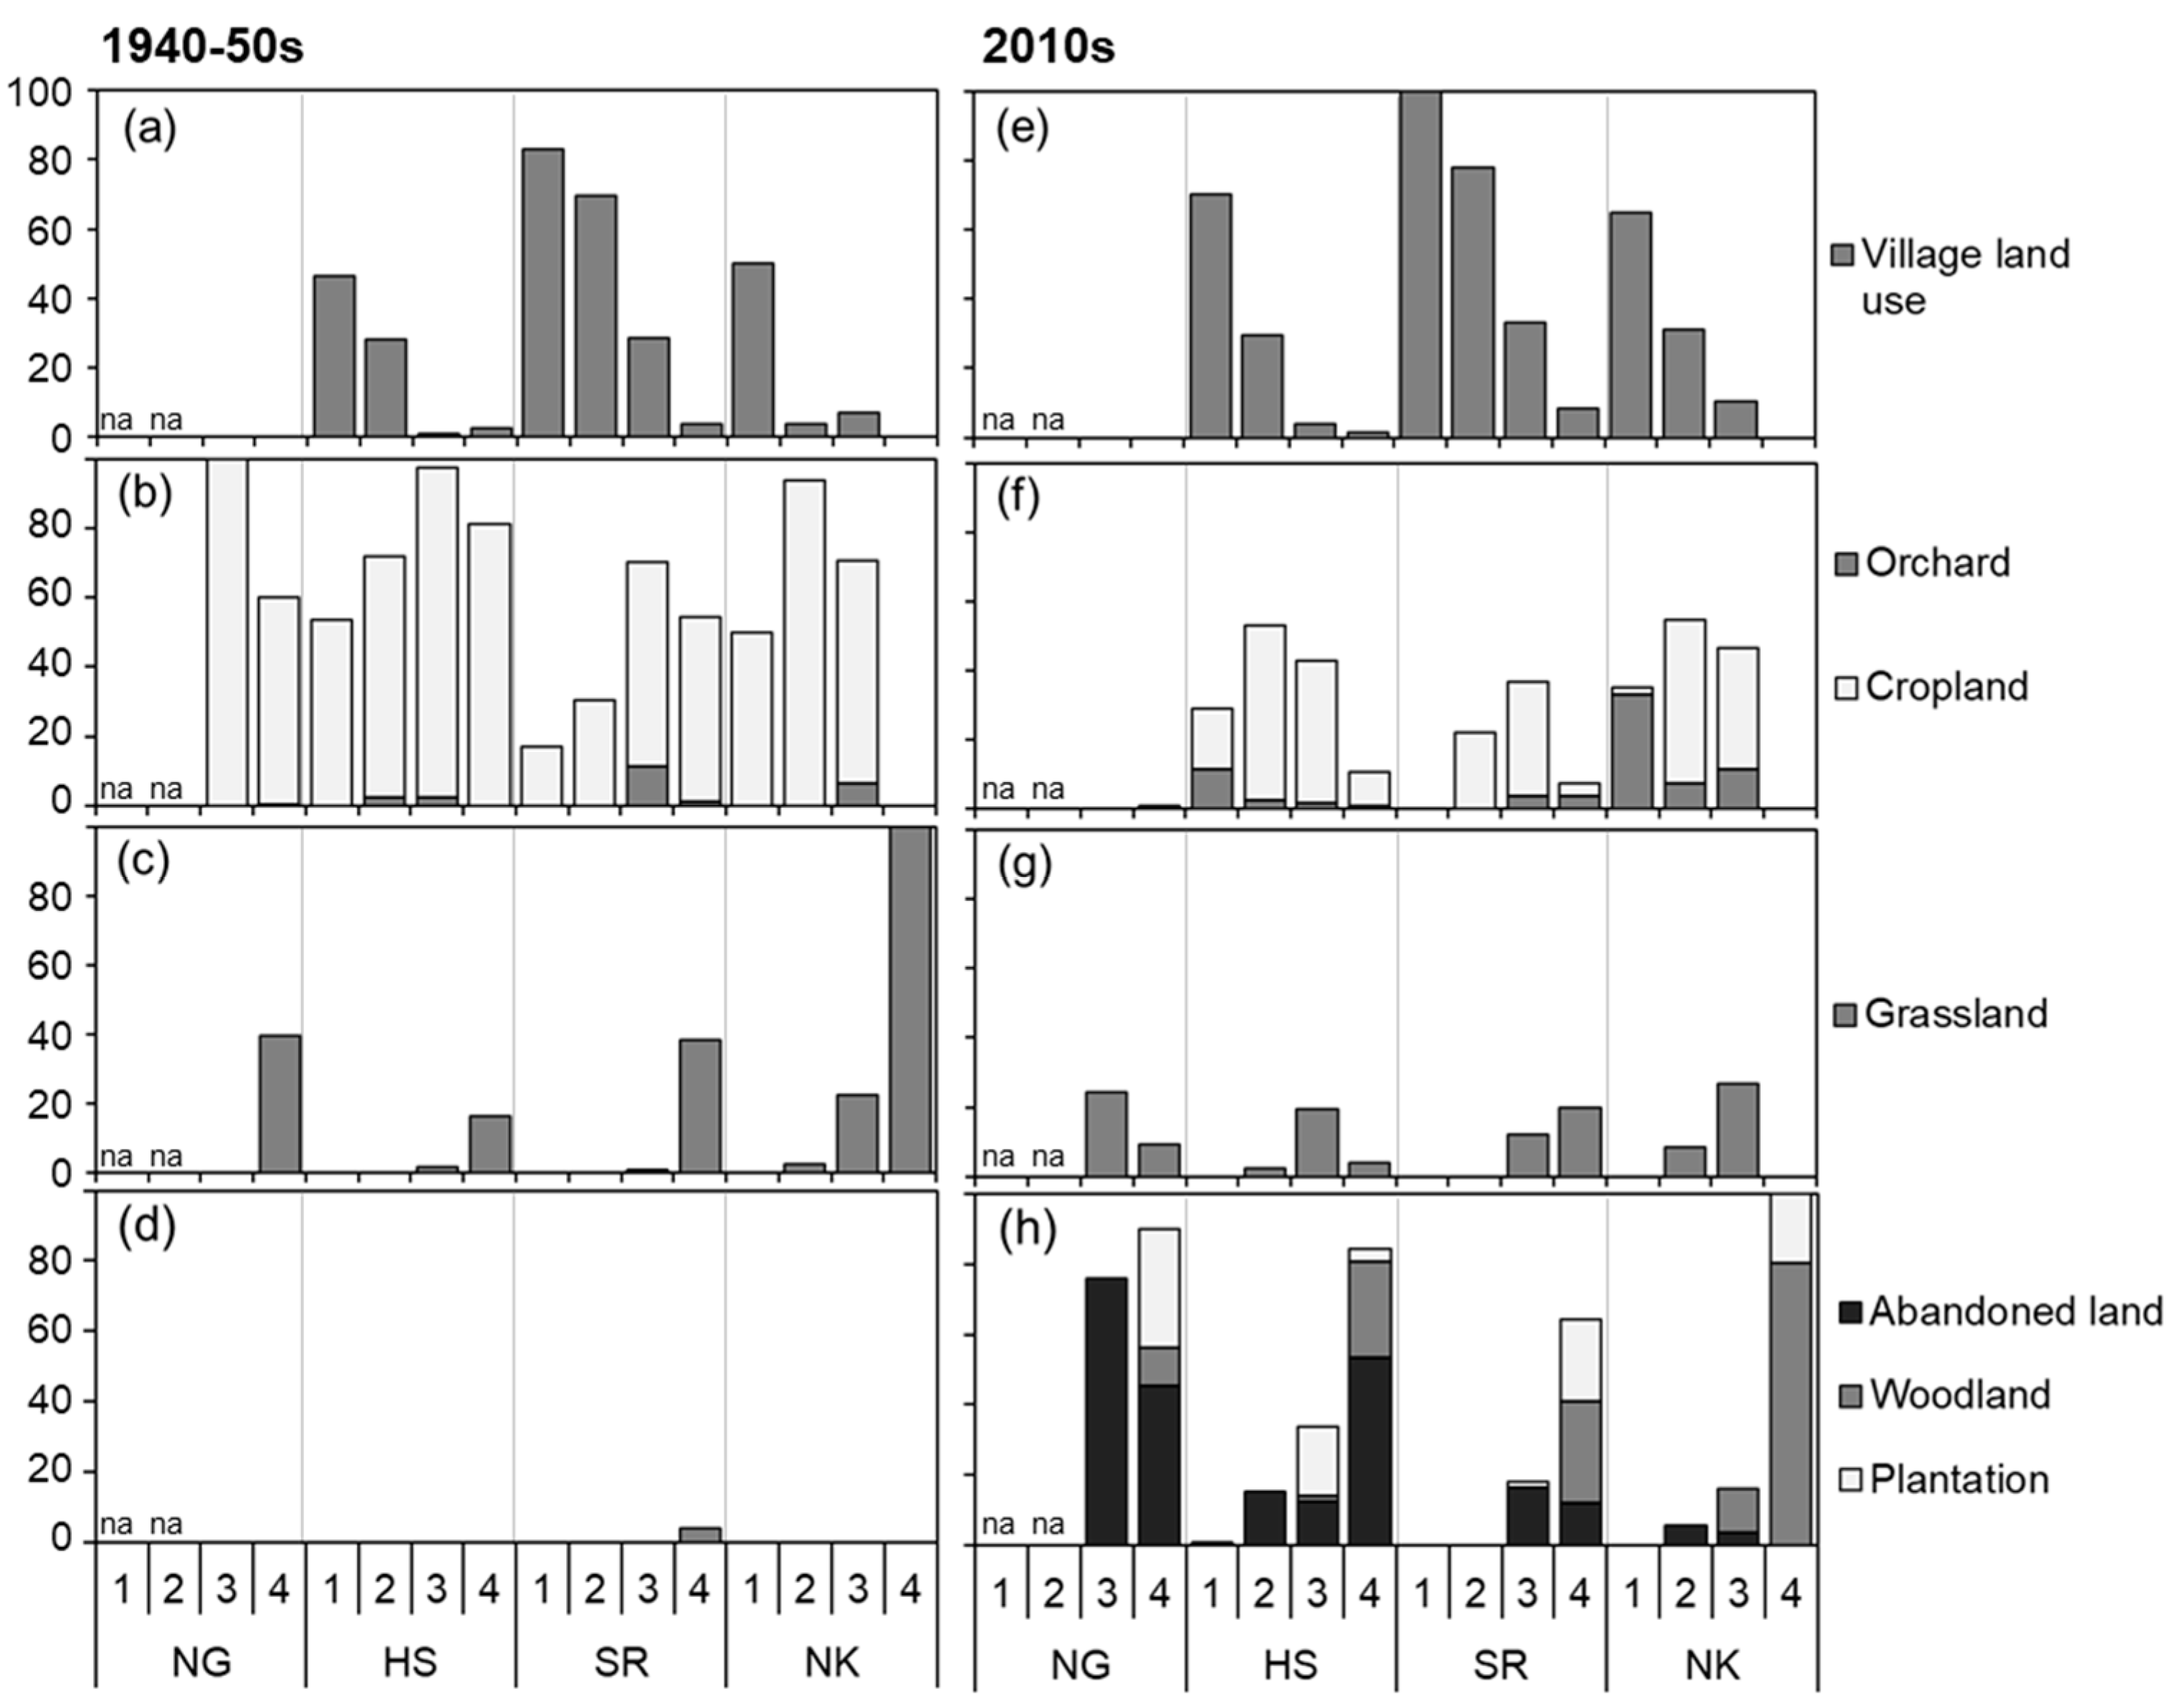
2.4.1. Accessibility

We examined the effects of slope angle, slope aspect, and distance from the nearest entry points to each parcel on land use change. The values of slope angle and aspect were calculated for each grid from the 5-m digital elevation map of the basic map information by the Geospatial Information Authority of Japan (Figure S4). The farmers entered the blocks via several entry points near the residential area and walked to their cropland (Figure S2f). To calculate the distance from the nearest entry points to each parcel, we determined such entry points based on the interviews, calculated the centre of each parcel, and calculated the minimum distance between the entry points and the centre of each parcel.
To examine the effects of accessibility on land use change from the 1940–1950s to the 2010s, we calculated the accessibility index at the parcel scale. Two major characteristics, i.e., slope angle and distance from the nearest entry point to each parcel, were significantly positively correlated with each other (n = 710, r = 0.496, p < 0.0001, from Pearson’s correlation using the cor.test function in R). Therefore, we conducted the principal component analysis (PCA) between the slope angle and distance using the princomp function in the Rcmdr package, and we used PCA 1, which explained 78.4% of the total variation, as an accessibility index. The accessibility index was divided into four equal scores (with 1 being the most accessible and 4 being the least).
We used accessibility as a major explanatory factor for predicting the abandonment pattern of differently “valued” land (Figure 1e). However, a fundamental concept of Thünen’s theory is based on the difference in land rent but not the difference in accessibility. Rent is calculated from yield, production cost, market price, transportation cost of the crop, and distance from the market. We could not obtain data other than accessibility (e.g., yield and production cost of the crop) because of the difficulty of obtaining these data for each parcel. In general, cropland far from the farmer’s residence is less profitable because the labour expense is high due to the longer time spent to travel to the cropland. Therefore, farmers either grow more labour-extensive crops [45], grow more extensively when the same crop is grown [46] or are more likely to abandon cropland in such remote areas. An increase in slope angle may also increase in time spent travelling to the cropland. Therefore, we considered that accessibility is the most important factor in determining a land use type in each parcel at a given time period and used it as a surrogate of land rent. Many previous studies [20,47,48] also used slope angle and distance from the residential area as explanatory variables for the degree of agricultural abandonment.
Furthermore, Thünen’s theory is based strictly on conditional assumptions. The model assumes isolated, flat, uniformly fertile land having no interactions (trade) with the outside and no significant transport infrastructures (e.g., river, major road). In actuality, the four settlements in Kosuge are relatively isolated and have no paved roads within a block except for a very short distance. However, residential areas of the four blocks are connected to each other by a paved road. As mentioned earlier, rural revitalisation policies have been applied over the study period. Such land conditions and policies do not follow the economic model and can potentially cause unexplained variations in the patterns of land use along a land rent. This may be one reason why empirical studies of this economic model have been conducted mainly in developing countries with subsistence agriculture, having a few factors affecting agricultural land use patterns [49]. Therefore, this study is a challenge, but if the predictive land use pattern (Figure 1e) can be found, it enables us to demonstrate the significant contribution of accessibility on shaping the land abandonment patterns even in a complex mountainous environment.

2.4.2. Characteristics of Farmers in NG

Settlement NG experienced the fastest depopulation among the four studied settlements (Figure S3d). Focusing on this settlement, we examined the characteristics of farmers on land abandonment. At the interviews in NG, we obtained additional information regarding the number of farming households, as well as the number and age of active farmers in each farming household from 1959 to 2019. The number of farming households at the end of the 1940–1950s, 1960–1970s, 1980–1990s, 2000s, and 2010s was 14, 14, 7, 3, and 1, respectively. Except for the 2000s and the 2010s, when the number of farming households was extremely low, Pearson’s correlation between cropland area change (% year−1) and land tenure (total land area owned by each household), demographics (the number and average age of farmers), and geological characteristics (accessibility index and percentage with a southerly slope) were examined using the cor.test function in R. We used the R software (version 4.0.5, RStudio, Boston, MA, USA) for all statistical analyses in this study [50].

3. Results

3.1. Geological Characteristics
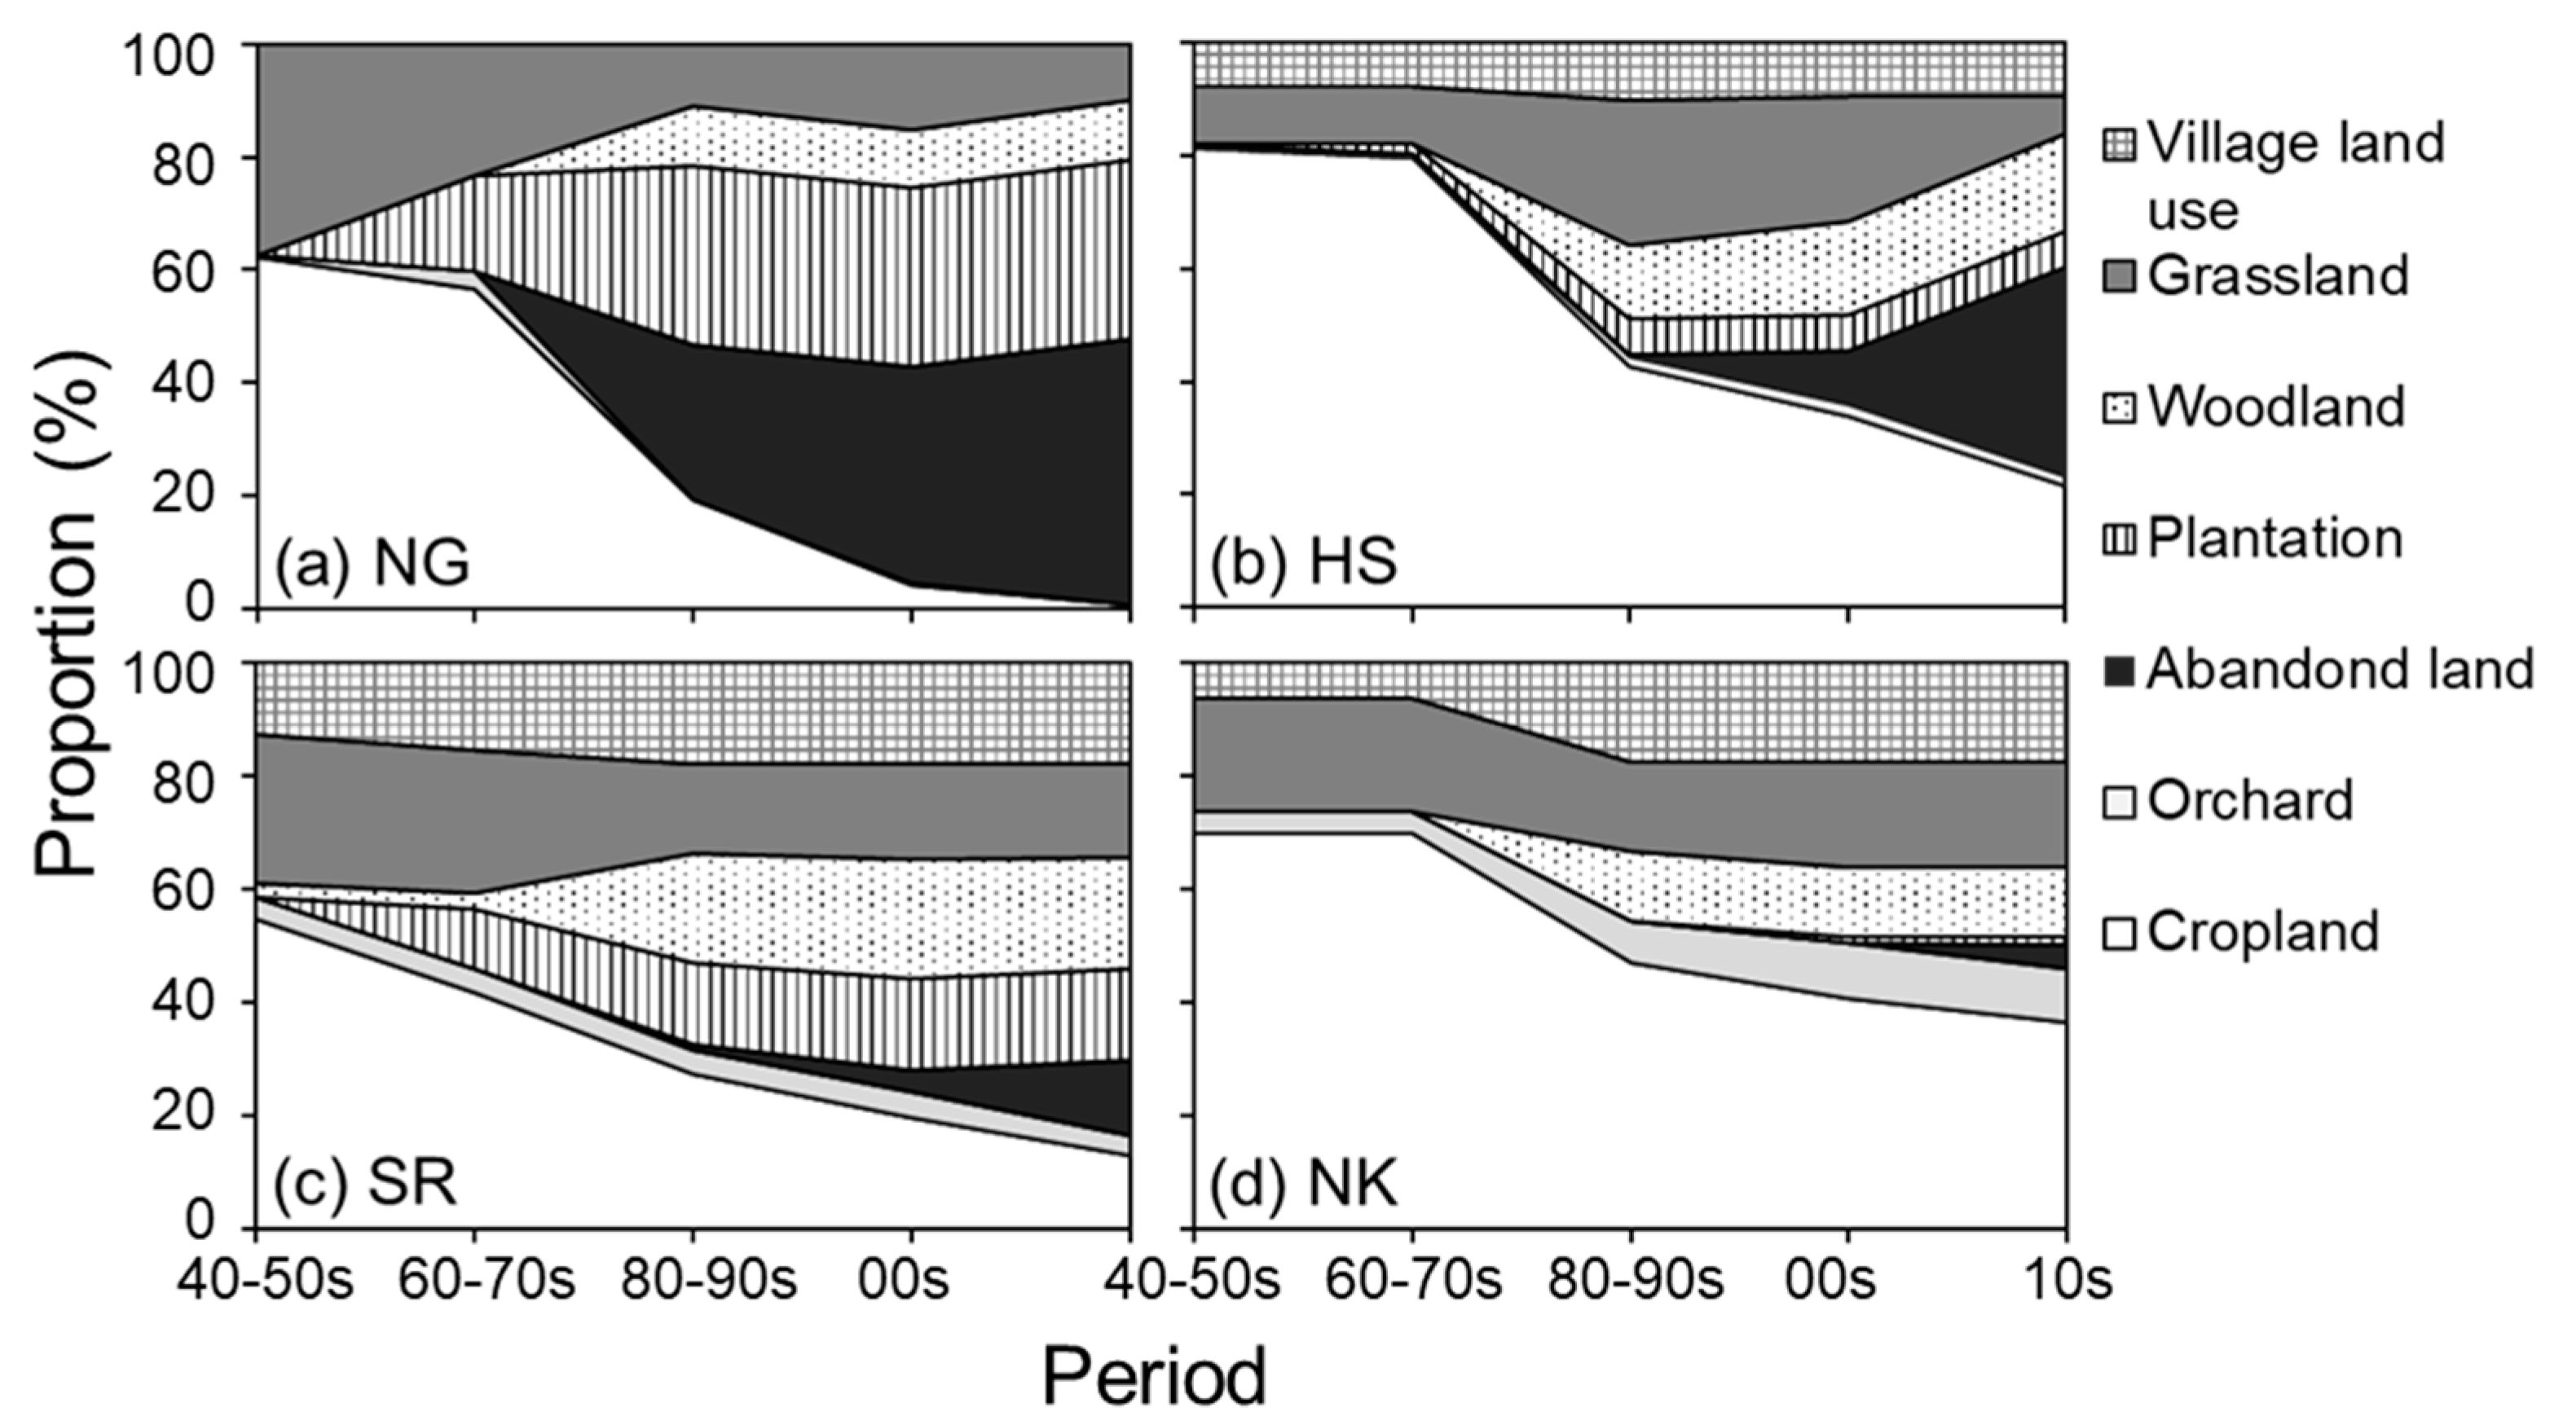
For the four blocks, the dominant slope aspect is either S, SE, or N, and the mean slope angle ranges between 12° and 25° (Table 1). NG is located on the steepest slope (25°) and is furthest from the nearest entry points to each parcel (188 m; Table 1). By contrast, NK is located on a more gentle slope (12°) and is closest to the nearest entry points to each parcel (55 m). The geological characteristics of HS and SR are intermediate between those of NG and NK.

3.2. Area Change

3.2.1. Cropland and Abandoned Land

During the 1940–1950s, cropland accounted for between 55% and 81% (n = 4) of the total land area in each of the four blocks studied, and no blocks had any abandoned land (Figure 4, Figure 5 and Figure 6). Cropland declined sharply from the 1960–1970s to the 1980–1990s and accounted for between 1% and 36% in the 2010s. This indicates that between 48% and 99% (average 76%) of the cropland was abandoned during the study period.
The pattern of decline in the cropland differed among the four blocks. For NG, which had the oldest population (average age = 61.3 years in 2020; see Table 1), greatest depopulation, and least accessible block, the area of cropland decreased rapidly from 62% in the 1940–1950s to only 1% in the 2010s (Figure 4a). Therefore, the amount of abandoned land increased rapidly from the 1980–1990s and accounted for 47% of the total area by the 2010s. In contrast, in NK, with the youngest average age (47.2 years) and the most accessible block, the area of cropland decreased slowly from 70% in the 1940–1950s to 36% in the 2010s, and the amount of abandoned land remained fairly stable (Figure 5b). The patterns of change in the area of cropland and abandoned land in HS and SR were intermediate between those seen in NG and NK (Figure 4b and Figure 5a). HS, the block with the second oldest average age (60.9 years), showed a relatively rapid increase in abandoned land compared with SR.

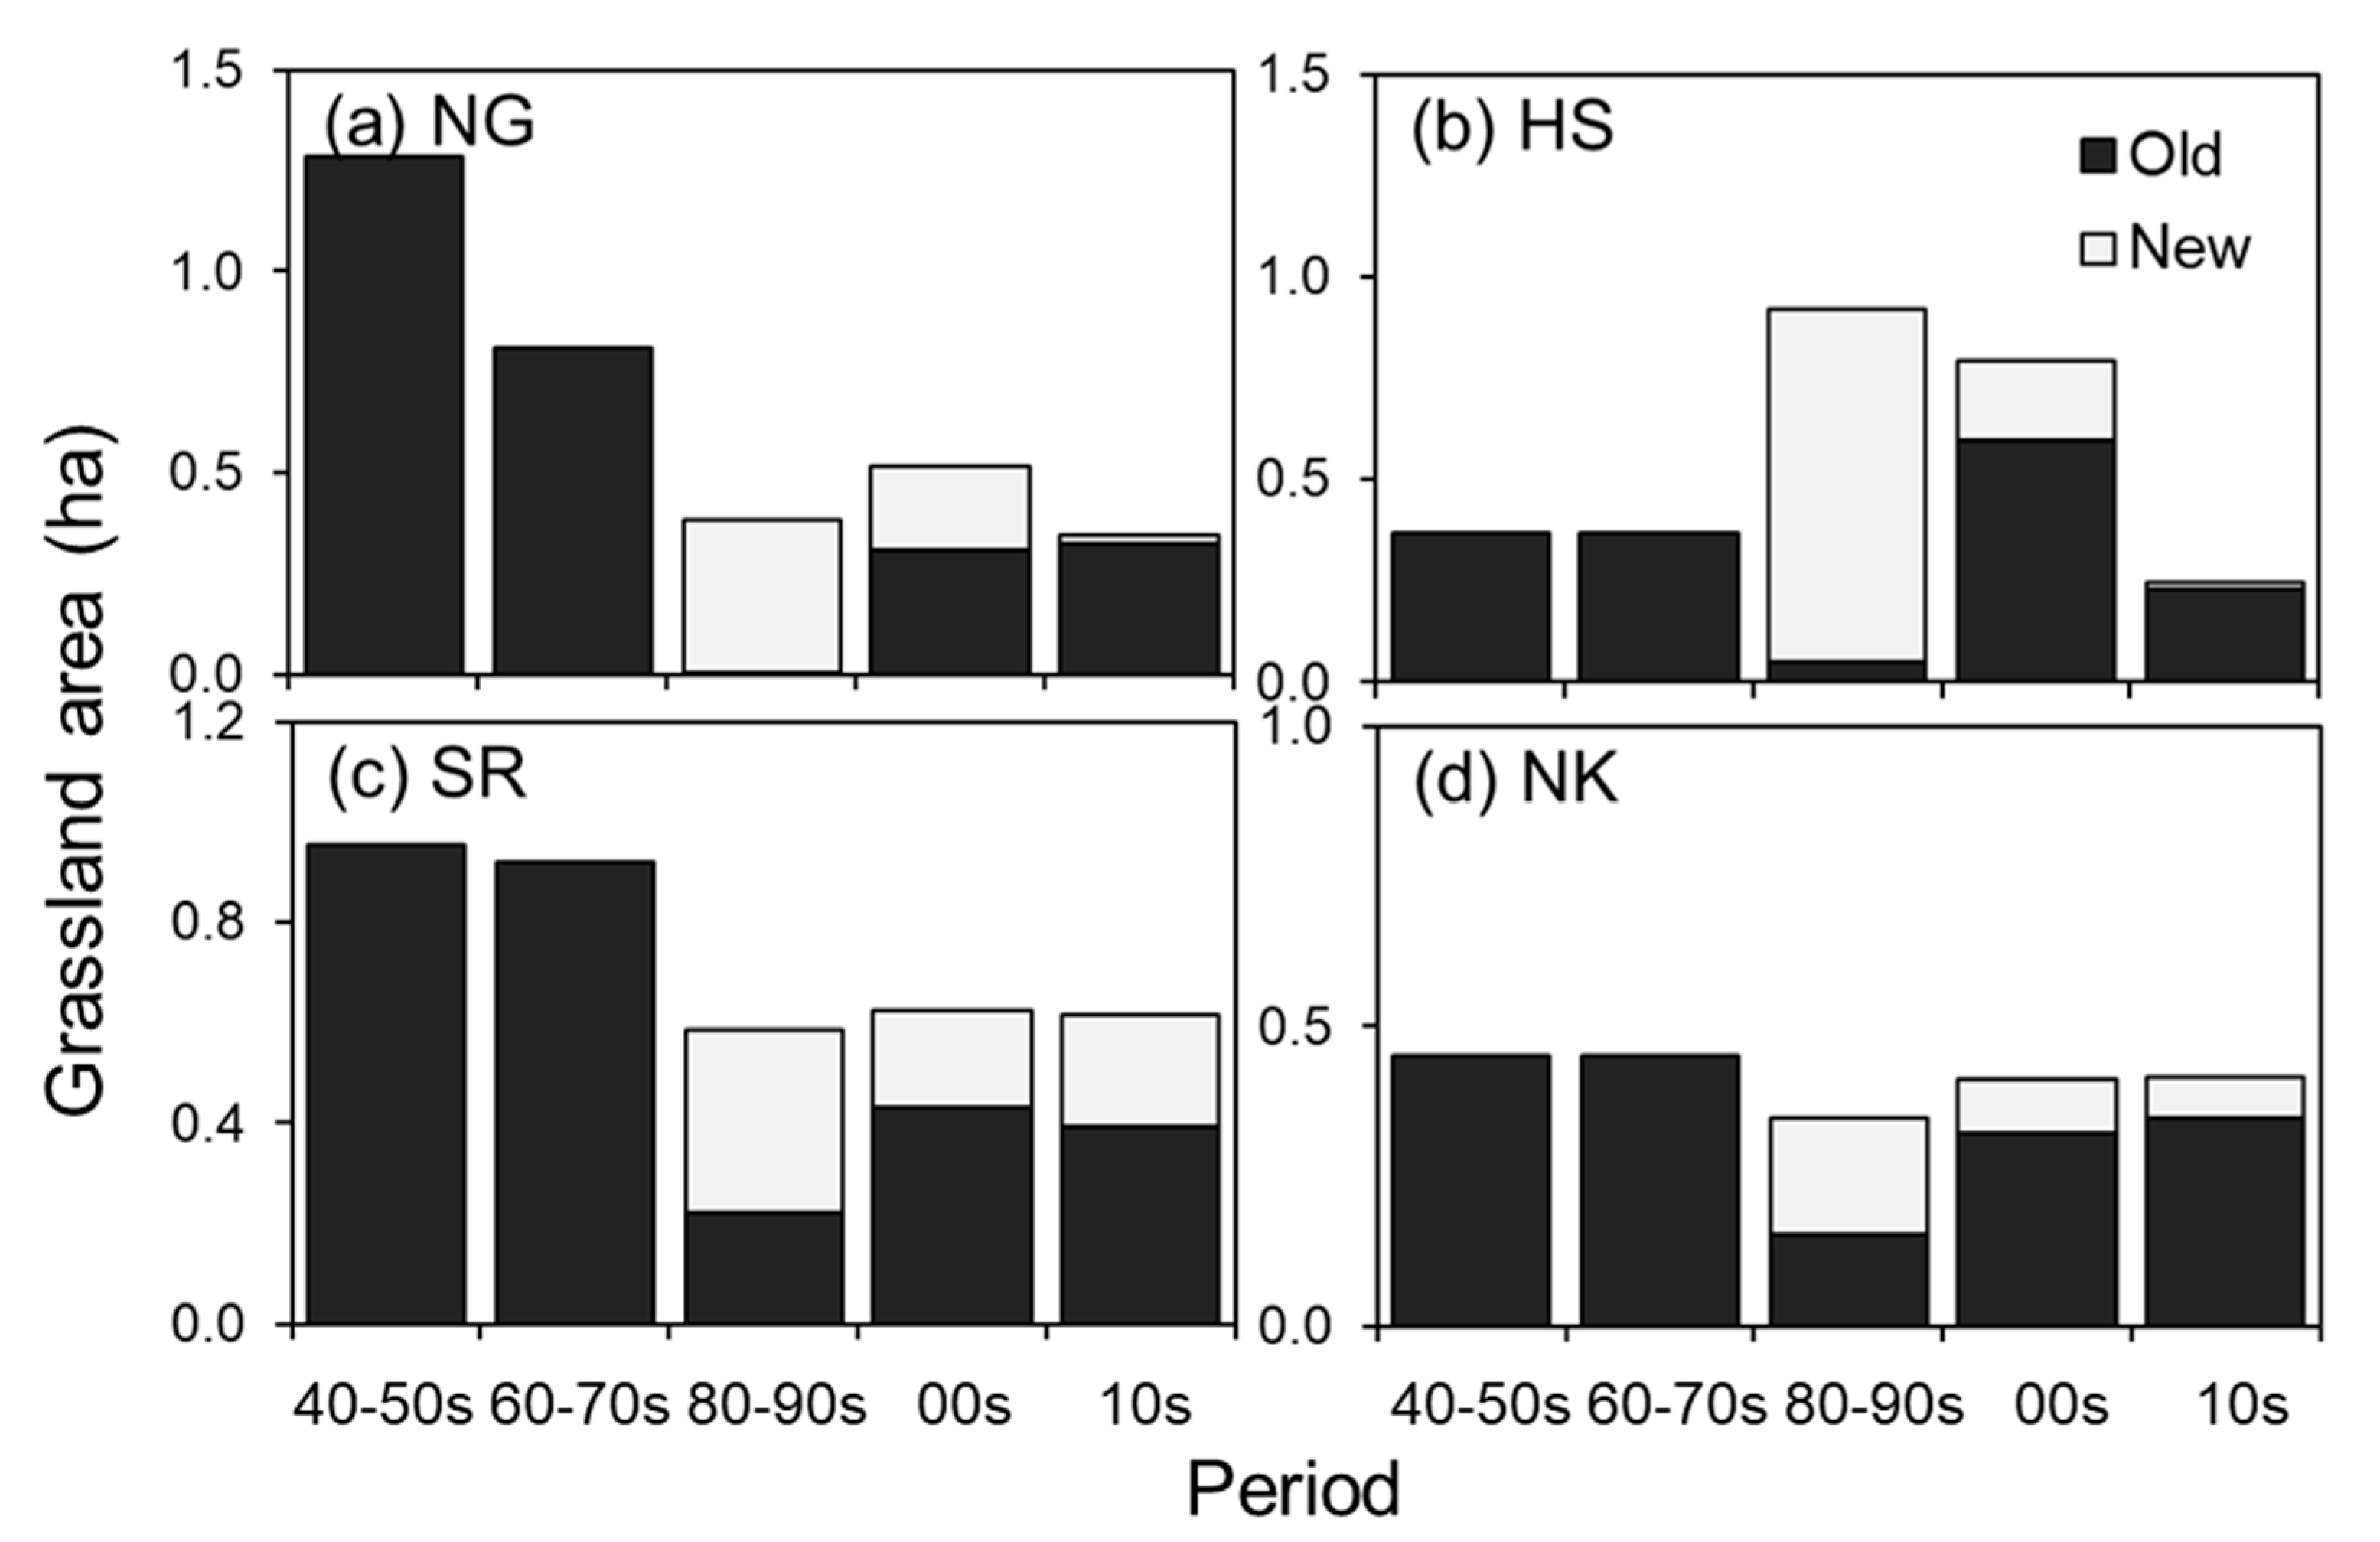
3.2.2. Seminatural Grassland

Grassland accounted for 10–37% of the total land area in each of the four blocks in the 1940–1950s and still accounted for 7–19% in the 2010s (Figure 6). This equates to an 8–73% (average 47%) decline in grassland area during the study period, indicating that grassland did not decrease as rapidly as cropland (76% decline).
There are two types of grassland (Figure 7); the first is grassland that has remained unchanged from the previous study period (‘old’, corresponding to zone 3 in Figure 1e), and the second is the new grassland that has become established through the conversion of cropland (‘new’, corresponding to zone 2). The proportion of old grassland decreased from the 1960–1970s to the 1980–1990s, and at the same time, new grassland began to emerge (Figure 7). The area of such new grassland reached a maximum in the 1980–1990s but then gradually declined to the present day. Although grassland accounted for 7–19% (n = 4) of the total land area in the 2010s, between 70% and 100% of the current grassland was newly established through the conversion of abandoned cropland after the 1980–1990s.

3.2.3. Other Land Use Types

The area occupied by woodland increased from the 1980–1990s onwards and accounted for between 10% and 19% of the total land area by the 2010s (Figure 6). The area of plantations also increased from the 1960–1970s, except in NK. While village land use was not appeared in NG irrespective of the time period, the area of village land use in the other three blocks was either unchanged (HS and SR) or increased (NK) over the study period.

3.3. Causative Factors of Land Use Change

3.3.1. Accessibility

During the 1940–1950s, the area of village land use tended to decrease with an increase in the accessibility index (Figure 8a). Cropland covered most of the land area, but the effect of the accessibility index was unclear (Figure 8b). Grassland was mainly distributed in inaccessible areas (Figure 8c). There was almost no woodland, coniferous plantations, or abandoned land during the 1940–1950s (Figure 8d).
In the 2010s, the area of village land use increased in accessible areas (Figure 8e). The area covered by woodland, coniferous plantations, and abandoned land increased significantly, and it increased with the increase in the accessibility index (Figure 8h). The area of cropland decreased significantly, and the decline occurred mainly in inaccessible areas (Figure 8f). Grassland also declined mainly in inaccessible areas (Figure 8g). As a result, a land use pattern of concentric circles changing from a residential centre, then village land use, cropland, and seminatural grassland, to plantations and abandoned land at the outer edge had developed by the 2010s.

3.3.2. Characteristics of Farmers in NG

At the household scale in NG, the number of active farmers per household, total parcel area per household, and accessibility index showed no statistically significant correlation with the change in the area of cropland (% year−1) irrespective of the time period (Table 2). However, the proportion of the area on southerly slopes was significantly correlated with the change in cropland area from the 1960–1970s to the 1980–1990s (r = 0.76, p < 0.001, n = 14; Table 2). This indicates that cropland on south-facing slopes was more likely to be retained, whereas cropland on other slope aspects was more likely to be abandoned.
Contrary to our expectations, the average age of active farmers per household was positively correlated with changes in the cropland area during two time periods (between the 1960–1970s and 1980–1990s, and also between the 1980–1990s and 2000s; r = 0.55 and 0.68, p < 0.05 and < 0.1, n = 14 and 7, respectively; Table 2). This indicates that households with older farmers were less likely to abandon their cropland.

4. Discussion

4.1. Cropland Abandonment and its Causative Factors

The extent of cropland in the study area has declined rapidly over the last 80 years, but the rate of decline varied among the four blocks as a result of the varying geological and demographic characteristics in this mountainous region of central Japan. The area of cropland in Kosuge decreased by 76% during the study period (Figure 6), and this far exceeds the rate of decline in farmland area across the whole of Japan of 28% over the period 1960–2019 [51]. The settlements of NG, with the oldest population, greatest depopulation, and least accessible block, and HS, with the second oldest population, showed the highest and second highest rates, respectively, of cropland abandonment (Figure 6a,b). In contrast, NK, with the youngest population and the most accessible block, showed the lowest rate of cropland abandonment (Figure 6d). The rapid abandonment of cropland in the mountainous areas of Japan has also been reported in previous studies [9,10,52,53,54] and has been attributed to broad, interrelated factors, such as increases in off-farm wages, depopulation and ageing, subsistence farming, and poor natural conditions. An increase in off-farm wages in the cities attracts young villagers to move away from agricultural activities, leading to an absence of young successors and a resultant labour shortage for agriculture. Subsistence farming is dominant in Japan because governments in post-war Japan have nurtured small, part-time farmers, whereas non-farm capitals such as general corporations have been denied access to cropland, unlike in most industrialised countries [55]. Self-sufficient farming households that have few labourers, no young successors, and are located on steep slopes are more likely to abandon their cropland [54]. The negative impacts of such causative factors of cropland abandonment are likely to be amplified by lower accessibility and increasing average age, leading to the varying rates of cropland abandonment seen among the blocks studied here.
The results indicated that, at both the parcel and household scale, geological and demographic characteristics also significantly affect the rate of cropland abandonment. At the parcel scale, cropland and grassland were more likely to be abandoned in inaccessible areas, and regrowth forests and plantations became established in their place (Figure 8). In addition, in accessible areas, village land use has increased, while the area of cropland has been maintained from the 1940–1950s to the 2010s (Figure 8). It has also been reported that accessibility is a major determinant of cropland abandonment over various spatial scales (e.g., [14]), although we note that studies of long-term land use change at the parcel scale remain scarce. As a result of this accessibility-dependent pattern of land abandonment, we found that a concentric land use pattern that changed from the residential centre to village land use, then cropland and seminatural grassland, and to plantations and abandoned land at the edge of the block in the 2010s. These spatiotemporal changes in differently valued land areas are essentially consistent with the von Thünen model-predicted land use pattern (Figure 1d,e). These findings can be used to predict the direction of change in landscape and identify areas that are at high risk of abandonment.
At the household scale, in NG, cropland on slopes that were not south facing was more likely to be abandoned (Table 2). Farmers in Kosuge have selected south-facing slopes, which receive more direct sunlight than north-facing slopes, for agriculture, especially for konjac [36]. Such favourable environmental conditions result in higher land rent (via lower production cost and higher yield of crops, enabling the production of konjac at a high price), leading to less frequency of abandonment. In addition, households with older farmers were less likely to abandon cropland (Table 2). This contrasts with the general trend that households with a young successor are less likely to abandon cropland [54]. This may indicate that elder household heads retain a passion for traditional agriculture even without a successor. However, cropland abandonment will occur quickly as soon as the elder household heads retire. In contrast, the total cropland area owned by each household did not correlate with the rate of cropland abandonment (Table 2). The total cropland area per household may have two contrasting effects on its abandonment, i.e., if farmers own more farmland, they may simply abandon more farmland, or they may abandon less farmland due to a higher dependency on farm income [53]. The lack of a relationship between total cropland area and the abandonment rate in our study may be caused by the balancing of these two contrasting effects.

4.2. Grassland Maintained by Traditional Agriculture

Traditional agriculture that uses a wild-plants-mulching system has continued in Kosuge until the present day. We predicted that new grassland will develop just outside the current cropland even during the ongoing process of agricultural abandonment (zone 2 in Figure 1e) because the products from grassland (i.e., wild plants) are essential for traditional mulching agriculture. As predicted, new grassland was established through the conversion of cropland (Figure 7), while it was concomitantly abandoned in the more inaccessible outermost fringe (Figure 8c,g). This is likely to indicate the ‘advance’ of grassland into the residential centre, corresponding to the prediction shown in Figure 1e. As a result of the gain and loss of grassland, the total area of grassland did not decrease as rapidly as cropland (47% decline from the 1940–1950s to the 2010s; Figure 6). This contrasts with previous studies [8,31] that reported that temperate grassland is declining more rapidly than cropland in agricultural areas based on conventional agriculture. The reasons why farmers in Kosuge continue to practise traditional mulching agriculture with grassland management can be inferred from the following typical response of elderly farmers obtained during the interviews: ‘food crops grown with wild-plant-derived organic fertilisers have better taste and quality than those grown with chemical fertilisers. Although grassland management is hard work, I don’t mind because I have been doing it since I was young’.
We found that there are two types of grassland; one is new, young grassland established after the 1980–1990s, as mentioned above, and the other is old grassland that has remained unchanged since at least 1940. Given that the temporal continuity of grasslands increases plant diversity [21], old grassland may have higher biodiversity than younger grassland. If these old grasslands show high levels of biodiversity, then they are classified as ‘hotspot grasslands’ with a high conservation priority [21]. However, only 0–30% of the present-day grassland is old, and each grassland parcel, including old grassland, is small in area (180 ± 166 m2), with few connections between them. Furthermore, old grassland tends to be located in relatively inaccessible areas (zone 3), in contrast to the younger grassland located just outside the current cropland (zone 2), implying that the old grassland is more labour intensive to manage and, therefore, more likely to be abandoned. To determine whether old grassland is, in fact, hotspot grassland, we are currently working on examining the land use legacy effects on the ecosystem functions of these grasslands by comparing plant and insect diversity, plant functional traits, and soil carbon and other properties between old and young grassland (Imai et al. unpublished). Given that the abandonment of traditional agricultural lands, including grassland, is one of the major causes of biological extinction in Japan [51], our results and fieldwork may provide better direction on where conservation efforts should be concentrated.

5. Conclusions

One effective way to better manage and conserve ecosystem services in traditional agricultural landscapes is to seek more sustainable and effective economic pathways to conserve the landscape. Some economic policies, such as the direct payment for ecosystem services to farmers in hilly and mountainous areas [53] and the promotion of cropland consolidation by strengthening community-based farming and by building farmland banks [54,55], have been proposed and applied in some of Japan’s mountainous regions, often showing their effectiveness in preventing agricultural abandonment. However, preventing depopulation and the ageing of the workforce, which are major underlying driving forces of agricultural abandonment, present significant difficulties [52]. Rural but less-depopulated areas in southern Europe often manage to keep more residents by redirecting their interest to tourism, trade, and other services [56]. Similarly, major tourism facilities in Kosuge (Michinoeki, hot spring, and Forest Adventure, see Methods) are located around the most accessible settlement of NK, and the settlement has shown the youngest population, increased number of households, and the slowest cropland abandonment. An increasing off-farm income and employment based on tourism often promote cropland abandonment [56]. However, our case indicates that increased tourism, related industries, and services can promote the consumption, trade, and resultant production of unique agricultural products in rural areas as long as topographically moderate.
Traditional agricultural landscapes based on wild-plants-mulching cultivation are associated with many irreplaceable ecosystem services [32]. We report the unfortunate, rapid decline of cropland and grassland in the landscape around the mountain village of Kosuge and highlight the importance of geological and demographic factors with respect to this abandonment. We also suggest that such abandonment patterns occur in a predictable manner based on an economic theory [19], including the ‘advance’ process of grassland. Knowledge of this unique but predictable abandonment process can contribute to identifying priority areas for conservation and improving land use management in the frontiers of land abandonment.

Supplementary Materials

The following supporting information can be downloaded at: https://www.mdpi.com/article/10.3390/su15107742/s1, Figure S1. Historical photographs of the area around Kosuge. Photo credit: Tokyo Waterworks Historical Museum. Figure S2. Views of traditional agricultural landscape in Kosuge, Yamanashi Prefecture, Japan. Photo credits: (a,b,e) S. Ishizaka and (c,d,f) A. Okamoto. Figure S3. Change in demographics and land use in Kosuge, Yamanashi Prefecture, Japan. (References in Text S1.) Figure S4. Maps used for spatial analysis of (a) NG, (b) HS, (c) SR, and (d) NK. Upper panel: slope aspect, mid-high panel: slope angle, mid-low panel: the nearest entrance points from the residential area to the block, and the centre of each parcel. Lower panel: aerial photos taken by UAV. Text S1. References for Figure S3. References [57,58,59,60,61] are cited in the supplementary materials.

Author Contributions

Conceptualisation, N.I. and H.S.; methodology, N.I., A.O. and H.S.; software, H.O. and H.S.; validation, H.O., A.O. and H.S.; formal analysis, N.I. and H.O.; investigation, H.O., A.O., K.Y., T.T. and T.S.; resources, S.I.; data curation, N.I. and H.O.; writing—original draft preparation, N.I., H.O. and H.S.; writing—review and editing, N.I., H.O., A.O., K.Y., T.T., T.S., S.I. and H.S.; visualisation, H.O. and H.S.; supervision, S.I.; project administration, N.I. and H.S.; funding acquisition, N.I. All authors have read and agreed to the published version of the manuscript.

Funding

This research was funded by the Tokyu Foundation, grant number A350, and the Tokyo NODAI Strategic Research Program to N.I.

Institutional Review Board Statement

Not applicable.

Informed Consent Statement

Not applicable.

Data Availability Statement

Not applicable.

Acknowledgments

We sincerely acknowledge the kind cooperation of the residents of Kosuge, especially I. Aoyagi, K. Kinoshita, T. Mochizuki, and F. Morishige. We thank S. Sasazawa, J. Yasuda, and other members of the Laboratory of Forest Ecology at the Tokyo University of Agriculture (TUA) for carrying out the interviews, Y. Nemoto and A. Nishi (TUA) for the GIS analysis, T. Nakagawa (Conext) for collecting the statistical data, R. Machida, S. Miyabayashi, Y. Nakamura, M. Takyu, T. Kato, S. Yamada (TUA), K. Uchida (The University of Tokyo), and R. Kitagawa (Forestry and Forest Products Research Institute) for helpful discussions, T. Bonkohara (NPO tama genryu Kosuge), K. Suzuki (boonboon), T. Sugino and K. Yano (Dandori) for supporting our interviews, and the village office of Kosuge for their generous support throughout the project.

Conflicts of Interest

The authors declare no conflict of interest.

References

  1. Gellrich, M.; Baur, P.; Koch, B.; Zimmermann, N.E. Agricultural Land Abandonment and Natural Forest Re-Growth in the Swiss Mountains: A Spatially Explicit Economic Analysis. Agric. Ecosyst. Environ. 2007, 118, 93–108. [Google Scholar] [CrossRef]
  2. Lieskovský, J.; Bezák, P.; Špulerová, J.; Lieskovský, T.; Koleda, P.; Dobrovodská, M.; Bürgi, M.; Gimmi, U. The Abandonment of Traditional Agricultural Landscape in Slovakia: Analysis of Extent and Driving Forces. J. Rural Stud. 2015, 37, 75–84. [Google Scholar] [CrossRef]
  3. MacDonald, D.; Crabtree, J.R.; Wiesinger, G.; Dax, T.; Stamou, N.; Fleury, P.; Gutierrez Lazpita, J.; Gibon, A. Agricultural Abandonment in Mountain Areas of Europe: Environmental Consequences and Policy Response. J. Environ. Manag. 2000, 59, 47–69. [Google Scholar] [CrossRef]
  4. Yamaguchi, T.; Ngodup, S.; Nose, M.; Takeda, S. Community-Scale Analysis of the Farmland Abandonment Occurrence Process in the Mountain Region of Ladakh, India. J. Land Use Sci. 2016, 11, 401–416. [Google Scholar] [CrossRef]
  5. Fox, J.; Fujita, Y.; Ngidang, D.; Peluso, N.; Potter, L.; Sakuntaladewi, N.; Sturgeon, J.; Thomas, D. Policies, Political-Economy, and Swidden in Southeast Asia. Hum. Ecol. 2009, 37, 305–322. [Google Scholar] [CrossRef]
  6. Thongmanivong, S.; Fujita, Y. Recent Land Use and Livelihood Transitions in Northern Laos. Mt. Res. Dev. 2006, 26, 237–244. [Google Scholar] [CrossRef]
  7. Liang, X.; Li, Y.; Zhou, Y. Study on the Abandonment of Sloping Farmland in Fengjie County, Three Gorges Reservoir Area, a Mountainous Area in China. Land Use Policy 2020, 97, 104760. [Google Scholar] [CrossRef]
  8. Fukamachi, K.; Oku, H.; Nakashizuka, T. The Change of a Satoyama Landscape and Its Causality in Kamiseya, Kyoto Prefecture, Japan between 1970 and 1995. Landsc. Ecol. 2002, 16, 703–717. [Google Scholar] [CrossRef]
  9. Fukamachi, K. Sustainability of Terraced Paddy Fields in Traditional Satoyama Landscapes of Japan. J. Environ. Manag. 2017, 202, 543–549. [Google Scholar] [CrossRef]
  10. Iiyama, N.; Kamada, M.; Nakagoshi, N. Ecological and Social Evaluation of Landscape in a Rural Area with Terraced Paddies in Southwestern Japan. Landsc. Urban Plan. 2005, 70, 301–313. [Google Scholar] [CrossRef]
  11. Kamada, M.; Nakagoshi, N. Influence of Cultural Factors on Landscapes of Mountainous Farm Villages in Western Japan. Landsc. Urban Plan. 1997, 37, 85–90. [Google Scholar] [CrossRef]
  12. Harrop, S.R. Traditional Agricultural Landscapes as Protected Areas in International Law and Policy. Agric. Ecosyst. Environ. 2007, 121, 296–307. [Google Scholar] [CrossRef]
  13. Indrawan, M.; Yabe, M.; Nomura, H.; Harrison, R. Deconstructing Satoyama: The Socio-Ecological Landscape in Japan. Ecol. Eng. 2014, 64, 77–84. [Google Scholar] [CrossRef]
  14. Prishchepov, A.A.; Müller, D.; Dubinin, M.; Baumann, M.; Radeloff, V.C. Determinants of Agricultural Land Abandonment in Post-Soviet European Russia. Land Use Policy 2013, 30, 873–884. [Google Scholar] [CrossRef]
  15. Hashimoto, S.; Nakamura, S.; Saito, O.; Kohsaka, R.; Kamiyama, C.; Tomiyoshi, M.; Kishioka, T. Mapping and Characterizing Ecosystem Services of Social–Ecological Production Landscapes: Case Study of Noto, Japan. Sustain. Sci. 2015, 10, 257–273. [Google Scholar] [CrossRef]
  16. Jiao, Y.; Ding, Y.; Zha, Z.; Okuro, T. Crises of Biodiversity and Ecosystem Services in Satoyama Landscape of Japan: A Review on the Role of Management. Sustainability 2019, 11, 454. [Google Scholar] [CrossRef]
  17. von Thünen, J.H. The Isolated State in Relation to Agriculture and National Economy. In Von Thünen’s Isolated State; Hall, P., Ed.; Pergamon Press: Oxford, UK, 1966. [Google Scholar]
  18. Ahrends, A.; Burgess, N.D.; Milledge, S.H.; Bulling, M.T.; Fisher, B.; Smart, J.C.R.; Clarke, G.P.; Mhoro, B.E.; Lewis, S.L. Predictable Waves of Sequential Forest Degradation and Biodiversity Loss Spreading from an African City. Proc. Natl. Acad. Sci. USA 2010, 107, 14556–14561. [Google Scholar] [CrossRef] [PubMed]
  19. Fujita, M.; Krugman, P.R.; Venables, A.J. The Spatial Economy: Cities, Regions, and International Trade; Fujita, M., Krugman, P.R., Venables, A.J., Eds.; MIT Press: Cambridge, MA, USA, 2001; ISBN 978-0-262-06204-6. [Google Scholar]
  20. Zhang, Y.; Li, X.; Song, W. Determinants of Cropland Abandonment at the Parcel, Household and Village Levels in Mountain Areas of China: A Multi-Level Analysis. Land Use Policy 2014, 41, 186–192. [Google Scholar] [CrossRef]
  21. Inoue, T.; Yaida, Y.A.; Uehara, Y.; Katsuhara, K.R.; Kawai, J.; Takashima, K.; Ushimaru, A.; Kenta, T. The Effects of Temporal Continuities of Grasslands on the Diversity and Species Composition of Plants. Ecol. Res. 2021, 36, 24–31. [Google Scholar] [CrossRef]
  22. Uchida, K.; Ushimaru, A. Biodiversity Declines Due to Abandonment and Intensification of Agricultural Lands: Patterns and Mechanisms. Ecol. Monogr. 2014, 84, 637–658. [Google Scholar] [CrossRef]
  23. Ridding, L.E.; Redhead, J.W.; Pywell, R.F. Fate of Semi-Natural Grassland in England between 1960 and 2013: A Test of National Conservation Policy. Glob. Ecol. Conserv. 2015, 4, 516–525. [Google Scholar] [CrossRef]
  24. Monteiro, A.T.; Carvalho-Santos, C.; Lucas, R.; Rocha, J.; Costa, N.; Giamberini, M.; da Costa, E.M.; Fava, F. Progress in Grassland Cover Conservation in Southern European Mountains by 2020: A Transboundary Assessment in the Iberian Peninsula with Satellite Observations (2002–2019). Remote Sens. 2021, 13, 3019. [Google Scholar] [CrossRef]
  25. Ogura, J. The Transition of Grassland Area in Japan. J. Kyoto Seika Univ. 2006, 30, 159–172. [Google Scholar]
  26. Shimada, D. Multi-Level Natural Resources Governance Based on Local Community: A Case Study of Semi-Natural Grassland in Tarōji, Nara, Japan. Int. J. Commons 2015, 9, 486–509. [Google Scholar] [CrossRef]
  27. Osumi, K.; Ikeda, S.; Okamoto, T. Vegetation Patterns and Their Dependency on Site Conditions in the Pre-Industrial Landscape of North-Eastern Japan. Ecol. Res. 2003, 18, 753–765. [Google Scholar] [CrossRef]
  28. Ichikawa, K.; Okubo, N.; Okubo, S.; Takeuchi, K. Transition of the Satoyama Landscape in the Urban Fringe of the Tokyo Metropolitan Area from 1880 to 2001. Landsc. Urban Plan. 2006, 78, 398–410. [Google Scholar] [CrossRef]
  29. Agnoletti, M. The Degradation of Traditional Landscape in a Mountain Area of Tuscany during the 19th and 20th Centuries: Implications for Biodiversity and Sustainable Management. For. Ecol. Manag. 2007, 249, 5–17. [Google Scholar] [CrossRef]
  30. Fujihara, M.; Kikuchi, T. Changes in the Landscape Structure of the Nagara River Basin, Central Japan. Landsc. Urban Plan. 2005, 70, 271–281. [Google Scholar] [CrossRef]
  31. Sprague, D.S. Land-Use Configuration under Traditional Agriculture in the Kanto Plain, Japan: A Historical GIS Analysis. Int. J. Geogr. Inf. Sci. 2013, 27, 68–91. [Google Scholar] [CrossRef]
  32. FAO Globally Important Agricultural Heritage Systems (GIAHS), “Nishi-Awa Steep Slope Land Agriculture System, Japan”. Available online: https://www.fao.org/giahs/giahsaroundtheworld/designated-sites/asia-and-the-pacific/nishi-awa-steep-slope-land-agriculture-system/en/ (accessed on 23 March 2022).
  33. Takahashi, O. Tectonostratigraphic Study of the Chichibu and Shimanto Belts in the Kanto Mountains, Central Japan. J. Geol. Soc. Jpn. 2000, 106, 836–852. [Google Scholar] [CrossRef]
  34. Matsubayashi, H.; Ishizaka, S.; Nakagawa, T.; Nakamura, Y. Middle to Large Mammalian Fauna in the Headwater of Tamagawa River: A Preliminary Study on Prevention of Wildlife Damage by Camera Trap. J. Agric. Sci. Tokyo Univ. Agric. 2009, 54, 110–115. [Google Scholar]
  35. Okuyama, Y. Issues for Land Use and Ownership in Mountainous Villages: A Case of Kosuge Village, Yamanashi Prefecture. Ann. Jpn. Assoc. Econ. Geogr. 1964, 9, 39–54. [Google Scholar]
  36. Zenkoku Sanrin Rengokai, X. Kosuge, Yamanashi Prefecture. In Sanson Keizai Jittai Chousa Houkokusho 3 (Report on Rural Economy 3); Zenkoku Sanrin Rengokai, X., Ed.; Zenkoku Sanrin Rengokai: Tokyo, Japan, 1937; pp. 133–191. [Google Scholar]
  37. Kimata, M.; Dobashi, M.; Shinoda, T. Tradition of Millet-Derived Foods: A Case Study in Mizune Village, Okutama-Cho, Tokyo. Environ. Inf. Sci. 1979, 2, 77–89. [Google Scholar]
  38. Ito, T.; Ito, T.; Matsuno, S.; Mehta, R.; Sakamoto, M. Identifying the Determinants of Michinoeki Performance. J. Robot. Netw. Artif. Life 2021, 8, 165–169. [Google Scholar] [CrossRef]
  39. Hirano, Y. Current Development of the Forest Use as Adventure Parks in Japan: Focusing on Forest Adventure. J. Jpn. For. Soc. 2020, 102, 358–367. [Google Scholar] [CrossRef]
  40. Klien, S. “The Young, the Stupid, and the Outsiders”: Urban Migrants as Heterotopic Selves in Post-Growth Japan. Asian Anthropol. 2022, 21, 10–23. [Google Scholar] [CrossRef]
  41. Duxbury, N.; Campbell, H. Developing and Revitalizing Rural Communities through Arts and Culture. Small Cities Impr. 2011, 3, 111–122. [Google Scholar]
  42. European Commission Agriculture and Rural Development. Available online: https://agriculture.ec.europa.eu/common-agricultural-policy/rural-development_en (accessed on 28 April 2023).
  43. Nezu, M. Dymanics and Contemporary Significance of Functional and Social Cohesion in Rural Communities: A Case of Kosuge Village, Yamanashi Prefecture. For. Econ. 2004, 57, 1–16. [Google Scholar]
  44. Imai, N.; Furukawa, T.; Tsujino, R.; Kitamura, S.; Yumoto, T. Factors Affecting Forest Area Change in Southeast Asia during 1980–2010. PLoS ONE 2018, 13, e0197391. [Google Scholar] [CrossRef]
  45. Blaikie, P.M. Spatial Organization of Agriculture in Some North Indian Villages: Part I. Trans. Inst. Br. Geogr. 1971, 52, 1–40. [Google Scholar] [CrossRef]
  46. de Garis De Lisle, D. Effects of Distance on Cropping Patterns Internal to the Farm. Ann. Assoc. Am. Geogr. 1982, 72, 88–98. [Google Scholar] [CrossRef]
  47. Mottet, A.; Ladet, S.; Coqué, N.; Gibon, A. Agricultural Land-Use Change and Its Drivers in Mountain Landscapes: A Case Study in the Pyrenees. Agric. Ecosyst. Environ. 2006, 114, 296–310. [Google Scholar] [CrossRef]
  48. Gellrich, M.; Zimmermann, N.E. Investigating the Regional-Scale Pattern of Agricultural Land Abandonment in the Swiss Mountains: A Spatial Statistical Modelling Approach. Landsc. Urban Plan. 2007, 79, 65–76. [Google Scholar] [CrossRef]
  49. Kellerman, A. Economic and Spatial Aspects of von Thünen’s Factor Intensity Theory. Environ. Plan. A Econ. Space 1983, 15, 1521–1530. [Google Scholar] [CrossRef]
  50. R Core Team. R: A Language and Environment for Statistical Computing; R Foundation for Statistical Computing: Vienna, Austria, 2021. [Google Scholar]
  51. Ministry of Agriculture, Forestry and Fisheries. Annual Report on Food, Agriculture and Rural Areas in Japan; Ministry of Agriculture, Forestry and Fisheries: Tokyo, Japan, 2021. [Google Scholar]
  52. Osawa, T.; Kohyama, K.; Mitsuhashi, H. Multiple Factors Drive Regional Agricultural Abandonment. Sci. Total Environ. 2016, 542, 478–483. [Google Scholar] [CrossRef] [PubMed]
  53. Shoyama, K.; Nishi, M.; Hashimoto, S.; Saito, O. Outcome-Based Assessment of the Payment for Mountain Agriculture: A Community-Based Approach to Countering Land Abandonment in Japan. Environ. Manag. 2021, 68, 353–365. [Google Scholar] [CrossRef]
  54. Su, G.; Okahashi, H.; Chen, L. Spatial Pattern of Farmland Abandonment in Japan: Identification and Determinants. Sustainability 2018, 10, 3676. [Google Scholar] [CrossRef]
  55. Jentzsch, H. Abandoned Land, Corporate Farming, and Farmland Banks: A Local Perspective on the Process of Deregulating and Redistributing Farmland in Japan. Contemp. Jpn. 2016, 29, 31–46. [Google Scholar] [CrossRef]
  56. Kiziridis, D.A.; Mastrogianni, A.; Pleniou, M.; Karadimou, E.; Tsiftsis, S.; Xystrakis, F.; Tsiripidis, I. Acceleration and Relocation of Abandonment in a Mediterranean Mountainous Landscape: Drivers, Consequences, and Management Implications. Land 2022, 11, 406. [Google Scholar] [CrossRef]
  57. Association of Agriculture & Forestry Statistics (1960–2010). Census of Agriculture and Forestry, 1962–2012. Available online: https://www.e-stat.go.jp/en/statistics/00500209 (accessed on 12 April 2021). (In Japanese).
  58. Cabinet Office of Japan (Ed.) Kokuzei Chousa Houkoku 19 Yamanashi Ken (Japan Statistical Yearbook No. 19 Yamanashi Prefecture), 1950–1963; Cabinet Office of Japan: Tokyo, Japan, 1956. (In Japanese) [Google Scholar]
  59. Kanto Regional Agricultural Administration Office (Yamanashi), Ministry of Agriculture, Forestry and Fisheries of Japan (MAFF) (Ed.) Gunnai Chiku Shichoson Betsu Ruinen Tokei Sho (Statistical Yearbook by Municipality in Gunnai Region); Ministry of Agriculture, Forestry and Fisheries of Japan: Tokyo, Japan, 1996. (In Japanese) [Google Scholar]
  60. Kanto Regional Agricultural Administration Office (Yamanashi), Ministry of Agriculture, Forestry and Fisheries of Japan (MAFF) (Ed.) Yamanashi Ken Shichoson Betsu Norin Ruinen Tokei (Agriculture and Forestry Statistics by Municipality of Yamanashi Prefecture); Ministry of Agriculture, Forestry and Fisheries of Japan: Tokyo, Japan, 2007. (In Japanese) [Google Scholar]
  61. Yamanashi Prefecture (Ed.) (1967–2018). Yamanashi Ken Tokei Nenkan (Statistical Yearbook of Yamanashi Prefecture), 1965–2015. Available online: https://www.e-stat.go.jp/en/regional-statistics/ssdsview (accessed on 12 April 2021). (In Japanese).
Figure 1. Schematic diagrams of the von Thünen model and its application to a traditional rural landscape in Japan. Bid–rent curves and land use derived from the von Thünen model, illustrated by Fujita et al. (2001) [19] (a). The model applied to a Japanese mountain village with traditional mulching agriculture in the past (b), conventional agriculture (c), and traditional agriculture in the present day (d). Spatial pattern of land use in a village with traditional agriculture, showing as circles enlarged the lower half of Figure 1d (e).
Sustainability 15 07742 g001
Figure 2. Map of the study sites. Maps of Japan (a), Yamanashi Prefecture (b), and village of Kosuge (c) are shown. HS: Hashidate, NK: Nakagumi, SR: Shirasawa, NG: Nagasaku.
Sustainability 15 07742 g002
Figure 3. Views of traditional agricultural landscape in Kosuge, Yamanashi Prefecture, Japan. Photo credits: (a) S. Ishizaka S, (b) K. Yano, and (c,d) A. Okamoto.
Sustainability 15 07742 g003
Figure 4. Land use patterns in the 1940–1950s, 1960–1970s, 1980–1990s, 2000s, and 2010s in (a) NG and (b) HS.
Sustainability 15 07742 g004
Figure 5. Land use patterns in the 1940–1950s, 1960–1970s, 1980–1990s, 2000s, and 2010s in (a) SR and (b) NK.
Sustainability 15 07742 g005
Figure 6. Land use patterns in the 1940–1950s, 1960–1970s, 1980–1990s, 2000s, and 2010s in (a) NG, (b) HS, (c) SR, and (d) NK.
Sustainability 15 07742 g006
Figure 7. Change in grassland area in (a) NG, (b) HS, (c) SR, and (d) NK from 1940 to 2019. Two types of grassland are shown separately: grassland that has remained unchanged from the previous period (old) and recently established grassland (new).
Sustainability 15 07742 g007
Figure 8. Area proportion (%) of each land use type by accessibility index (1–4) and block in the 1940–1950s (ad) and the 2010s (eh). An index of 1 indicates the most accessible parcel and an index of 4 indicates the least accessible parcel. na = not available.
Sustainability 15 07742 g008
Table 1. Demographic and geological characteristics of the four settlements in 2020.
NGHSSRNK
Settlement
 No. household25511761
 Population4811144125
 Average age61.360.955.147.2
Block studied
 Total land area (ha)3.43.13.42.1
 No. parcel90252222146
 Mean (±SD) size of parcel (m2)382 ± 618142 ± 190164 ± 383153 ± 189
Dominant slope aspectSSSEN
Mean slope (°)25222312
 Mean distance from nearest entrance points to parcels (m)188649155
Table 2. Correlation between change in cropland area (% year−1) and underlying driving forces in each of the three study periods in NG (Nagasaku). * p < 0.1, ** p < 0.05, *** p < 0.01.
From1940–1950s1960–1970s1980–1990s
To1960–1970s1980–1990s2000s
No. active farmers/household−0.19−0.190.58
Total parcel area/household−0.010.39−0.05
Accessibility index−0.37−0.380.65
Proportion of south slope0.080.76 ***−0.36
Average age/household0.060.55 **0.68 *
Disclaimer/Publisher’s Note: The statements, opinions and data contained in all publications are solely those of the individual author(s) and contributor(s) and not of MDPI and/or the editor(s). MDPI and/or the editor(s) disclaim responsibility for any injury to people or property resulting from any ideas, methods, instructions or products referred to in the content.

