Abstract
The boom seen in artificial intelligence in recent years has led to a revolution in the automotive industry. Numerous automakers around the world, such as Tesla, Toyota, Honda, and BMW, have achieved giant strides in the development of e-autonomous vehicles. Consequently, shared electric automated vehicle mobility (SEAVM) systems, which are a crucial part of future innovative transportation solutions, have attracted significant attention from the research community, particularly from a design perspective. However, the flexibility of shared automated mobility systems may lead to a self-operating technology issue (unequal distribution of vehicles), since users in these systems can pick up and drop off electric vehicles wherever they like. With this in mind, this paper addressed the issues of autonomous repositioning and the assignment of shared autonomous electric vehicle systems to balance a system’s network and fulfill its demand. Modeling, analysis and assessment of the system’s performance were carried out using stochastic Petri nets formalism, which included determining the average time areas were empty/congested and the number of unserved consumers, and estimating the redistribution service launch moment. Furthermore, many simulation scenarios were analyzed, including repositioning and without repositioning scenarios, in order to evaluate the efficiency of the model and to show the potential of using Petri nets as a probabilistic formalism approach for the modeling of e-automated mobility systems.
1. Introduction
The attention given to shared electric mobility (e-bike, e-scooter, and e-car) is growing among businesses in many cities across the world. In addition, shared automated mobility is expected to revolutionize mobility and become an essential part of the future urban transportation system [1]. Many shared mobility businesses have joined the race to implement autonomous shared mobility in the future, such as Waymo (Google self-driving car), ‘GM’s Origin, Uber, and Layer in London. Implementing shared electric automated mobility systems (SEAM) could offer several solutions, including decreasing congestion, decreasing the relocation cost of shared mobility systems, improving the transition from one mode of transport to another while promoting sustainable transport and amplify energy savings through smart driving practices [2]. In addition to potentially enhancing mobility and safety, the introduction of automated and connected shared mobility into the transportation network has the potential to significantly alter travel behavior, mode choice, and vehicle ownership, as well as urban form and transportation infrastructure [3]. Unlike the normal shared mobility systems, the SEAV system can work in a flexible and automated way, where the user does not need to return the vehicle to the charging station when they finish their trip. The concept of automated mobility has evolved over several generations, and is now classified and described in five levels, which range from entirely human driving to fully automated driving (as summarized in Table 1) [4,5]. In fact, level 1 (adaptive cruise control and lane keeping assist) and level 2 (level 1 plus automated overtaking and park assist) require active intervention and the driver’s attention.

Table 1.
Autonomous vehicle generations.
Concerning level 3 vehicles (which allow driving, but do not have to be driven on highways, which means that the driver does not need to always pay attention to the driving task), these are appearing in some countries in the world, as the manufacturer Honda began offering this type of vehicle in 2021. Regarding level 4 vehicles, no human action or supervision is required, except in more complex cases such as unfavorable weather or an unusual environment. However, these autonomous vehicles will only be allowed to operate in specific locations approved by authorities. In terms of level 5 autonomous vehicles, it is challenging to imagine these appearing in the near future.
The performance of shared automated mobility is nevertheless being impacted by a number of overlapping technological factors, including automation, connectivity, electrification, and the shared usage of commodities [6]. Furthermore, without suitable incentive policies, shared electric automated and connected mobility might negatively affect traffic congestion and be a competitor of other transportation modes [3]. Additionally, despite the advancements seen in automotive technology, shared electric automated and connected mobility might not be put into use in the middle term (a long transition period between 10–40 years until fully automated vehicle be a common on the road) due to several challenges, including the complexity perception of the environment, energy, cyber-security, infrastructure, and government regulations, which prevent the use of shared electric automated mobility on public roads [7]. Additionally, there is a lack of cooperation among the key players, including the government, federal and state authorities, technical businesses, software developers, and customers. To overcome the barriers to integrating these cutting-edge technologies, these key stakeholders must collaborate [8]. In addition, security issues are still a big challenge for authorities, which can subject fully autonomous vehicles circulating on the road to many constraints, including requiring them to only activate the autonomous mode on roads without pedestrians or cyclists and only at speeds not exceeding 60 km/h, etc. Additionally, the “brains” of these cars can be susceptible to malicious code infection, source code changes, data leakage, etc., just like any other computer system. For instance, someone who recently hacked into a Tesla 3 gained access to critical information stored on the vehicle’s hard drive [9]. As a result, cybersecurity threats in self-driving vehicles may directly affect the security of users, pedestrians, other cars, and related infrastructure. Additionally, shared automated mobility faces barriers related to the use of car-sharing systems that may limit the viability of such systems. These barriers include safety and security issues, transport barriers, accessibility issues, and in particular the social exclusion issues often reported by users of car-sharing services [10,11]. There are seven main categories of these car-sharing social exclusion issues, namely economic, physical, geographical, spatial, fear-based, time-based, and facility-access barriers; taking them into consideration can help decision makers run shared mobility services that are better suited to the needs of society [10].
In technical terms, the assignment of Electric Automated Vehicles (EAVs), in particular, represents a big challenge for SEAM researchers; they need to develop an optimization technique to minimize user waiting time and minimize the trip time (to save the vehicle’s battery power) for the operator (reduce the cost). This makes it difficult to predict driver behavior and vehicle trajectory, thus making the modeling and performance assessment of these vehicles very challenging. These issues have garnered significant research attention in recent years. The key issues that directly affect these systems’ dimensioning and the operational and financial feasibility of such systems are presented in Table 2. The crucial challenge is to ensure that an EAV is available to pick up a customer in the quickest amount of time and that empty spots are available for charging the EAV.
Table 2.
Some research questions of shared electric automated mobility.
In this paper, the use of stochastic Petri nets and discrete event simulation will be proposed for the modeling and structural analysis performance evaluation of shared electric automated mobility. Moreover, the developed model has the potential to be used to test the impact of a network’s characteristics on the efficiency of the system, as well as to permit the simulation of several scenarios of autonomous repositioning issues (meaning an EAV is autonomously driven to change its place in order to balance the network), including static repositioning during the maintenance of the network or of some of the system’s charging stations, launching repositioning in a specific period, and dynamic repositioning according to the network situation and demand. The paper is structured as follows. In the next section, we provide a summary of previous work related to shared automated mobility. In Section 3, the suggested models based on stochastic PNs are applied and discussed. In Section 4, simulations of system behavior in various situations are shown, and the results are discussed. The conclusion and future works are presented in Section 5.
2. Previous Related Research and State of the Art
This literature review raised a number of research topics that have the potential to significantly impact the operational/economic sustainability of such systems, as well as the quality of the services they provide. How does one design and plan a SEAV network? How will electric and automated mobility interact with other transportation means? How should vehicles be distributed among charging stations? How does one manage the EAV charging process according to “user” requests? What is the optimal charging station location that will extend the covered distance of EAVs? What is the optimal vehicle assignment strategy that will reduce the waiting time and trip time of customers? What fleet size is required to provide the necessary level of service? In fact, the satisfaction of stakeholders’ (represented by consumers, operators, and governments) central values has been one of the main objectives of the majority of studies on SEAV. In this case, the customer needs a large amount of flexibility and the shortest possible waiting time to receive the vehicle, the shortest possible distance traveled, and the lowest possible cost, while the operator expects the minimum possible cost to operate the system while still serving the maximum number of customers and earning the highest possible income. Governments work to improve public space, minimize pollution, lessen traffic, and increase safety. In the literature, numerous issues relating to autonomous driving and vehicles have been covered, including vehicle cybersecurity, psychology, pedestrian detection, and environment perception [12]. However, there are few works that have investigated the crucial issues discussed earlier, and also provided a survey of recent potential topics regarding shared electric automated and connected mobility. Through this literature survey, in technical terms, and overall from a planning and design viewpoint, the key operational research issues and topics that have been addressed in the literature on shared electric autonomous mobility systems can be summarized as follows: (1) Vehicle Assignment; (2) Vehicle repositioning; (3) Fleet dimensioning; (4) Energy, battery capacity and station location; (5) Cybersecurity attacks. Table 3 summarizes the relevant research studies found in the literature. For each of these issues, we provide an overview of the literature and describe one or more solutions that have been proposed.
Table 3.
An overview of some relevant works.
Vehicle assignment to the customer (What is the optimal EAV assignment and charging scheduling that minimizes user waiting time (minimizes lost demand)?) represents a big challenge for researchers, who need to develop an optimization technique that minimizes user waiting time and minimizes the trip time (to save the vehicle’s battery power) for the operator (reduce the cost). A vehicle assignment system assigns vehicles to the user based on certain strategies, heuristics, or optimization algorithms. The assignment of the closest vehicle is typically implemented for electric automated mobility modeling (e.g., Chen et al., [13]; Zhang and Guhathakurta, [14]). For dynamic shared automated vehicle services, Hyland and Mahmassani [15] have presented different vehicle assignment policies. The customer is assigned to the closest inactive vehicle in the first policy, which is based on the first come, first served principle. The second policy is also based on the same principle. The third policy entails assigning users simultaneously. The fourth policy takes into account inactive and en route pickup cars when assigning a vehicle for new requests. Their study comes to the conclusion that optimization-based approaches that take into account both assigned and unassigned users are more effective in lowering fleet miles and traveler waiting times. However, the authors did not take into consideration the fleet vehicle limitation. To increase the efficiency of shared autonomous services, various operation strategies need to be developed to satisfy user preferences. For instance, a customer may request an AV immediately, and another may want to reserve a trip for the next morning. Therefore, most strategies need to be able to separately consider long-term and short-term requests, defining a framework that corresponds to static and dynamic optimization. Most studies focus on the dynamic mode (real-time) since it is very common for these services to emerge within a short period of time (Dia and Javanshour [16]). Ma et al. [17] presented a reservation-based shared electric automated system in the static mode (based reservation), where consumers can book trip requests in advance and the system operator assigns the requests to routes as efficiently as possible. The cooperative modeling approach also represents an interesting solution to the assignment issue in the literature, where the associated components (the customer needs to make a little walking effort, the service coordinator makes the assignment, and the fleet of shared E-automated vehicles provide the service) of shared E-automated mobility cooperate together to reduce the operating cost of systems. In this regard, Zhu et al. [18] developed a platform for microscopic simulation and a demand-side cooperative optimization model. Their proposed model handles the assignment issue as a vehicle routing optimization problem, with repositioning subject to many limitations, such as E-automated vehicle capacity and maximum consumer walking distances. Their program seeks to optimize network revenue while decreasing energy use, journey time, and distance traveled (to reduce the fleet operational cost).
Vehicle repositioning/relocation modeling is also a critical issue that has been discussed in the literature. The main research questions in this area are: What is the optimal relocation technique at the lowest price?; When should a repositioning service be introduced? Two major vehicle relocation policies—operator-based vehicle relocation and user-based vehicle relocation—have been studied in the literature on conventional shared mobility [3]. The identical problem with shared automated mobility systems might be resolved by combining both of these approaches. Due to the stochastic nature of consumer requests and behaviors, shared automated mobility networks may become unbalanced, resulting in some areas/stations having the most active autonomous vehicles while others have the least. In this regard, Benarbia et al. [1] used stochastic Petri nets and discrete event simulation to handle the relocation problem of conventional shared electric mobility. Additionally, their proposed model and simulation have the ability to assess performance and estimate critical situations (such as engorgement and deficit scenarios). Their simulation’s results showed that by calculating the time to start the relocation process, the overall number of relocation trips was decreased. The BlueSG network in central Singapore has been used to test this suggested model and simulation technique. Similarly, Cepolina and Farina [19] addressed the repositioning problem of shared vehicles by using automated vehicles. They suggested that cars should automatically move between stations when relocation is necessary, and assessed many performance indices by microscopic simulation. However, automated shared mobility is subject to other central problems, such as the assignment of the automated vehicle to meet the user’s request in a short time, as well as it being not necessary for the vehicle to return to the station when it drops off the customer (the car could wait for the next request at any location without returning to the station). In this context, the authors did not seek to relocate unused automated cars to more favorable locations (outside of stations) in order to reduce future traveler wait times, and also did not highlight the assignment issue of automated shared systems or address the systems as normal classical mobility systems. Different relocation procedures, referred to as R1 through R4 with a diminishing bound for relocation distance, were studied by Fagnant and Kockelman [20], both separately and in combination. Customers were found to wait for less time while using technique R1, which allows for longer relocation distances. Vehicle kilometers traveled rose as a result of each relocation strategy. Babicheva [21] analyzed the efficiency of six different repositioning techniques, with their results indicating that the combined simple nearest neighbor and index-based reposition approach offers the most promising outcomes.
Regarding studies on the fleet dimensioning of SEAM, these primarily focus on determining the beginning positions of the vehicles and the optimal size of the fleet necessary to meet a specific demand and to minimize the operating cost of the system. Using agent-based modeling and randomly generated demand data, Chen et al. [13] investigated how to manage a fleet of shared autonomous electric vehicles. Their simulation results demonstrate how strongly the range of the vehicles and the availability of charging facilities influence fleet size. Their proposed method, however, had significant weaknesses: the scenarios depicted presupposed that 10% of a region’s trip demand would be satisfied by SEAM and that the temporal and spatial distributions of SEAM trips would be the same as the region’s overall trip-making patterns (demand was assumed to be deterministic). By using the multi-agent simulator (MATSim) to simulate the Rouen (Normandy) metropole area’s automated Taxi transportation system, Vosooghi et al. [22] investigated the impact of fleet size on shared autonomous taxis. Their study’s outcomes indicate that the demographic structure of the city or region of interest and the range of choices among its residents are crucial factors in the design and sizing of fleet-shared autonomous taxis. Similar research also has been conducted by Bischoff and Maciejewski [23], who developed a simulation model to analyze different penetration rate scenarios with various sizes of autonomous taxi fleets to replace all private vehicle trips in the city of Berlin. By providing a real-time dispatching method, their results successfully proved that all private vehicles could be replaced by much less shared AVs for the same demand. Similarly, Vosooghi et al. [24] proposed a real study at the tactical level to design a shared autonomous system. They particularly addressed the impact of fleet size and capacity on the system’s performance using the multi-agent transport simulation platform (MATSim). They simulated several scenarios on real dynamic cases based on a local survey, which included 5059 households and 11,107 individuals; 929 activity chains, including 8 trip purposes, were found. Loeb et al. [25] addressed the impact of the charging station location on an EAV fleet by using agent-based modeling. Furthermore, they simulated robust locations around the region the charging stations were placed, as well as simulated the effects of battery range, charging times, and fleet size on SAEV system performance. Similarly, Vosooghi [26] also demonstrated that the choice of charging and battery swapping station placement strategy has a profound effect on service performance and effectiveness. The ridesharing mode of shared automated mobility, which can save costs and boost revenue, was not considered among these strategies. Ridesharing can be a significant factor in reducing the size of an EAV fleet and system costs by providing services to numerous unrelated customers. In this respect, Narayanana et al. [27] proposed a model based on game theory, and simulated several scenarios testing the ride-sharing penetration rate. Their results showed that the ridesharing of a shared automated network performed better than a car-sharing system. However, this feature can complicate their model, and in particular the assignment policy involved.
The issues of the energy range and the location of the charging infrastructure pose significant challenges to designing and putting into operation a successful E-automated shared mobility network. In this regard, the use of wireless charging is required in the construction of a shared fully electric automated mobility network that enables greater flexibility and autonomy. In this context, Mohamed et al. [28] proposed a mixed integer optimization method to deal with the problem of planning optimization for in-route wireless-charging-infrastructure-enabling fixed-route on-demand shared automated electric shuttles in South Carolina, USA. Their proposed optimization algorithm can determine the optimal decision parameters for dimensioning the network (number and assignment of wireless chargers, charging power level, and battery range), which show the most cost-effective solution and allow the system to run for an extended period of time on a charge. Jäger et al. [29] addressed the fleet management and charging infrastructure dimensioning issues by employing multi-agent simulation. They highlighted the impact of battery range on the system’s demand (this indicates how the capacity of the battery can impact the number of consumers served). Additionally, they analyzed the influence of the charging infrastructure (key decision parameters were the number of charging stations and location) on the performance of the network and particularly on the waiting time of customers during the day. On the other hand, the location of battery swapping and recharging stations plays a crucial role in optimizing the battery range and maximizing the covered area. Based on two basic optimization techniques—maximizing serviced consumers and minimizing the distance between potential demands and stations—Vosooghi et al. [30] proposed three major charging station positioning solutions. The first involved restricting the vehicle range in accordance with the battery capacities of an EA vehicle and offering one standard charger for four shared vehicles. The second involved maintaining the same policy while using rapid chargers to expand the service coverage. However, the overall waiting time was important in all circumstances, according to the infrastructure setup. In the third scenario, they added more outlets for standard chargers for electric vehicles that operate at the highest degree of efficiency.
In terms of cybersecurity threats, shared automated and connected mobility face significant security and hacking challenges. An increase in the number of cyberattacks on autonomous vehicles and systems is projected to be seen in the future, which are currently on the rise in current vehicles. Attacks on cybersecurity can be classified into three categories: physical, network, and infrastructure-level attacks. Physical attacks include those that disrupt sensors, alter the vehicle trajectory, and cause physical damage. Network-level attacks include those that target cloud servers and communications between vehicles. Infrastructure-level attacks include those that target traffic signs and infrastructure-to-vehicle communications [31]. Cybersecurity issues related to shared electric automated mobility have, as far as we know, not been extensively studied. In their paper [32], Vaidya and Mouftah dealt with various cyberattack forms that target shared electric automated mobility, and proposed a security solution for such connected and automated systems based on the method of conjugated authentication and authorization. Through the creation of a conceptual framework and the identification of a few contributing aspects, Pandey and Seetharaman [33] addressed the implications of cybersecurity in automated and connected vehicles. Their developed framework puts forth three propositions: the first deals with the detection and assessment of new attacks on automated vehicles, the second discusses the design and defense mechanisms used in cybersecurity in autonomous vehicles, and the third deals with the evaluation of promising technologies such as adversarial ML attacks. In addition, a number of important elements that aid in the detection and evaluation of novel forms of threat have been researched in the literature, including cyber-attacker objective trees, attacks under mixed traffic, the forecasting of unidentified threats, and tools for threat analysis. In contrast, the present study’s investigation was conducted based on a limited number of research articles. An automated virtual vehicle within a simulation environment was suggested by Clark et al. [34] as a virtual simulation tool to assist with lower operational and cybersecurity risks. As more training iterations are possible with the virtual model than with the physical model, the former has an advantage over the latter. However, this virtual simulation does not take into consideration all the decision variables of the physical model, such as actual weight. Further, the sensors in the virtual model provide ideal data that are much more accurate than those of the physical model, which reduces the real nature of the automated vehicle model. To boost consumers’ and passengers’ faith in this promising technology, cybersecurity digital labels are an interesting potential solution that could be added to automated vehicles’ dashboards. In this respect, Khan et al. [35,36] proposed an approach named Cybersecurity Box (CSBox), where the cybersecurity information of a connected autonomous vehicle is displayed to the main stakeholders of CSBoX, including automated vehicle automakers, governments, and consumers, by using digital labeling techniques. Kukkala et al. [37] discussed the major cybersecurity threats of connected vehicles over time and their impact. The authors also investigated the important obstacles that still need to be resolved and the technical and legislative issues that need to be addressed, as well as a roadmap for attaining secure autonomous vehicles in the future. Additionally, the authors suggested that the label on an autonomous vehicle’s dashboard could be shown on a digital screen to alert the public to the security status of the vehicle. In order to solve privacy issues related to the contextual information shared as a result of autonomous vehicle interactions, Yankson [38] provided architecture and an abstract Privacy Integrated Context Ontology model. Haas et al. [39] highlighted some of the significant cybersecurity risks that are emerging in the connected automobile world, concentrating on three key areas where cyberattacks might occur: e-mobility, car sharing, and automated vehicle parking.
3. Problem Formulation of Shared Electric Automated Mobility
There are two main directions of the modeling and analysis of shared automated mobility in the literature: analytical models that focus on specific issues such as vehicle assignment and repositioning and agent-based models that place emphasis on the system performance and impact of the shared automated mobility network under various scenarios where key parameters are changed [3]. Automated shared mobility is considered a discrete event system; several tools allow the study of this kind of system, such as computer simulation, queuing networks, parallel/real-time programming languages, algebraic dynamic models, automata, and Petri nets. In this respect, this work employed Petri nets to model such a system. To the best of our knowledge, only a few works have addressed automated mobility using Petri nets, and our work, based on stochastic Petri nets, constitutes the first that addresses the modeling of shared electric automated and connected mobility [40].
In the literature, there are numerous operating concepts of shared electric automated mobility. We employed one such concept with simplifying assumptions. Once the user requests a trip, an EAV should be selected among the fleet in real-time according to the demand and charging battery range of the EAV (could be among inactive, in-service, or in-charging station AVs); after the trip, the EAV decides to go to a charging station (according to its battery range), the next user, a specific location to wait for the next request, or the control center (see Figure 1). Only when the electric vehicle is fully charged may the customer call or reserve it. Otherwise, they can reserve an available EAV (thus, the charging level (L) of the battery is equal to or higher than the availability threshold L ≥ s, s is considered 50% in this model). Along the way, the vehicle may stop at one or more locations to pick up or drop off passengers. In general, autonomous driving requires three key steps: the perception of the environment and location, trajectory planning (trajectory generation involves the prediction of a reference trajectory, which avoids collisions and respects passenger safety and the rules of the road), and decisions. However, shared mobility systems present crucial inconveniences, since one of their main issues is the repositioning/relocation issue. Automated shared vehicles should face this unbalancing challenge by implementing autonomous repositioning mechanisms among areas to avoid deficit and congested areas that impact the efficiency of the network.
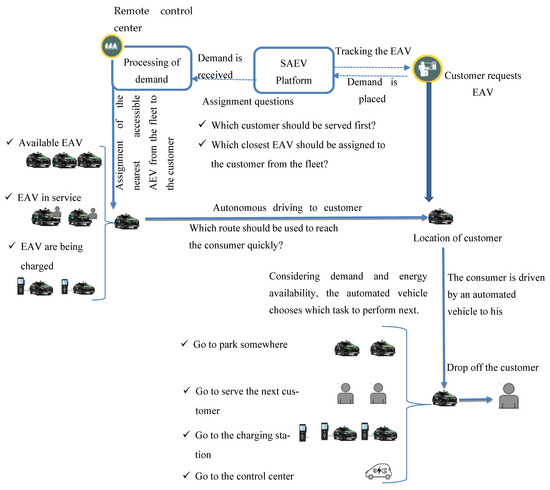
Figure 1.
Shared electric automated system operation.
Based on the above description, a stochastic Petri nets model was developed that can replicate an E-automated transportation network. The presented model is based on earlier works [1,41] on shared mobility that used Petri nets. A stochastic Petri nets model with variable weights of a shared electric automated and connected vehicle network is proposed in this section. This model replicates the actual behavior of the suggested concept in Figure 1. The model considers the dynamic behavior of the automated mobility network under various restrictions (such as the number of chargers available, the fleet size of E-automated vehicles, the battery range limitation, and vehicle control).
We decided to test the initial model on a network with two charging stations and areas for the sake of clarity. The proposed model can, of course, be generalized using the discrete event simulation approach to a huge network with numerous locations, a large fleet size, and large number of charging stations. We presumptively deployed one charging station in each location and assumed that the system was subject to customers making random requests based on a Poisson process. The developed model also replicates the stochastic aspect of the system by including stochastic transitions associated with the exponential probability distribution law. The names of the various model elements are listed in Table 4 and Table 5.
Table 4.
Significance of certain places in the model.
Table 5.
Significance of certain transitions in the model.
When an EAV reaches max (100%) charge, it should leave the charging station and park somewhere or serve the next demand as a priority. This policy makes chargers available during the day, as the number of these is limited around the city.
We define the network as being unbalanced when an unequal distribution of vehicles is going to happen in the middle term, which means some areas will suffer from a deficit of vehicles (almost no vehicles in the area) or a high number of vehicles. In terms of Petri nets, the total number of automated vehicles in the area (Ai) Naevi is represented by the sum of the marking of places Pasi (represents the EAVs being charged Nasi), Phsi (represents the EAVs with a 50% charging level that are being charged Nhsi), Pfvi (Nfvi represents the fully charged EAVs in area Ai), and Pvsi (Nvsi represents the EAVs parked in area Ai waiting for a ride demand or free charger), as formulated in the following equation:
It is important to note that if Nave1 = 0, this means that no vehicle is available in the area (A1), and if Naev1 = Max, this means that a high number of vehicles from the network fleet is available in this area (A1), where Max represents the max number of vehicles in the area (estimated depending on the frequentation and size of the area). The available EAVs that can be assigned to consumers are either fully charged, have a 50% charging level, are parked after a ride, or are waiting in service (if the waiting time is so high that the reservation will be canceled by the systems), as formulated in the following Equation:
As a result of the vehicles’ connectivity to one another and to the control center, repositioning is carried out automatically. This process is only initiated when some areas are in emergency conditions. In this respect, we propose a control strategy based on decision thresholds named Pi, Si, and Ei, where the parameter P is used to detect a deficit situation if the number of EAVs Naevi < Pi, E is used to detect a congested situation in an area if the number of EAVs Naevi > Ei, and Si is used to represent the desired number of vehicles in an area or the balancing threshold. It is assumed that the vehicles in this model are interconnected and that a real-time inventory control system was implemented to monitor urgent situations. The system alerts the vehicle in real-time about critical network problems in order to start the repositioning process. Based on the monitoring, if many areas are suffering a deficit of vehicles less than the threshold Pi (Neavi ≤ Pi), the balancing system is launched. For repositioning, the EAV moves automatically from an area (Ai) with engorgement vehicles to an area (Aj) with deficit vehicles. Additionally, a random switch Rs is correlated with transitions in the Petri nets model to resolve conflicts (fired transition with higher Rs). Using the relocating vehicle is not possible until the relocation is finished.
Figure 2 displays the four modules of the suggested model: (a) the fleet of EAVs, which represents the availability of EAVs, i.e., whether they are plugged in, ready to be parked, or in use; (b) the assignment module; (c) the repositioning module; (d) the warning module, which alerts the balancing system in real-time to critical network conditions. The relocation module’s goal is to limit unfavorable scenarios and reduce the amount of lost demands.
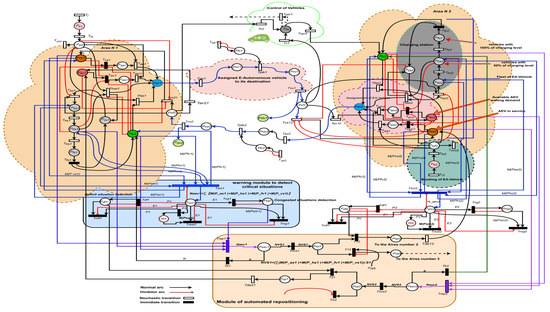
Figure 2.
Stochastic Petri nets model of the e-automated and connected shared mobility.
Regarding the automated vehicle fleet module, three main sub-modules are included: one charging station with a limited number of chargers, automated vehicles in use, and automated vehicles parked in a waiting area. In terms of Petri nets, this module is represented by a set of places, Pasi, Pci, Phsi, and Pfsi, as well as a set of transitions, Tasi, Tci, This, and Tfsi. The marking of the place Pasi represents the number of vehicles being charged that have just arrived at the charging station (charging level L < 50%), the marking of the place Phsi indicates the numbers of vehicles with charging levels greater than 50% (available to leave if there is demand), and the place Pfsi indicates the fully charged vehicles that should leave the station in order to free up chargers so that other vehicles can charge. The marking of the place Pfvi indicates the fully charged vehicles that have just left the charging station and that are now parked somewhere waiting for assignment. The place Pvsi represents the vehicles that are currently parked in the area (Ai) and that have enough charge to make another trip; otherwise, they go to a charging station for charging (if chargers are available). The place Pavi is used to indicate the number of vehicles in service that can be used for the next ride request if neither a charged nor parked vehicle is available.
Regarding the vehicle assignment module, this is basically composed of the places Paai, Pain, and Paci and the transitions Taai, Tain, Tvs, Tav, and Tfv (see details about these terms’ meanings in Table 4 and Table 5). The assignment policy used in the model assumes that a fully charged vehicle should be assigned first in order to meet the first demand, which is represented by the firing of the transition Tfvi. If there is not a fully charged vehicle available, the system suggests vehicles with a 50% charging level, represented by the firing of the transition Thasi. However, if all vehicles in the charging station have a charging level of less than 50%, the assignment mechanism assigns a parked vehicle in the area Ai to pick up the customer, which is represented by the firing of the transition Tavsi. Otherwise, the system recommends vehicles currently in service to the costumer as a final option, which is indicated by the firing of the transition Tavi. The place Paci indicates that the assigned vehicle is going to pick up the costumer from their location, and the stochastic transition Taci indicates the average travel time of the assigned vehicle to reach its destination. Figure 3 and Figure 4 summarize the logic of this policy.
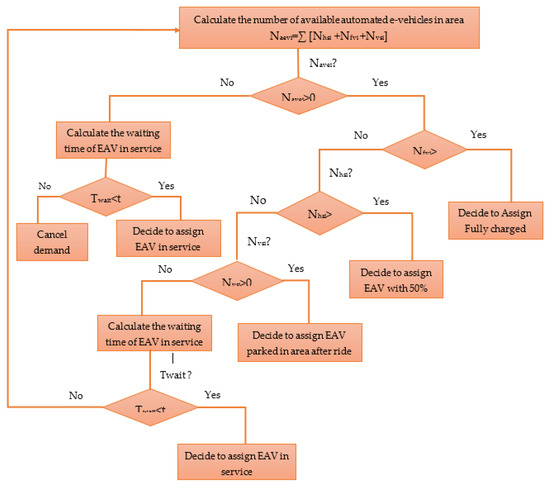
Figure 3.
Flow chart illustrating the assignment of the EAV to the customer.
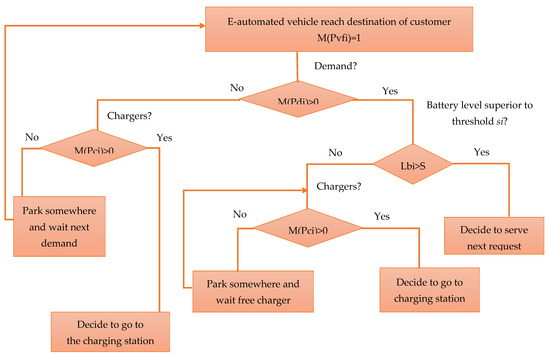
Figure 4.
Flow chart illustrating the assignment of the EAV after dropping off the customer.
In order to address the conflicts associated with the assignment of vehicles, it is important to design a priority management system (deterministic or random) based on real-time inventory control approaches. We employed transitions associated with random switches and inhibitor arcs to implement the stochastic Petri nets model. The following are the validation requirements for the transitions This1 and Tfv1:
Conditions of validation of stochastic transition Ths1
means that there must be at least one token available at the place Phs1;
means that at least one token must be available at the place Ppd1;
means that the place Pfv1 should not be marked.
Conditions of validation of stochastic transition Tfv1
means that at least one token should be available at the place Pfv1;
means that the place Ppd1 must have at least one token.
It is crucial to understand that the firing of the transition Tfv1 has precedence over that of transition Ths1. The inhibitor arc from the place Pfv1 to the transition Ths1, as shown in the model of Figure 2, indicates that the transition Ths1 is only fired if the marking of the place Pfv1 equals zero (which means no fully charged vehicles are available).
An automated vehicle will be able to automatically carry out the following tasks after completing a trip and dropping off the customer:
- ✓
- Serve the subsequent request as long as no available EAV is parked in the area, and provided its battery range is sufficient for the next trip. In terms of Petri nets, this event is represented by the firing of the stochastic transition Tnex, which places a token in the place Pavi, indicating that the vehicle is available for the next ride.
- ✓
- Go to the charging station to be charged to the max or 50% level. In the model, this event is represented by the firing of the stochastic transition Tasi, which can only be fired if at least one token is present in the place Pci (represents the number of chargers in the station).
- ✓
- Move to park somewhere if the charging station is full (no chargers available). In terms of Petri nets, this event is represented by the firing of the stochastic transition Tpar, which causes a token to be placed at the place Pvsi.
- ✓
- Go to the control center (if any technical problems are detected, revision is necessary). In the model, this event is represented by the transition Tm, which is associated with less random switches (the probability that the average number of vehicles needs control during the day/week).
Regarding the repositioning module, its role is to launch relocation when necessary with the assistance of the real-time inventory monitoring module implemented in the control systems and in the vehicle.
The repositioning approach provides calls for the vehicles to move autonomously from the congested (a high number of EAVs) area Ai to the deficit area Aj (almost no vehicles). Of course, this strategy considers each vehicle’s battery range and moves the charged vehicles first. The real-time alert module incorporates the policy (Pi, Ei) by accounting for the number of EAVs in each area, which is represented by the places Psm (represents the sum of available vehicles in the concerned area), Pdf, which is used to test the deficit situations, and Pcg, which tests if the number of vehicles in the area is almost at the maximum (Figure 5 summarizes the logic of this policy). The repositioning module is represented by a set of places, Psav, Pvp, and Pvpsi, and the transitions Tsum, Tre, and Ttv, where Nvsi denotes that the vehicle has to be moved to the other deficit areas. The following equation represents this event:
where S is the repositioning threshold; the area should continue to have the desired number of automated vehicles to meet and cover demand. Figure 6 illustrates the suggested policy. (As depicted on the map of Figure 6 by the circles, we can observe an area with multiple vehicles while another one in deficit situation. The red color in the Figure 6 indicates that the area is in a critical situation, while the green indicates that the area is in the frame of balancing).
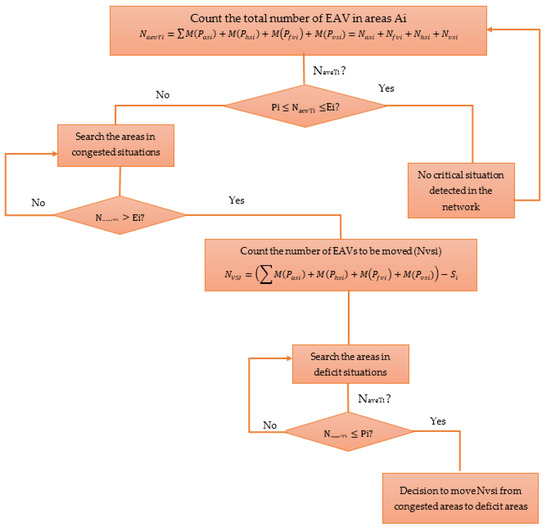
Figure 5.
This flow chart illustrates the repositioning strategy proposed.
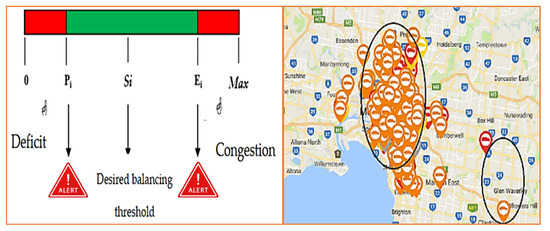
Figure 6.
Repositioning policy proposed to resolve the unequal distribution issue.
4. Simulation and Discussion
The use of Petri nets as a modeling tool is well suited to characterizing the repositioning dynamics of shared electric automated mobility networks. Using MATLAB software, a series of simulations with various scenarios (a dynamic case without repositioning (a), a dynamic case with repositioning (b), and a static example representing the offline/maintenance mode (c)) was conducted to validate and assess the performance of the developed Petri nets model. The interpretation of solutions derived from these data is still limited, even though a random generator can produce realistic data simulating specific dynamics of transit demand in urban locations. In this instance, we simulated the model using data from BleuSG (Singapore’s shared electric mobility system) [1]. The model, which can be used for autonomous repositioning, assumes that the electric vehicles are autonomous. To effectively evaluate the system’s behavior, a long time horizon was used in the simulation. As a result, several performance indices for the proposed model were able to be measured, such as the average number of vehicles in the area, the average number of vehicles being charged, the average waiting time of costumers to receive automated vehicles, the percentage of time the area was empty, the percentage of time the area was congested, the average number of served/unserved costumers, etc. This was carried out through the dynamic evolution of the marking of various places in the model according to the firing of transitions occurring in time.
4.1. Simulation of Scenario (a)
In this scenario, the network’s dynamic behavior was simulated without a repositioning mechanism. In terms of Petri nets, this configuration was achieved by deactivating the repositioning module, meaning that when the vehicle reached its destination, it stayed in the same area (either to go to a charging station or to park somewhere). The simulation results were obtained from the scheme of the evolution of the number of e-automated vehicles in each area, which meant visualizing the markings Pasi, Phsi, Pfsi, Pfvi, Pvsi, Pavi. The results showed that the simulated areas were characterized by undesirable situations (see Figure 7). Because of this, given the simulated arrangement, the transition rates between the various areas tended to be saturated (a large number of vehicles almost reached the max) and occasionally deficient (the number of EAVs was very low or equaled zero).
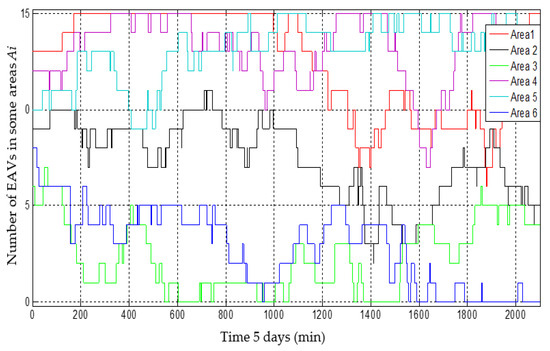
Figure 7.
Flow evolution of autonomous electric vehicles in some areas (repositioning mechanism was not available).
These results suggest that the repositioning mechanism provides many benefits to guarantee areas’ long-term rebalancing. Additionally, it was possible to assess a number of types of system performance, such as:
- Throughout the whole simulation period, the average percentage of time when the areas were saturated was 24.1%. That is to say, over a service horizon of 5 days (2100 min), the network remained congested for 506.1 min (2100∗24.1/100).
- During the entire simulation period, the areas were in deficit conditions for an average of 10.23% of the time. In other words, over the horizon of 5 days of service (2100 min), the network experienced 214.83 min (2100∗10.23/100) without vehicles in some areas.
4.2. Simulation of Scenario (b)
This scenario aimed to test the balancing process by activating the repositioning model (automated redistribution). It was feasible to track how the suggested solution affected the service quality and average number of unserved users. We focused on the time evolution of the number of available EAVs in the areas simulated, which can be observed in Figure 8. The repositioning function integrated into the model showed that the number of EAVs (marking of the place Pci) in most areas oscillated around the fixed threshold. Operators can gain a lot from graphs that depict the dynamic behavior of a particular system, such as those shown in the illustrative example. They give operators a quick, simple, and visual way to see whether a system is operating properly, depending on the management guidelines or constraints set. Additionally, for the scenario (b) simulation, the following results obtained on the system’s performance evaluation:
- 8.1% of the overall simulation time was spent on areas that were saturated. In other words, for the 5 days of service (2100 min), the network was still overloaded for 170.1 min (2100∗8.1/100).
- Throughout the simulation period, an average of 7.5% of the time was spent with an area having an EAV deficit. In other words, for the 5 days of service (2100 min), the network remained in deficit for 67.05 min (2100∗7.5/100).

Figure 8.
Flow evolution of autonomous electric vehicles in some areas (repositioning process was available).
It is important to note that the suggested repositioning approach was able to improve the network’s balance by reducing the number of undesirable situations (deficits and congestion) in the shared automated electric mobility network.
4.3. Simulation of Scenario (c)
In this scenario, the static condition with minimal network activity was used. In more concrete words, this scenario reflected the network dynamics at night or during a service outage due to system maintenance.
By significantly raising the rates associated with the transitions Tbi, this condition was analyzed and replicated from the perspective of the Petri nets model. As a result, these transitions’ crossing frequencies drastically decreased. We obtained curves with identical behavior to that of the simulation results of the static model with a high firing delay to changes: the quantity of EAVs was nearly constant in each area due to the network’s extremely low frequency (see Figure 9).
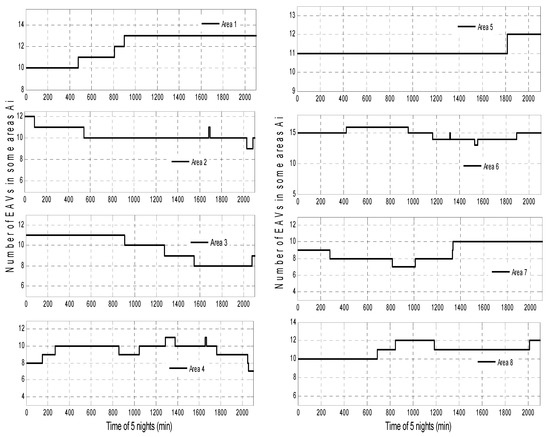
Figure 9.
Flow evolution of electric autonomous vehicles in some areas in static case (case of maintenance of network/night).
5. Conclusions and Perspectives
In the coming years, shared electric automated and connected mobility systems will transform and redefine the transportation system. However, deploying such systems will need cooperation on the part of key stockholders, including automakers, governments, and shared mobility operators. Furthermore, shared E-automated mobility systems are extremely complex in practice due to the significant problems of modeling, optimization, repositioning and assignment. This paper highlighted firstly a number of critical research issues pertinent to shared electric automated mobility. The majority of studies in the literature have focused on the strategic level when discussing cybersecurity attacks to and the assignment and energy difficulties of electric automated vehicles and shared electric mobility. However, only a small number of works have specifically addressed the issue of repositioning in shared electric automated and connected mobility systems. Overall, our survey of recent studies suggested that a shared electric automated and connected network fleet may be able to significantly outcompete a traditional taxi fleet in a metropolitan area.
The second contribution to the literature of this paper was its proposal of a stochastic Petri nets modeling approach that addresses the assignment and repositioning issues and the performance evaluation of different indices. Additionally, a strategy for repositioning was proposed based on decision parameters that specify when and between which areas repositioning should be carried out. The developed model takes into account the assignment issue (with some assumptions to simplify the modeling) through the assignment algorithm, which can assign a vehicle automatically to a customer. Furthermore, the developed model is highly configurable to support the dynamic and behavioral complexity of this automated mode of urban transportation. It is possible to simulate several configurations using the proposed model, including a dynamic mode without repositioning (during the day), a dynamic mode with repositioning, and a static mode (when the system’s frequentation is very low, for instance during the night or in the case of network maintenance). Several performance indices, such as the average number of charging vehicles, the percentage of network shortage time and the congestion time, can be assessed using the developed model. Additionally, the presented model can be used to design/simulate a shared electric automated mobility network by simulating the dynamic behavior of systems through changes in network decision parameters, such as the the size of the automated vehicle fleet, the number of charging stations, and the number of chargers. Further, the proposed formalism and discrete event approach can be employed to simulate and analyze the implementation and realization of an electric automated and connected taxi network. This study shows that, despite the involvement of electric automated vehicles in these kinds of systems, the unbalancing of the network is a significant difficulty these systems face. Therefore, in order to balance the network and improve the effectiveness of such systems, the operator is required to employ repositioning tactics.
On the other hand, the results from this study’s Petri-nets-based modeling and simulation demonstrate the potential of employing graphical models such as Petri nets to assess the effectiveness of shared e-automated mobility systems. The results also show the potential of using Petri nets models to predict critical situations, analyze control strategy efficiency, improve system performance and in particular model repositioning and assignment problems. To the best of our knowledge, this is the first study to date to use stochastic Petri nets to model shared electric automated mobility systems. However, the developed approaches still have some limitations, such as the complexity of the graphical model and challenges related to generalizing the formalism for larger networks. Petri nets have significant potential to be used for the modeling and performance evaluation of discrete event systems; however, they must be used in conjunction with other optimization methods in order to solve optimization issues. Furthermore, the proposed model overlooked the ride-sharing policy, which could have complicated the formalism.
This work raises many questions that could be tackled in future works. Designing a shared electric automated mobility service involves a number of optimization issues, in particular deciding on the best fleet size and parking station locations. In the following stage, additional work will be carried out, such as reformulating the developed model to use hybrid stochastic Petri nets to take into account continuous system aspects and continuous decision variables such as vehicle velocity and energy consumption. Moreover, a dynamic ridesharing policy will be incorporated into the model to improve fleet performance metrics. Additionally, this Petri-nets-based modeling concept will be transformed to a graph-theory-based modeling concept to efficiently address the routing vehicle optimization problem by employing the Basic Differential Multiplier Method(BDMM). Furthermore, related optimization problems will be tackled by combining the developed model and the BDMM. On this basis, fleet vehicle optimization, assignment optimization, and shortest path problem optimization will all be the goals of future research. Furthermore, a comparison could be carried out with other works addressing the repositioning issue of such dynamic systems.
Author Contributions
Conceptualization, T.B.; methodology, T.B.; software, T.B.; validation, T.B.; writing—original draft preparation, T.B. and K.K.; writing—review and editing, F.A.M., W.V.K. and K.K.; visualization, F.A.M. and W.V.K.; supervision, K.K.; formal analysis, T.B.; project administration, T.B. and K.K. All authors have read and agreed to the published version of the manuscript.
Funding
This research received no external funding.
Institutional Review Board Statement
Not applicable.
Informed Consent Statement
Not applicable.
Data Availability Statement
Not applicable.
Conflicts of Interest
The authors declare no conflict of interest.
References
- Benarbia, T.; Axhausen, K.W.; Farooq, B. Modelling, Relocation and Real-Time Inventory Control of One-Way Electric Cars Sharing Systems in a Stochastic Petri nets framework. IEEE Intell. Transp. Syst. 2021, 22, 2846–2861. [Google Scholar] [CrossRef]
- Cremer, A.; Müller, K.; Finkbeiner, M. A Systemic View of Future Mobility Scenario Impacts on and Their Implications for City Organizational LCA: The Case of Autonomous Driving in Vienna. Sustainability 2022, 14, 158. [Google Scholar] [CrossRef]
- Zhao, L.; Malikopoulos, A.A. Enhanced Mobility With Connectivity and Automation: A Review of Shared Autonomous Vehicle Systems. IEEE Intell. Transp. Syst. Mag. 2022, 14, 87–102. [Google Scholar] [CrossRef]
- Malik, S.; Khattak, H.A.; Ameer, Z.; Shoaib, U.; Rauf, H.T.; Song, H. Proactive Scheduling and Resource Management for Connected Autonomous Vehicles: A Data Science Perspective. IEEE Sens. J. 2021, 21, 25151–25160. [Google Scholar] [CrossRef]
- Society of Automotive Engineers Mobilus. Taxonomy and Definitions for Terms Related to Driving Automation Systems for On-Road Motor Vehicles; SAE International in United States: Warrendale, PA, USA, 2016; Available online: https://www.sae.org/standards/content/j3016_202104/ (accessed on 29 August 2022).
- Geißler, T.; Shi, E. Taxonomies of connected, cooperative and automated mobility. In Proceedings of the IEEE Intelligent Vehicles Symposium (IV), Aachen, Germany, 4–9 June 2022. [Google Scholar]
- Wintersberger, S.; Azmat, M.; Kummer, S. Are We Ready to Ride Autonomous Vehicles? A Pilot Study on Austrian Consumers’ Perspective. Logistics 2019, 3, 20. [Google Scholar] [CrossRef]
- Mahdavian, A.; Shojaei, A.; Mccormick, S.; Papandreou, T.; Eluru, N.; Oloufa, A.A. Drivers and Barriers to Implementation of Connected, Automated, Shared, and Electric Vehicles: An Agenda for Future Research. IEEE Access 2021, 9, 22195–22213. [Google Scholar] [CrossRef]
- Hacker Shows How to Unlock, Start and Drive Off with Someone Else’s Tesla. Available online: https://fortune.com/2022/05/17/tesla-hacker-shows-how-to-unlock-start-and-drive-off-with-car/ (accessed on 25 September 2022).
- Turoń, K. Social barriers and transportation social exclusion issues in creating sustainable car-sharing systems. Entrep. Sustain. Issues 2021, 9, 10–22. [Google Scholar] [CrossRef]
- Turoń, K.; Czech, P.; Tóth, J. Safety and security aspects in shared mobility systems. Scientific Journal of Silesian University of Technology. Ser. Transp. 2019, 104, 169–175. [Google Scholar]
- Parekh, D.; Poddar, N.; Rajpurkar, A.; Chahal, M.; Kumar, N.; Joshi, G.P.; Cho, W. A Review on Autonomous Vehicles: Progress, Methods and Challenges. Electronics 2022, 11, 2162. [Google Scholar] [CrossRef]
- Chen, T.D.; Kockelman, K.M.; Hanna, J.P. Operations of a shared, autonomous, electric vehicle fleet: Implications of vehicle & charging infrastructure decisions. Transp. Res. Part A Policy Pract. 2016, 94, 243–254. [Google Scholar] [CrossRef]
- Zhang, W.; Guhathakurta, S.; Fang, J.; Zhang, G. Exploring the impact of shared autonomous vehicles on urban parking demand: An agent-based simulation approach. Sustain. Cities Soc. 2015, 19, 34–45. [Google Scholar] [CrossRef]
- Hyland, M.F.; Mahmassani, H.S. Taxonomy of shared autonomous vehicle fleet management problems to inform future transportation mobility. Transp. Res. Rec. J. Transp. Res. Board 2017, 2653, 26–34. [Google Scholar] [CrossRef]
- Dia, H.; Javanshour, F. Autonomous Shared Mobility-On-Demand: Melbourne Pilot Simulation Study. Transp. Res. Procedia 2017, 22, 285–296. [Google Scholar] [CrossRef]
- Ma, J.; Li, X.; Zhou, F.; Hao, W. Designing optimal autonomous vehicle sharing and reservation systems: A linear programming approach. Transp. Res. Part C Emerg. Technol. 2017, 84, 124–141. [Google Scholar] [CrossRef]
- Zhu, L.; Zhao, Z.; Wu, G. Shared Automated Mobility with Demand-Side Cooperation: A Proof-of-Concept Microsimulation Study. Sustainability 2021, 13, 2483. [Google Scholar] [CrossRef]
- Cepolina, E.M.; Farina, A. A methodology for planning a new urban car sharing system with fully automated personal vehicles. Eur. Transp. Res. Rev. 2014, 6, 191–204. [Google Scholar] [CrossRef]
- Fagnant, D.; Kockelman, K.M. The travel and environmental implications of shared autonomous vehicles, using agent-based model scenarios. Transp. Res. Part C Emerg. Technol. 2014, 40, 1–13. [Google Scholar] [CrossRef]
- Babicheva, T.; Burghout, W.; Andreasson, I.; Faul, N. The matching problem of empty vehicle redistribution in autonomous taxi systems. Procedia Comput. Sci. 2018, 130, 119–125. [Google Scholar] [CrossRef]
- Vosooghi, R.; Kamel, J.; Puchinger, J. Robo-Taxi service fleet sizing: Assessing the impact of user trust and willingness-to-use. Transportation 2019, 46, 1997–2015. [Google Scholar] [CrossRef]
- Bischoff, J.; Maciejewski, M. Simulation of City-wide Replacement of Private Cars with Autonomous Taxis in Berlin. Procedia Comput. Sci. 2016, 83, 237–244. [Google Scholar] [CrossRef]
- Vosooghi, R.; Puchinger, J.; Jankovic, M.; Vouillon, A. Shared autonomous vehicle simulation and service design. Transp. Res. Part C 2019, 107, 15–33. [Google Scholar] [CrossRef]
- Loeb, B.; Kockelman, K.M.; Liu, J. Shared autonomous electric vehicle (saev) operations across the austin, texas network with a focus on charging infrastructure decisions. Transp. Res. Part C Emerg. Technol. 2018, 89, 222–233. [Google Scholar] [CrossRef]
- Vosooghi, R. Shared Autonomous Vehicle Service Design, Modeling, and Simulation. Ph.D. Thesis, University of Paris-Saclay, Gif-sur-Yvette, France, 28 October 2019. [Google Scholar]
- Narayanana, S.; Chaniotakisb, E.; Antoniou, C. Modelling reservation-based shared autonomous vehicle services: A dynamic user equilibrium approach. Transp. Res. Part C Emerg. Technol. 2022, 140, 103651. [Google Scholar] [CrossRef]
- Mohamed, A.A.S.; Zhu, L.; Meintz, A.; Wood, E. Planning Optimization for Inductively Charged On-Demand Automated Electric Shuttles Project at Greenville, South Carolina. IEEE Trans. Ind. Appl. 2020, 56, 1010–1020. [Google Scholar] [CrossRef]
- Jäger, B.; Mrad Agua, F.M.; Lienkamp, M. Agent-based simulation of a shared, autonomous and electric on-demand mobility solution. In Proceedings of the IEEE 20th International Conference on Intelligent Transportation Systems (ITSC), Yokohama, Japan, 16–19 October 2017. [Google Scholar]
- Vosooghia, R.; Puchingera, J.; Bischoffc, J.; Jankovicb, M.; Vouillond, A. Shared autonomous electric vehicle service performance: Assessing the impact of charging infrastructure. Transp. Res. Part D Transp. Environ. 2020, 81, 1361–9209. [Google Scholar] [CrossRef]
- Khan, M.K.; Quadri, A. Augmenting Cybersecurity in Autonomous Vehicles: Innovative Recommendations for Aspiring Entrepreneur. IEEE Consum. Electron. Mag. 2021, 10, 111–116. [Google Scholar] [CrossRef]
- Vaidya, B.; Mouftah, H.T. Security for Shared Electric and Automated Mobility Services in Smart Cities. IEEE Secur. Priv. 2021, 19, 24–33. [Google Scholar] [CrossRef]
- Pandey, M.; Seetharaman. A sreview of factors impacting Cybersecurity in Connected and Autonomous Vehicles (CAVs). In Proceedings of the 8th International Conference on Control, Decision and Information Technologies CoDIT′22, Istanbul, Turkey, 17–20 May 2022. [Google Scholar]
- Clark, G.W.; Andel, T.R.; Doran, M.V. Simulation based reduction of operational and cybersecurity risks in autonomous vehicles. In Proceedings of the IEEE Conference on Cognitive and Computational Aspects of Situation Management (CogSIMA), Las Vegas, NV, USA, 8–11 April 2019. [Google Scholar]
- Khan, Z.W.; Khan, K.M.; Arshad, Q.A.; Malik, H.; Almuhtadi, J. Digital labels: Influencing consumers Trust and raising cybersecurity awareness for adopting autonomous vehicles. In Proceedings of the IEEE International Conference on Consumer Electronics (ICCE), Las Vegas, NV, USA, 10–12 January 2021. [Google Scholar]
- Khan, W.Z.; Khany, M.K.; Arshad, Q.A. Cybersecurity Digital Labels for Connected and autonomous vehicles. IEEE Consum. Electron. Mag. 2021, 12, 87–93. [Google Scholar] [CrossRef]
- Kukkala, V.K.; Thiruloga, S.V.; Pasricha, S. Roadmap for Cybersecurity in Autonomous Vehicles. arXiv 2022, arXiv:2201.10349. [Google Scholar] [CrossRef]
- Yankson, B. Autonomous Vehicle Security Through Privacy Integrated Context Ontology (PICO). In Proceedings of the IEEE International Conference on Systems, Man, and Cybernetics (SMC), Toronto, ON, Canada, 11–14 October 2020. [Google Scholar]
- Haas, R.E.; Möller, D.P.F. Automotive connectivity, cyber attack scenarios and automotive cyber security. In Proceedings of the IEEE International Conference on Electro Information Technology (EIT), Lincoln, NE, USA, 14–17 May 2017. [Google Scholar]
- Yaqub, O.; Li, L. Modeling and Analysis of Connected Traffic Intersections Based on Modified Binary Petri Nets. Int. J. Veh. Technol. 2013. [Google Scholar] [CrossRef]
- Benarbia, T. Contribution à la modélisation et à l’analyse de performances des systèmes de vélos en libre-service en vue de leur régulation: Une Approche basée sur les réseaux de Pétri. Ph.D. Thesis, University of Cergy Pontoise, Cergy, France, 2013. [Google Scholar]
Disclaimer/Publisher’s Note: The statements, opinions and data contained in all publications are solely those of the individual author(s) and contributor(s) and not of MDPI and/or the editor(s). MDPI and/or the editor(s) disclaim responsibility for any injury to people or property resulting from any ideas, methods, instructions or products referred to in the content. |
© 2023 by the authors. Licensee MDPI, Basel, Switzerland. This article is an open access article distributed under the terms and conditions of the Creative Commons Attribution (CC BY) license (https://creativecommons.org/licenses/by/4.0/).