Abstract
The circular-economy-related research has exponentially increased in recent years. The literature shows that circularity indicators represent a timely topic that requires an in-depth analysis. However, the trends and gaps in the literature in the area of the circular economy have not need analysed in depth. This study uses a scientometric analysis as the research methodology to examine the current literature on circularity and circular economic indicators. The publications were extracted from the Web of Science and were published until the end of the third quarter of 2022. The scientometric analysis was conducted using VOSviewer software to map the relationships between the 1117 articles selected on the topic. The findings revealed that the most productive author and university were Jorge de Brito and Delft University of Technology in the Netherlands. The overlay visualisation of the keywords identified a notable shift in research themes from dynamics, frameworks, models, and design in previous years to economy, barriers, and strategies in the current research context. The overlay visualisation of the keywords identified trending research hotspots within the current research context. This study is the first holistic and global overview of circularity and circular economic indicators in the construction context and identifies a critical need for further research to understand circularity and circular economic indicators under co-occurrence analysis conditions. This study offers academics, policymakers, and other circularity activists a guide for future research and valuable insight into circularity and circularity indicator themes.
1. Introduction
The construction industry significantly contributes to construction and demolition waste (CDW) throughout the project life cycle. Despite the industry’s contributions to the national economy of a country and its social well-being, CDW has become a global issue and has created detrimental environmental, economic, and social impacts [1]. The construction industry mostly adopts a “take, make, dispose” or a linear economic approach and is responsible for consuming only around 30% of the natural resources, resulting in 40% of the global waste [2]. Accelerated economic growth leading to urbanisation, which includes new development projects and renovations, has become a source of waste, and the majority is directed to landfills. As a result, the successful integration of economic, social, and environmental objectives has become a challenge [3]. These challenges have stimulated a paradigm shift towards circular economic concepts to attain a trade-off between the above parameters [4].
The circular economy is a promising concept relevant to the United Nation’s Sustainable Development Goals, such as the energy, economic growth, sustainable growth, sustainable consumption and production, climate change, ocean, and life on land goals [5]. A seminal investigation by the Ellen MacArthur Foundation defined the circular economy as “an industrial system that is restorative or regenerative by intention and design” [6] (p. 7). The concept rejects the “take, make, and dispose of” or end-of-life concept and shifts towards improving the design of a business model to use renewable energy, eliminate waste through better design, and remove toxins that prevent reuse. The circular economic concepts such as the closed-loop supply chain [7], cradle-to-cradle [8], reverse logistics [9], performance economy [10], blue economy [11], and industrial symbiosis [12] concepts have been gaining global attention over the past decades as ideal pathways to confront the scarcity of natural resources, global warming, and climate change and are considered drivers of global sustainability [13,14].
The degree of implementation of the circular economy and its functions is monitored and evaluated via the concept of “circularity” [15]. Circularity is defined as “the alignment of a material or energy flow in products, processes, or systems to a set of CE strategies (re-design, product disassembly, recycling, use of renewable energy, etc.) that meet the general CE goals” [16], p. 456. The circularity is tracked, monitored, and measured through the circularity indicators, often referred to as circularity metrics [4,17,18]. The categorisation of circularity indicators extensively differs based on the type of data, the analysis level, and the final application of the results—either qualitatively or quantitatively [16,19] Despite the existence of commonly identified circularity indicators such as reusability, recycling rates, and resource usage, a life cycle assessment (LCA) is a prominent indicator or tool used to quantify and evaluate the circularity in the environmental performance of a system [18,20].
An LCA is adopted when designing circular construction materials and facilitates the identification of benefits or vulnerabilities in construction and demolition waste utilization [21]. Saidani et al. [22] identified nearly 55 circularity indicators, where 18 were based on a life cycle perspective. A systematic literature review by Mesa et al. [23] analysed the use of LCA indicators and their contributions towards the development of the circular economy. Alternatively, Antwi-Afari et al. [24] argued that an LCA could not be used alone as a circularity indicator since it must be used in combination with a material flow analysis (MFA), energy analysis, and input–output analysis to overcome the LCA’s inability to assess the environmental and social aspects. Studies have also suggested the necessity of collectively analysing circularity dimensions, indices, indicators, and assessment approaches to showcase a broader perspective, transparency, cohesiveness, and synergy prior to decision-making [24,25,26]; However, there has been a deficit of identifiable research carried out to create a holistic overview of the circularity indicators to develop a further understanding of research collaborations and trends.
Previous researchers have conducted contextualised reviews related to the circular economy, which were merely limited to analyses of the circular economy concepts and synergies, synthesising the relationships and trends, and which focused on encompassing the impacts on the environment and the economic and social contexts [24,27] (Researchers have highlighted that the CE indicators have often been addressed in different contexts, such as in European, Chinese, or Asia-Pacific regions. Most of the studies have narrowed their perspective by reviewing the CE indicators and their applicability without specifically presenting a detailed overview of the global context as a whole. Hence, there is a compelling need for the circularity indicators to be non-contextualised and to address their requirement in the global context [20].
Among the industries that have contributed to conceptualising and analysing CE and circularity indicators, there has been a significant increase in the scientific contribution to adopting the CE and circularity in the construction industry [14,24]; Despite the numerous attempts to focus on the CE in detail for systematic reviews in the construction context, so far only a few identifiable reviews have been conducted to analyse the gaps in the concept of circularity with a focus on the construction industry [25,28]. In particular, a recent study by Yang et al. [28] used a cross-industry analytic approach in their scientometric analysis to derive future trends relevant to the construction industry. However, regardless of the industry system, there has been no identifiable review that has focused on the global research trends in relation to circularity and circularity indicators as a whole. Therefore, there is a need to analyse the circularity indicators that would be fully applicable to all types of construction to better position the construction industry in the circular economy globally [24,28]. Such an outcome can be used as a guideline for the practical adoption of the CE, irrespective of the contextual limitations.
Based on the above-mentioned limitations of the review articles, this study attempted to address the significant research and methodological gaps identified above. The study aimed to conduct a scientometric analysis to critically evaluate the circularity and circularity indicators in the current global research context and to identify future research trends relevant to construction and the built environment. The research questions developed to guide the research were as follows: (1) How has the concept of circularity and the circularity indicators related to construction and the built environment evolved? (2) Who are the prominent contributors, institutions, and leading research countries within the circularity themes? (3) What are the trends in circularity and circularity indicators in the current global research context relevant to construction and the built environment? The novelty of this study is that it provides the first holistic overview of circularity and the circularity indicators in the global construction and built environment context. Therefore, it provides a broader body of knowledge to serve in the implementation of the circularity concept in the construction sector by identifying globally essential and viable future research trends. The findings and recommendations will further benefit circularity researchers and policymakers in aligning with the current circularity framework and the development of further policies.
The remaining sections of the paper are structured as follows. Section 2 explains the methodology adopted to develop the scientometric analysis in three stages. Section 3 details the scientometric analysis of the identified resources based on a co-authorship and co-keyword analysis and provides a comprehensive discussion of findings. Section 4 presents the findings and provides future research trends as a guide for potential empirical studies.
2. Methodology
A literature review presents a summary of current and historic knowledge, which helps map the published literature in a specific area, identify the potential growth areas for research, and recognise gaps in the body of knowledge [29]. In the process of mapping the past literature, a scientometric analysis is one of the processes that can be used, which was adopted in this study [30,31]. A scientometric analysis is the process of quantitatively analysing the creation, circulation, and use of scientific information so that the process used in scientific research activities can be better understood [32]. A scientometric analysis can be used to analyse the growth of a research area, to identify the journals, institutions, and authors that have contributed, and to identify the significant topics [33,34]. Additionally, the literature review process has different steps or phases. According to Onwuegbuzie et al. [35], the literature review process should contain the exploration, interpretation, and communication phases. In the exploration phase, the reviewer identifies the research topics and beliefs related to philosophy, discipline, and topic; searches for suitable sources through appropriate key terms after explorings potential databases and key terms; stores and organises the information; exclude unsuitable data; and adds more information when required. In the interpretation phase, the reviewer analyses the data, while in the communication phase, the reviewer presents the data in the most suitable format. Based on the literature and approaches adopted by Sweileh et al. [36], Oladinrin et al. [34], and Braun et al. [32], the selected method was adopted, as illustrated in Figure 1.
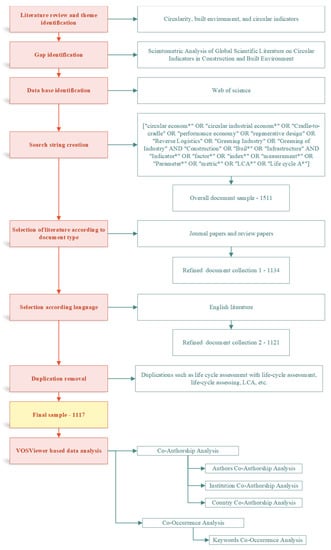
Figure 1.
The research methodology.
2.1. Exploration Phase
During the exploration phase, the analysis of the current literature revealed that the global scientific literature on circularity indicators in construction and the built environment had not been explored through a scientometric analysis, which would show potential growth areas and gaps in the research. It was then identified that the use of Web of Science would be the most suitable database, as it contains journal papers related to the topic. Web of Science, a database provided by the Institute for Scientific Information (ISI), is one the most acceptable sources for bibliometric analyses [37]. The research suggests that Web of Science journal papers are cited more often [38]. Web of Science has the most selective journal coverage as compared to the Scopus and Dimensions databases [39] and contains a thorough collection of quality-controlled and widely used literature sources suitable for scientometric analyses [40].
Using the database Web of Science, a topic search was conducted, whereby we searched the title, abstract, and keywords. After identifying a wide range of keywords along the themes of circularity, the built environment, and circularity indicators as discussed in the introduction section, the following search string was created. [“circular econom*” OR “circular industrial econom*” OR “Cradle-to-cradle” OR “performance economy” OR “regenerative design” OR “Reverse Logistics” OR “Greening Industry” OR “Greening of Industry” AND “Construction” OR “Buil*” OR “Infrastructure” AND “Indicator*” OR “factor*” OR “index*” OR “measurement*” OR “Parameter*” OR “metric*” OR “LCA*” OR “Life cycle A*”]. The predominant themes of circularity and circularity indicators were chosen, such as cradle-to-cradle and regenerative design, but themes with limited focus areas (industrial symbiosis, blue economy, etc.) that would generate out-of-scope results were omitted within the search string. The timeframe for the data mining was chosen as the default within WoS, ranging from 1970 to 2022. Initially, the search removed studies that were not articles or review articles and included those that contained knowledge that was cumulated by researchers according to scientific rigour and evaluated by a peer review process [41] improving the value of the obtained results. The adjusted sample was further refined to remove studies that were not in English.
The search results were downloaded in excel format for better processing. The downloaded results contained duplicated results based on the keywords. These results contained duplications of keywords such as “life cycle assessment” with “life-cycle assessment”, “life cycle assessing”, and “LCA”. The duplications were removed before the analysis was conducted. The results search was completed in October 2022, which created 1117 results.
2.2. Interpretation and Communication Phase
Different types of investigation can be conducted using a scientometric analysis to uncover trends and gaps in the knowledge [32]. On one hand, these types of analysis processes can identify the impact or influence of the research efforts, which is called the yield activity. On the other hand, they can identify the interactions and relationships between the different researchers and different fields through a process called a relationship indicator analyses [42]. VOSviewer software (version 1.6.17) was used to conduct the data analysis for this research, since it is freely available software that can compute both relationship indicator and yield activity analyses. VOSviewer is also able to create graphical representations of the data for better communication. In this research, we conducted a co-authorship analysis, literature coupling analysis, country and institution activity analysis, co-occurrence keyword occurrence analysis, and literature citation analysis. The visualisations obtained from the co-authorship and co-occurrence analyses further showed how research studies related to circularity and circularity indicators have been carried out globally. In the co-authorship analysis, a network visualisation was used; hence, the colour implies the clusters associated with the developing research areas. In co-the occurrence analysis, an overlay visualisation was used; therefore, the colour denotes the most frequent year of publication. In both the co-authorship and co-occurrences analyses, the sizes of the label and the node (the circle) indicate their influence (number of publications), and the node distances indicates the journals’ relatedness to each other.
3. Results and Discussion
A total of 1117 published research articles were obtained after the initial screening and duplication removal process. This sample was considered in the following scientometric analysis. The published articles signify the overall research output related to circularity and circularity indicators in the construction and built environment sector. Figure 2 illustrates the frequency rates at which the articles were published alongside the years, ranging from 2011 to 2022 (third quarter), as well as the articles to be published in 2023. The graph illustrates an exponential curve, which suggests that the research has significantly increased recently in comparison to the early years. The bibliometric data show that there were limited publications, i.e., below 50 articles per year, until 2017. This may have been due to the limited emphasis and focus on circular research during this period of time [43]. However, there was a considerable growth in publications from 2019 to 2022, and the decreases in 2022 and 2023 were due to incomplete bibliometric data records. The mean of the publication count shows a steady exponential growth in the publications within the selected area of this study. Additionally, the mean rate of publication was substantially overtaken by the research published in 2020. This may have been due to several reasons, such as the concept of circularity becoming popular due to policy adaptations and governance measures, such as the UN Sustainable Development Goals [5,43]. One critical takeaway from the study is that the COVID-19 pandemic has had no negative impact on the published research, with the years 2021, 2022 and 2020 having the highest numbers of publications, with 316, 289, and 207 publications, respectively. The trend also implies that the numbers of publications will continue to increase further in 2022–2023 and the following years.
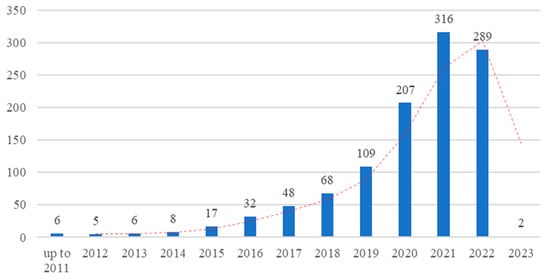
Figure 2.
The frequency of published articles.
3.1. Co-Authorship Analysis
The co-authorship analysis identified scientific collaborations, the underpinning behaviour of the research, and the contributing personnel [25,34]. This type of analysis is predominantly used in identifying the most productive and influential authors, institutions, or organisations and countries [30]. However, the generated network maps can further illustrate the critical trends, prominent collaborations, link strengths, and centrality of the research within the given theme [25]. The analysis provides further insight into the pioneers in the current research context, the future research trends, the context, and the areas of collaboration.
The data were selected using a nominal threshold to facilitate a better understanding and clarity in the visualisation. We also eliminated the level of the contributions to signify the impact of the pioneering studies within the given research theme. Thus, the thresholds selected for each category were different, as the visualisation requires several iterations to obtain the desired clarity. Additionally, articles involving multiple authors, different organisations, and diverse countries were fractionally counted (rather than fully counted) to understand their link strengths, denoting their influence over the research theme [44]. Any elimination or duplication removal was signposted as necessary in the appropriate sections. The sections below provide an in-depth analysis of the data obtained through the co-authorship analysis regarding the most productive authors, institutions, and countries in the research field of circularity and circularity indicators.
3.1.1. Authors
In total, 3862 research authors of a total of 1117 research articles contributed to the theme of circularity and circularity indicators within the construction and built environment sector. For the 3862 authors, duplications were categorised appropriately and any anonymous articles were removed. Subsequently, 45 authors met the threshold of a minimum of 4 documents per author. Table 1 identifies the nine most productive authors with their numbers of publications and citations and their respective link strengths in relation to the threshold. The table also provides the background for each author with their affiliations and country.

Table 1.
The top 9 most productive authors.
Jorge de Brito from the University of Lisbon in Portugal claimed the highest productivity rate, with nine documents with 125 citations and a total link strength of 7.00. The second highest was Yong Geng from Shanghai Jiao Tong University in China, having nine documents with 314 citations and a total link strength of 4.00. Nicholas Chilese and Raufdeen Rameesdeen from the University of South Australia in Australia were tied for third and fourth places, with seven documents with 247 citations and a total link strength of 7.00 each. The results were diverse in nature when considering the most productive authors’ demography, hailing from Europe, China, Australia, and Canada. A critical finding is that there was no identifiable representation for countries such as the USA, UK, and Italy in the most productive authors list, where the circular economy concept is widely practised. Thus, greater initiative needs to be taken in developing research on the circular economy within the construction and built environment context in such countries. Nonetheless, the total link strength in Table 1 indicates a significant lack of collaboration among the authors researching the identified theme. This is further highlighted by the network map provided in Figure 3.
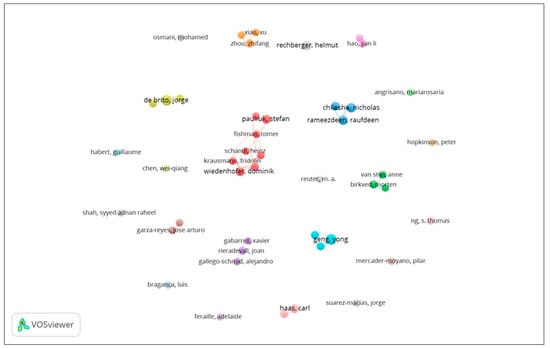
Figure 3.
Network mapping of the most productive authors.
Figure 3 highlights the network mapping of the most productive authors from the co-author analysis. One critical finding from the network map was that there is no considerable collaboration between authors who are significantly research-active within the circularity domain. The data are presented in more of a cluster-based rather than a network-based sequence. This shows a critical lack of research in the global context concerning circularity and circularity indicators and a substantial opportunity for collaboration.
The number for the most collaborative authors within the given dataset was 8, categorised within 2 clusters, as illustrated in Figure 4. These authors collaborated on 15 documents between them, with a threshold of a minimum of 4 documents per author. Even though these were the most collaborative authors, the result does not replicate their work from a global perspective. The current demography and the backgrounds are all predominantly European, and the publications do not reflect the contexts in the USA, Asia, or the Asia-Pacific region. This further indicates the lack of collaboration between authors and active research personnel in developing a global perspective of circularity.
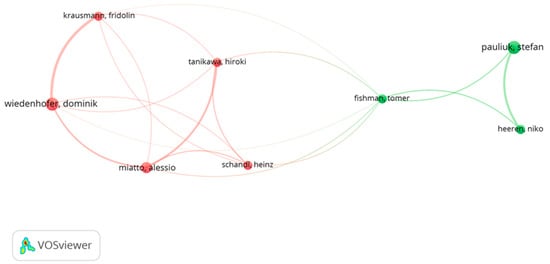
Figure 4.
Network mapping of the most collaborative authors.
3.1.2. Institutions
In total, 1536 institutions were identified from a total of 1117 research articles contributing to the theme of circularity within the construction and built environment field. Of these 1536 institutions, some recognised duplications (i.e., the University of Chinese Academy of Science and Chinese Academy of Science University) were categorised in the appropriate order, and any anonymous institution was removed. Of the 1536 institutions and organisations, only 86 institutions met the threshold of 5 documents per institute. The 10 most productive institutions are shown in Table 2 with their respective numbers of documents, citations, and total link strengths.
Table 2.
The top 10 most productive institutions and organisations.
According to Table 2, the most productive active research institution was identified as Delft University of Technology, Netherlands, with 25 total research documents with 422 citations and a total link strength of 14. The Chinese Academy of Sciences, China, and the Polytechnic University of Milan, Italy, ranked second and third, with 14 research documents each, along with 190 and 511 citations and total link strengths of 16 and 9, respectively. A key takeaway is that the most productive institutions are predominantly based in Europe and China. It is interesting to see that both Europe and China are making a substantial effort to develop research within the circularity theme in the construction and built environment contexts. The existence of circularity and circular economic underpinnings in both European and Chinese governance in implementing circularity initiatives within all levels of production and extensive funds for research into circularity themes could be considered as clear results of this [45,46]. Nonetheless, the level of collaboration is notable, as the network map illustrates in Figure 5, which identifies a cluster-based sequence rather than a network-based sequence.
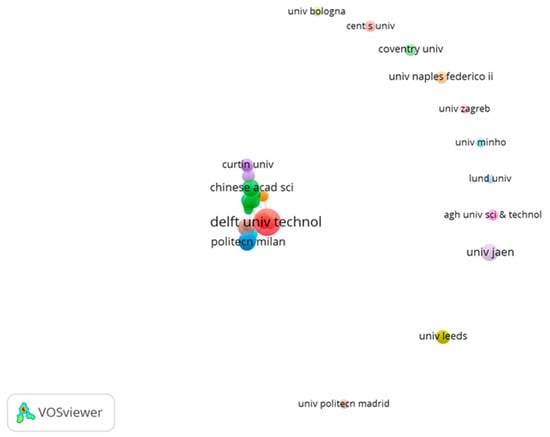
Figure 5.
Network mapping of the most productive institutions.
Figure 5 maps the overall collaborations amongst the most active research institutions from the co-author analysis. As echoed in Section 3.1.1, the network map shows minimal collaboration between institutions that are carrying out research on circularity in the construction and built environment sectors. The critical lack of research in the global context concerning circularity and circularity indicators is identified as a fundamental issue within current academia, and this study highlights a substantial opportunity for collaboration for further developing research on this theme.
Figure 6 illustrates the network mapping of the co-author analysis considering the most collaborated institutions for circularity and circularity indicators derived from Figure 5. Echoing the results from Table 2, the network mapping illustrates that the institutes are predominantly based in Europe and China, and most of the data are skewed towards China (i.e., red, light-blue, and pink clusters), demonstrating a critical research emphasis on circularity and circularity indicators. The network mapping also highlights that the institutes are linked, but no strong relationship was identified globally, considering the collaboration between most clusters. Clusters can be identified between Chinese-oriented institutions as red, light-blue, and pink clusters, representing institutions such as the Chinese Academic of Sciences, Tongi University, Tsinghua University, Hong Kong Polytechnic, and Chongqing University. In contrast, the brown, green, and orange clusters denote mostly European institutions, such as Delft University of Technology, the Polytechnic University of Milan, the Swiss Federal Institute of Technology, the University of Jaén, and the University of Lisbon. However, collaboration is not apparent, as most of the UK, USA, Asia-Pacific, South American, and other Asian institutions require further signposts to enhance the collaboration. These institutions could reflect on the data presented above to obtain a better understanding of the future research collaboration potential with the most prominent institutions.
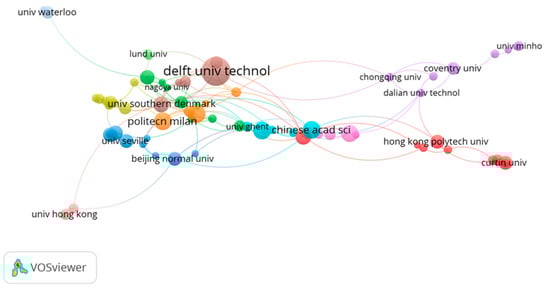
Figure 6.
Network mapping of the most collaborative institutions.
3.1.3. Countries
The data showed that 87 countries contributed to the 1117 research articles selected for the study. However, only 45 countries met the threshold of having a minimum of 7 research articles per country. The top 10 most research-driven countries are listed in Table 3. Notably, China has dominated the research on circularity, with 189 published research articles with 3000 citations and a total link strength of 124. In second place lies Italy, with 135 research articles with 2287 citations and a total link strength of 77. Italy could further improve, as its link strength indicates that even though it has shown significant research output, it must improve its reachability and degree of collaboration to facilitate its global impact. England is in third place with 115 research articles, 2999 citations, and a total link strength of 118. It can also be mentioned that most of the countries listed in Table 3 are developed, considering that China and India are the only two developing nations listed. However, this does not imply a significant lack of research in developing countries, as authors from developed countries can conduct research in developing countries (and vice versa). Nonetheless, the secondary data screenings highlighted a lack of research output from developing countries. There needs to be further research emphasising a regional focus and an analysis of the implications for research output.
Table 3.
The top 10 most research-driven countries.
The network mapping of the most research-prominent countries and their collaborations is shown in Figure 7. There are two distinctive features in the network map; the research output is dominated by China, and there are four main clusters of collaboration throughout the research domain. Firstly, the network map signpost data are shown in Table 3; the biggest contributors can be identified through their size. However, the interesting finding was the demography of the four clusters in the network map.
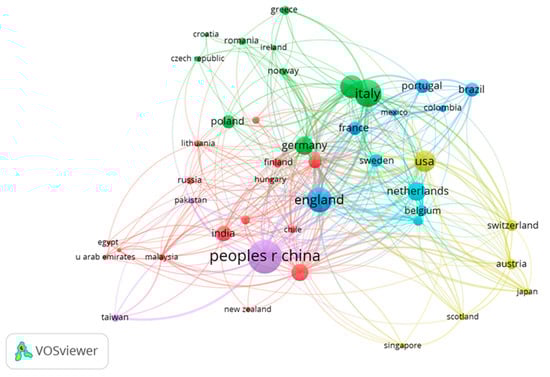
Figure 7.
Network mapping of the most research-oriented countries.
The purple cluster is occupied mostly by China, Taiwan, and Pakistan, collaborating mainly with the red cluster, containing Australia, India, Russia, Finland, New Zealand, Malaysia, and the UAE. The blue cluster predominantly consists of England and other prominent European countries such as France, Portugal, Netherlands, Sweden, and Belgium, as well as South American countries such as Brazil, Colombia, and Mexico. The green cluster denotes other European countries such as Italy, Spain, Germany, Poland, Norway, and Greece, among many others. The final cluster, the yellow, consists of a mixture of countries such as the USA, Switzerland, Austria, Japan, Scotland, and Singapore. The exact level of collaboration between these countries needs to be further researched, as they have different demographic backgrounds and technical and academic underpinnings. Nonetheless, all of these countries could have further improved their contributions by considering their standing and success in terms of circularity implementation through policies, governance, and practice. Even so, a substantial understanding taken from this network map is that the research needs to be more collaborative, irrespective of the clusters identified. More attention must be given to breaking these clusters and taking a globalised approach for enhanced circularity.
3.2. Co-Occurrence: Keywords
Co-occurrence network diagrams provide insight into the frequency at which a particular keyword has occurred over a given timeline. Thus, co-occurrence network mapping has been used for text mining, informetrics, word refining, and standardization purposes [47]. As a result, co-occurrence analyses have been used widely to recognise research gaps, highlight the evolution of research studies, and determine future research trends.
Nonetheless, it is noteworthy that the co-occurrence keyword analysis only focused on the keywords developed by the authors. Thus, the identified keywords were taken in the literal sense and considered to check whether they were related to circularity or circularity indicators; that is, the word “social sustainability” is both a circularity aspect and a predominant factor at the sub-indicator level. In a scientometric analysis, there is no certain way of knowing whether a keyword refers to one aspect or any other.
However, the initial screening identified that the keywords did not consider sub-level indicators, although the authors could have used them according to their own discretion. Thus, the categorisation process was carried out in the literal sense by separating circularity aspects (e.g., social sustainability, performance, reverse logistics) and circularity indicators (e.g., life cycle assessment, reuse potential indicator, end-of-life index).
In total, 5268 keywords were identified from the 1117 overall research articles selected in the research domain of circularity in the construction and built environment context. However, out of these 5268, only 33 keywords met the threshold of a minimum of 40 occurrences per keyword. The top 10 most popular keywords are listed in Table 4. Of the many available keywords, “circular economy”, “life cycle assessment”, “sustainability”, “management”, and “construction” can be deemed the most popular. However, it should be noted that circular economy, life cycle assessment, and construction were key aspects within the search criteria. Still, “circular economy” as a keyword has a substantial influence over the current research domain, as it had 623 occurrences and a total link strength of 1677.
Table 4.
The top 10 most popular keywords.
Figure 8 illustrates the keywords that can be interpreted as being prominent research areas, reflecting their occurrence rates per year as an average. The keywords in and around the colour purple occurred before mid-2019, whereas those that occurred in mid-2019 is represented in blue, from late 2019 are shown in aqua, from 2020 in green, and from mid-2020 and above in yellow. The timeline was based on the occurrence of keywords within a given span of years. It can be observed that there was no significant change to the frequency of research beyond mid-2019 and above mid-2020.
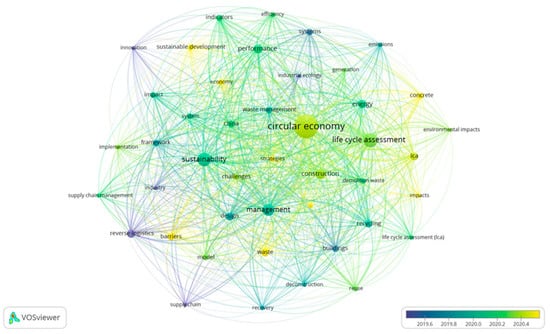
Figure 8.
An overlay visualisation of the most popular keywords.
The overlay visualisation categorises keywords such as circular economics, sustainable development, economy, strategies, waste, and barriers as the current research hotspots within the given theme. Keywords such as life cycle assessment, management, sustainable development, energy, systems, design, supply chain management, reuse, energy, and environment impacts are not currently used within circular economic research in the construction and built environment sectors. However, the study identified that the most outdated research hotspots were industrial ecology, innovation, and buildings. The data highlight some critical takeaways from the co-occurrence network mapping, as below. Current inclinations in sustainable concepts, circular economics and using circularity in-dicators as life cycle assessment are becoming popular, and the obtained data confirm the current research trends. Additionally, it can be noted that the research trends shown in blue, such as reverse logistics, have significant underpinnings with the links made with the current research trends. Even though supply chain management is considered a centralised concept with the concept of circularity, the network visualisation suggests otherwise, since the node is located remotely in the overlay visualisation. Another significant finding is the lack of a “social” focus in the context of circularity, since a very limited number of nodes related to social sustainability aspects can be found within Figure 8.
In contrast with Figure 8, Figure 9 illustrates the keywords eliminating any phrases that appear in the search link. The research trends and hot topics highlighted from the overlay visualisation in Figure 9 reiterate the findings from Figure 8. The trends show that the research focuses were dynamic in the early years and have shifted more towards identifying barriers and strategies to enhance circularity in the current stage. However, there were some critical findings from the visualisation: (1) The research lacks focus on the material context, as concrete is the only keyword listed in Figure 8 and Figure 9. As the construction and built environment sectors as a whole are accountable for mass-level material consumption and waste, more research must be presented to recognise the level of circularity of the material used within the sector. (2) Within the identifiable body of knowledge, we could not recognise an emphasis on circularity indicators or circular functions, which could be attributed to a lack of focus on a proper understanding of circularity indicator functions.
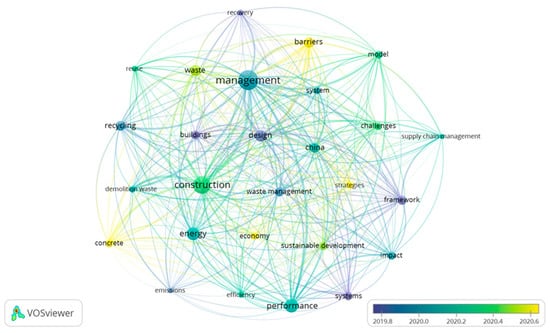
Figure 9.
An overlay visualisation of the most popular keywords (without search link keywords).
The only highlighted indicator was the lifecycle analysis, and no other circularity indicator was signposted within the visualisation or the dataset. It could be either that authors refrain from using sub-level indicators in their keywords or there is a limited focus on sub-indicator levels within the identified body of knowledge. This needs to be further addressed by the prominent authors and implemented as best practice going forwards. Additionally, most of the other sectors, such as production, agriculture, and energy, are utilisation indicators developed to understand the level of circularity and further enhance circularity in the relevant sectors. However, as per the overlay visualisation, there is an need to implement such circularity indicators within the construction and built environment sector in order to analyse and improve the sector. In alignment with the literature review, further research must be undertaken to provide a holistic understanding of the nature of the circularity indicators made available and the functions aligning with indicators and sub-indicators within the circularity context.
4. Conclusions and Future Research Trends
This study was the first to perform an objective analysis of the globalised literature on circularity and circularity indicators in the construction and built environment context. The study aim was to conduct a scientometric analysis to present the current research emerging on the circularity and circularity indicators in construction and the built environment. A total of 1117 articles ranging from 1970 to 2022 were obtained via filtration and duplicate removal as the dataset for the analysis. The articles represented a total of 87 countries, 1536 institutions, and 3862 research authors. There were a very low number of publications until 2017, as the popularity of the circularity topic in construction and the built environment increased after 2010. Then, a significant increase in publications was recognised from 2018, due to the development of the United Nation’s Sustainable Development Goals, circular policies, and circularity adaptations through governance [5,43]. The number of publications was highest during recent years, i.e., from 2021, and it is noteworthy that the COVID pandemic had no negative impact on the frequency of publications. Jorge de Brito from the University of Lisbon in Portugal was identified as the most productive author. Delft University of Technology in the Netherlands was recognised as the most productive organisation in publishing research along the themes of circularity and circularity indicators within the construction and built environment sector. The co-occurrence analysis identified research hotspots and trends for further investigation. The study identified that the research focus shifted from dynamics, framework, models, and design in the past, to economy, barriers, and strategies in the current research context. However, two critical findings were obtained from the analysis. Firstly, more material-centric research needs to be carried out, as concrete was the only item related to the material listed in the overlay visualisation. As the construction and built environment sector involves the use of significant amounts of materials in its processes, more research should be conducted to further strengthen the material-focused research themes. Secondly, very limited indicators were recognised apart from the lifecycle assessment. As there are many circularity indicators, the analysis showed that the construction and built environment field is yet to incorporate such indicators within the sector.
The theoretical implications suggest that the study makes a substantial contribution to the body of knowledge by providing a holistic investigation of the concepts of “circularity” and “circularity indicators” in the global construction context. The study was performed to assess and review influential journal articles on the above concepts to understand the evolution and current context underpinning the research in the construction and built environment sector. The findings can help academics to identify pioneers and potential collaborators in the same research field, which could enable knowledge sharing and initiate new research collaborations.
In addition to the significant research implications, the practical implications provide a global snapshot of the literature, encouraging industry practitioners and circularity activists to collaborate at the micro- and macrolevels and to prioritise current or future research trends within the theme. The countries that are actively following the circularity domain and the countries that can be influenced are clearly identified. The European Union has greater potential to influence countries to encourage circularity. The research provides a clear guide for practitioners in developing countries to understand how those countries can be benefited by developing micro- and macrolevel networks. The highlighted trends can be used by developing countries when designing operations to enable circularity. For example, the guidelines for China and the European Union could be referenced to amend expired and existing policies. Policymakers could also develop new guidelines and policies by understanding the global trends related to circularity indicators. Conclusively, academics, researchers, and other relevant practitioners must initiate new grant schemes enabling further research on the trending topics, and in doing so academics, industrial circularity practitioners, policymakers, and ordinary individuals can benefit as a whole.
Limitations and Future Research Directions
Based on the results, this section presents the limitations of the study and the future research directions, as illustrated in Figure 10.
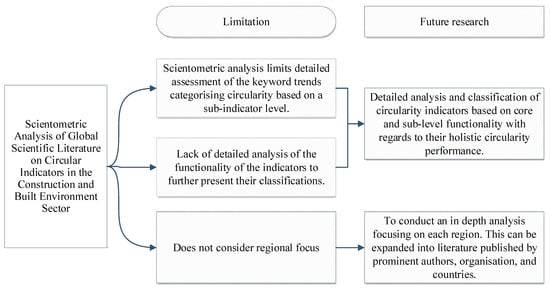
Figure 10.
The research limitations and relevant future research directions.
This research was based on the globally published literature; thus, this research did not have a regional focus. The research was implemented using high-level information such as a keyword analysis and should only be used as a guide for further research. One of the main limitations of the study was assessing the keyword trends at the sub-indicator level, as this was outside the scope and was not the intention of this study. Furthermore, the scientometric analysis did not provide detailed information on the functionality of the indicators to further allow their classification. Therefore, further research needs to be carried out to understand the implications of sub-level indicators in the context of circularity. Additionally, the study highlights the dynamics accounting for the bibliometric importance of the articles using traditional metrics. Bibliometric indices are always used to perform analyses retrospectively, which is considered a limitation of this study.
An in-depth analysis is required to address the co-citation and co-occurrence trends identified by the scientometric analysis developed in this study. Thus, our recommendations are that the future research studies involve a detailed analysis and classification of circularity indicators based on core and sub-level functionality with regards to their holistic circularity performance, and that an in-depth analyses focusing on each region are conducted. This study could be expanded into the literature published by prominent authors, organisations, and countries in order predict future research trends and potential gaps related to circular economic indicators.
Author Contributions
Conceptualisation, R.K., R.S.J. and K.G.; methodology, R.K., R.S.J. and K.G.; software, K.G.; validation, R.K., R.S.J. and K.G.; formal analysis, K.G.; data curation, R.K., R.S.J. and K.G.; writing—original draft preparation, R.K., R.S.J. and K.G.; writing—review and editing, R.K., R.S.J. and K.G.; visualisation, K.G.; supervision, R.K., R.S.J. and K.G. All authors have read and agreed to the published version of the manuscript.
Funding
This research received no external funding.
Institutional Review Board Statement
Not applicable.
Informed Consent Statement
Not applicable.
Data Availability Statement
Not applicable.
Conflicts of Interest
The authors declare no conflict of interest.
References
- Chen, K.; Wang, J.; Yu, B.; Wu, H.; Zhang, J. Critical evaluation of construction and demolition waste and associated environmental impacts: A scientometric analysis. J. Clean. Prod. 2021, 287, 125071. [Google Scholar] [CrossRef]
- Benachio, G.L.F.; do Carmo Duarte Freita, M.; Tavares, S.F. Circular economy in the construction industry: A systematic literature review. J. Clean. Prod. 2020, 260, 121046. [Google Scholar] [CrossRef]
- Luis, E.C.; Celma, D. Circular economy. A review and bibliometric analysis. Sustainability 2020, 12, 6381. [Google Scholar] [CrossRef]
- Rossi, E.; Bertassini, A.C.; dos Santos Ferreira, C.; do Amaral, W.A.N.; Ometto, A.R. Circular economy indicators for organisations considering sustainability and business models: Plastic, textile and electro-electronic cases. J. Clean. Prod. 2020, 247, 119137. [Google Scholar] [CrossRef]
- United Nations. Department of Economic and Social Affairs United Nation’s Sustainable Development Goals. 2022. Available online: https://sdgs.un.org/goals (accessed on 15 October 2022).
- Ellen MacArthur Foundation. Towards the circular economy: Economic and business rationale for an accelerated transition. 2013. Available online: https://ellenmacarthurfoundation.org/towards-the-circular-economy-vol-1-an-economic-and-business-rationale-for-an (accessed on 16 October 2022).
- Bhattacharjee, S.; Cruz, J. Economic sustainability of closed loop supply chains: A holistic model for decision and policy analysis. Decis. Support Syst. 2015, 77, 67–86. [Google Scholar] [CrossRef]
- McDonough, W.; Braungart, M. Cradle to Cradle: Remaking the Way We Make Things; North Point Press: New York, NY, USA, 2002. [Google Scholar]
- Agrawal, S.; Singh, R.K.; Murtaza, Q. A literature review and perspectives in reverse logistics. Resour. Conserv. Recycl. 2015, 97, 76–92. [Google Scholar] [CrossRef]
- Stahel, W. The Performance Economy; Springer: Berlin/Heidelberg, Germany, 2010. [Google Scholar]
- Geisendorf, S.; Pietrulla, F. The circular economy and circular economic concepts—A literature analysis and redefinition. Thunderbird Int. Bus. Rev. 2018, 60, 771–782. [Google Scholar] [CrossRef]
- Kerdlap, P.; Low, J.S.C.; Ramakrishna, S. Life cycle environmental and economic assessment of industrial symbiosis networks: A review of the past decade of models and computational methods through a multi-level analysis lens. Int. J. Life Cycle Assess. 2020, 2, 1660–1679. [Google Scholar] [CrossRef]
- Osobajo, O.A.; Oke, A.; Omotayo, T.; Obi, L.I. A systematic review of circular economy research in the construction industry. Smart Sustain. Built Environ. 2020, 11, 39–64. [Google Scholar] [CrossRef]
- Hossain, M.U.; Ng, S.T.; Antwi-Afari, P.; Amor, B. Circular economy and the construction industry: Existing trends, challenges and prospective framework for sustainable construction. Renew. Sustain. Energy Rev. 2020, 130, 109948. [Google Scholar] [CrossRef]
- Linder, M.; Sarasini, S.; van Loon, P. A Metric for Quantifying Product-Level Circularity. J. Ind. Ecol. 2017, 21, 545–558. [Google Scholar] [CrossRef]
- de Oliveira, C.T.; Mônica, M.M.M.; Campos, L.M.S. Understanding the Brazilian expanded polystyrene supply chain and its reverse logistics towards circular economy. J. Clean. Prod. 2019, 235, 562–573. [Google Scholar] [CrossRef]
- Zore, Ž.; Čuček, L.; Kravanja, Z. Synthesis of sustainable production systems using an upgraded concept of sustainability profit and circularity. J. Clean. Prod. 2018, 201, 1138–1154. [Google Scholar] [CrossRef]
- Saadé, M.; Erradhouani, B.; Pawlak, S.; Appendino, F.; Peuportier, B.; Roux, C. Combining circular and LCA indicators for the early design of urban projects. Int. J. Life Cycle Assess. 2022, 27, 1–19. [Google Scholar] [CrossRef]
- Albæk, J.K.; Shahbazi, S.; McAloone, T.C.; Pigosso, D.C.A. Circularity evaluation of alternative concepts during early product design and development. Sustainability 2020, 12, 9353. [Google Scholar] [CrossRef]
- Moraga, G.; Huysveld, S.; Mathieux, F.; Blengini, G.A.; Alaerts, L.; van Acker, K.; de Meester, S.; Dewulf, J. Circular economy indicators: What do they measure? Resour. Conserv. Recycl. 2019, 146, 452–461. [Google Scholar] [CrossRef]
- Sassanelli, C.; Rosa, P.; Rocca, R.; Terzi, S. Circular economy performance assessment methods: A systematic literature review. J. Clean. Prod. 2019, 229, 440–453. [Google Scholar] [CrossRef]
- Saidani, M.; Yannou, B.; Leroy, Y.; Cluzel, F.; Kendall, A. A taxonomy of circular economy indicators. J. Clean. Prod. 2019, 207, 542–559. [Google Scholar] [CrossRef]
- Mesa, J.A.; Fúquene, C.E.; Maury-Ramírez, A. Life cycle assessment on construction and demolition waste: A systematic literature review. Sustainability 2021, 13, 7676. [Google Scholar] [CrossRef]
- Antwi-Afari, P.; Ng, S.T.; Hossain, M.U. A review of the circularity gap in the construction industry through scientometric analysis. J. Clean. Prod. 2021, 298, 126870. [Google Scholar] [CrossRef]
- Martinho, V.D.; Mourão, P.R. Circular economy and economic development in the European Union: A review and bibliometric analysis. Sustainability 2020, 12, 7767. [Google Scholar] [CrossRef]
- Rufí-Salís, M.; Petit-Boix, A.; Villalba, G.; Gabarrell, X.; Leipold, S. Combining LCA and circularity assessments in complex production systems: The case of urban agriculture. Resour. Conserv. Recycl. 2021, 166, 105359. [Google Scholar] [CrossRef]
- Geissdoerfer, M.; Savaget, P.; Bocken, N.M.P.; Hultink, E.J. The Circular Economy—A new sustainability paradigm? J. Clean. Prod. 2017, 143, 757–768. [Google Scholar] [CrossRef]
- Yang, Y.; Guan, J.; Nwaogu, J.M.; Chan, A.P.C.; Chi, H.-l.; Luk, C.W.H. Attaining higher levels of circularity in construction: Scientometric review and cross-industry exploration. J. Clean. Prod. 2022, 375, 133934. [Google Scholar] [CrossRef]
- Aromataris, E.; Pearson, A. The systematic review: An overview. Am. J. Nurs. 2014, 114, 53–58. [Google Scholar] [CrossRef]
- Zhong, B.; Wu, H.; Li, H.; Sepasgozar, S.; Luo, H.; He, L. A scientometric analysis and critical review of Construction Related Ontology Research. Autom. Constr. 2019, 101, 17–31. [Google Scholar] [CrossRef]
- Abusaada, H.; Elshater, A. Notes on Developing Research Review in urban planning and urban design based on Prisma statement. Soc. Sci. 2022, 11, 391. [Google Scholar] [CrossRef]
- Braun, T.; Bujdosó, E.; Schubert, A. Literature of Analytical Chemistry: A Scientometric Evaluation, 1st ed.; Taylor & Francis, CRC Press: Boca Raton, FL, USA, 1987. [Google Scholar] [CrossRef]
- Mooghali, A.; Karami, N.; Alijani, R.; Khasseh, A. Scientometric analysis of the scientometric literature. Int. J. Inf. Sci. Manag. Scientometr. 2012, 9, 19–31. [Google Scholar]
- Oladinrin, O.; Gomis, K.; Jayantha, W.; Obi, L.; Rana, M. Scientometric Analysis of Global Scientific Literature on Aging in Place. Int. J. Environ. Res. Public Health 2021, 18, 12468. [Google Scholar] [CrossRef]
- Onwuegbuzie, A.J.; Frels, R.; Onwuegbuzie, A.J. Seven Steps to a Comprehensive Literature Review: A Multimodal and Cultural Approach, 1st ed.; Steele, M., Ed.; Sage Publications: Thousand Oaks, CA, USA, 2016; Volume 21. [Google Scholar] [CrossRef]
- Sweileh, W.M.; Al-jabi, S.W.; Abutaha, A.S.; Zyoud, S.H.; Anayah, F.M.A.; Sawalha, A.F. Bibliometric analysis of worldwide scientific literature in mobile-health: 2006–2016. BMC Med. Inform. Decis. Mak. 2017, 17, 72. [Google Scholar] [CrossRef]
- Franceschet, M. A comparison of bibliometric indicators for computer science scholars and journals on Web of Science and Google Scholar. Scientometrics 2010, 83, 243–258. [Google Scholar] [CrossRef]
- Marx, W.; Bornmann, L. On the causes of subject-specific citation rates in Web of Science. Scientometrics 2015, 102, 1823–1827. [Google Scholar] [CrossRef]
- Singh, V.K.; Singh, P.; Karmakar, M.; Leta, J.; Mayr, P. The journal coverage of Web of Science, Scopus and Dimensions: A comparative analysis. Scientometric 2021, 126, 5113–5142. [Google Scholar] [CrossRef]
- Lv, W.; Zhao, X.; Wu, P.; Lv, J.; He, H. A scientometric analysis of worldwide intercropping research based on web of science database between 1992 and 2020. Sustainability 2021, 13, 2430. [Google Scholar] [CrossRef]
- Vanderstraeten, R. Scholarly communication in education journals. Soc. Sci. Hist. 2011, 35, 109–130. [Google Scholar] [CrossRef]
- Ramos-Rodríguez, A.-R.; Ruíz-Navarro, J. Changes in the intellectual structure of strategic management research: A bibliometric study of the Strategic Management Journal 1980–2000. Strateg. Manag. J. 2004, 25, 981–1004. [Google Scholar] [CrossRef]
- Venkatesh, G. Circular Bio-economy—Paradigm for the Future: Systematic Review of Scientific Journal Publications from 2015 to 2021. Circ. Econ. Sustain. 2021, 2, 231–279. [Google Scholar] [CrossRef]
- Waltman, L.; van Eck, N.J. Field-normalised citation impact indicators and the choice of an appropriate counting method. J. Informetr. 2015, 9, 872–894. [Google Scholar] [CrossRef]
- Mhatre, P.; Panchal, R.; Singh, A.; Bibyan, S. A systematic literature review on the circular economy initiatives in the European Union. Sustain. Prod. Consum. 2021, 26, 187–202. [Google Scholar] [CrossRef]
- Yong, R. The circular economy in China. J. Mater. Cycles Waste Manag. 2007, 9, 121–129. [Google Scholar] [CrossRef]
- Sedighi, M. Application of word co-occurrence analysis method in mapping of the scientific fields (case study: The field of Informetrics). Libr. Rev. 2016, 65, 52–64. [Google Scholar] [CrossRef]
Disclaimer/Publisher’s Note: The statements, opinions and data contained in all publications are solely those of the individual author(s) and contributor(s) and not of MDPI and/or the editor(s). MDPI and/or the editor(s) disclaim responsibility for any injury to people or property resulting from any ideas, methods, instructions or products referred to in the content. |
© 2022 by the authors. Licensee MDPI, Basel, Switzerland. This article is an open access article distributed under the terms and conditions of the Creative Commons Attribution (CC BY) license (https://creativecommons.org/licenses/by/4.0/).