
Managing Resources Based on Influential Indicators for Sustainable Economic Development: A Case Study in Serbia


Abstract
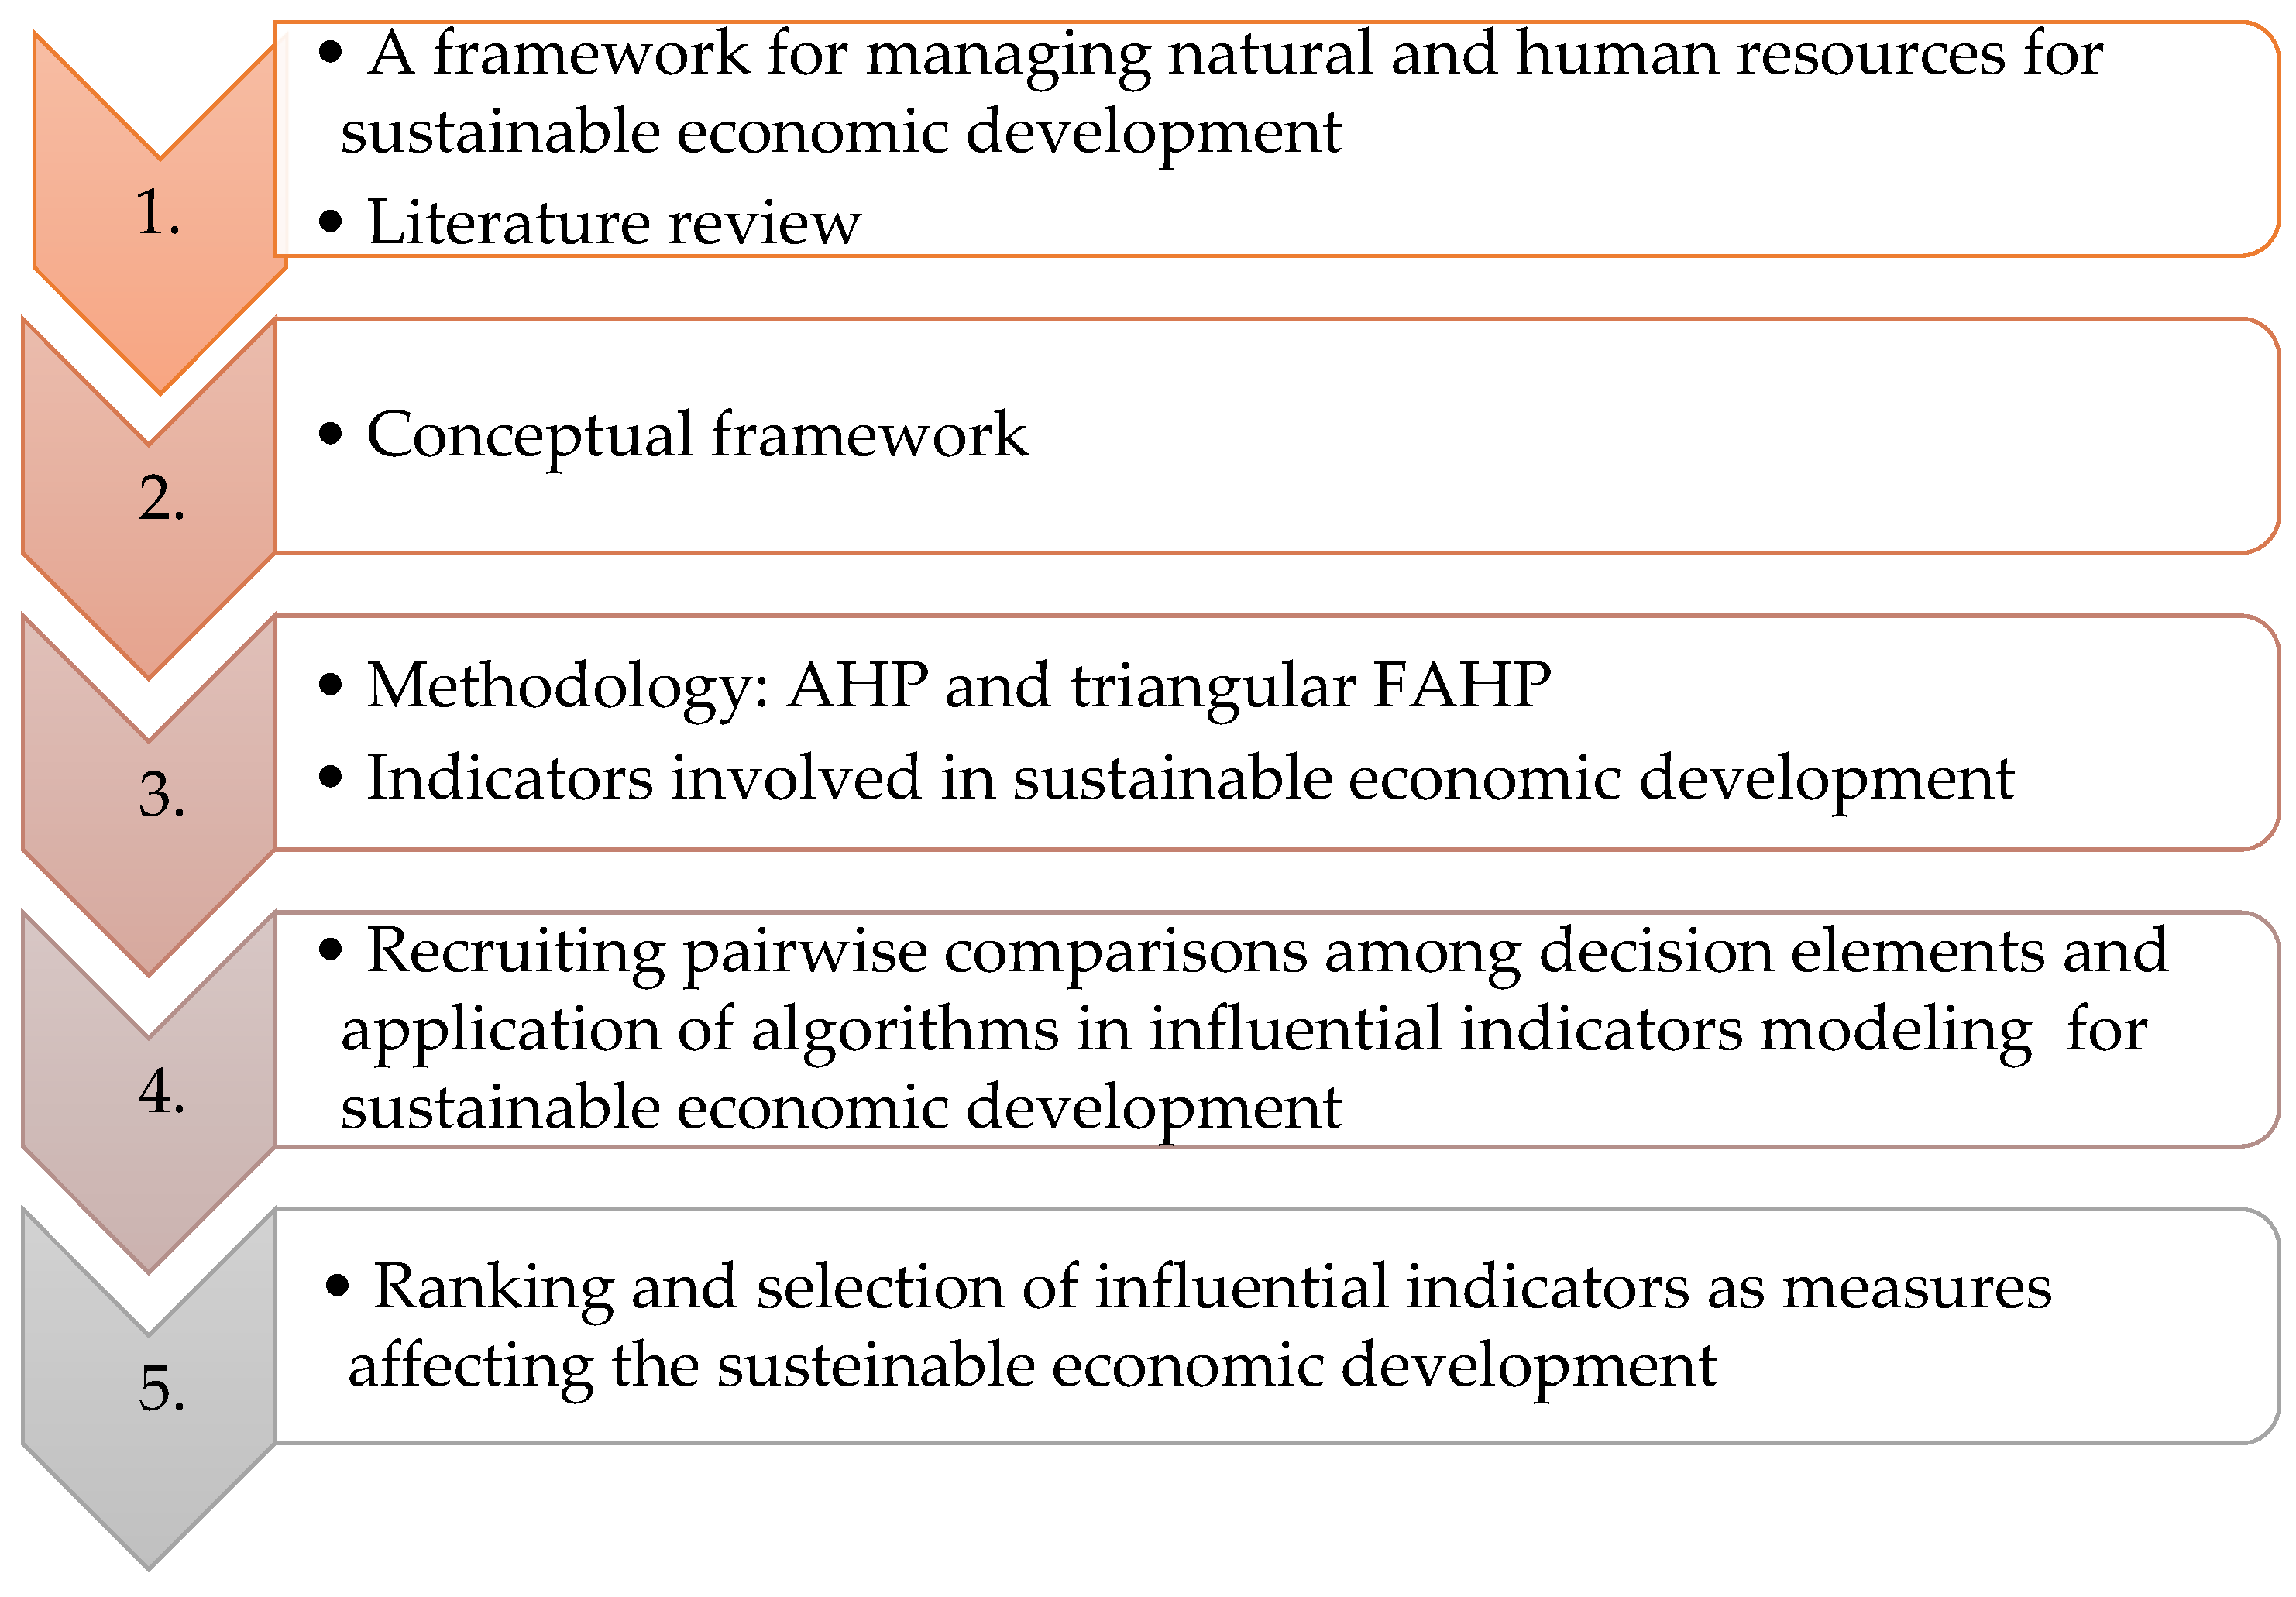
1. Introduction and Literature Review
2. Conceptual Framework
3. Materials and Methods
- (1)
- Establishing a hierarchy by decomposing the problem of decision-making.
- (2)
- Creating comparison matrices by performing pairwise comparisons.
- (3)
- Calculation of weights and consistency of comparisons.
- (4)
- Aggregation of weights to obtain results and ranking of alternatives.
3.1. Triangular Fuzzy Numbers and Fuzzy AHP Method
- Addition:
- Subtraction:,
- Multiplication:
- Inverse:
- Division:
- Scalar multiplication:.
- (1)
- Establishing the main goal and the criteria and sub-criteria contributing to the overall goal; developing the problem hierarchy.
- (2)
- Obtaining the fuzzy comparison matrices. A pairwise comparison has been made using a fuzzified evaluation scale. Using triangular fuzzy numbers, we form a comparison matrix for a fuzzy comparison of criteria by pairs, where is a fuzzy value that expresses the relative importance of one criterion to another. At the diagonal, the fuzzy values express the relative importance of the criterion to itself. Because of that, we put that The aggregation of different experts’ opinions is calculated by the averaging method. Based on the corresponding linguistic assessments of k experts , aggregated crisp value has been obtained by rounding to the nearest integer. The corresponding fuzzy number value of the aggregate opinion is then obtained.
- (3)
- Examination of the comparison matrix consistency. We calculate the consistency index and consistency ratio for matrix by , , where represents the maximal eigenvalues, and RI is an accepted random index of a matrix . The value implies that we accept evaluated fuzzy elements of the matrix, while otherwise, we must remove the reasons for undesirably high estimations and repeat comparison in pairs until the degree of consistency belongs to desirable limits.
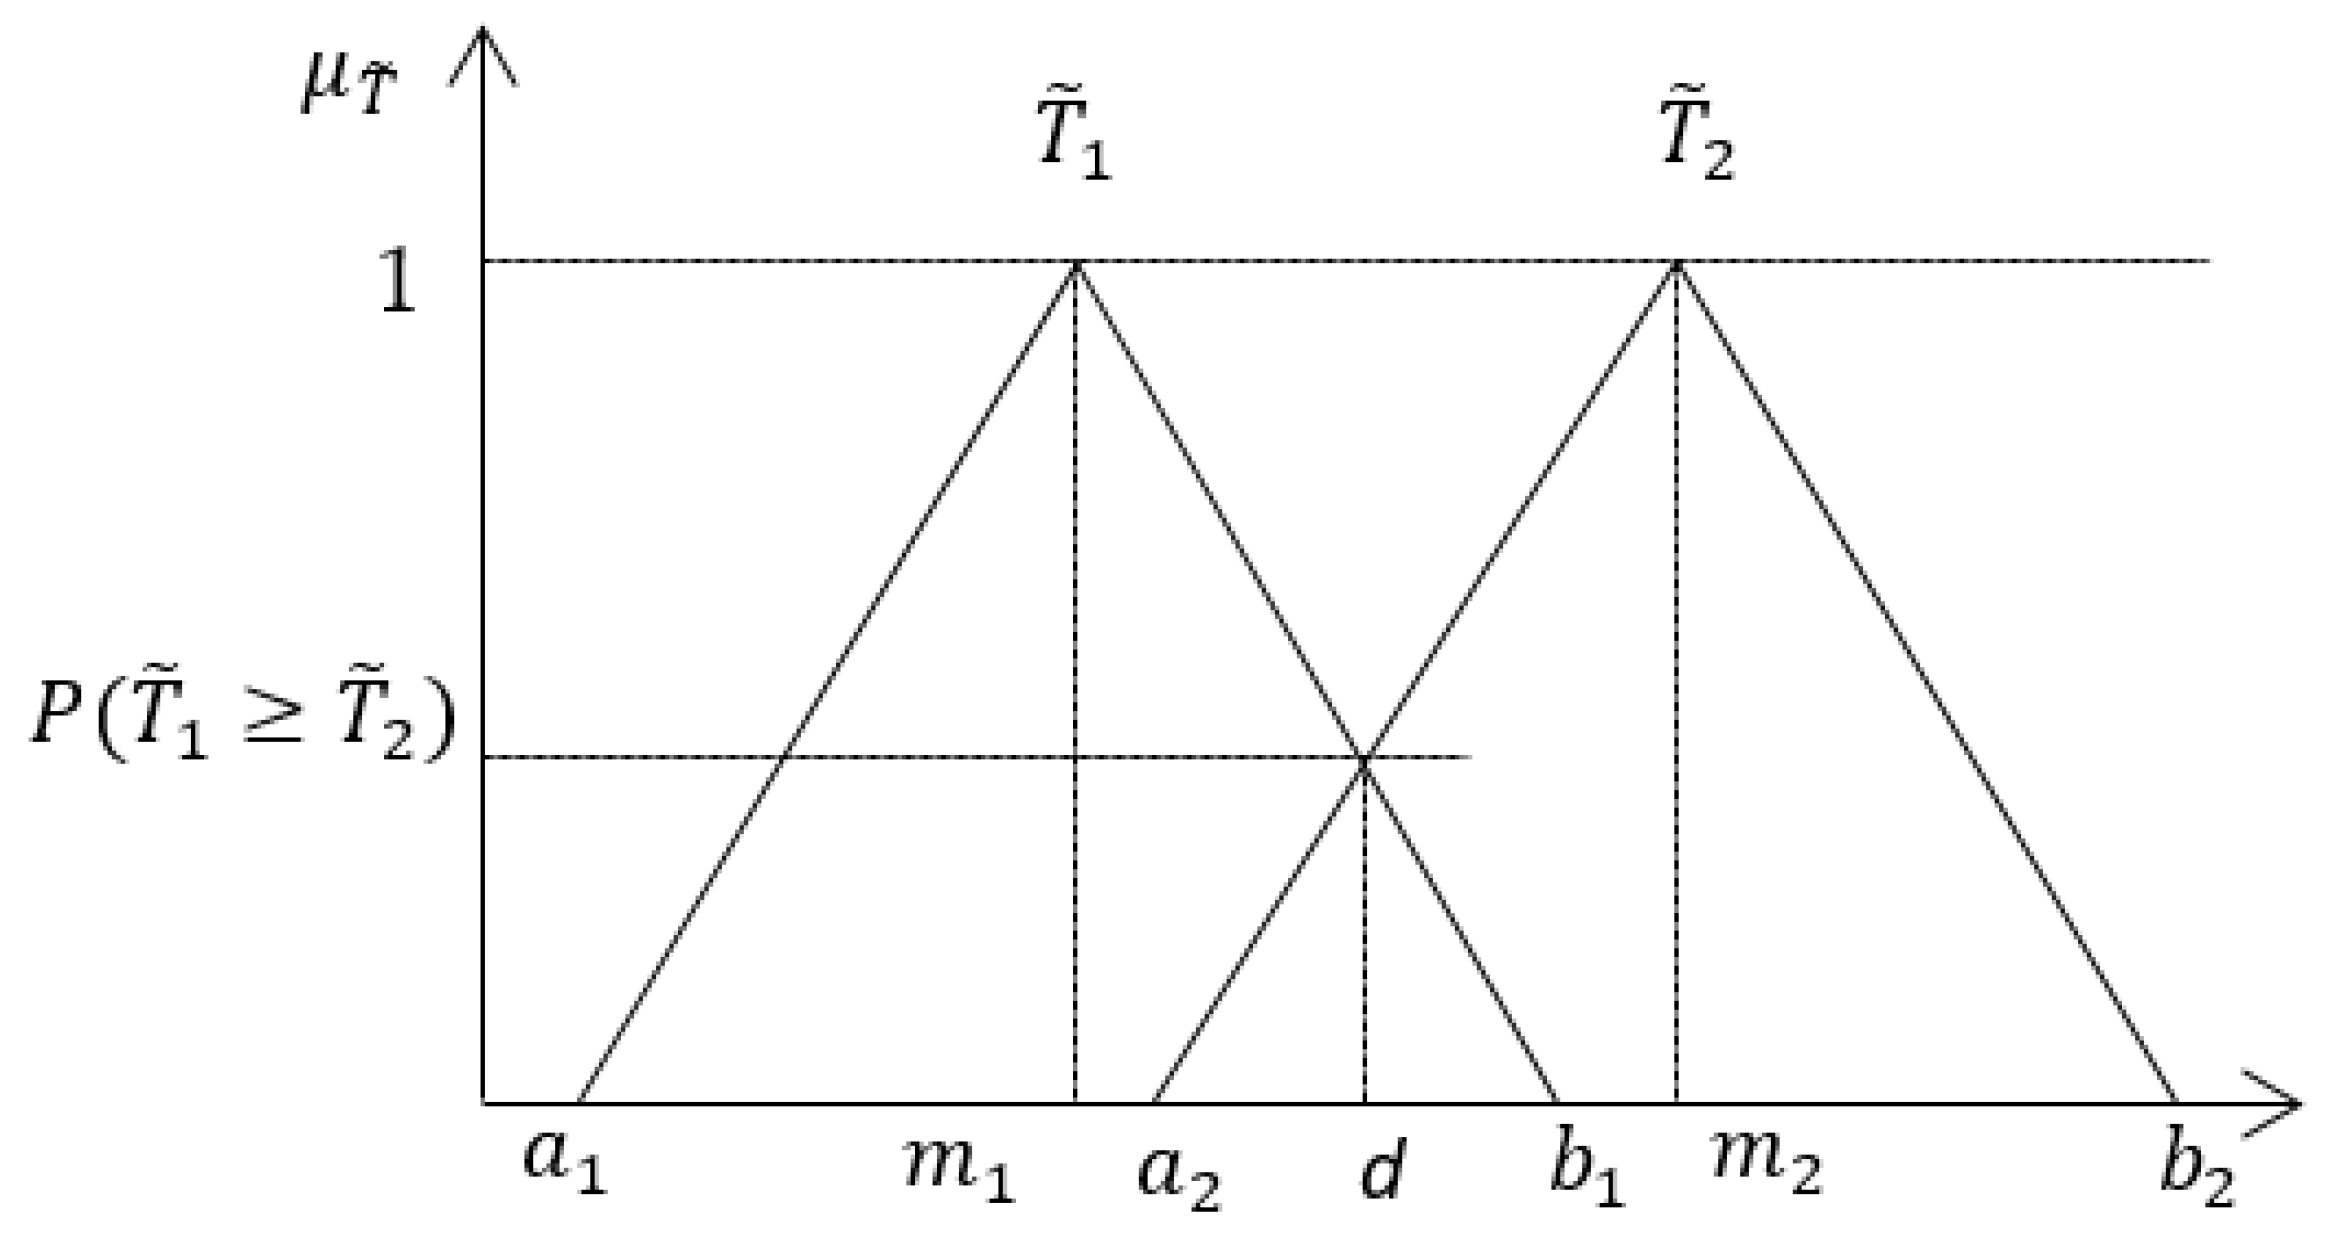
- (4)
- The fuzzy synthetic extents determination. The synthetic triangular fuzzy numbers have been calculated, according to Chang’s extent analysis method, by using triangular fuzzy numbers from the matrix :
3.2. Considering Indicators for the Sustainable Economic Development
4. Results and Discussion
5. Conclusions
Author Contributions
Funding
Institutional Review Board Statement
Informed Consent Statement
Data Availability Statement
Acknowledgments
Conflicts of Interest
Appendix A

| S1 | S2 | S3 | S4 | S5 | ||||||
|---|---|---|---|---|---|---|---|---|---|---|
| S1 | E | 0.372998 | 0.407067 | 0.412316 | 0.426412 | 0.458904 | ||||
| S2 | E | E | 0.24581 | 0.217634 | 0.211868 | 0.196386 | 0.184391 | |||
| S3 | E | 0.225686 | 0.192363 | 0.191169 | 0.187963 | 0.184391 | ||||
| S4 | E | 0.114065 | 0.110957 | 0.113216 | 0.119281 | 0.106287 | ||||
| S5 | E | 0.041441 | 0.071978 | 0.071430 | 0.069958 | 0.0660273 |
| S11 | S12 | S13 | ||||||
|---|---|---|---|---|---|---|---|---|
| S11 | E | 0.469703 | 0.529412 | 0.521753 | 0.502793 | 0.539615 | ||
| S12 | E | 0.335539 | 0.298349 | 0.303927 | 0.317737 | 0.296961 | ||
| S13 | E | 0.194758 | 0.172240 | 0.174320 | 0.179469 | 0.163424 |
| S21 | S22 | S23 | S24 | S25 | S26 | ||||||
|---|---|---|---|---|---|---|---|---|---|---|---|
| S21 | 0.185275 | 0.176969 | 0.172707 | 0.161515 | 0.153574 | ||||||
| S22 | 0.235335 | 0.261599 | 0.262923 | 0.266398 | 0.273782 | ||||||
| S23 | 0.049273 | 0.058989 | 0.059074 | 0.059296 | 0.056289 | ||||||
| S24 | 0.117913 | 0.101658 | 0.100503 | 0.097470 | 0.088998 | ||||||
| S25 | 0.176870 | 0.158077 | 0.157289 | 0.155218 | 0.153574 | ||||||
| S26 | 0.235335 | 0.242707 | 0.247505 | 0.260101 | 0.273782 |
| S31 | S32 | S33 | S34 | ||||||
|---|---|---|---|---|---|---|---|---|---|
| S31 | 0.263272 | 0.236521 | 0.225833 | 0.203452 | 0.199916 | ||||
| S32 | 0 | 0.081199 | 0.083232 | 0.087490 | 0.081531 | ||||
| S33 | 0.368364 | 0.361858 | 0.361721 | 0.361435 | 0.359276 | ||||
| S34 | 0.368364 | 0.320422 | 0.329213 | 0.347623 | 0.359276 |
| S41 | S42 | S43 | S44 | ||||||
|---|---|---|---|---|---|---|---|---|---|
| S41 | 0.225915 | 0.190410 | 0.194622 | 0.206108 | 0.18906 | ||||
| S42 | 0.312898 | 0.367517 | 0.361595 | 0.345444 | 0.350913 | ||||
| S43 | 0.312898 | 0.321785 | 0.324043 | 0.330201 | 0.350913 | ||||
| S44 | 0.148289 | 0.120288 | 0.119741 | 0.118247 | 0.109114 |
| S51 | S52 | S53 | S54 | S55 | S56 | ||||||
|---|---|---|---|---|---|---|---|---|---|---|---|
| S51 | 0.250825 | 0.235493 | 0.231698 | 0.222953 | 0.232901 | ||||||
| S52 | 0.309864 | 0.313714 | 0.317928 | 0.327637 | 0.366723 | ||||||
| S53 | 0.178903 | 0.161625 | 0.161192 | 0.160196 | 0.138193 | ||||||
| S54 | 0.159103 | 0.145126 | 0.148022 | 0.154696 | 0.138193 | ||||||
| S55 | 0.101304 | 0.106154 | 0.102018 | 0.092487 | 0.0838608 | ||||||
| S56 | 0 | 0.037887 | 0.039141 | 0.042030 | 0.0401283 |
| E1 | E2 | E3 | ||||||
|---|---|---|---|---|---|---|---|---|
| E1 | 0.394737 | 0.445455 | 0.433884 | 0.409091 | 0.4 | |||
| E2 | 0.210526 | 0.200000 | 0.203857 | 0.212121 | 0.2 | |||
| E3 | 0.394737 | 0.354545 | 0.362259 | 0.378788 | 0.4 |
| E11 | E12 | ||||||
|---|---|---|---|---|---|---|---|
| E11 | 0.692308 | 0.666667 | 0.658163 | 0.642857 | 0.666667 | ||
| E12 | 0.307692 | 0.333333 | 0.341837 | 0.357143 | 0.333333 |
| E21 | E22 | E23 | E24 | ||||||
|---|---|---|---|---|---|---|---|---|---|
| E21 | 0.504296 | 0.449824 | 0.453298 | 0.460482 | 0.491839 | ||||
| E22 | 0.391579 | 0.331107 | 0.327465 | 0.319933 | 0.305571 | ||||
| E23 | 0.104125 | 0.144724 | 0.142439 | 0.137713 | 0.124793 | ||||
| E24 | 0 | 0.074344 | 0.076798 | 0.081871 | 0.0777981 |
| E31 | E32 | E33 | ||||||
|---|---|---|---|---|---|---|---|---|
| E31 | 0.335539 | 0.298349 | 0.298349 | 0.317737 | 0.296961 | |||
| E32 | 0.469703 | 0.529412 | 0.529412 | 0.502793 | 0.539615 | |||
| E33 | 0.194758 | 0.172240 | 0.172240 | 0.179469 | 0.163424 |
| N1 | N2 | N3 | ||||||
|---|---|---|---|---|---|---|---|---|
| N1 | 0.194758 | 0.17224 | 0.17432 | 0.179469 | 0.163424 | |||
| N2 | 0.335539 | 0.298349 | 0.303927 | 0.317737 | 0.296961 | |||
| N3 | 0.469703 | 0.529412 | 0.521753 | 0.502793 | 0.539615 |
| N11 | N12 | N13 | N14 | ||||||
|---|---|---|---|---|---|---|---|---|---|
| N11 | 0.368364 | 0.361858 | 0.361721 | 0.361435 | 0.359276 | ||||
| N12 | 0.368364 | 0.320422 | 0.329213 | 0.347623 | 0.359276 | ||||
| N13 | 0.263272 | 0.236521 | 0.225833 | 0.203452 | 0.199916 | ||||
| N14 | 0 | 0.081199 | 0.083232 | 0.087490 | 0.081531 |
| N21 | N22 | N23 | ||||||
|---|---|---|---|---|---|---|---|---|
| N21 | 0.469703 | 0.529412 | 0.521753 | 0.502793 | 0.539615 | |||
| N22 | 0.335539 | 0.298349 | 0.303927 | 0.317737 | 0.296961 | |||
| N23 | 0.194758 | 0.17224 | 0.17432 | 0.179469 | 0.163424 |
| N31 | N32 | N33 | N34 | ||||||
|---|---|---|---|---|---|---|---|---|---|
| N31 | 0.391579 | 0.331107 | 0.327465 | 0.319933 | 0.305571 | ||||
| N32 | 0.104125 | 0.144724 | 0.142439 | 0.137713 | 0.124793 | ||||
| N33 | 0.504296 | 0.449824 | 0.453298 | 0.460482 | 0.491839 | ||||
| N34 | 0 | 0.074344 | 0.076798 | 0.081871 | 0.0777981 |
| H1 | H2 | H3 | H4 | H5 | ||||||
|---|---|---|---|---|---|---|---|---|---|---|
| H1 | 0.302687 | 0.278976 | 0.2728 | 0.259174 | 0.265205 | |||||
| H2 | 0.121185 | 0.132675 | 0.12679 | 0.113806 | 0.10256 | |||||
| H3 | 0.375703 | 0.357825 | 0.366489 | 0.385604 | 0.420131 | |||||
| H4 | 0.200425 | 0.183401 | 0.185608 | 0.190476 | 0.163751 | |||||
| H5 | 0 | 0.047122 | 0.0483131 | 0.05094 | 0.048352 |
| H11 | H12 | H13 | ||||||
|---|---|---|---|---|---|---|---|---|
| H11 | 0.573349 | 0.588534 | 0.591657 | 0.599821 | 0.636986 | |||
| H12 | 0.375448 | 0.307359 | 0.300366 | 0.282085 | 0.258285 | |||
| H13 | 0.0512038 | 0.104107 | 0.107977 | 0.118094 | 0.104729 |
| H21 | H22 | H23 | ||||||
|---|---|---|---|---|---|---|---|---|
| H21 | 0.423486 | 0.369599 | 0.35333 | 0.319177 | 0.319618 | |||
| H22 | 0 | 0.125255 | 0.127978 | 0.133695 | 0.121957 | |||
| H23 | 0.576514 | 0.505146 | 0.518692 | 0.547127 | 0.558425 |
| H31 | H32 | H33 | ||||||
|---|---|---|---|---|---|---|---|---|
| H31 | 0.686499 | 0.603699 | 0.60215 | 0.598899 | 0.625013 | |||
| H32 | 0 | 0.129365 | 0.135136 | 0.147250 | 0.1365 | |||
| H33 | 0.313501 | 0.266935 | 0.262714 | 0.253851 | 0.238487 |
| H41 | H42 | ||||||
|---|---|---|---|---|---|---|---|
| H41 | 1 | 0.848684 | 0.836219 | 0.813596 | 0.833333 | ||
| H42 | 0 | 0.151316 | 0.163781 | 0.186404 | 0.151316 |
| H51 | H52 | H53 | ||||||
|---|---|---|---|---|---|---|---|---|
| H51 | 0.904283 | 0.651202 | 0.644745 | 0.634569 | 0.695523 | |||
| H52 | 0.0957168 | 0.27877 | 0.281051 | 0.284647 | 0.229048 | |||
| H53 | 0 | 0.070028 | 0.074204 | 0.080784 | 0.0754292 |
References
- Tolstykh, T.; Gamidullaeva, L.; Shmeleva, N.; Lapygin, Y. Regional Development in Russia: An Ecosystem Approach to Territorial Sustainability Assessment. Sustainability 2020, 12, 6424. [Google Scholar] [CrossRef]
- Aksentijević, K.N.; Ježić, Z.; Zaninović, P.A. The Effects of Information and Communication Technology (ICT) Use on Human Development—A Macroeconomic Approach. Economies 2021, 9, 128. [Google Scholar] [CrossRef]
- Stofkova, Z.; Sukalova, V. Sustainable Development of Human Resources in Globalization Period. Sustainability 2020, 12, 7681. [Google Scholar] [CrossRef]
- Directorate-General for Research and Innovation. In Innovating for Sustainable Growth: A Bioeconomy for Europe; European Commission: Brussels, Belgium, 2012.
- Petrović, R. Policy of balanced regional development of the Republic of Serbia from 2000 to 2018. Megatrend Rev. 2020, 17, 45–62. [Google Scholar] [CrossRef]
- Stahl, G.K.; Brewster, C.J.; Collings, D.G.; Hajro, A. Enhancing the role of human resource management in corporate sustainability and social responsibility: A multi-stakeholder, multidimensional approach to HRM. Hum. Resour. Manag. Rev. 2020, 30, 100708. [Google Scholar] [CrossRef]
- Jimenez, C.; Moncada, L.; Ochoa-Jimenez, D.; Ochoa-Moreno, W. Kuznets Environmental Curve for Ecuador: An analysis of the impact of economic growth on the environment. Sustainability 2019, 11, 5896. [Google Scholar] [CrossRef]
- Dimić, V.; Milošević, M.; Milošević, D.; Stević, D. Adjustable Model of Renewable Energy Projects for Sustainable Development: A Case Study of the Nišava District in Serbia. Sustainability 2018, 10, 775. [Google Scholar] [CrossRef]
- Madžarević, A.R.; Ivezić, D.D.; Tanasijević, M.L.; Živković, M.A. The Fuzzy–AHP Synthesis Model for Energy Security Assessment of the Serbian Natural Gas Sector. Symmetry 2020, 12, 908. [Google Scholar] [CrossRef]
- Meyer, D.F.; Meyer, N. The relationship between the creation of an enabling environment and economic development: A comparative analysis of management at local government sphere. Pol. J. Manag Stud. 2016, 14, 150–160. [Google Scholar] [CrossRef]
- Tiba, S.; Omri, A. Literature survey on the relationships between energy, environment and economic growth. Renew. Sustain. Energy Rev. 2017, 69, 1129–1146. [Google Scholar] [CrossRef]
- Mitić-Radulović, A.; Lalović, K. Multi-Level Perspective on Sustainability Transition towards Nature-Based Solutions and Co-Creation in Urban Planning of Belgrade, Serbia. Sustainability 2021, 13, 7576. [Google Scholar] [CrossRef]
- Širá, E.; Vavrek, R.; Kravčáková Vozárová, I.; Kotulič, R. Knowledge Economy Indicators and Their Impact on the Sustainable Competitiveness of the EU Countries. Sustainability 2020, 12, 4172. [Google Scholar] [CrossRef]
- Milošević, D.; Milošević, M.; Simjanović, D. A Comparative Study of FAHP with Type-1 and Interval Type-2 Fuzzy Sets for ICT Implementation in Smart Cities. In Intelligent and Fuzzy Techniques for Emerging Conditions and Digital Transformation; Kahraman, C., Cebi, S., Cevik Onar, S., Oztaysi, B., Tolga, A.C., Sari, I.U., Eds.; INFUS 2021. Lecture Notes in Networks and Systems; Springer: Cham, Swizerland, 2022; Volume 308, pp. 845–852. [Google Scholar]
- Mert, A. Sustainable Development Partnerships in the UN System. In Networks for Prosperity: Advancing Sustainability through Partnerships; Fuentes Cardona, J., Kitaoka, K., Pirca García, I., Eds.; United Nations Industrial Development Organization (UNIDO) Vienna International Centre: Vienna, Austria, 2015; pp. 55–67. ISBN 978-3-200-03916-2. [Google Scholar]
- Dang, V.T.; Wang, J.; Dang, W.V.-T. An Integrated Fuzzy AHP and Fuzzy Topsis Approach to Assess Sustainable Urban Development in an Emerging Economy. Int. J. Environ. Res. Public Health 2019, 16, 2902. [Google Scholar] [CrossRef]
- Saleh, H.; Surya, B.; Annisa Ahmad, D.N.; Manda, D. The Role of Natural and Human Resources on Economic Growth and Regional Development: With Discussion of Open Innovation Dynamics. J. Open Innov. Technol. Mark. Complex. 2020, 6, 103. [Google Scholar] [CrossRef]
- Berend, T.I. From the Soviet Bloc to the European Union: The Economic and Social Transformation of Central and Eastern Europe since 1973; Cambridge University Press: Cambridge, UK, 2009. [Google Scholar]
- Faulks, B.; Song, Y.; Waiganjo, M.; Obrenovic, B.; Godinic, D. Impact of Empowering Leadership, Innovative Work, and Organizational Learning Readiness on Sustainable Economic Performance: An Empirical Study of Companies in Russia during the COVID-19 Pandemic. Sustainability 2021, 13, 12465. [Google Scholar] [CrossRef]
- Local Economic Leadership© OECD 2015. Available online: https://www.oecd.org/cfe/leed/OECD-LEED-Local-Economic-Leadership.pdf (accessed on 20 January 2022).
- Krasniqi, I. Strategic Management for Regional Economic Development and Business Sustainability: Countries in Transition. Int. J. Econ. Bus. Adm. 2019, 7, 47–67. [Google Scholar] [CrossRef][Green Version]
- Nikolić, M. Strategic Management of Natural Resources of Pčinj District for the Purpose of Economic and Ecological Development—Case Study of the City of Vranje. Ph.D. Thesis, Faculty of Management—Megatrend University, Belgrade, Serbia, 2019; pp. 1–203. (In Serbian). [Google Scholar]
- Otić, G.; Momčilović, O.; Radovanović, L.; Jovanov, G.; Radosav, D.; Pekez, J. Mathematical Analysis of Criteria for Maintenance of Technical Systems in the Function of Achieving Sustainability. Sustainability 2021, 13, 1680. [Google Scholar] [CrossRef]
- Saaty, T.L. The Analytic Hierarchy Process; McGraw-Hill: New York, NY, USA, 1980. [Google Scholar]
- Saaty, T.L. Analytic Network Process—Decision Making with Dependece and Feedback; RWS publications: Pittsburgh, PA, USA, 1996; ISBN 0-9620317-9-8. [Google Scholar]
- Milošević, D.M.; Milošević, M.R.; Simjanović, D.J. Implementation of Adjusted Fuzzy AHP Method in the Assessment for Reuse of Industrial Buildings. Mathematics 2020, 8, 1697. [Google Scholar] [CrossRef]
- Aguarón, J.; Escobar, M.T.; Moreno-Jiménez, J.M.; Turón, A. AHP-Group Decision Making Based on Consistency. Mathematics 2019, 7, 242. [Google Scholar] [CrossRef]
- Milošević, M.R.; Milošević, D.M.; Stanojević, A.D.; Stević, D.M.; Simjanović, D.J. Fuzzy and Interval AHP Approaches in Sustainable Management for the Architectural Heritage in Smart Cities. Mathematics 2021, 9, 304. [Google Scholar] [CrossRef]
- Milošević, M.R.; Milošević, D.M.; Stanojević, A.D. Managing Cultural Built Heritage in Smart Cities Using Fuzzy and Interval Multi-criteria Decision Making. In Intelligent and Fuzzy Techniques: Smart and Innovative Solutions. INFUS 2020. Advances in Intelligent Systems and Computing; Kahraman, C., Cevik Onar, S., Oztaysi, B., Sari, I., Cebi, S., Tolga, A., Eds.; Springer: Cham, Switerland, 2021; Volume 1197, pp. 599–607. [Google Scholar]
- Chang, D.Y. Applications of the extent analysis method on fuzzy AHP. Eur. J. Oper. Res. 1996, 95, 649–665. [Google Scholar] [CrossRef]
- Stanojević, A.D.; Milošević, M.; Milošević, D.; Turnšek, B.A.; Jevremović, L.L. Developing multi-criteria model for the protection of built heritage from the aspect of energy retrofitting. Energy Build. 2021, 250, 111285. [Google Scholar] [CrossRef]
- Narayanamoorthy, S.; Ramya, L.; Kalaiselvan, S.; Kureethara, J.V.; Kang, D. Use of DEMATEL and COPRAS method to select best alternative fuel for control of impact of greenhouse gas emissions. Socio-Econ. Plan. Sci. 2021, 76, 10099. [Google Scholar]
- Geetha, S.; Narayanamoorthy, S.; Kang, D. Extended hesitant fuzzy SWARA techniques to examine the criteria weights and VIKOR method for ranking alternatives. In Proceedings of the AIP Conference Proceedings 2261 of Advances in Applicable Mathematics—ICAAM2020, Coimbatore, India, 21–22 February 2020. [Google Scholar]
- Narayanamoorthy, S.; Ramya, L.; Kang, D. Normal wiggly hesitant fuzzy set with multi-criteria decision making problem. In Proceedings of the AIP Conference Proceedings 2261 of Advances in Applicable Mathematics—ICAAM2020, Coimbatore, India, 21–22 February 2020. [Google Scholar]
- Zahedi, F. The analytic hierarchy process—a survey of the method and its applications. Interfaces 1986, 16, 96–108. [Google Scholar] [CrossRef]
- Canco, I.; Kruja, D.; Iancu, T. AHP, a Reliable Method for Quality Decision Making: A Case Study in Business. Sustainability 2021, 13, 13932. [Google Scholar] [CrossRef]
- Leśniak, A.; Kubek, D.; Plebankiewicz, E.; Zima, K.; Belniak, S. Fuzzy AHP Application for Supporting Contractors’ Bidding Decision. Symmetry 2018, 10, 642. [Google Scholar] [CrossRef]
- Kahraman, C. Multi-criteria decision making methods and Fuzzy sets. In Fuzzy Multicriteria Decision Making: Theory and Applications with Recent Development, 1st ed.; Kahraman, C., Ed.; Springer US: Istanbul, Turkey, 2008; Volume 1, pp. 1–18. [Google Scholar]
- Liou, T.S.; Wang, M.J. Ranking fuzzy numbers with integral value. Fuzzy Sets Syst. 1992, 50, 247–256. [Google Scholar] [CrossRef]
- Flacke, J.; Shrestha, R.; Aguilar, R. Strengthening Participation Using Interactive Planning Support Systems: A Systematic Review. ISPRS Int. J. Geo-Inf. 2020, 9, 49. [Google Scholar] [CrossRef]
- Weber, A.S. The role of education in knowledge economies in developing countries. Procedia Soc. Behav. Sci. 2011, 15, 2589–2594. [Google Scholar] [CrossRef]
- Kuzieva, N.R. Stimulating the development of small business and private entrepreneurship through a tax mechanism in the Republic of Uzbekistan. Int. J. Res. Soc. Sci. 2017, 7, 345–354. [Google Scholar]
- Brush, C.; Edelman, L.F.; Manolova, T.; Welter, F. A gendered look at entrepreneurship ecosystems. Small Business Economics 2019, 53, 393–408. [Google Scholar] [CrossRef]
- Mortimore, M.; Vergara, S. Targeting winners: Can foreign direct investment policy help developing countries industrialise? Eur. J. Dev. Res. 2004, 16, 499–530. [Google Scholar] [CrossRef]
- Milošević, D.; Stanojević, A.; Milošević, M. AHP method in the function of logistic in development of smart cities model. In Proceedings of the 6th International Conference: Transport and logistic Til, Niš, Serbia, 25–26 May 2017; pp. 287–294. [Google Scholar]
- Selimi, A.; Milošević, M.; Saračević, M. AHP–TOPSIS Model as a Mathematical Support in the Selection of Project from Aspect of Mobility–Case Study. J. Appl. Math. Comput. 2018, 2, 257–265. [Google Scholar]
- Sustainable Mobility for All. SuM4All 2021 Annual Report. Bouncing Forward to Sustainable Mobility for All; The World Bank: Washington, DC, USA, 2021; pp. 18–23. Available online: https://www.sum4all.org/ (accessed on 28 January 2022).
- Nikiforiadis, A.; Basbas, S.; Mikiki, F.; Oikonomou, A.; Polymeroudi, E. Pedestrians-Cyclists Shared Spaces Level of Service: Comparison of Methodologies and Critical Discussion. Sustainability 2021, 13, 361. [Google Scholar] [CrossRef]
- Milošević, M.R.; Milošević, D.M.; Stević, D.M.; Stanojević, A.D. Smart City: Modeling Key Indicators in Serbia Using IT2FS. Sustainability 2019, 11, 3536. [Google Scholar] [CrossRef]
- Milošević, M.; Milošević, D.; Dimić, V.; Stević, D.; Stanojević, A. The analysis of energy efficiency indicators and renewable energy sources for existing buildings. MKOIEE 2017, 5, 205–212. [Google Scholar]
- Thornbush, M.; Golubchikov, O. Smart energy cities: The evolution of the city-energy-sustainability nexus. In Environmental Development; Elsevier, B.V.: Amsterdam, The Netherlands, 2021; p. 100626. [Google Scholar]
- Jennings, V.; Bamkole, O. The Relationship between Social Cohesion and Urban Green Space: An Avenue for Health Promotion. Int. J. Environ. Res. Public Health 2019, 16, 452. [Google Scholar] [CrossRef]
- Shafik, N. Economic Development and Environmental Quality: An Econometric Analysis. Oxf. Econ. Pap. 1994, 46, 757–773. [Google Scholar] [CrossRef]
- Marković, R.M.; Salamzadeh, A.; Vujičić, S. Selection of organization models and creation of competences of the employed people for the sake of competitiveness growth in global business environment. Int. Rev. 2019, 1-2, 64–71. [Google Scholar] [CrossRef]
- Pardal, P.; Dias, R.; Šuler, P.; Teixeira, N.; Krulický, T. Integration in Central European capital markets in the context of the global COVID-19 pandemic. Equilib. Q. J. Econ. Econ. Policy 2020, 15, 627–650. [Google Scholar] [CrossRef]
- Ambec, S.; Cohen, M.A.; Elgie, S.; Lanoie, P. The Porter Hypothesis at 20: Can Environmental Regulation Enhance Innovation and Competitiveness? In Review of Environmental Economics and Policy; Kling, L.C., Ed.; Association of Environmental and Resource Economists and the European Association of Environmental and Resource Economists: Venice, Italy, 2013; Volume 7, pp. 2–22. [Google Scholar]
- Stošić-Mihajlović, L.; Nikolić, M. Important operational economic decisions of governments and companies and pandemic crisis management. In Proceedings of the International May Conference on Strategic Management (IMCSM20), University of Belgrade, Technical Faculty, Belgrade, Serbia, 25–27 September 2020. [Google Scholar]
- Bashlakova, V.; Bashlakov, H. The study of the shadow economy in modern conditions: Theory, methodology, practice. Q. Rev. Econ. Financ. 2021, 81, 468–480. [Google Scholar] [CrossRef]
- Schneider, F.; Krstić, G.; Arsić, M.; Ranđelović, S. What Is the Extent of the Shadow Economy in Serbia. In Formalizing the Shadow Economy in Serbia. Contributions to Economics; Krstić, G., Schneider, F., Eds.; Springer: Cham, Switzerland, 2015; pp. 47–75. [Google Scholar]
- Vuorio, A.M.; Puumalainen, K.; Fellnhofer, K. Drivers of entrepreneurial intentions in sustainable entrepreneurship. Int. J. Entrep. Behav. Res. 2018, 24, 359–381. [Google Scholar] [CrossRef]
- Berezin, A.; Sergi, B.S.; Gorodnova, N. Efficiency Assessment of Public-Private Partnership (PPP) Projects: The Case of Russia. Sustainability 2018, 10, 3713. [Google Scholar] [CrossRef]
- Zeyneloglu, I. Fiscal policy effectiveness and the golden rule of public finance. Cent. Bank Rev. 2018, 18, 85–93. [Google Scholar] [CrossRef]
- Stijns, J.P.C. Natural resource abundance and economic growth revisited. Resour. Policy 2005, 30, 107–130. [Google Scholar] [CrossRef]
- Jansujwicz, J.S.; Calhoun, A.J.K.; Bieluch, K.H.; McGreavy, B.; Silka, L.; Sponarski, C. Localism “Reimagined”: Building a Robust Localist Paradigm for Overcoming Emerging Conservation Challenges. Environ. Manag. 2021, 67, 91–108. [Google Scholar] [CrossRef]
- Pavlović, B.; Ivezić, D.; Živković, M. A multi-criteria approach for assessing the potential of renewable energy sources for electricity generation: Case Serbia. Energy Rep. 2021, 7, 8624–8632. [Google Scholar] [CrossRef]
- Klinglmair, M.; Sala, S.; Brandão, M. Assessing resource depletion in LCA: A review of methods and methodological issues. Int. J. Life Cycle Assess. 2014, 19, 580–592. [Google Scholar] [CrossRef]
- Karkkainen, B.C. Collaborative ecosystem governance: Scale, complexity, and dynamism. Va. Environ. Law J. 2002, 21, 189–243. [Google Scholar]
- Diaz Lopez, F.J.; Bastein, T.; Tukker, A. Business model innovation for resource-efficiency, circularity and cleaner production: What 143 cases tell us. Ecol. Econ. 2019, 155, 20–35. [Google Scholar] [CrossRef]
- Chou, Y.C.; Yen, H.Y.; Sun, C.C.; Hon, J.S. Comparison of AHP and fuzzy AHP methods for human resources in science technology (HRST) performance index selection. In Proceedings of the 2013 IEEE International Conference on Industrial Engineering and Engineering Management, Bangkok, Thailand, 10–13 December 2013; pp. 792–796. [Google Scholar]
- Furmankiewicz, M.; Campbell, A. From Single-Use Community Facilities Support to Integrated Sustainable Development: The Aims of Inter-Municipal Cooperation in Poland, 1990–2018. Sustainability 2019, 11, 5890. [Google Scholar] [CrossRef]
- Senayah, E.A.; Mprah, W.K.; Opoku, M.P.; Edusei, A.K.; Torgbenu, E.L. The accessibility of health services to young deaf adolescents in Ghana. Int. J. Health Plan. Manag. 2018, 34, 634–645. [Google Scholar] [CrossRef]
- Gylfason, T. Natural resources, education, and economic development. Eur. Econ. Rev. 2001, 45, 847–859. [Google Scholar] [CrossRef]
- Kundu, A. Toward a framework for strengthening participants’ self-efficacy in online education. Asian Assoc. Open Univ. J. 2020, 15, 351–370. [Google Scholar] [CrossRef]
- Novo-Corti, I.; Țîrcă, D.-M.; Ziolo, M.; Picatoste, X. Social Effects of Economic Crisis: Risk of Exclusion. An Overview of the European Context. Sustainability 2019, 11, 336. [Google Scholar] [CrossRef]
- Bossuyt, J.; Sherriff, A.; de Tollenaere, M.; Veron, P.; Sayós Monràs, M.; Di Ciommo, M. Strategically financing an effective role for the EU in the world: First reflections on the next EU budget. In Investing in Europe’s Global Role: The Must-Have Guide for the negotiations of the Multiannual Financial Framework 2021–2027.; Sherriff, A., Ed.; The European Centre for Development Policy Management (ECDPM): Maastricht, The Netherlands, 2019; ISBN 978-90-72908-506. [Google Scholar]
- Ceballos, B.; Lamata, M.T.; Pelta, D.A. A comparative analysis of multi-criteria decision-making methods. Prog. Artif. Intell. 2016, 5, 315–322. [Google Scholar] [CrossRef]
- Sałabun, W.; Urbaniak, K. A new coefficient of rankings similarity in decision-making problems. In Proceedings of the International Conference on Computational Science, Amsterdam, The Netherlands, 3–5 June 2020; Springer: Cham, Switzerland, 2020; pp. 632–645. [Google Scholar]


| S—Strengthening participation in the development [40] | |
| S1—Economic development strategy based on knowledge and innovation [41,42] | S11—Development of a stimulating entrepreneurial environment [43] S12—Targeted investment attraction [44] S13—Development of potentials for the needs of the labor market |
| S2—Sustainable mobility and interactive city development [45,46] | S21—Increased accessibility of the city S22—Sustainable mobility of the central city zone [47] S23—Development of economic zones and logistics S24—Compliance of the traffic system with the needs of citizens S25—Increasing the share of pedestrians in cyclists as road users [48] S26—Improved safety conditions for all road users |
| S3—Improvement and development infrastructure services of citizens [49] | S31—Improving the quality of communal infrastructure S32—Creating a framework for high-quality utilities S33—Improving the level of information and communication with citizens |
| S4—Energy capital as a development opportunity [50] | S34—Increased efficiency coefficient of all PUCs individually S41—Improvement of energy infrastructure S42—Improving energy efficiency S43—Institutional environment for the development of energy systems and the provision of quality services [51] |
| S5—Improved social cohesion [52] | S44—Achieved in the billing system according to the energy consumed S51—Diversified, accessible, and quality social services S52—Improving the content of culture, sports, and tourism S53—Improving social development infrastructure S54—A single record system for users of social rights and services has been established S55- City Housing Strategy adopted S56—Implementation of investment plans in facilities and equipment of primary health care institutions |
| E—Economic potentials [53] | |
| E1—Increasing competitiveness [54,55] | E11—Stability of business environment and business sector [56] E12—Global response to the COVID-19 pandemic [57] |
| E2—Suppression of the gray economy [58] | E21—Reducing the degree of the gray economy in GDP [59] E22—Reduction of the share of unregistered economic entities E23—Relative reduction of VAT |
| E3—Public-private partnership in support of local economic development and foreign direct investment (FDI) [60] | E31- Increase in efficiency and economy [61] E32- Reducing the pressure of public investment on the budget [62] E33- Increasing the level of foreign direct investment (FDI) |
| N—Natural resources [63] | |
| N1—Use and protection of natural resources in planning [64] | N11—Implementation of the National Strategy on the Use and Protection of Natural Resources and Goods N12—Strategic environmental impact assessment of plans and programs N13—Environmental impact assessment of projects N14—Integrated prevention and control of environmental pollution |
| N2—Management of renewable natural resources and non-renewable natural resources [65] | N21—Reconciliation of the relationship between the degree of exhaustion of natural resources and their regeneration rate [66] N22—Design of available resources by quality, structure, amount, and capital investments N23—Direction of ecological aspects in the interest of the population of the local area |
| N3—Protection of resources and ecosystems through the principles of sustainable development [67] | N31—Creating ability of the environment to accept a certain amount of pollutants per unit of time and space so that there is no irreversible damage to the environment; N32—The impact of a product/service or system on the environment N33—Effective preservation of ecosystems and resources themselves [68] N34—Transparency-information of the wider local community |
| H—Human resources [69] | |
| H1—Employment and labor market [70] | H11—Support for the development of local and inter-municipal employment policies H12—Increasing the impact of employment policy measures on the hard-to-employ H13—Suppression of the informal economy |
| H2—Improving the quality and accessibility of health services [71] | H21—Promoting the health and well-being of all citizens H22—Preventive care H23—Strengthening the operational capacity of the health system in line with EU standards data |
| H3—Education [72] | H31—Improving the quality and importance of secondary vocational education and adult education within the National Qualifications Framework H32—Ensuring access to and reaching higher levels of education for children at risk [73] H33—Education for all |
| H4—Social inclusion [74] | H41—Support for social inclusion through a more diverse offer of social services in the local community H42—Support for the transition from social assistance to work (“welfare-to-work”) through activation |
| H5—Technical assistance | H51—Announcement of new calls for cross-border cooperation programs H52—Finalization of the Operational Program Human Resources Development H53—Negotiations with individual bilateral donors, discussions on a new EU financial perspective [75] |
| Description TFNs | TFNs | Inverse TFNs | Denotation of TFNs | Denotation of Inverse TFNs |
|---|---|---|---|---|
| Equally important | = | |||
| Equally to weakly important | = | |||
| Weakly important | = | |||
| Weakly to strong important | = | |||
| Strong important | = | |||
| Strong to very strongly important | = | |||
| Very strongly important | = | |||
| Very strongly to absolutely important | = | |||
| Absolutely important | = |
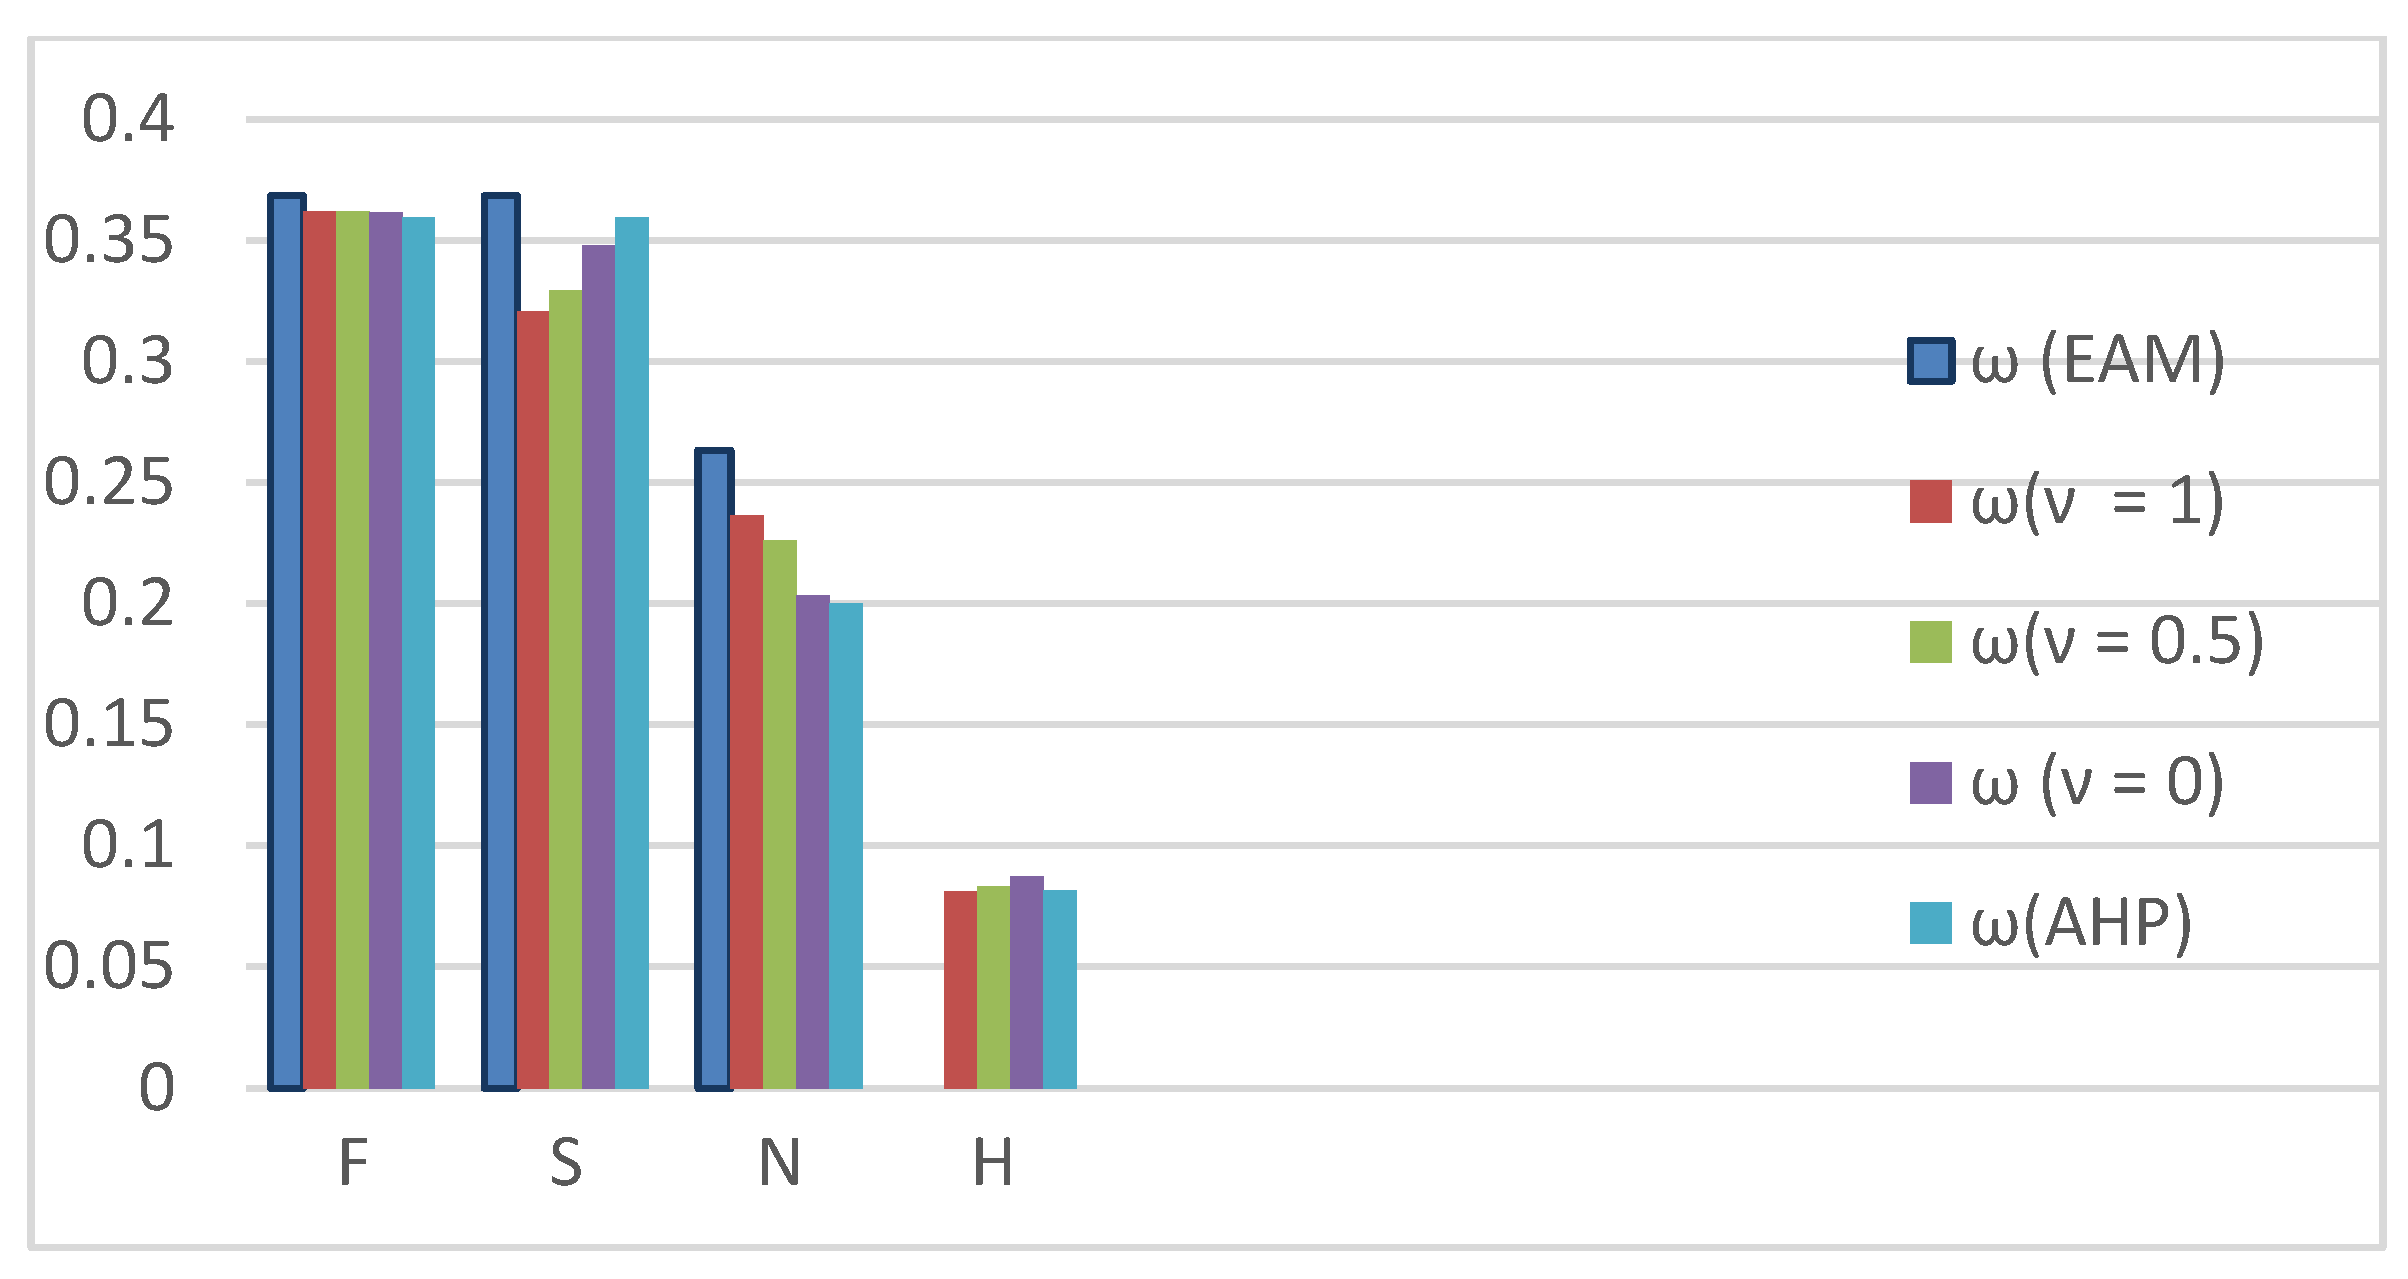
| F | S | N | H | |
|---|---|---|---|---|
| F | ||||
| S | ||||
| N | ||||
| H |
| p | ||||||||||||
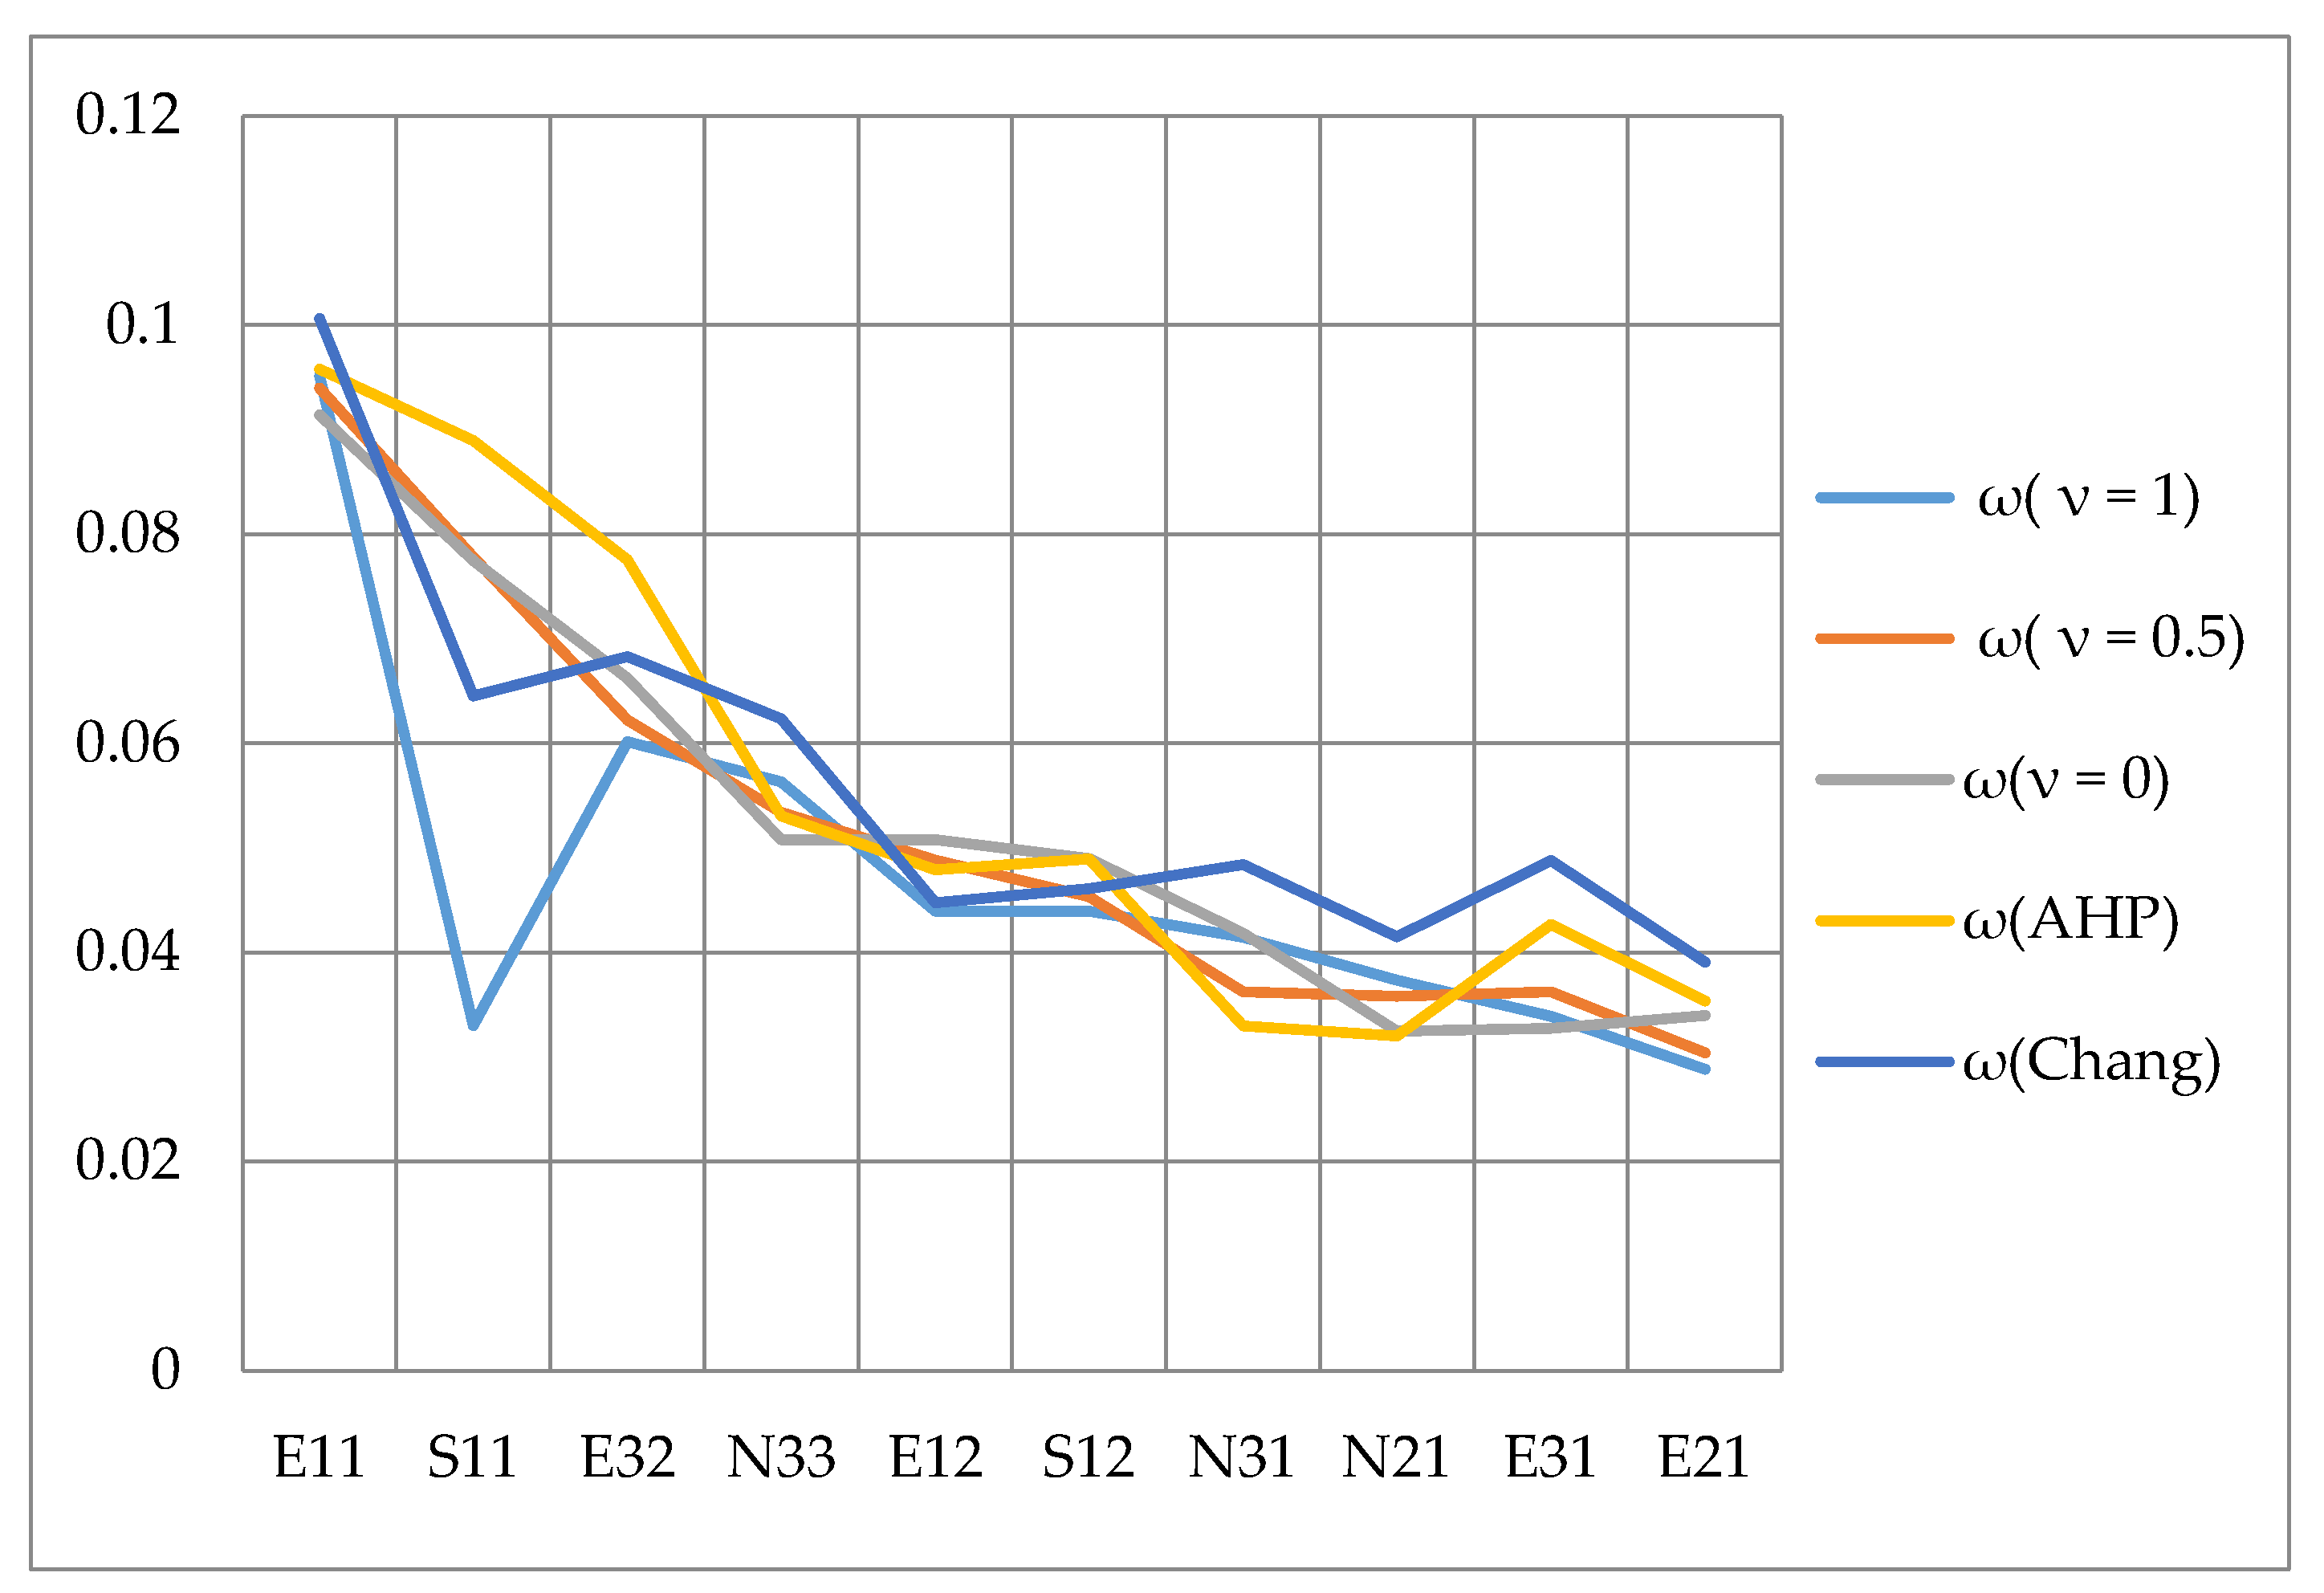
|---|---|---|---|---|---|---|---|---|---|---|---|---|
| E11 | 0.100666 | E11 | 0.095156 | E11 | 0.094012 | E11 | 0.091420 | S11 | [8.63826,19.0926] | 0.959395 | E11 | 0.095807 |
| E32 | 0.068298 | E32 | 0.060143 | S11 | 0.077816 | S11 | 0.077491 | S12 | [4.75382,10.9277] | 0.66159 | S11 | 0.088968 |
| S11 | 0.064537 | N33 | 0.056326 | E32 | 0.062224 | E32 | 0.066205 | E21 | [4.70912,8.97667] | 0.871921 | E32 | 0.077548 |
| N33 | 0.062361 | E12 | 0.047578 | N33 | 0.053412 | E12 | 0.050789 | N33 | [3.92281,6.33196] | 0.520358 | N33 | 0.053058 |
| E31 | 0.048790 | S12 | 0.043947 | E12 | 0.048828 | S12 | 0.048970 | S26 | [3.17891,6.9234] | 0.816068 | S12 | 0.048961 |
| N31 | 0.048423 | N31 | 0.041460 | S12 | 0.045329 | N33 | 0.047105 | S22 | [2.92868,4.77265] | 0.558448 | E12 | 0.047903 |
| S12 | 0.046103 | N21 | 0.037358 | N31 | 0.038585 | E31 | 0.041838 | S13 | [2.07642,5.25352] | 0.513292 | E31 | 0.042676 |
| E12 | 0.044741 | E31 | 0.033894 | E31 | 0.036246 | E21 | 0.033955 | S34 | [2.80168,4.4438] | 0.5 | E21 | 0.035341 |
| N21 | 0.041493 | S11 | 0.032996 | N21 | 0.035811 | N31 | 0.032727 | S33 | [2.80168,4.4438] | 0.747129 | N31 | 0.032964 |
| E21 | 0.039108 | E21 | 0.028827 | E21 | 0.030422 | N21 | 0.032503 | E11 | [2.64639,3.76592] | 0.550364 | N21 | 0.032035 |
| S33 | 0.030624 | S13 | 0.025371 | S13 | 0.025999 | S13 | 0.027660 | S43 | [1.81144,4.34561] | 0.5 | S13 | 0.026944 |
| S34 | 0.030624 | S33 | 0.025188 | S33 | 0.025013 | S33 | 0.024555 | S42 | [1.81144,4.34561] | 0.520348 | S33 | 0.023801 |
| E22 | 0.030367 | S34 | 0.022304 | S34 | 0.022765 | E33 | 0.023632 | E32 | [2.69886,3.35506] | 0.730681 | S34 | 0.023801 |
| N22 | 0.029641 | E22 | 0.021219 | E22 | 0.021977 | S34 | 0.023616 | H31 | [1.88112,3.4493] | 0.512562 | E33 | 0.023486 |
| E33 | 0.028319 | N22 | 0.021053 | N22 | 0.020861 | E22 | 0.023591 | N31 | [2.17212,3.1189] | 0.774858 | E22 | 0.021957 |
| S13 | 0.026760 | S22 | 0.020602 | E33 | 0.020789 | N22 | 0.020540 | S52 | [1.64082,2.90676] | 0.552408 | H31 | 0.021409 |
| S31 | 0.021887 | E33 | 0.019567 | S22 | 0.020150 | H31 | 0.020205 | S25 | [1.73775,2.67714] | 0.5 | S22 | 0.018137 |
| S22 | 0.021309 | S26 | 0.019114 | S26 | 0.018968 | S22 | 0.018909 | S21 | [1.73775,2.67714] | 0.662139 | S26 | 0.018137 |
| S26 | 0.021309 | N32 | 0.018122 | H31 | 0.018368 | S26 | 0.018462 | S31 | [1.55898,2.51796] | 0.739001 | N22 | 0.017630 |
| N11 | 0.018888 | H31 | 0.017541 | N32 | 0.016783 | S42 | 0.014893 | E22 | [1.46285,2.14209] | 0.646789 | H11 | 0.013773 |
| N12 | 0.018888 | S31 | 0.016464 | S31 | 0.015616 | S43 | 0.014236 | E31 | [1.48524,1.92029] | 0.675224 | N32 | 0.013462 |
| N23 | 0.017205 | S42 | 0.014756 | S42 | 0.014808 | N32 | 0.014087 | E12 | [1.3232,1.88296] | 0.73459 | S42 | 0.013400 |
| S21 | 0.016776 | N11 | 0.014742 | N11 | 0.014240 | S31 | 0.013822 | H11 | [1.21722,1.7032] | 0.513748 | S43 | 0.013400 |
| S25 | 0.016015 | S21 | 0.013937 | H11 | 0.013434 | H11 | 0.013601 | S51 | [1.04206,1.85598] | 0.588416 | S31 | 0.013244 |
| N13 | 0.013499 | H11 | 0.013332 | S43 | 0.013270 | H41 | 0.013558 | S41 | [0.9555,1.78963] | 0.577056 | N11 | 0.011738 |
| S42 | 0.013147 | N12 | 0.013053 | S21 | 0.013236 | N11 | 0.013197 | S24 | [1.03337,1.58321] | 0.618407 | N12 | 0.011738 |
| S43 | 0.013147 | S43 | 0.012920 | N12 | 0.012960 | N12 | 0.012693 | N22 | [1.1401,1.34627] | 0.5 | H41 | 0.011126 |
| N32 | 0.012876 | H41 | 0.012639 | H41 | 0.012918 | N23 | 0.011602 | N21 | [1.1401,1.34627] | 0.718915 | S21 | 0.010174 |
| S24 | 0.010677 | S25 | 0.012449 | S25 | 0.012054 | S21 | 0.011464 | H33 | [0.71778,1.44861] | 0.602178 | S25 | 0.010174 |
| S41 | 0.009492 | N23 | 0.012154 | N23 | 0.011965 | S25 | 0.011017 | N11 | [0.759,1.25804] | 0.540678 | N23 | 0.009702 |
| E23 | 0.008075 | N13 | 0.009635 | E23 | 0.009559 | E23 | 0.010155 | N34 | [0.83114,1.1453] | 0.5 | E23 | 0.008967 |
| S44 | 0.006231 | N34 | 0.009309 | N34 | 0.009049 | S41 | 0.008886 | N32 | [0.83114,1.1453] | 0.661054 | S52 | 0.008699 |
| S52 | 0.004730 | E23 | 0.009275 | N13 | 0.008890 | H33 | 0.008564 | H41 | [0.70149,1.13498] | 0.603941 | N34 | 0.008393 |
| S23 | 0.004462 | S52 | 0.008171 | S52 | 0.008215 | N34 | 0.008375 | S54 | [0.61831,1.11409] | 0.5 | H33 | 0.008169 |
| S51 | 0.003829 | S24 | 0.008006 | H33 | 0.008014 | S52 | 0.008284 | S53 | [0.61831,1.11409] | 0.661846 | S41 | 0.007220 |
| S53 | 0.002731 | H33 | 0.007756 | S41 | 0.007970 | N13 | 0.007429 | E33 | [0.64874,0.92318] | 0.56956 | N13 | 0.006531 |
| S54 | 0.002429 | S41 | 0.007645 | S24 | 0.007702 | S24 | 0.006919 | N12 | [0.672,0.86174] | 0.550236 | S24 | 0.005896 |
| S55 | 0.001546 | H12 | 0.006962 | H12 | 0.006820 | H12 | 0.006396 | S23 | [0.5046,0.98125] | 0.501867 | E24 | 0.005590 |
| S32 | 0.000000 | S51 | 0.006134 | S51 | 0.005987 | E24 | 0.006037 | S32 | [0.52952,0.95455] | 0.58258 | H12 | 0.005585 |
| S56 | 0.000000 | S32 | 0.005652 | S32 | 0.005756 | S32 | 0.005944 | S44 | [0.33614,1.03286] | 0.513851 | S51 | 0.005525 |
| E24 | 0.000000 | H23 | 0.005442 | H23 | 0.005474 | S51 | 0.005637 | E23 | [0.49956,0.85014] | 0.700636 | S32 | 0.005401 |
| N14 | 0.000000 | S44 | 0.004830 | E24 | 0.005154 | H23 | 0.005448 | H12 | [0.49356,0.7153] | 0.716183 | H32 | 0.004676 |
| N34 | 0.000000 | E24 | 0.004764 | S44 | 0.004904 | S44 | 0.005098 | S55 | [0.37522,0.69381] | 0.663563 | H23 | 0.004669 |
| H11 | 0.000000 | S23 | 0.004646 | S23 | 0.004527 | H32 | 0.004968 | H32 | [0.28485,0.65808] | 0.544825 | S44 | 0.004167 |
| H12 | 0.000000 | S53 | 0.004210 | S53 | 0.004165 | S23 | 0.004209 | H23 | [0.40115,0.50832] | 0.595829 | S23 | 0.003729 |
| H13 | 0.000000 | H21 | 0.003982 | H32 | 0.004122 | S53 | 0.004051 | N13 | [0.40942,0.47951] | 0.586548 | S53 | 0.003278 |
| H21 | 0.000000 | S54 | 0.003780 | S54 | 0.003825 | S54 | 0.003912 | E24 | [0.32312,0.53] | 0.558802 | S54 | 0.003278 |
| H22 | 0.000000 | H32 | 0.003759 | H21 | 0.003729 | N14 | 0.003195 | N23 | [0.38003,0.44876] | 0.840303 | H51 | 0.002742 |
| H23 | 0.000000 | N14 | 0.003308 | N14 | 0.003277 | H21 | 0.003178 | H51 | [0.23827,0.44786] | 0.89211 | H21 | 0.002673 |
| H31 | 0.000000 | S55 | 0.002765 | S55 | 0.002636 | H42 | 0.003106 | H21 | [0.2296,0.29094] | 0.898511 | N14 | 0.002664 |
| H32 | 0.000000 | H51 | 0.002492 | H51 | 0.002593 | H51 | 0.002828 | H13 | [0.17111,0.26352] | 0.500174 | H13 | 0.002265 |
| H33 | 0.000000 | H13 | 0.002358 | H42 | 0.002530 | H13 | 0.002678 | S56 | [0.13099,0.30358] | 0.794194 | H42 | 0.002020 |
| H41 | 0.000000 | H42 | 0.002253 | H13 | 0.002452 | S55 | 0.002339 | N14 | [0.13746,0.19556] | 0.778545 | S55 | 0.001989 |
| H42 | 0.000000 | H22 | 0.001349 | H22 | 0.001351 | H22 | 0.001331 | H42 | [0.11091,0.17946] | 0.999997 | H22 | 0.001020 |
| H51 | 0.000000 | H52 | 0.001067 | H52 | 0.001130 | H52 | 0.001269 | H22 | [0.08761,0.11101] | 0.615939 | S56 | 0.000952 |
| H52 | 0.000000 | S56 | 0.000987 | S56 | 0.001011 | S56 | 0.001063 | H52 | [0.06855,0.11849] | 1 | H52 | 0.000903 |
| H53 | 0.000000 | H53 | 0.000268 | H53 | 0.000298 | H53 | 0.000360 | H53 | [0.02376,0.03902] | H53 | 0.00029 |
| FAHP | FAHP | FAHP | FAHP Chang | AHP | IAHP | |
|---|---|---|---|---|---|---|
| FAHP Chang | ||||||
| AHP |
Publisher’s Note: MDPI stays neutral with regard to jurisdictional claims in published maps and institutional affiliations. |
© 2022 by the authors. Licensee MDPI, Basel, Switzerland. This article is an open access article distributed under the terms and conditions of the Creative Commons Attribution (CC BY) license (https://creativecommons.org/licenses/by/4.0/).
Share and Cite
Milošević, M.R.; Nikolić, M.M.; Milošević, D.M.; Dimić, V. Managing Resources Based on Influential Indicators for Sustainable Economic Development: A Case Study in Serbia. Sustainability 2022, 14, 4795. https://doi.org/10.3390/su14084795
Milošević MR, Nikolić MM, Milošević DM, Dimić V. Managing Resources Based on Influential Indicators for Sustainable Economic Development: A Case Study in Serbia. Sustainability. 2022; 14(8):4795. https://doi.org/10.3390/su14084795
Chicago/Turabian StyleMilošević, Mimica R., Miloš M. Nikolić, Dušan M. Milošević, and Violeta Dimić. 2022. "Managing Resources Based on Influential Indicators for Sustainable Economic Development: A Case Study in Serbia" Sustainability 14, no. 8: 4795. https://doi.org/10.3390/su14084795
APA StyleMilošević, M. R., Nikolić, M. M., Milošević, D. M., & Dimić, V. (2022). Managing Resources Based on Influential Indicators for Sustainable Economic Development: A Case Study in Serbia. Sustainability, 14(8), 4795. https://doi.org/10.3390/su14084795