Abstract
Perceptions, attitudes and anticipated behavior represent very useful information for decision and policy makers before they implement proposed new policies. Road safety is one of the most critical fields in the built environment. In the Kingdom of Saudi Arabia, women started driving in 2019. There is a huge shortage of studies that investigate users’ attitudes and behavior, particularly women, in Saudi Arabia. It is very timely therefore, to assess their perceptions, attitudes and raise their awareness towards road safety. In this paper, the perceptions and attitudes towards road safety and relevant policies and programs were assessed and compared using two approaches: analytical and a fuzzy logic system. By means of a questionnaire, a total of 17 road safety policies, including engineering, enforcement programs, education programs and legislation programs, were presented to the participants and assessed. These policies were assessed from the viewpoint of Saudi women. The engineering policies included the use of road signs and marking, improving road network alignment, monitoring driver speed and engineering speed reduction measures. The assessment was in terms of the usefulness of the policies to reduce traffic accidents and improve road safety in Riyadh. A total of 375 participants were surveyed. Using a Likert scale response system to report the Saudi female participants’ opinions, two sets of indices were calibrated to evaluate the perceived usefulness and acceptability of the safety policies. A MATLAB simulation of a fuzzy logic system was utilized to assess, investigate and compare travel attitudes and perceptions of road safety. The results indicate overall encouragement for the safety programs and policies by the participants. Most of the support seems to be for the engineering program. The physical presence of traffic police was observed to have scored the highest. This is an interesting result that shows that enforcement policies are still perceived to be the most effective. In this category, the policy of enforcing speed limits showed high support, amongst the other policies. While a fuzzy logic analysis is typically used in hard engineering assessments and investigations, such as mechanical engineering and system design applications, the results obtained in this investigation show that the efficacy and adequacy of the proposed fuzzy logic control system in assessing attitudinal data was sufficiently good to be recommended for future research. The outcomes from both sets of approaches, the analytical and the fuzzy logic, showed comparable results, which also demonstrates the potential benefits of using the fuzzy system in many attitudinal and behavioral studies.
1. Introduction
1.1. Travel Behavior and Road Safety
Traffic behavior is the one of the most challenging activities in any urban area. Traffic volumes, drivers’ behavior, road causalities, delays and users’ requirements are only some of the constraints any traffic modeler faces when attempting to assess schemes or policies devised for the transport networks. To assess the effectiveness of such traffic policies, it is important to use appropriate tools and devise the appropriate indicators. Many traffic modelling tools and optimization algorithms have been developed to deal with and help understand traffic behavior and to calibrate appropriate traffic indicators to assess network performance.
Traffic indicators are composite indices that reflect traffic conditions in different settings. They can include time spent in traffic, delays, travel time traffic speed, level of pollution, accidents, vehicle occupancy, lane occupancy and many more indicators that can be devised specifically or collectively to study and assess traffic behavior and performance. On the other hand, traffic policies are sets of measures and programs that are devised in order to manage and control different traffic aspects. These include engineering, enforcement, education and raising awareness and legislation measures. Traffic surveys represent useful and very common means of data collection. Many types of surveys are available, including questionnaires, online surveys, interviews and others. It is important to collect an adequate sample size to ensure reliable results. The literature suggests that a sample in the range of 30 to 500 is deemed appropriate. This is based on whether it is derived from statistical tables, using census data or formulas, such as given in [1].
With the rising involvement of Saudi women in using the road network as drivers, there is a crucial need for better and wealthier understanding of the views and perceptions of this group of users to road safety programs and policies [2,3]. Existing knowledge and literature show that road accidents cause many worldwide deaths annually [4,5]. Immense national and international efforts are put forward to understand road users’ behvior in order to be able to implement the appropriate road safety programs and policies to improve road safety. Numerous studies have been assessed and reviewed to classify road safety policies and assess respondents’ attitudes and behavior towards them [6,7] in driving behavior [8,9].
Gender has been identified as one of the important factors that influence road use behavior and road accidents [10,11]. In most of the reviewed literature, it appears that men are more risk taking and that women are safer drivers. However, certain types of road accidents are associated with each of these groups [12,13,14]. There is a serious lack however, of studies that investigate users’ attitudes towards road safety policies in the Middle East.. In particular, there are a lack of investigations of women’s attitudes towards road safety [15,16,17].
In their paper, [18] indicated that the implementation and effectiveness of road safety programs are heavily dependent on how much road users’ support those programs. Therefore, to achieve competent road safety programs in Saudi Arabia, it is very critical to investigate and understand Saudi women’s attitudes and perceptions of such programs [19]. The investigation of the perception and acceptability of these programs represent an important step towards their successful implementation and should reflect well the anticipated attitudes and behavior of the users, should these measures get implemented [1,20,21].
Fuzzy systems are optimization tools that are concerned with optimizing systems’ outcomes based on the input parameters of any complex simulated system. Fuzzy logic has been utilized in many traffic and transport applications, such as in optimized traffic flow at signalized junctions [22]. Their system is designed to prioritize the emergency vehicles at traffic controllers utilizing siren sensors and a fuzzy logic traffic controller. A two-stage fuzzy traffic signal control model was applied on a single intersection, based on the level of traffic urgency [18]. The advantage of fuzzy logic systems is their ability to deal with many messy inputs and produce logical tidy outputs. The main problem of modelling traffic behavior is that there are many inputs that might prove complex to understand and represent. A fuzzy control system for road traffic flow management at traffic junctions was developed by [22]. In their study, a comparison of the fuzzy logic outcome and the observed traffic data showed good accuracy of the fuzzy logic analysis.
In this paper, the perceived effectiveness of a number of road safety measures and programs were assessed from Saudi women’s viewpoints using both analytical and fuzzy logic analyses.
1.2. Fuzzy Control System
A fuzzy control system is a mathematical system that assesses analog input values in terms of logical variables that take on continuous values between 0 and 1, as opposed to classical or digital logic, which operates on discrete values of either 1 or 0 (true or false, respectively). Fuzzy control systems are less expensive to develop and cover a broader range of operating scenarios, making them suitable for diagnosing gearbox and motor problems. Fuzzy If–Then rules are commonly used to characterize the conditional statements that make up a fuzzy control system [20,23]. Four components make up a sophisticated fuzzy control system; these are fuzzification, defuzzification, knowledge base and inference engine. Figure 1 depicts the four components that make up a sophisticated fuzzy control system [23,24].
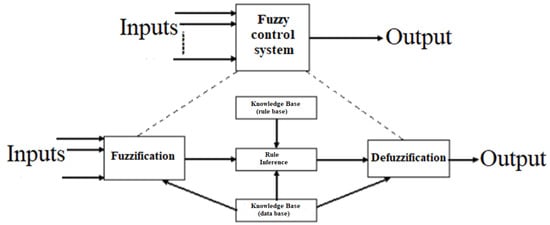
Figure 1.
Structure of the Fuzzy Control System.
The fuzzification module converts the crisp values of the control inputs to fuzzy values. The values of a fuzzy variable are determined by linguistic variables (fuzzy sets or subsets) such as low, medium, high, big, slow and so on, each of which is defined by a membership function that progressively changes. The universe of discourse refers to all the possible values for a variable, and fuzzy sets (defined by membership functions) encompass the complete universe. Triangular, trapezoidal, and other forms are possible for fuzzy sets. MATLAB’s fuzzy logic toolbox was used to design and develop a fuzzy logic control system [25,26].
2. Methodology
2.1. Data Collection
The attitudes of Saudi women to road safety, road safety programs and their perceived effectiveness were collected and assessed in this research by utilizing a questionnaire. A customized questionnaire was designed and delivered to female individuals in a shopping mall in Riyadh in the Kingdom of Saudi Arabia during the month of November 2019 while performing a focus group survey in Riyadh (KSA). The questionnaire was piloted first on 11 participants. Some revisions were made accordingly before confirming the final questionnaire. A total of 2000 participants were approached to complete the online survey. A total of 375 completed surveys were finally obtained after deleting all non-completed questionnaires. This sample size deemed appropriate judging by similar sample sizes in previous research. Data were collected from shopping malls, in particular at the cafes, during prayer times, where most women were sitting, having a coffee and waiting for the shops to reopen after the prayer times. It was during these time periods where women were approached, and participants were contacted and asked if they would be willing to contribute to the questionnaire on safe driving and their attitudes. Those who accepted the invitation were invited to have a seat in the café, offered some coffee and welcomed to the survey. The survey was piloted in the first instance on 11 participants, modified and then the main survey was executed. The questionnaire included questions on the general characteristics of the participant, driving characteristics, attitudes towards speeding, attitudes towards safe driving and attitudes towards transport safety policies. The survey was tested for validity and reliability; the validity of the survey was guaranteed as there were two sets of calibrated indicators using the datasets. These two sets were almost very similar, which was reassuring as a validity test. Secondly, the reliability was tested using the test–retest method. In this case, the survey was carried out with a set of five participants, repeated on the same five respondents and the results were verified to show the similarity of responses. Table 1 below shows the percentage characteristics and demographics of the respondents.

Table 1.
Characteristics and demographics of the respondents.
2.2. Safety Policies
Four main groups of safety programs that were typical and possible for implementation were used to assess female participants’ perceptions and attitudes. These were:
- Engineering programs
- Enforcement programs
- Education programs
- Legislation programs
Table 2 below shows the four groups of safety programs that were presented to the respondents.
Table 2.
Four groups of safety programs with example policies.
These policies were designed to investigate the perceived effectiveness of the road safety programs and their acceptability for implementation, as expressed by Saudi female participants. For that, the questionnaire included a number of questions using a Likert response scale system to report the participants’ responses. The Likert response scale is meant to present the strength of the individual’s agreement or disagreement, using a numerical analogy. In this case, the Likert scale was a 5-point ordinal scale used by the respondents to assess the degree to which they agreed or disagreed with a rating or a ranking. The expressed perceived effectiveness of the safety programs in improving road safety was recorded using a 5-point rating scale (significantly improves road safety, improves road safety, do not know, lessens road safety, significantly lessens road safety). The acceptability of such programs was reported by respondents as a two-point scale (accept or not accept). A total of 17 potential road safety programs were tested under the four groups of programs.
After all data collection was completed, two sets of indicators (Index I and Index II) were calibrated, each of which used the equation below:
These indices reflect the perceived effectiveness of each of the safety program policies presented. Each dataset was used to calibrate one set of indices. Each index was calculated by adding up the sum of the assigned scores for each safety program and dividing by the total sum of responses, as in Equation (1). It should be noted that the values for Index I ranged from 1–5, while the values of index II ranged from 1–2. The analytical results from this analysis are presented in Table 3 below.
Table 3.
The scores attained for Index I and Index II.
The analysis of results showed an overall backing and support of safety programs and policies by the participants, as indicated by the values of the two indices, Index I and II. For Index I, the most-supported policy was the engineering set, which included the use of road signs and marking, improving road network alignment, monitoring driver speed and engineering speed reduction measures. The policy that obtained maximum support, however, was P8 (Physical presence of traffic police), with score values of 4.291. This was an interesting result that shows that enforcement policies are still perceived to be most effective. In this category, also, policy P6 (enforce speed limits) showed a high support, with value of 3.572. Policy 12 also received considerable support from participants, with a score of 4.179 and, therefore, ranked as the second-highest supported policy. From Table 3, it appears that the levels of support for the safety policies that were indicated by the two sets of scores (Index I and Index II) were generally aligned. However, in this category, the policy associated with a licensing system especially for foreign drivers seemed to score the highest amongst other policies that were assessed for implementation (Index II). This might reflect the fact that there is a high percentage of foreign drivers in the country who are often blamed for high accident rates. Moreover, monitoring drivers’ speeds seems to have attracted the lowest support for implementation amongst all policies. It is relevant here to point out that it is claimed that driving speeds in the Kingdom are high, and it is one of the causes of major accidents. Pedestrian walking facilities also scored low in terms of support for implementation. It should be noted here that walking is not the most popular means of transportation in Saudi Arabia. This is partly because of the high temperatures and partly because of the high car ownership and use in the country. Future research is essential to further investigate travel behavior issues. The responses that were obtained were also used in a fuzzy logic system to investigate the adequacy of this fuzzy system to assess the perceived values of the responses for the four sets of safety programs.
3. Analysis
3.1. Fuzzy Logic-Based Model
The Engineering, enforcement, education and raising awareness and legislation programs and policies were further assessed to reflect their perceived effectiveness indexes (Index I and Index II), using an artificial intelligence fuzzy logic system.
The fuzzy system process that was implemented in this analysis followed the approach adopted by [27], which included three phases; these were the fuzzification process (which can be attained by altering the input data to a fuzzy set through fuzzy linguistic variables and membership functions), inference process based on If–Then rules (based on If–Then rules, the inference process is carried out) and defuzzifcation process (which is then finished using membership functions to crisp fuzzy outputs). In between, there is the inference process that is based on If–Then rules, as discussed earlier. Table 4 below lists road safety program policies and the calibrated indices.
Table 4.
The list of road safety program policies and the calibrated indices.
Four fuzzy systems were developed, one for each safety program (engineering, enforcement, education and raising awareness and legislation), to predict the two road safety indices (Index I and Index II) that were calibrated using the developed fuzzy systems, as presented in Figure 2 below.
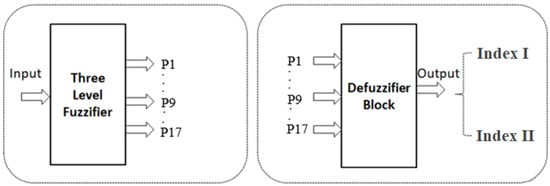
Figure 2.
The two main phases of the proposed fuzzy Model fuzzication process and defuzzication process.
3.2. Fuzzy System for the Engineering Safety Program
A fuzzy system was designed for the engineering safety program to determine the effect of that program on road safety policies. The engineering safety program fuzzy system with one input and two outputs is presented in Figure 3a; the inputs are presented in Figure 3b with different values (P1, P2, P3, P4, and P5). The two outputs were Index I (Fuzzy) and Index II (Fuzzy) with three ranges (low, medium and high), as presented in Figure 3c.
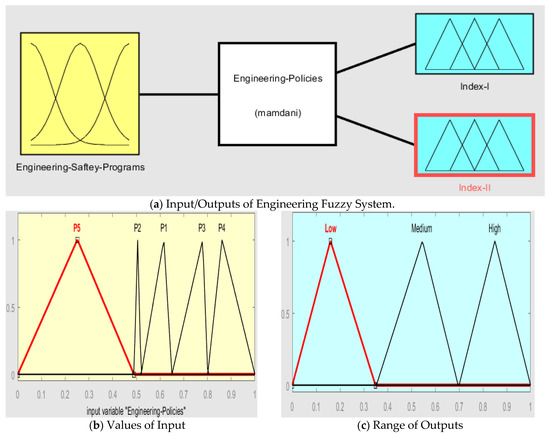
Figure 3.
Engineering Fuzzy System.
4. Fuzzy System Evaluation
Inputs of the engineering, enforcement, education and raising awareness and legislation policy fuzzy system are presented in Table 5, Table 6, Table 7 and Table 8 respectively.
Table 5.
Levels of Engineering fuzzy systems input values.
Table 6.
Levels of enforcement fuzzy systems input values.
Table 7.
Levels of education and raising awareness fuzzy systems input values.
Table 8.
Levels of legislation fuzzy systems input values.
If–Then rules were used as part of the proposed fuzzy control or Fuzzy decision systems. Table 9 shows examples of the fuzzy rules that were implemented for the road safety policies.
Table 9.
Example of fuzzy rules that are implemented for safety programs.
The inputs and outputs for the engineering, enforcement, education and raising awareness and legislation road safety policies fuzzy system are shown in Table 10, Table 11, Table 12 and Table 13, respectively.
Table 10.
Engineering safety program fuzzy system inputs and outputs.
Table 11.
Enforcement safety program fuzzy system inputs and outputs.
Table 12.
Education–raising awareness safety program fuzzy system inputs and outputs.
Table 13.
Legislation safety program fuzzy system inputs and outputs.
5. Comparative Analysis of the Results and Discussions
Road safety in developing and in low-income countries is attracting much more attention and research interest due to its importance in saving lives and its impact on sustainability. For example, several studies investigated sustainable urban travel policies and road safety, employing sustainable approaches. Other studies investigated policies and programs that aim at reducing GHG emissions and, hence, can reduce road accidents as a result of reducing extreme weather conditions and reducing distractions to the drivers on the road; see [28,29,30,31] for further discussions on road accidents, sustainability and safety policies.
The analysis presented in this section comprised of two examinations: an analytical component and a fuzzy logic system component. The two sets of results were discussed and evaluated. The analytical part of the analysis was carried out using a five-point Likert scale response system to report the attitudes of the Saudi female participants towards the safety programs and policies. In order to assess the perceived usefulness and acceptability of the safety policies, two sets of indices were calibrated and assessed. The outcome showed a general backing for the safety policies. In particular, the engineering policies, including road signs and marking, improving road network alignment, monitoring driver speed and engineering speed reduction measures, were strongly supported. The participants were also in support of the presence of traffic police as well as speed enforcement. It is an interesting outcome to see that enforcement policies are still perceived to be most effective.
Four fuzzy systems were designed and tested on the safety policies for predicting the perceived support of the safety policies using the same two indices. For each of the four-road safety programs that were tested, one fuzzy system was calibrated. The participants’ reported perceptions of each policy were used as inputs, and the perceived effectiveness indices were assessed as the outputs.
The resulting values of indices Index I and Index II were estimated using the fuzzy control analysis and were compared with the numerically estimated values using Equation (1), as presented in Table 14 below. Using Pearson’s Chi-squared test, an analysis was carried out to determine if there was a significant difference between the two sets of results (analytical and fuzzy logic results). The two assumptions to perform the Pearson’s Chi-squared test were that the tested variables should be categorical data and that there should be two or more independent groups. In this case, there were two sets of data, and they were categorical. The null hypothesis in this case was that “there is no difference between the two sets of results obtained from the analytical analysis and the fuzzy logic analysis”. The alternative hypothesis was that “There is a difference between the results obtained from the analytical analysis and the fuzzy logic analysis”.
Table 14.
Values of calibrated indices (Index I and Index II) that were estimated analytically and using the fuzzy control analysis.
Equation (2) shows the formula that was used in this analysis, which is the general equation used in the Chi-squared tests:
where Oi is the observed values from the analytical and fuzzy results, and the Ei are the expected, which are the overall mean values, assuming that there is no difference between the two sets of data. In our analysis, we obtained a p-value of 0.342, which was above the significance thresholds of p < 0.05 or 0.10. Thus, we accepted the null hypothesis that there is no difference between the results obtained from the analytical analysis and the fuzzy logic analysis and rejected the alternative hypothesis. As can be seen from Table 14, most of the numerical values of the two sets of indices were comparable (the analytical results and the fuzzy logic results) at significance values of 90% (*) or 95% (**). Therefore, the obtained results from the fuzzy logic present good evidence that the fuzzy logic control system is an applicable technique that can be used in the prediction of perceptions and of travel behavior in attitudinal studies.
χ2 = ∑(Oi − Ei)2/Ei
6. Conclusions
In this paper, road safety programs were investigated and assessed in the context of road safety in Saudi Arabis from the viewpoint of female users. Saudi females started driving in 2020, and their perception of road safety is of eminent importance. Data were collected in 2019 as part of a travel behavior survey in Riyadh (KSA) of a sample of 375 female participants. The survey was firstly piloted then executed after validation. Four groups of road safety programs were examined: engineering, enforcement, education and raising awareness and legislation. The road safety programs were assessed using two techniques. The analysis included, firstly, an analytical approach and, secondly, a fuzzy logic system. The two approaches were then compared and assessed. The analytical analysis involved using a Likert-scale response system to report the Saudi female participants’ opinions on the list of safety programs and policies. Two sets of indices were calibrated to evaluate the perceived usefulness and acceptability of the safety policies. The results showed overall support for the safety programs and policies by the participants, in particular for the engineering policies, such as the use of road signs and marking, improving road network alignment, monitoring driver speed and engineering speed reduction measures. The physical presence of traffic police was seen to be highly supported amongst participants. This was an interesting result that showed that enforcement policies are still perceived to be most effective. In this category, the policy of speed enforcement seemed to be highly supported by participants. Four fuzzy systems were designed and executed on the safety policies for predicting the safety indexes. One fuzzy system was calibrated for each road safety program (engineering, enforcement, education and raising awareness and legislation polices), with participants’ reported perception of each policy used as inputs and the perceived effectiveness indices as the outputs. The results obtained from the artificial intelligence (the fuzzy logic) showed that the fuzzy logic control system is a simple and inexpensive technique that can be used in the prediction of travel behavior perceptions and attitudinal studies. For comparing the accuracy of the results that were obtained from the analytical approach and the fuzzy logic system, a Pearson’s chi-squared test was used. The outcomes showed that most of the values of the two sets of indices from the analytical analysis were comparable with those obtained from the fuzzy logic analysis at a significant level of at least 90%. While the fuzzy logic analysis has been mostly used in hard engineering assessments and investigations, such as mechanical engineering and system design applications, the results obtained in this investigation show that the efficacy and adequacy of the proposed fuzzy logic control system in assessing attitudinal data is sufficiently respectable to be recommended for future research.
Author Contributions
Conceptualization, W.S.E.S.S. and M.M.A.L.; methodology, W.S.E.S.S. and M.M.A.L.; software, M.M.A.L. and W.S.E.S.S.; validation, W.S.E.S.S. and M.M.A.L.; formal analysis, W.S.E.S.S. and M.M.A.L.; investigation, W.S.E.S.S. and M.M.A.L.; resources; M.M.A.L.; data curation, W.S.E.S.S. and M.M.A.L.; writing—original draft preparation, W.S.E.S.S. and M.M.A.L.; writing—review and editing, W.S.E.S.S. and M.M.A.L.; project administration, M.M.A.L.; funding acquisition, M.M.A.L. All authors have read and agreed to the published version of the manuscript.
Funding
This research was funded by the Princess Nourah Bint Abdulrahman University Researchers, Supporting Project number (PNURSP2022R152) and Princess Nourah Bint Abdulrahman University, Riyadh, Saudi Arabia.
Institutional Review Board Statement
IRB Log Number: 21-0347, PNU.
Informed Consent Statement
Not applicable.
Data Availability Statement
Not applicable.
Conflicts of Interest
The authors declare no conflict of interest.
References
- Ledesma, R.D.; Tosi, J.D.; Díaz-Lázaro, C.M.; Poó, F.M. Predicting road safety behavior with implicit attitudes and the Theory of Planned Behavior. J. Saf. Res. 2018, 66, 187–194. [Google Scholar] [CrossRef] [PubMed]
- Saleh, W.; Malibari, A. Saudi Women and Vision 2030: Bridging the Gap? Behav. Sci. 2021, 11, 132. [Google Scholar] [CrossRef] [PubMed]
- Axhausen, K.W. Chapter 11 Concepts of Travel Behavior Research, 360. Available online: https://www.researchgate.net/publication/237262766_Concepts_of_Travel_Behavior_Research (accessed on 28 January 2022).
- WHO. WHO Global Status Report on Road Safety 2013: Supporting a Decade of Action; World Health Organisation: Luxembourg, 2013. [Google Scholar]
- Organisation for Economic Co-operation Development (OECD). Road Accidents (Indicator). 2016. Available online: http://data.oecd.org/transport/road-accidents.htm (accessed on 28 January 2022).
- Grayson, G.B.; Maycock, G. From proneness to liability. In Road User Behaviour. Theory and Research; Rothengatter, J.A., De Bruin, R., Eds.; Van Gorcum: Assen, The Netherlands, 1998; pp. 234–242. [Google Scholar]
- Lajunen, T.; Summala, H. Can we trust self-reports of driving? Effects of impression management on driver behaviour questionnaire responses. Transp. Res. Part F Traffic Psychol. Behav. 2003, 6, 97–107. [Google Scholar] [CrossRef]
- Lourens, P.F.; Vissers, J.A.; Jessurun, M. Annual mileage, driving violations, and accident involvement in relation to drivers’ sex, age, and level of education. Accid. Anal. Prev. 1999, 31, 593–597. [Google Scholar] [CrossRef]
- Ulleberg, P.; Rundmo, T. Personality, attitudes and risk perception as predictors of risky driving behaviour among young drivers. Saf. Sci. 2003, 41, 427–443. [Google Scholar] [CrossRef]
- Teese, R.; Bradley, G. Predicting Recklessness in Emerging Adults: A Test of a Psychosocial Model. J. Soc. Psychol. 2008, 148, 105–126. [Google Scholar] [CrossRef] [PubMed] [Green Version]
- Whissell, R.W.; Bigelow, B.J. The Speeding Attitude Scale and the Role of Sensation Seeking in Profiling Young Drivers at Risk. Risk Anal. 2003, 23, 811–820. [Google Scholar] [CrossRef]
- Oltedal, S.; Rundmo, T. The effects of personality and gender on risky driving behaviour and accident involvement. Saf. Sci. 2006, 44, 621–628. [Google Scholar] [CrossRef]
- Yagil, D. Gender and age-related differences in attitudes toward traffic laws and traffic violations. Transp. Res. Part F Traffic Psychol. Behav. 1998, 1, 123–135. [Google Scholar] [CrossRef]
- Evans, L. Traffic Safety and the Driver, 1st ed.; Van-Nostrand Reinhold: New York, NY, USA, 1991. [Google Scholar]
- Al-Rukaibi, F.; Ali, M.A.; Aljassar, A.H. Traffic safety attitudes and driving behavior of university students: Case study in Kuwait. Transp. Res. Rec. J. Transp. Res. Board 2006, 1969, 65–71. [Google Scholar] [CrossRef]
- Bener, A.; Ozkan, T.; Lajunen, T. The driver behaviour questionnaire in Arab Gulf countries: Qatar and United Arab Emirates. Accid. Anal. Prev. 2008, 40, 1411–1417. [Google Scholar] [CrossRef] [PubMed]
- Mohamed, M.; Bromfield, N.F. Attitudes, driving behavior, and accident involvement among young male drivers in Saudi Arabia. Transp. Res. Part F Traffic Psychol. Behav. 2017, 47, 59–71. [Google Scholar] [CrossRef]
- Ge, Y. A Two-Stage Fuzzy Logic Control Method of Traffic Signal Based on Traffic Urgency Degree. Model. Simul. Eng. 2014, 2014, 694185. [Google Scholar] [CrossRef] [Green Version]
- Koukol, M.; Zajíčková, L.; Marek, L.; Tuček, P. Fuzzy Logic in Traffic Engineering: A Review on Signal Control. Math. Probl. Eng. 2015, 2015, 979160. [Google Scholar] [CrossRef] [Green Version]
- Chen, G.; Pham, T.T.; Boustany, N. Introduction to Fuzzy Sets, Fuzzy Logic, and Fuzzy Control Systems. Appl. Mech. Rev. 2001, 54, B102–B103. [Google Scholar] [CrossRef] [Green Version]
- Jäkel, J.; Mikut, R.; Bretthauer, G. Fuzzy Control Systems. Control. Syst. Robot. Autom. 2004, XVII, 1–11. Available online: http://www.eolss.net/sample-chapters/c18/e6-43-23.pdf (accessed on 20 January 2022).
- Jha, M.; Shukla, S. Design Of Fuzzy Logic Traffic Controller For Isolated Intersections with Emergency Vehicle Priority System Using MATLAB Simulation, computer Science Bibliography. arXiv 2014, arXiv:1405.0936. Available online: https://ui.adsabs.harvard.edu/abs/2014arXiv1405.0936J/abstract (accessed on 20 January 2022).
- Passino, K.M.; Yurkovich, S. Fuzzy Control, Copyright 1998, Addison Wesley Longman, Inc. Available online: https://www2.ece.ohio-state.edu/~passino/FCbook.pdf (accessed on 20 January 2022).
- Urrea, C.; Kern, J.; Alvarado, J. Design and Evaluation of a New Fuzzy Control Algorithm Applied to a Manipulator Robot. Appl. Sci. 2020, 10, 7482. [Google Scholar] [CrossRef]
- Lee, C.C. Fuzzy logic in control systems: Fuzzy logic controller. I. IEEE Trans. Syst. Man Cybern. 1990, 20, 404–418. [Google Scholar] [CrossRef] [Green Version]
- Disha, S. Designing and Modeling Fuzzy Control Systems. Int. J. Comput. Appl. 2011, 16, 46–53. [Google Scholar]
- Mendel, J.M. Fuzzy logic systems for engineering: A tutorial. Proc. IEEE. 1995, 83, 345–377. [Google Scholar] [CrossRef] [Green Version]
- Tatari, O.; Onat, N.; Abdel-Aty, M.; Alirezaei, M. Dynamic Simulation Models for Road Safety and Its Sustainability Implications. 2015. Available online: http://safersim.nads-sc.uiowa.edu/final_reports/UCF-2-Y1_FinalReport.pdf (accessed on 20 January 2022).
- Heydari, S.; Hickford, A.; McIlroy, R.; Turner, J.; Bachani, A.M. Road safety in low-income countries: State of knowledge and future directions. Sustainability 2019, 11, 6249. [Google Scholar] [CrossRef] [Green Version]
- May, T.; Crass, M. Sustainability in transport: Implications for policy makers. Transp. Res. Rec. J. 2007, 2017, 1–9. [Google Scholar] [CrossRef]
- Arowolo, M.O.; Rohani, J.; Rani, M.R.A. Development of Road Safety Sustainability Model for Malaysian Road. Appl. Mech. Mater. 2014, 606, 235–239. [Google Scholar] [CrossRef]
Publisher’s Note: MDPI stays neutral with regard to jurisdictional claims in published maps and institutional affiliations. |
© 2022 by the authors. Licensee MDPI, Basel, Switzerland. This article is an open access article distributed under the terms and conditions of the Creative Commons Attribution (CC BY) license (https://creativecommons.org/licenses/by/4.0/).