1. Introduction
After a coal seam is mined out from underground, the rock stratum above the goaf is affected by mining, resulting in collapses, cracks, and surface subsidence, water level decline, ecological environment deterioration, and so on [
1,
2,
3]. When mining shallow buried thick coal seams (SBTCS), these phenomena and the damage are more serious and faster [
4]. The main areas of coal exploitation in China have been transferred from east to west. Northwest China is enriched in coal with shallow buried, thick coal seams and simple overburden geological conditions [
5]. The Daliuta Coalfield, in northern Shanxi Province, China [
6], is located under a thick aeolian sand (TAS) layer of Quaternary sediment, mainly aeolian sand [
7]. This is a typical coal seam occurrence condition with SBTCS. There are numerous problems associated with mining SBTCS, especially under TAS layers. After the coal seam is mined, a roof of coal collapse can cause grave damage to the overburden and ground covered by the aeolian sand [
8,
9,
10]. Ground subsidence and cracks are another critical issue [
11,
12,
13]. Many experts and scholars have conducted research on this problem of mining SBTCS and have achieved rich results. FAN De-yuan and others integrated physical and mechanical tests, theoretical analysis, similar material tests, numerical calculations, on-site industrial tests and other methods [
14,
15]. They systematically studied the deformation mechanism of the surrounding rock in mining under TAS and thick coal seam (TCS). They established a mechanical analysis model for the surrounding rock. The change in the regular pattern of displacement, stress, energy and other parameters were analyzed [
16,
17]. These studies did not consider thin, overburden and shallow burials. A numerical simulation method has be used to study the design of a retaining coal pillar width in mining SBTCS to ensure mining safety and improve coal yield [
18,
19,
20,
21]. Behrooz Ghabraie and others established a stress model and calculated and analyzed the stress related problems of mining TAS and TCS. According to the data of surface settlement monitoring and the geomechanical parameters of geological boreholes, the relevant parameters of the numerical model are corrected and adjusted. Numerical simulation and engineering analysis have established a mechanical theoretical basis for SBTCS [
22,
23,
24]. Through theoretical derivation and numerical simulation analysis, Booth and others studied the surface deformation caused by overburden failure in mining SBTCS under TAS and established a prediction model for subsidence [
25,
26]. The existing prediction methods for mining subsidence cannot correctly explain deforming ground undulations. The research focuses on surface subsidence. Li Meng and others aimed at the complex conditions of ground undulations. Through similar material tests and numerical simulation analysis, a new prediction method for overburden movement was proposed based on key stratum theory and the rock Mohr–Coulomb failure criterion [
15,
27,
28]. According to the occurrence characteristics of SBTCS, Park and others systematically studied the development and evolution regulations of overburden failure in shallow buried coal seams by using a similar 3D material physical test method. Ground subsidence of the SBTCS is mainly caused by aeolian sand layer settlement and bedrock breakage. The length and advancing distance of the workface directly affect the displacement of the surface and overburden [
10].
However, most of the above research is mainly aimed at SBTCS with burial depths greater than 150 m, and depth (burial depth of coal seam) to thickness (thickness of coal seam) ratios (DTR) are more than 15 (
H/
h > 15). Some of them focus on TCS or TAC separately. Some scholars have used similar methods of test analysis, a small error can be amplified dozens or even hundreds of times because of the similarity ratio. Others have established corresponding mechanics based on the movement characteristics of the overburden. This method is based on theoretical calculation, and the essence of overburden failure can be obtained. Using the numerical simulation method based on theoretical calculations, the characteristics and regular pattern of overburden failure can be obtained [
29]. In this study, the buried depth of SBTCS is approximately
H = 90 m, and thickness of coal is
h = 6.7 m (DTR = 13.43, less than 15) [
30]. The thickness of aeolian sand is 38.5 m, accounting for approximately 42.6% of the buried depth, which is located in the Daliuta mine. According to the theory of the key stratum, the mechanical model of a key stratum collapse was established, and the initial failure distance and periodic failure distance of the key stratum were calculated. The model was verified by numerical simulation. This paper discusses the characteristics of overburden failure with mining SBTCS under TAS. It explains the ground damage characteristics and cracks development.
2. Materials and Methods
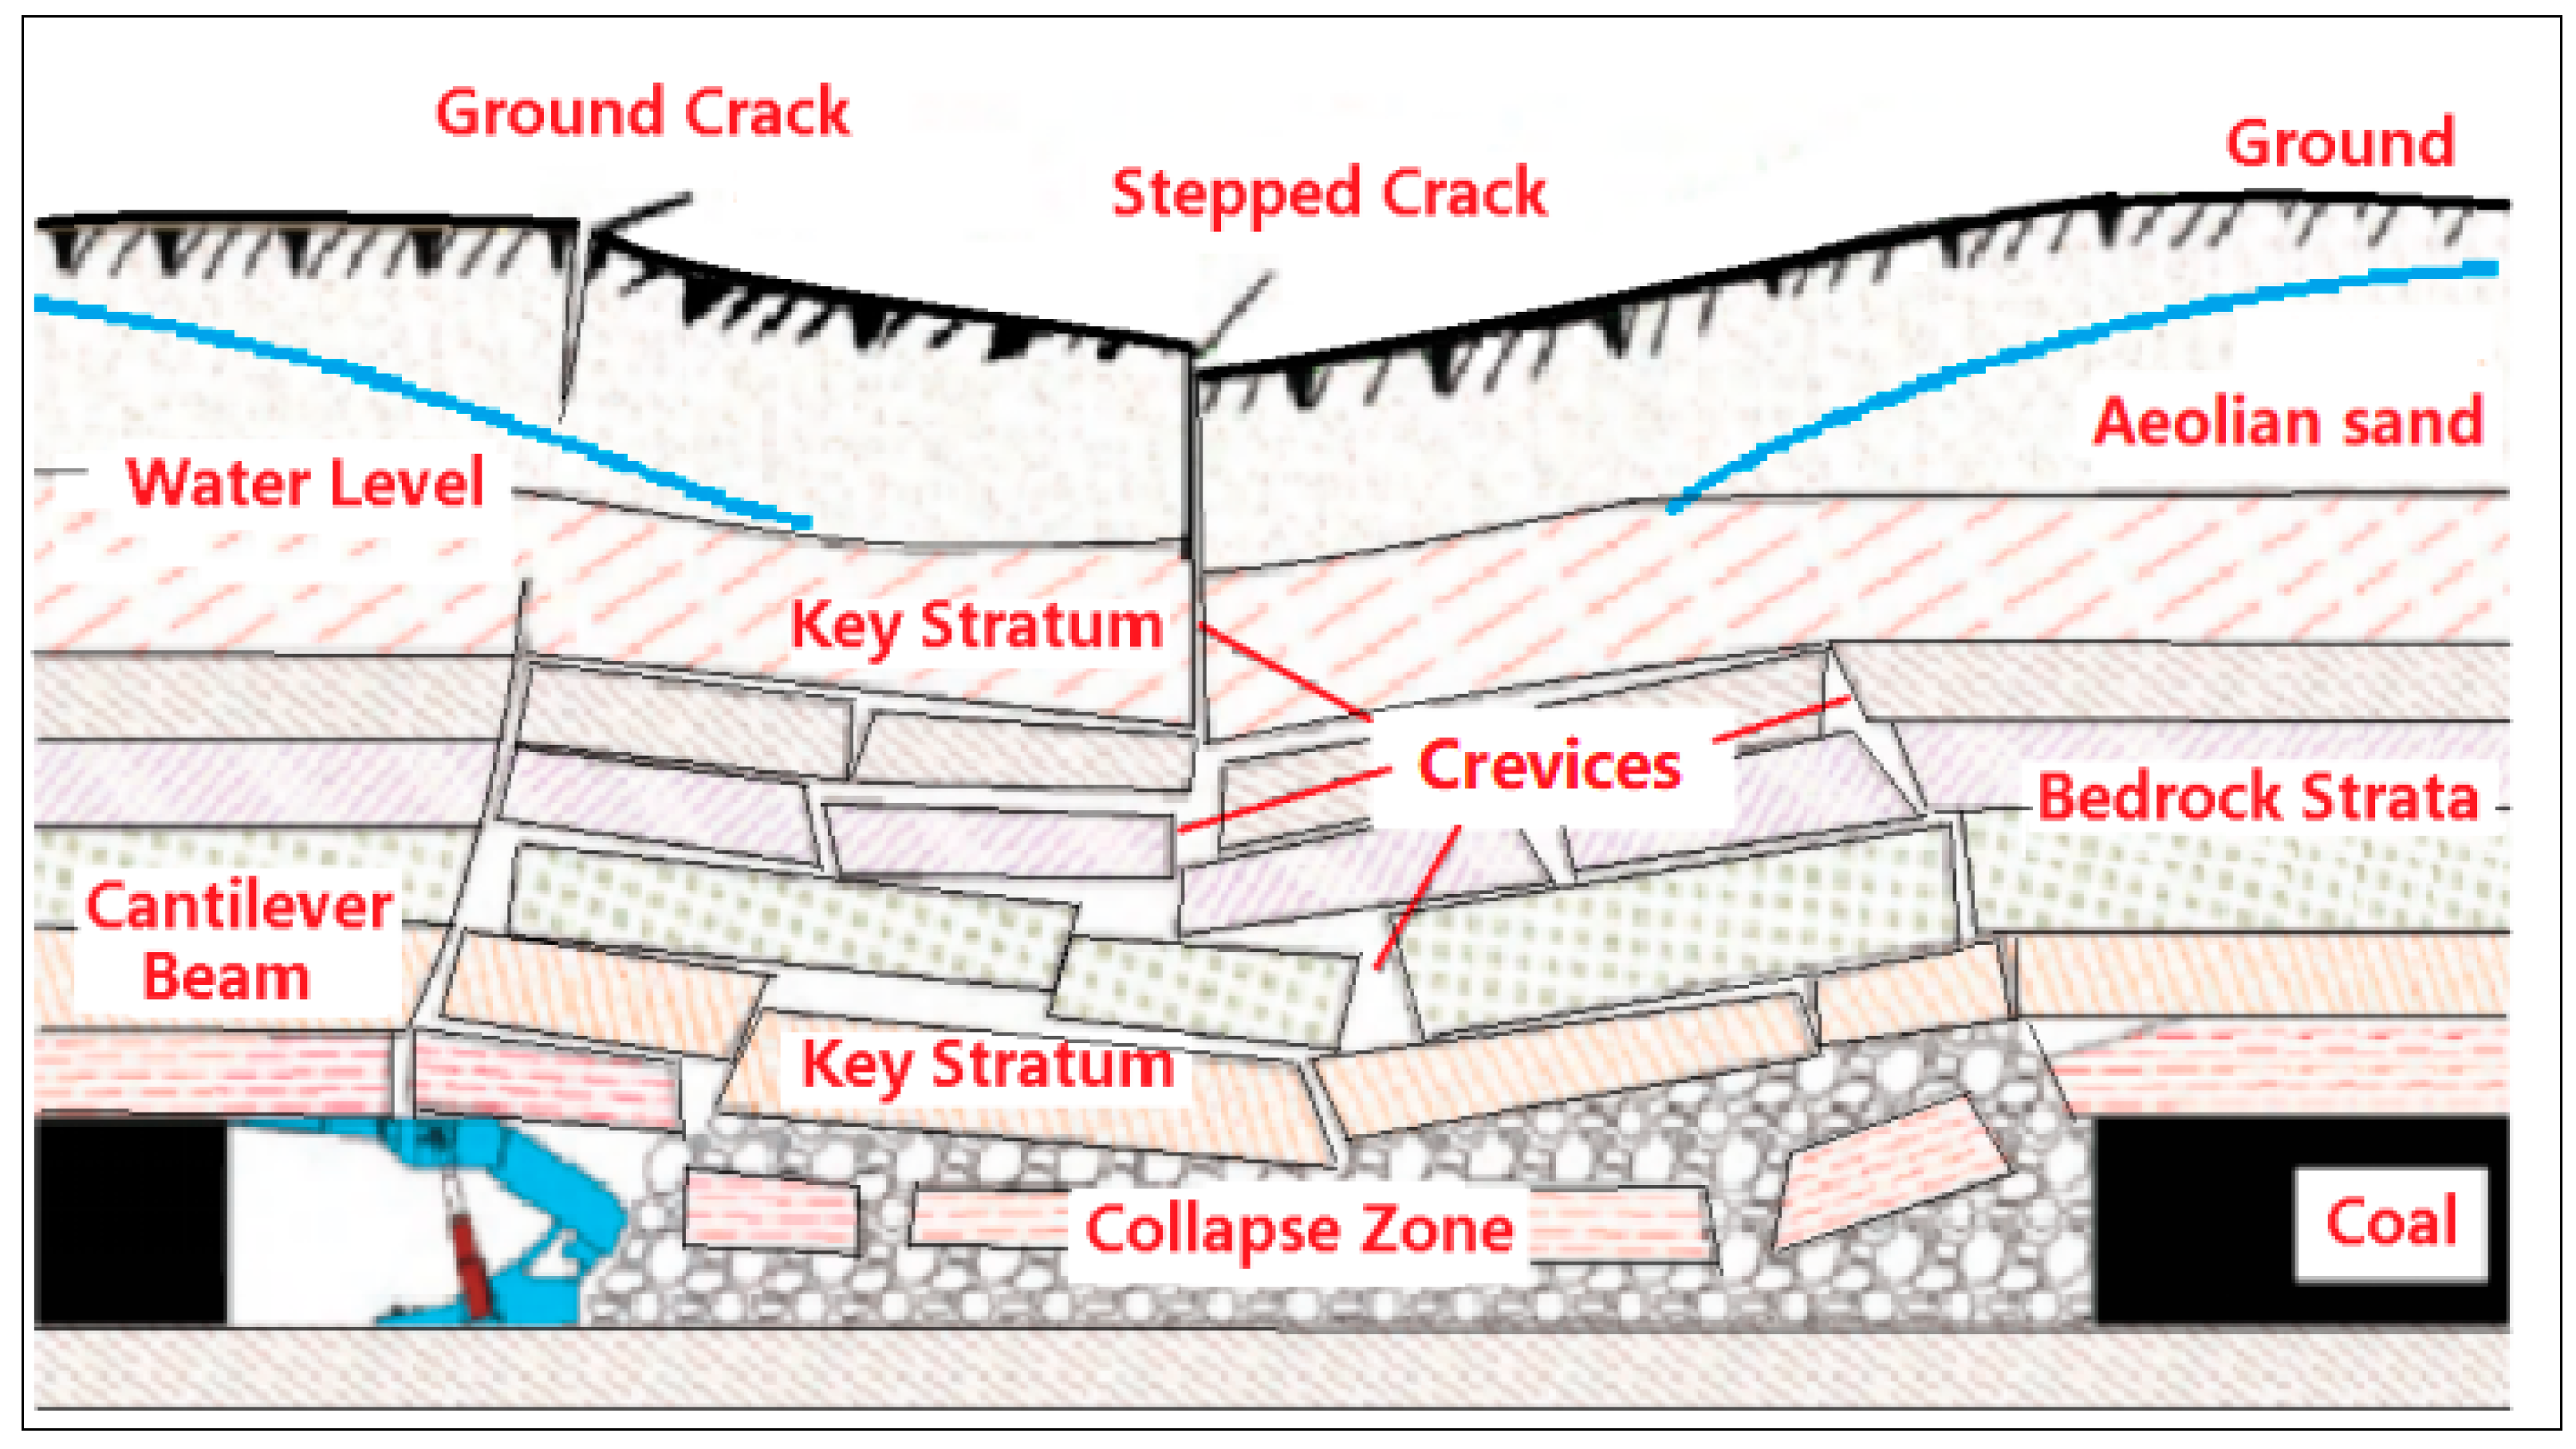
Academician Qian Minggao and others proposed the key stratum theory [
31,
32]. Due to the difference in thickness and properties of each rock layer in the overburden, its control and support of various overburdened rock strata are significantly different. The thickness and elastic modulus of the key stratum are large, and the strength is stronger than that of the other strata. The subsidence of key stratum is synchronous and coordinated in all or part of the upper overburden. Before the key stratum breaks, a slab or beam is formed to bear the weight of the upper rock. When it fails, it can continue to support the upper overburden with a “cantilever beam” as shown in
Figure 1.
The overburden is simplified into a calculation model to analyze the failure principle of the key stratum. Assuming the bedrock layer of the overburden has
n (
n > 2) layers, the upper part of the bedrock is an aeolian sand layer with weak bearing capacity, and its load is
q. According to the key stratum theory, the first key stratum controls and bears all the overburden and key stratum above, and it simultaneously coordinates deformation [
33].
The following formula holds:
In the formula:
Mi is the bending moment of the i-th rock layer;
Ei is the elastic modulus of the i-th rock layer;
Ii is the inertia moment of the i-th rock layer.
According to the initial in situ stress conditions and the theory of key stratum, the first key stratum of overburden 1~
m (
m <
n) layers can be regarded as a composite rock beam structure, and its bending moments are:
Similarly, the second key stratum of the overburden
m + 1 ~
n (
m <
n) layers can be regarded as a composite rock beam structure, and its bending moments are:
After transforming Formula (1), the relationship between the first key stratum and others is established, and then brought into Formula (2):
Similarly, the second key stratum of the overburden
m + 1 ~
n layers can be expressed as:
When the mining distance is small, the stress of the first and second key stratum does not reached the destruction level, and the key stratum does not collapse. When the workface continues to advance and reaches the limit collapse distance, the first and second key stratum collapse simultaneously. With the workface advancing, the key stratum will collapse periodically. The key stratum block stacks into the collapse zone to form a “masonry beam”. There are numerous large pores and crevices between the blocks.
Calculating the bearing capacity of the key stratum is usually carried out by using the recursive method. First, suppose that, when the first key stratum only controls itself, the load it bears is
q1; then, it can be calculated by Formula (6):
In the formula, h1 represents the gravity density and thickness of the rock layer.
Second, when the first key stratum can bear the first and second layers, the load to be borne is
q2, and then it can be calculated by the Formula (7):
Next, recursively, the bearing capacity
qm of the
m-th stratum can be obtained [
34], which can be calculated by Formula (8):
In the formula:
hm represents the thickness of the combined key stratum m;
Em represents the elastic modulus of the combined key stratum m;
hi is the i-th rock layer thickness.
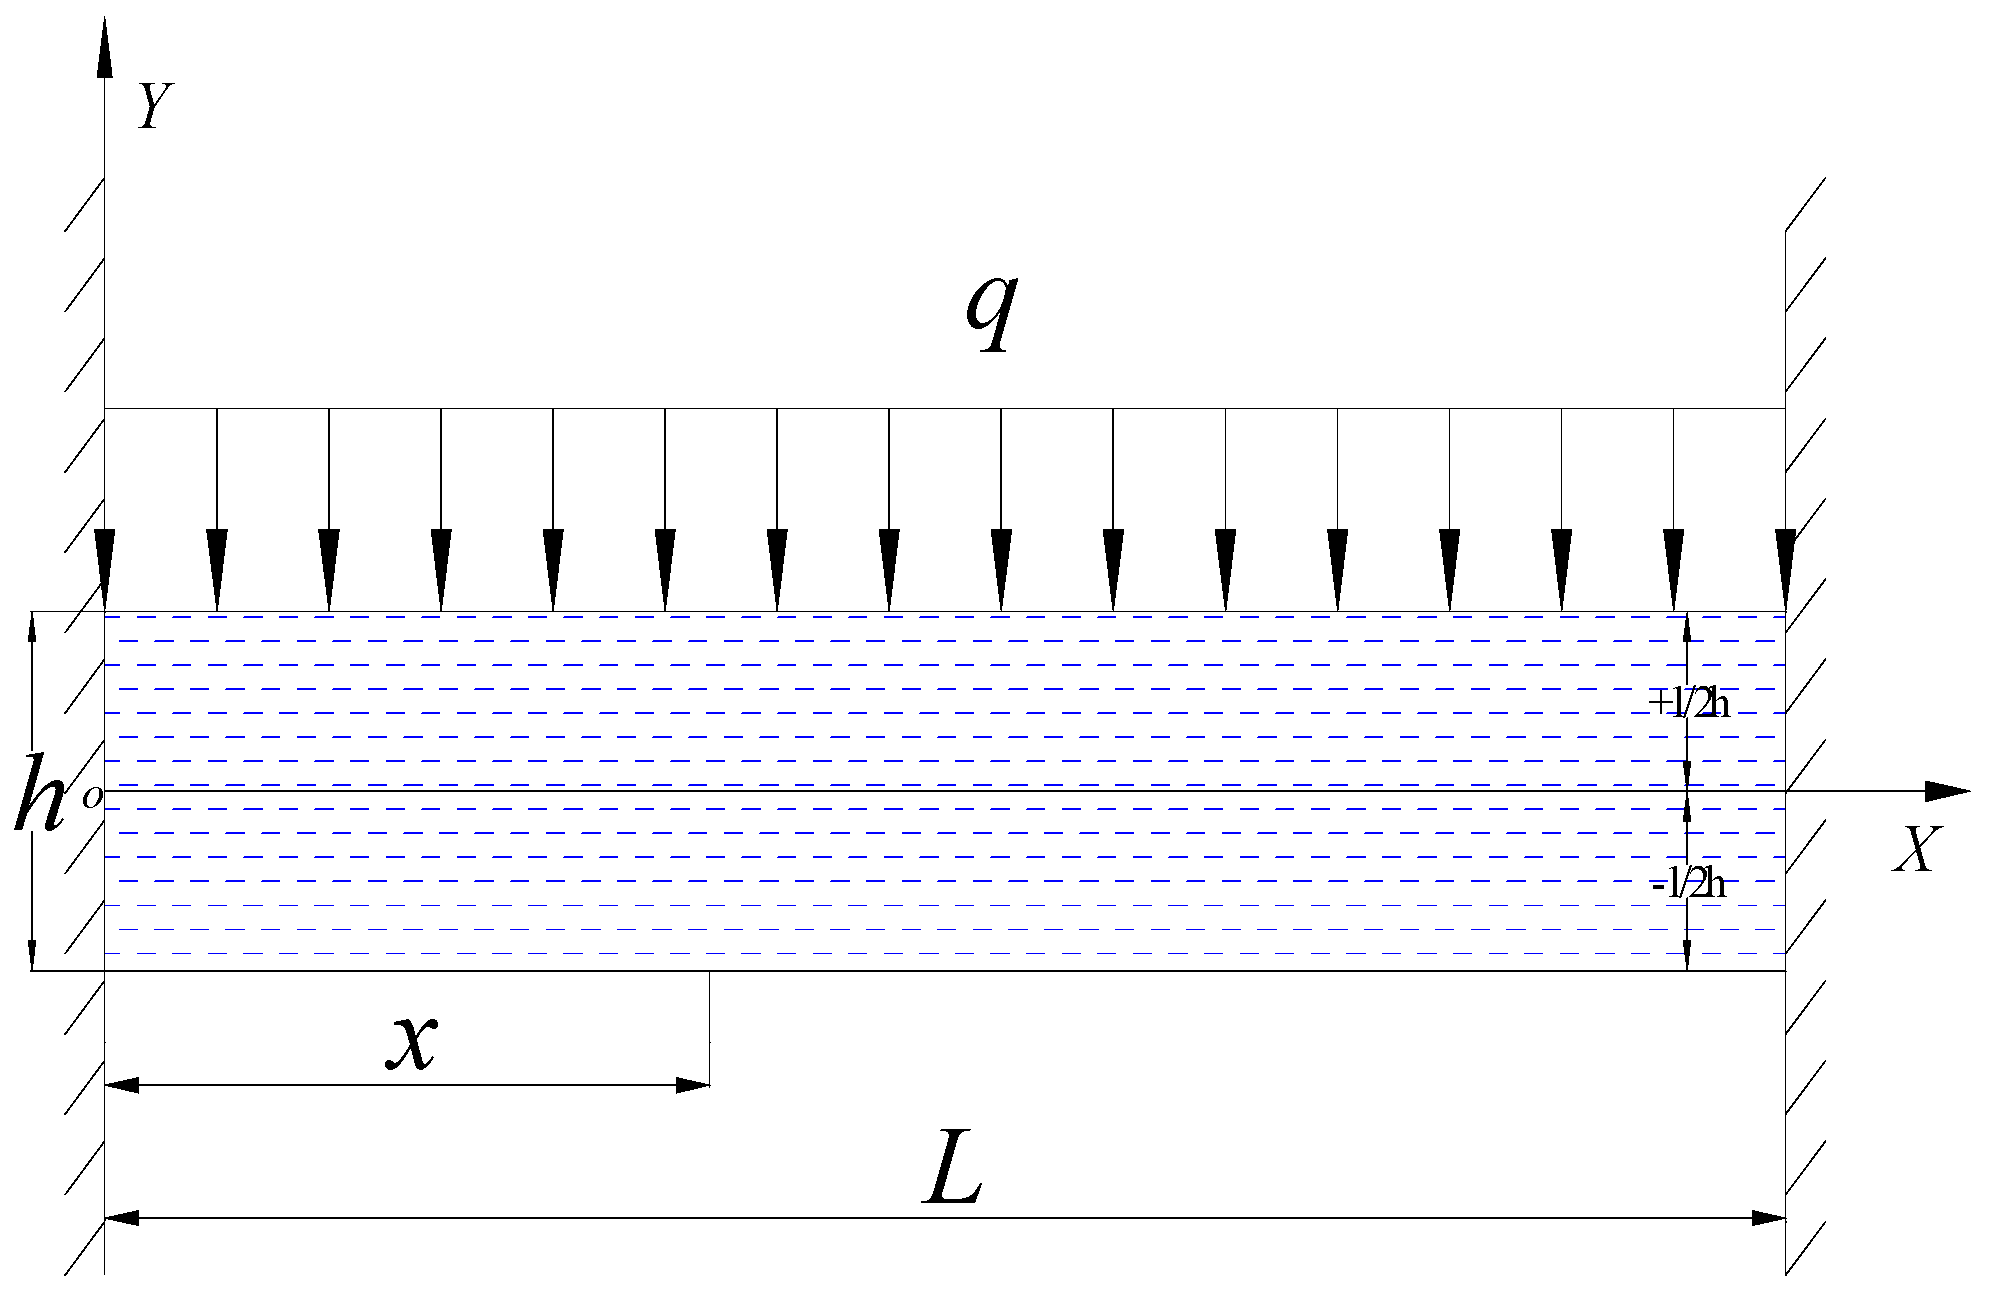
According to the characteristics of the rock beam in the key layer theory, the coordinates are established as shown in
Figure 2. To simplify the calculation, the broken distance of the key stratum is calculated using the fixed bracket mechanism model. The center of the rock beam and the left boundary of the rock beam are the origin, the positive direction of the X axis is horizontal to the right, and the positive direction of the Y axis is vertically upward. The length of the rock beam is
L, the thickness is
h, and the uniform load
q of the loose layer is applied to the upper part of the rock beam.
The bending moment of any cross-section inside the rock beam of the key stratum can be expressed as [
35]:
In the formula:
Mx is the bending moment of any cross-section x in rock beam, Pa·m2;
L is the span of the rock beam, m;
q is the rock beam load of the key stratum, Pa;
h is the thickness of the rock beam, m.
Therefore, the maximum bending moment at both ends of the beam is:
The central bending moment of the beam is:
According to mechanics, the failure of this rock beam is tensile failure. Assuming that the thickness of the rock beam is
h, the normal stress
σ of the beam upper and lower boundary
y (
) is:
The maximum stress at both ends of the beam is:
From Formula (13), the initial limit breaking distance of the
i-th key stratum is:
In the formula:
Li is the initial limit breaking distance of the i-th key stratum;
σi is the maximum tensile strength stress of the i-th key stratum;
hi is the thickness of the i-th key stratum;
qi is the load of the i-th key stratum above.
As the workface continues to advance, the overburden roof breaks and falls for the first time. The workface will break and collapse periodically. The period collapse step distance
Lp is calculated by the Formula (15):
3. Results
3.1. Engineering Background
The study area selected is the Daliuta coal mine, which belongs to the mining area under the jurisdiction of Shendong Coal Industry Group. It is located on the Ulan Mulun River in the town of Daliuta, Shenmu County, Yulin City, Shanxi Province, China, which borders Ordos City in the Inner Mongolia Autonomous Region. This mine is one of China’s most supersized and high yield mines, with an annual output of more than 21 million tons.
Figure 3 shows its geographic location. A northwesterly wind prevails in spring and winter in the study area, with a speed of approximately 3.3 m/s. The annual average precipitation is less than 400 mm, and the annual variation is considerable. Sixty percent of the annual precipitation is mainly concentrated in July–September. This study area is located in a temperate semiarid desert plateau continental monsoon climate [
36]. In the study area, there is a TAS layer covering the ground.
During the advancement of the workface, there were many dense cracks on the surface of the Daliuta mining area, showing discontinuity and some regularity. Various types of surface cracks appear on the surface, which appear in the range of 10–100 m on the surface in front of the working face. These cracks can be subdivided into tensile cracks, compression cracks and stepped cracks. Different directions of stress can be analyzed through the crack shape on the surface. According to the data, the surface damage characteristics of the Daliuta mining area are as follows: tensile cracks appear on the surface in front of the workface, with a width of 0.3–0.5 m. The step crack drop is approximately 0.4–0.9 m, the maximum depth is approximately 3.5 m, and the crack spacing is only 2–3 m. The distribution density and width of compression cracks are slightly smaller than those of tensile cracks. Compression cracks with a length of 30–50 m appear at intervals of 2–3 m, and the uplift height is approximately 0.6 m.
Workface 1203 in the Daliuta mine was taken as the research object. The ground elevation of this workface is from 1083.4 m to 1229.3 m, and the coal seam floor elevation is from 981.3 m to 1032.8 m. The burial depth of the coal seam is 82–247 m, with an inclination angle of 1–3°, and the average burial depth of the coal seam is 90.3 m. The mining average thickness of the coal seam is designed to be 6.7 m. The surface above the workface is mostly covered by Quaternary loose sediment and mainly includes aeolian sand, with a thickness of 38.5 m. A bedrock layer with a thickness of approximately 51.8 m is mainly composed of siltstone mixed with sandy mudstone, coarse grained sandstone and fine grained sandstone. The coal floor is a fine grained sandstone layer with thickness of more than 3.0 m. The mining size of the workface is designed to be 301.3 m wide, and the advancing distance is 4268.8 m long. It adopts a fully mechanized and fully caving mining method with a large mining height and long working face. This high intensity mining method will lead to severe ground damage, such as subsidence, cracks, and even collapse pits.
3.2. Numerical Simulation Model Establishment
To more clearly study the principle of surface damage and rock stratum failure, a numerical simulation method was used to simulate and analyze the study area. The actual cause of surface cracks and damage is the surface subsidence caused by the mining process. However, the surface subsidence is caused by the settlement and damage of bedrock. The failure essence of the overburden lies in the failure of key stratum. The mechanical nature of the key stratum failure is the direct expression and essence of the surface and overburden failure. The numerical simulation method is a mechanical analysis method that can reflect the essential regular pattern of things, which is well recognized and practiced. Therefore, we use the numerical simulation method to analyze the overburden and surface damage caused by the mining of SBTCS and find the essential regular pattern of overburden damage.
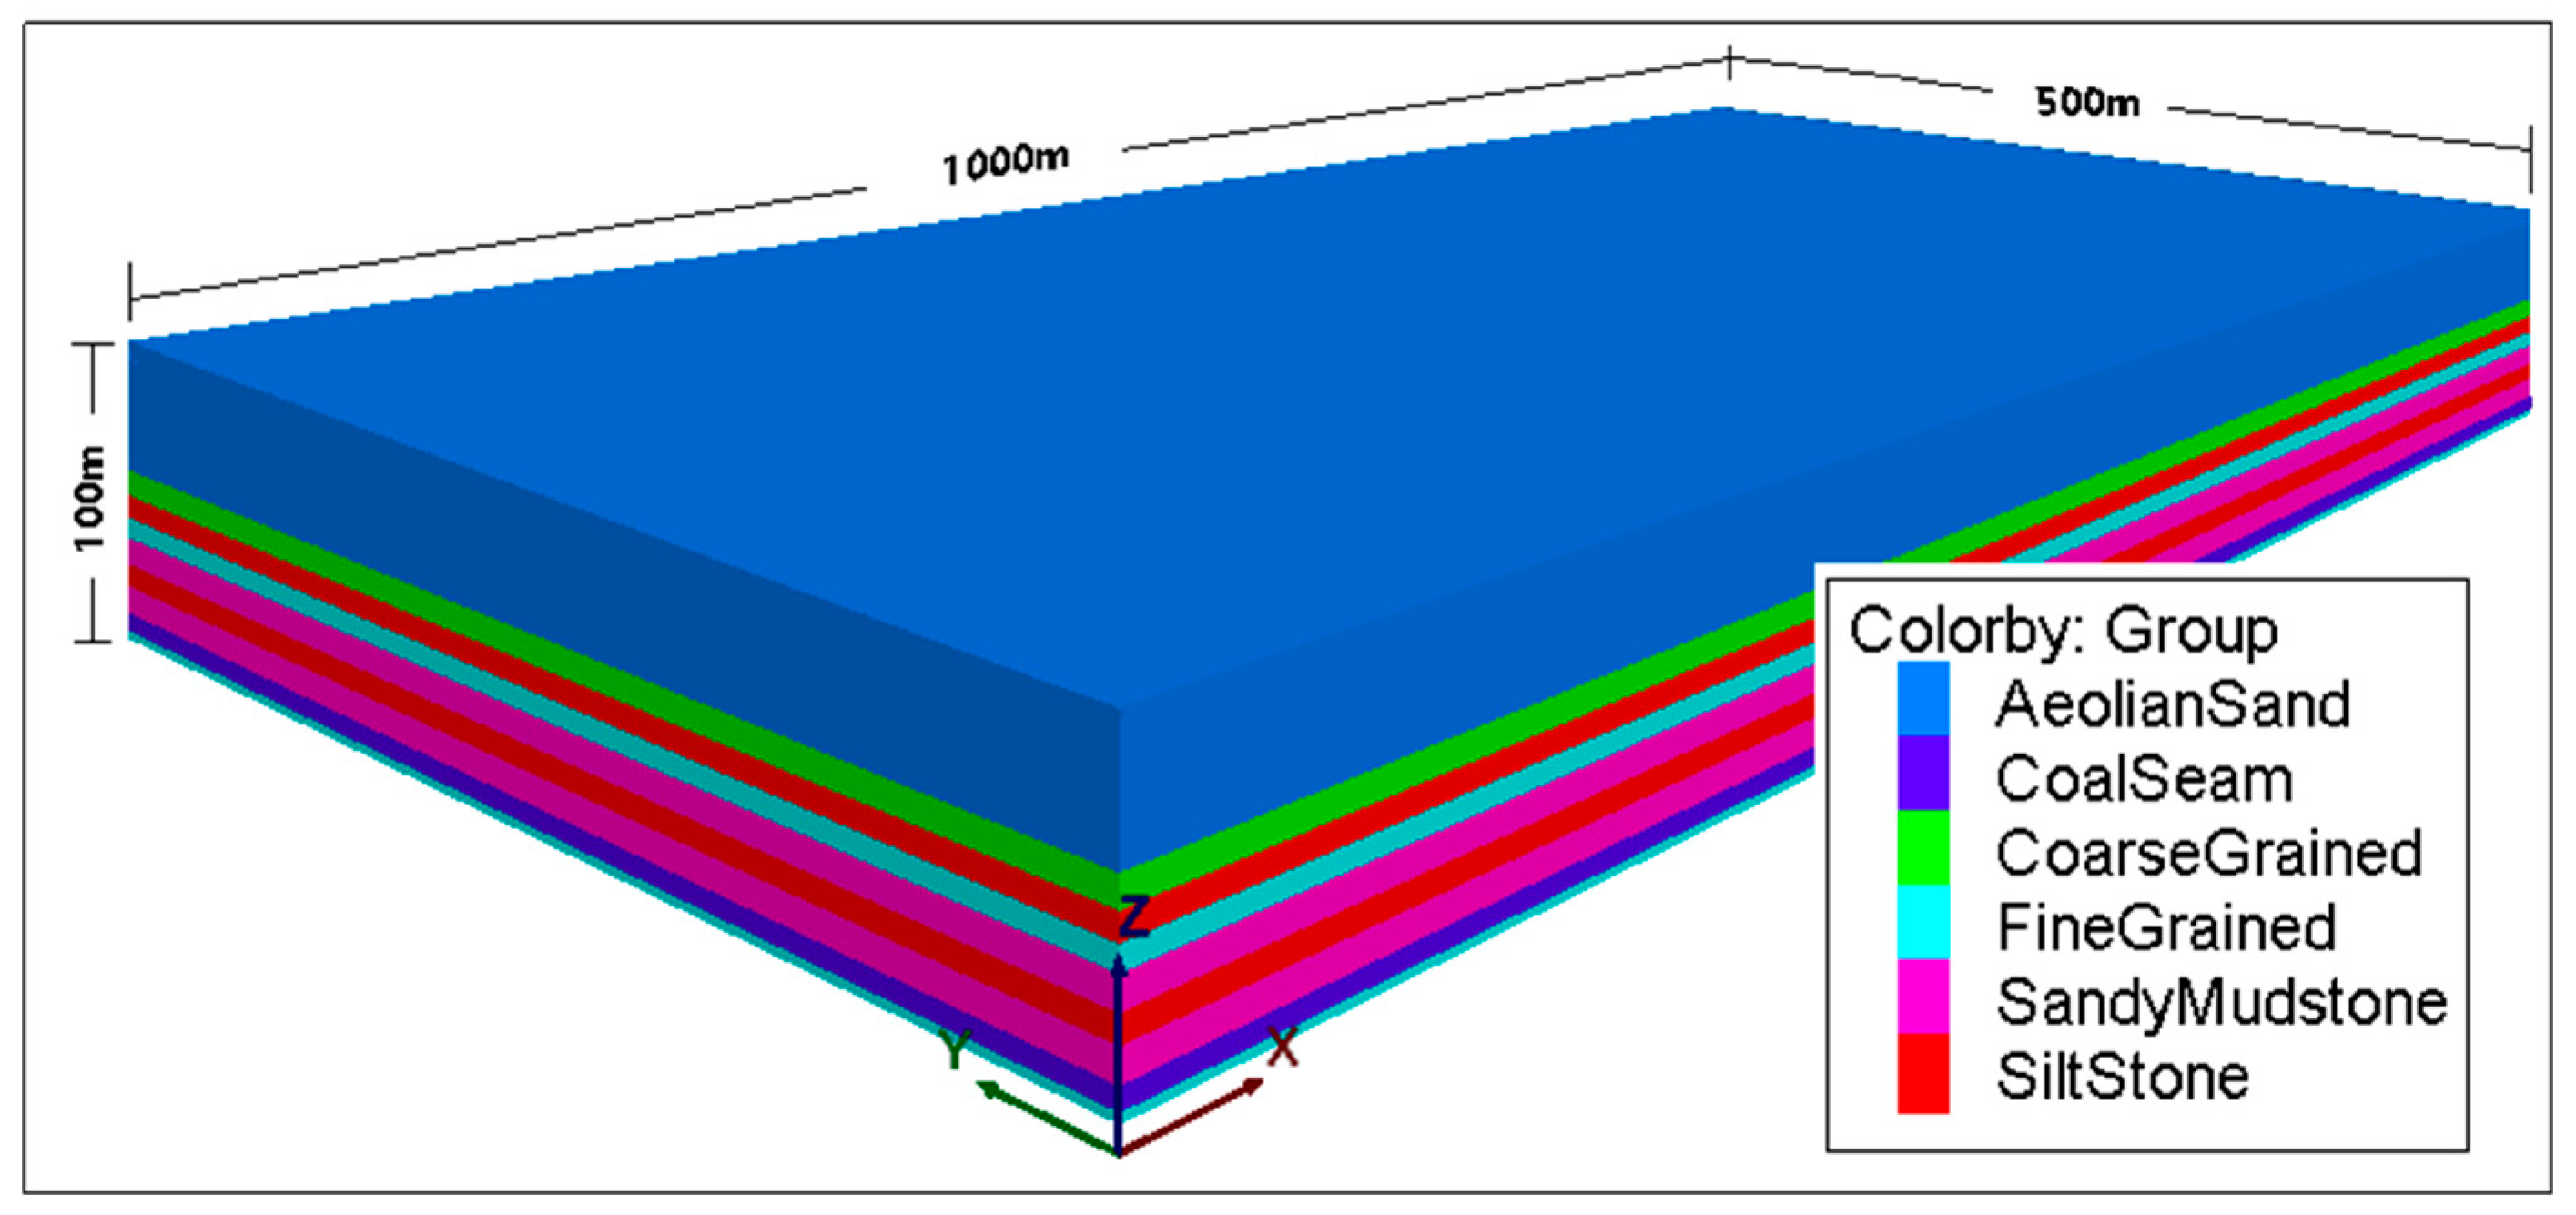
FLAC3D software was selected to calculate the numerical model based on the geological conditions of the 1203 workface in the Daliuta Coal Mine. Tecplot software was used for drawing processing in the later stage. With the Mohr–Coulomb mechanics constitutive model, a numerical calculation 3D model was established for mining SBTCS under TAS [
37,
38]. The models in the X, Y and Z directions are 1000 m, 500 m and 100 m, respectively, with a total of 5,000,000 zones and six groups, as shown in
Figure 4. Ensuring the mining size is as close to the real size as possible and reducing the influence of edge effects, 100 m coal pillars are reserved around the workface without mining. Due to a large number of nodes in the model, a high performance calculation is needed. The data solution takes a long time to reach the final mechanical equilibrium state.
To simulate the original stress of the underground rock stratum well, the model’s boundary conditions must be limited to ensure that the model more truly reflects the actual geological conditions. The periphery of the model was fixed in the
X and
Y directions, to ensure that the boundary of the simulated stratum was not deformed in the horizontal direction. The bottom was completely fixed in the vertical
Z direction, and the top was a free boundary, as shown in
Figure 5. Mechanical parameters are the most important in the process of numerical simulation [
39]. For the simulation of initial in situ stress, in FLAC, the initial stress is usually solved by setting the mechanical parameters and then solving to equilibrium. The original parameters are assigned according to the mechanical properties of the strata of the borehole. Under the action of gravity only, the initial in situ stress is solved to equilibrium (unbalance rate 10
−6). The selection and adjustment of the constitutive model and parameters is an essential link in numerical simulation. The selection of the constitutive model is related to the mechanical properties of the rock stratum, and the number and value of the corresponding parameters need to be selected for different constitutive models. The main mechanical parameters in the model came from the geological conditions of the Daliuta 1203 workface for calculating the stress in the numerical simulation. The physical and mechanical parameters of the rock stratum in the numerical simulation are shown in
Table 1.
According to the key stratum theory, determining the key stratum position requires multiple and cyclic calculations. In the calculation process, if the collapse distance of the
i − 1 th stratum is smaller than the
i th stratum, the load of the
i − 1 th stratum should be added to the
i th stratum. Recalculate until the fracture distance of the
i + 1 th stratum is smaller than that of the
i th stratum. The
i th stratum is the key stratum. Using Formulas (14) and (15), the initial breaking and periodic fracture distances are calculated. According to the rock mechanics parameters in
Table 1, we can calculate that the first key stratum is sandy mudstone, the immediate roof of coal. The initial failure distance is 52.85 m, and the periodic fracture distance is 43.12 m. Similarly, we can obtain that the second key stratum is sandy mudstone, which is between fine grained sandstone strata and siltstone strata. In the second key stratum, the initial failure distance is 56.37 m, and the periodic fracture distance is 46.03 m.
3.3. Analysis of Ground Damage and Field Measured Results
The simulation of the workface propulsion distance at 100 m, 200 m, 300 m, 400 m, 500 m, 600 m, 700 m and 800 m is extracted. According to different advancing distances, the settlement and stress changes in the surface and overburden are recorded as cloud maps. The cloud maps of the numerical simulation, such as the form of and change in ground damage, the settlement and stress distribution of the overburden, and the shape and field of plastic failure, are analyzed to obtain the failure characteristics of the overburden and surface movement and deformation.
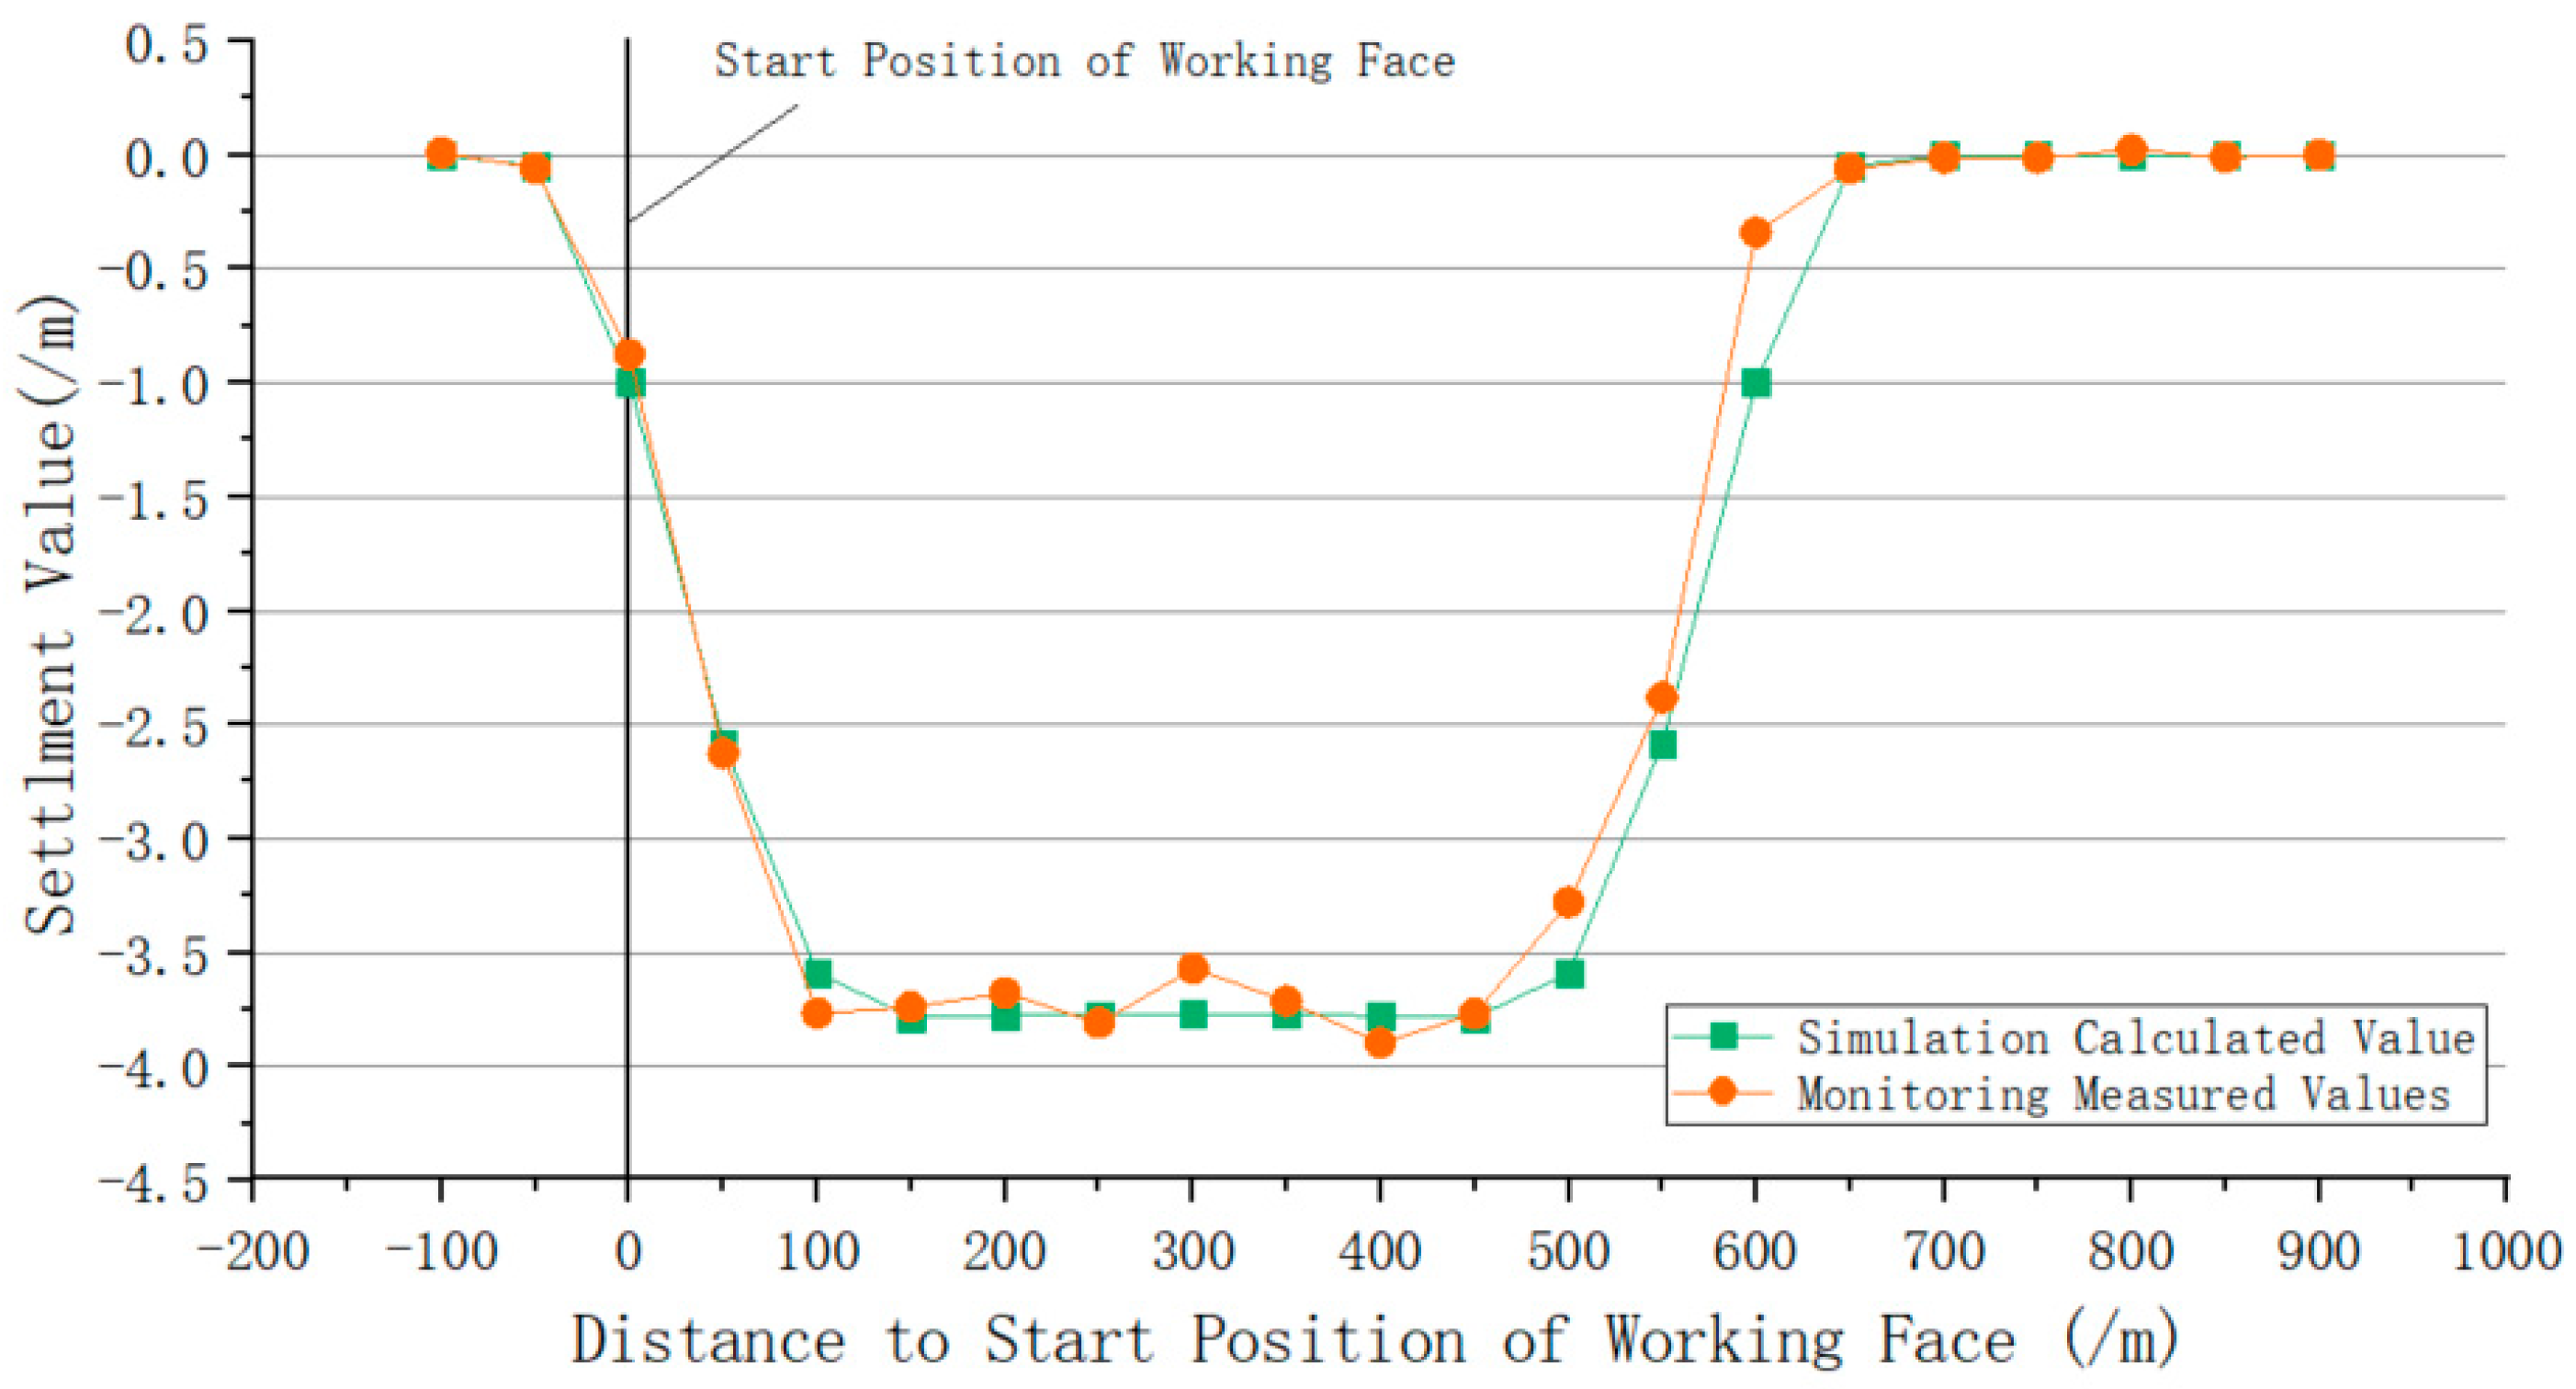
For calibration and validation of the model, to obtain surface subsidence change data of SBTCS, the 46 monitoring points, where the distance between monitoring points is set to 20–25 m, with 21.7 m on average, were set up on the surface above the ground and monitored the settlement. Surface monitoring was carried out using traditional leveling methods. Two vertical observation lines were arranged along the ground to obtain the surface subsidence under the condition of different working face advancing distances, and then the subsidence caused by mining of SBTCS was analyzed. When the workface advanced by approximately 600 m, we selected 21 points for trend analysis between measured points and simulated calculated points. The maximum settlement of the surface was −3.898 m. The ground settlement, which was calculated by FLAC 3D, reached the maximum value of −3.78544 m (the data measured in the field and calculated by FLAC3D are shown in
Figure 6). The resulting error ratio is about 2.89%. Through a comparison, it was found that the surface settlement value of the numerical simulation was very close to the field measured. The surface subsidence trend line is also in good agreement. This shows that the numerical simulation method is an effective method to calculate and predict the surface settlement caused by coal mining by establishing a reasonable 3D model, selecting an appropriate constitutive model and adjusting the corresponding mechanical parameters.
Through numerical simulation, the shape of the surface subsidence basin is very close to the actual field. The subsidence at the edge of the basin is small, and there is more subsidence in the middle, which has a flat bottom. According to
Figure 7, the settlement of the bedrock is large, and the settlement of the aeolian sand layer is small. There are large pores and cracks in the aeolian sand layer and the bedrock layer. The main reason is that aeolian sand has weak mechanical properties and good dispersion, and easily forms pores. The mechanical properties of the overburden are hard, brittle and easily broken, and collapsed. The settlement cloud map of the bedrock above the goaf shows that the settlement in the center is large and that along the edge it is smaller. The simulation calculation of the overburden settlement shows that the overburden failure caused by mining SBTCS under TAS has distinctive characteristics. The bedrock in the overburden generally has large settlements and has a large scale overall movement phenomenon, and the maximum subsidence is more than 6.5 m. The aeolian sand layer presents uniform settlement, the maximum subsidence is 3.5–4.0 m in the central basin. The movement and deformation in the central subsidence basin show uniform settlement and little change. With increasing mining distance, the surface subsidence gradually increases. When the working advance is approximately 300 m, it is close to full-mining under these geological conditions. Then, with the advance of mining distance, the ground subsidence basin appears to a flat bottom [
40].
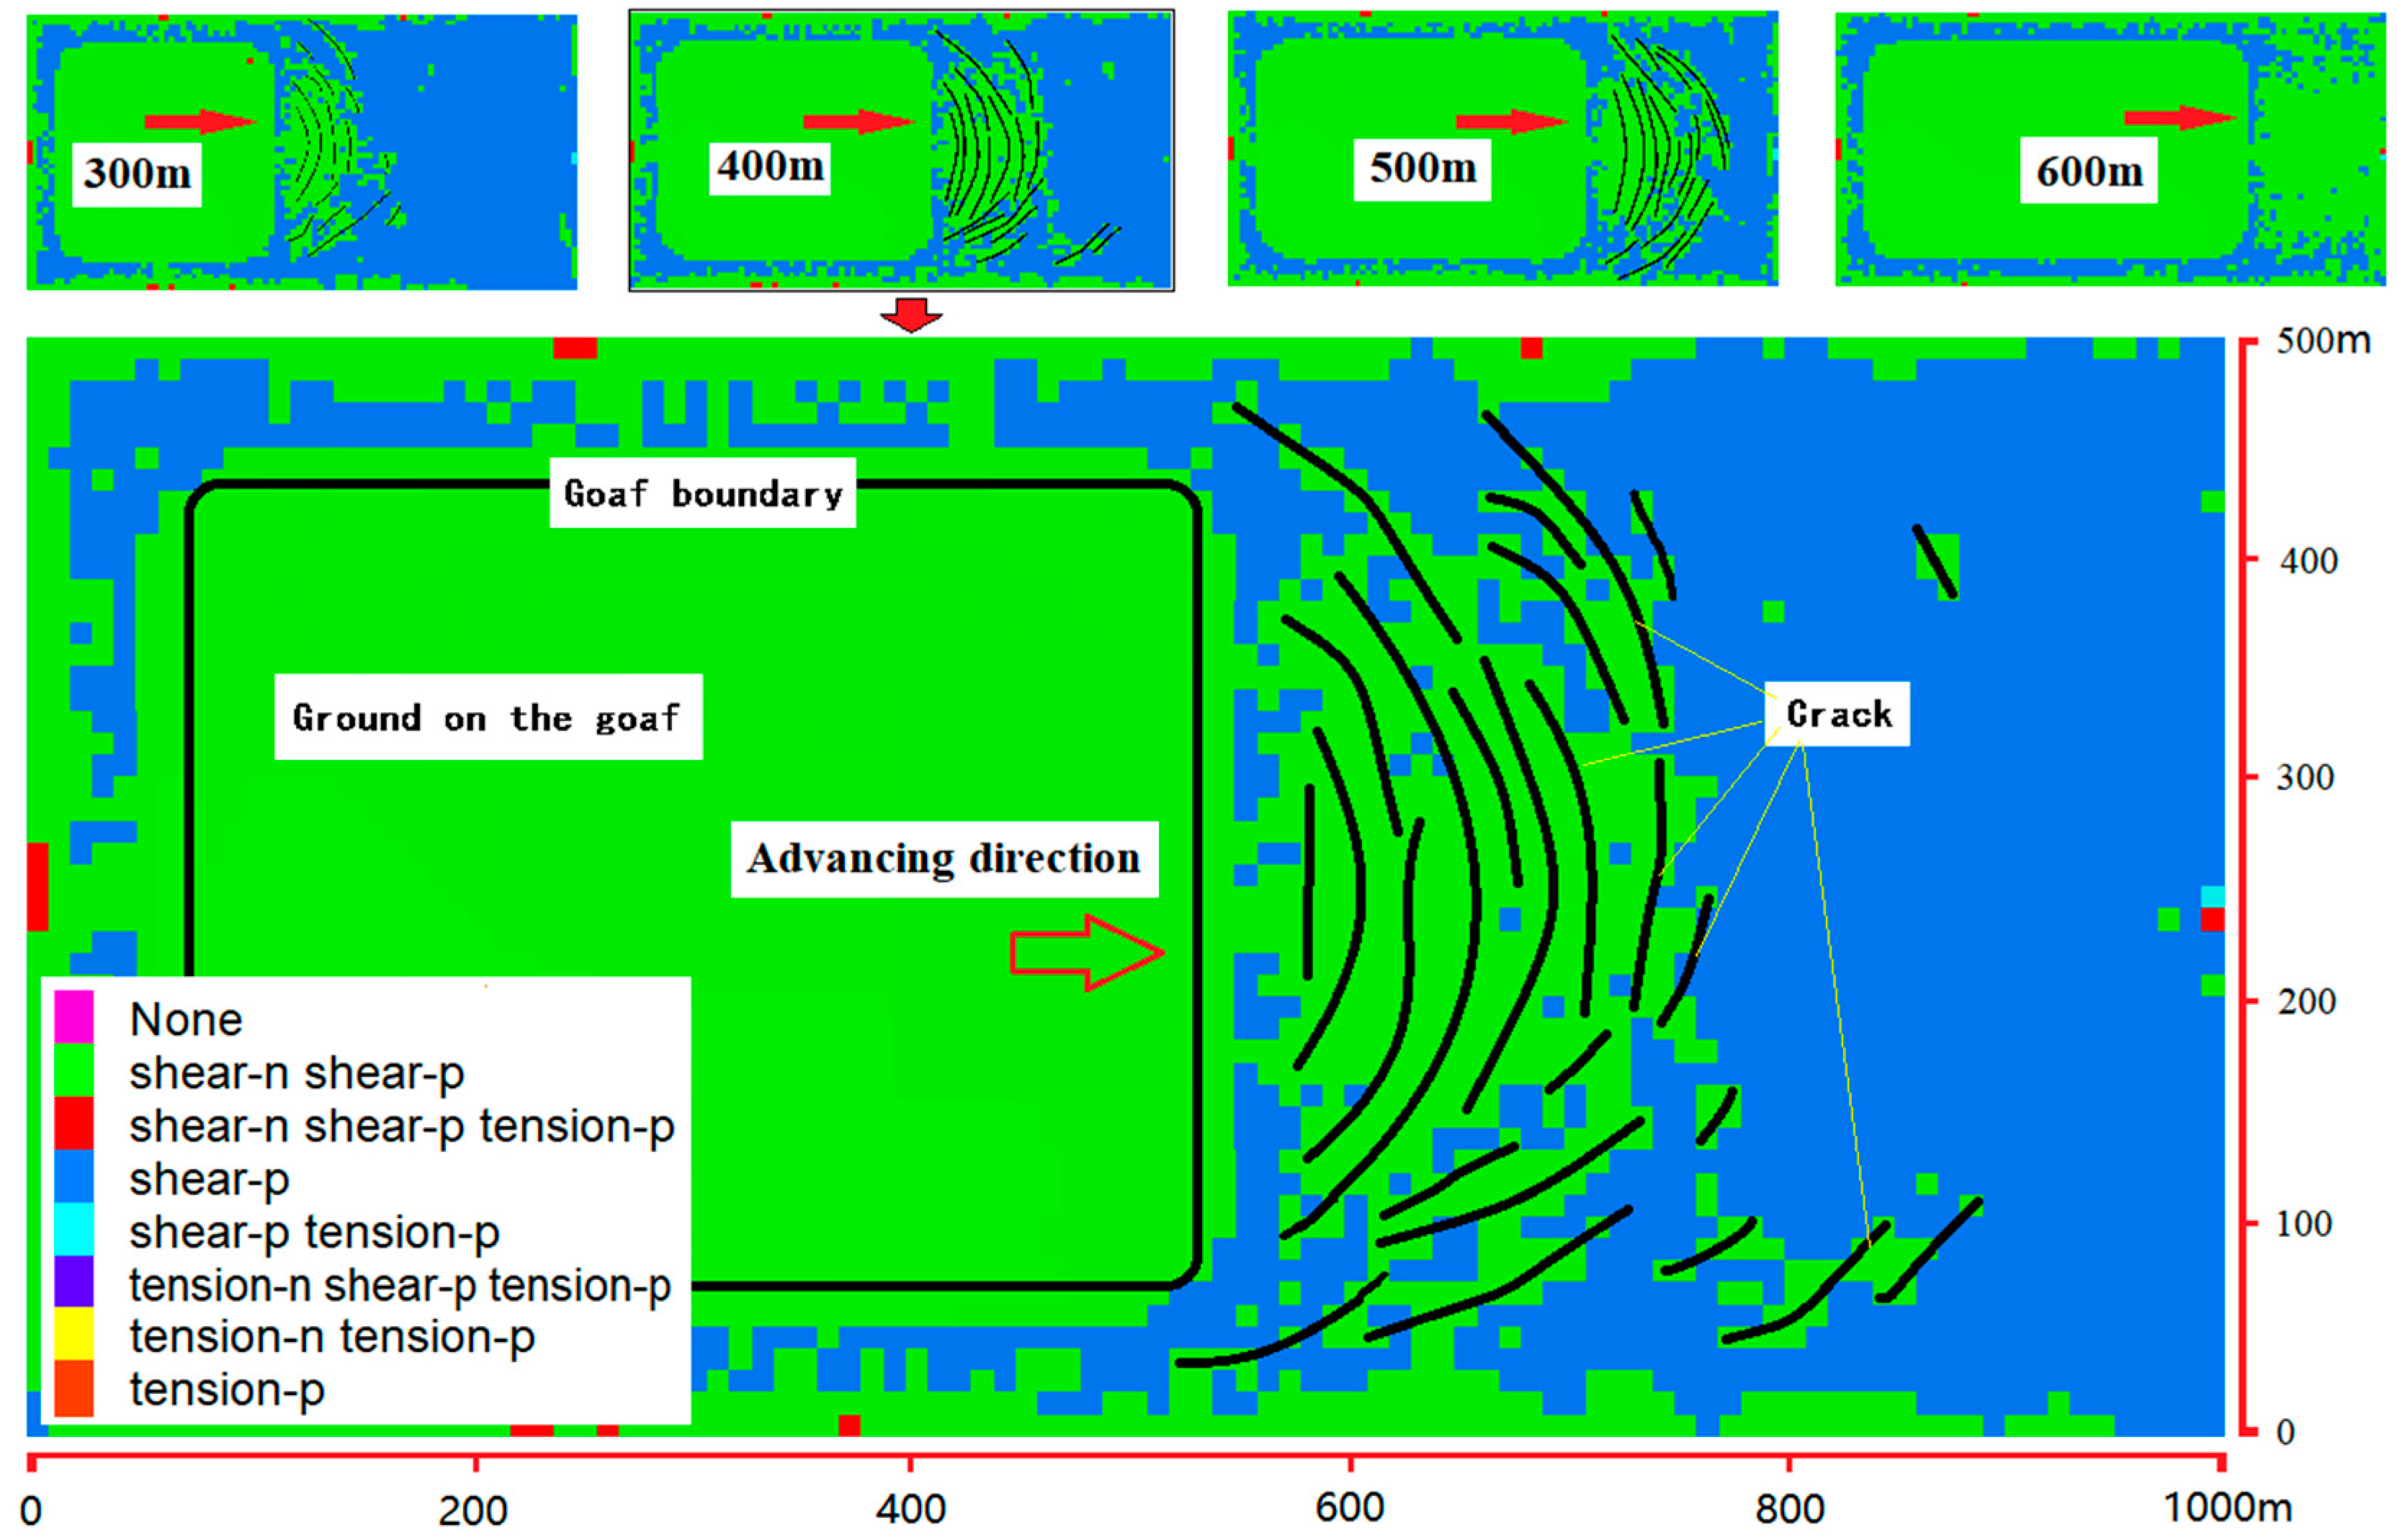
As shown in
Figure 8, many cracks are generated on the ground surface before and on both sides of the workface affected by mining. The surface has distinct damage. The cracks in front of the workface probably range from 20 m to 240 m, and the distance of crack is approximately 10–80 m.
3.4. Overburden Failure Analysis
With the continuous advancement of the working face, the roof of the coal seam collapses, and the collapsed rock fragments are superimposed on the goaf to form a masonry beam structure, the surface begins to subside, and the overburden under the aeolian sand begins to crack or even fracture. Finally, the original stress balance of the overburden, which is affected by mining, is broken.
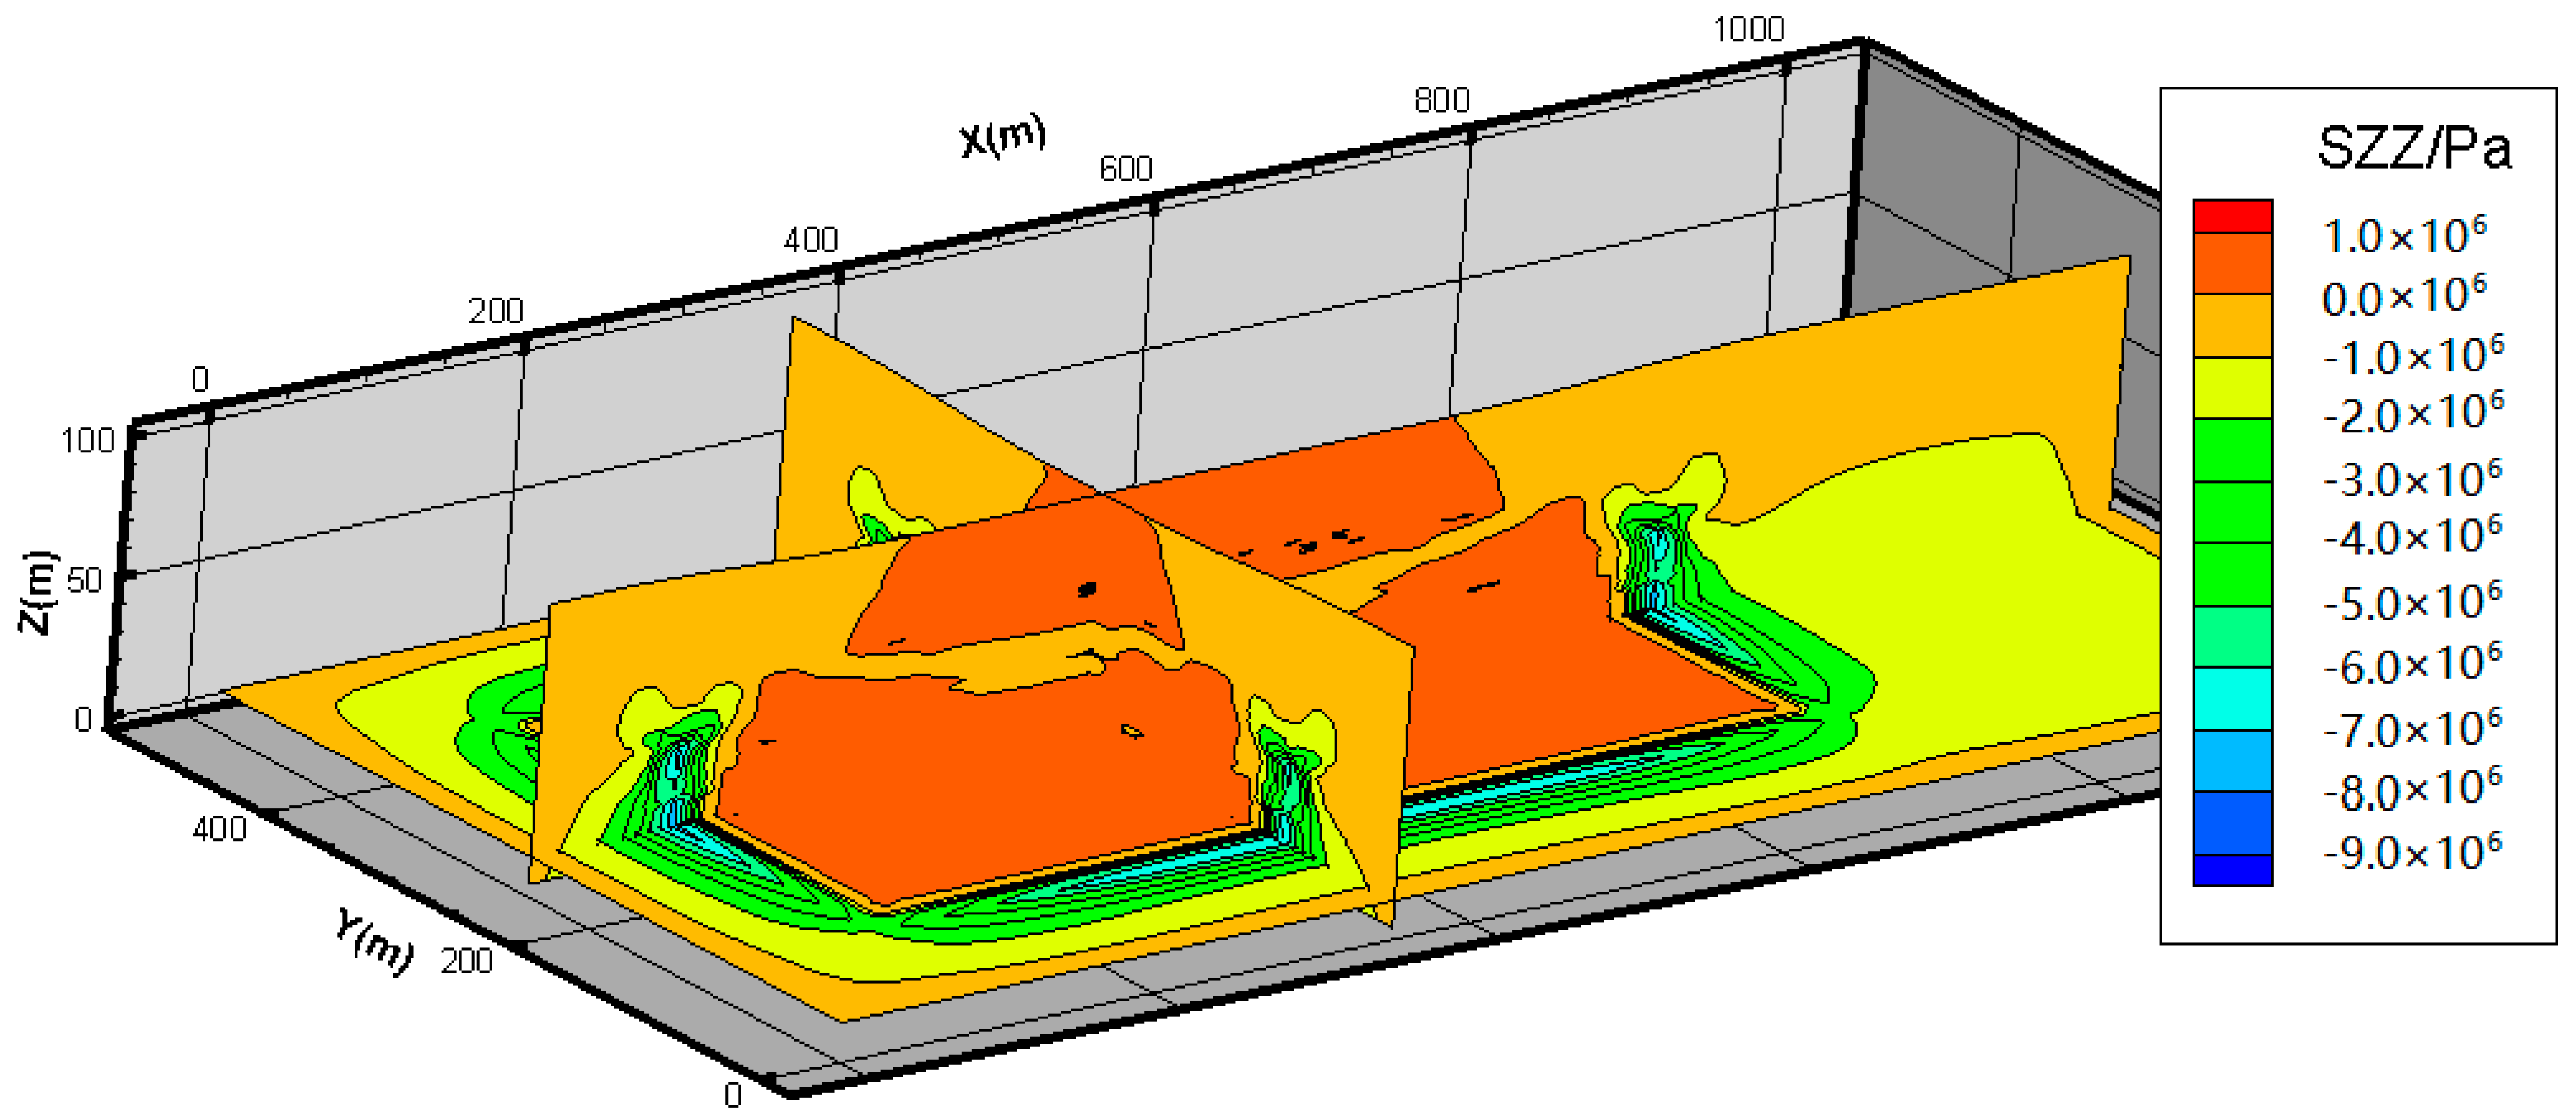
A stress concentration phenomenon occurs in the overburden above the edge of the goaf that are affected by mining, as shown in
Figure 9. After the collapse of the first key stratum, the second key stratum plays a major supporting role. The maximum vertical stress is more than 9.0 MPa and the direction is downward, and its support point moves upward, and such disasters caused by high stress often cause great damage to mining engineering activities [
3,
41,
42]. An interlayer with weak stress appears between the aeolian sand layer and the bedrock layer. The reason for this is maybe that, after the mechanical state of bedrock layers and aeolian sand layer changes caused by mining, cracks and separation layers are generated between them.
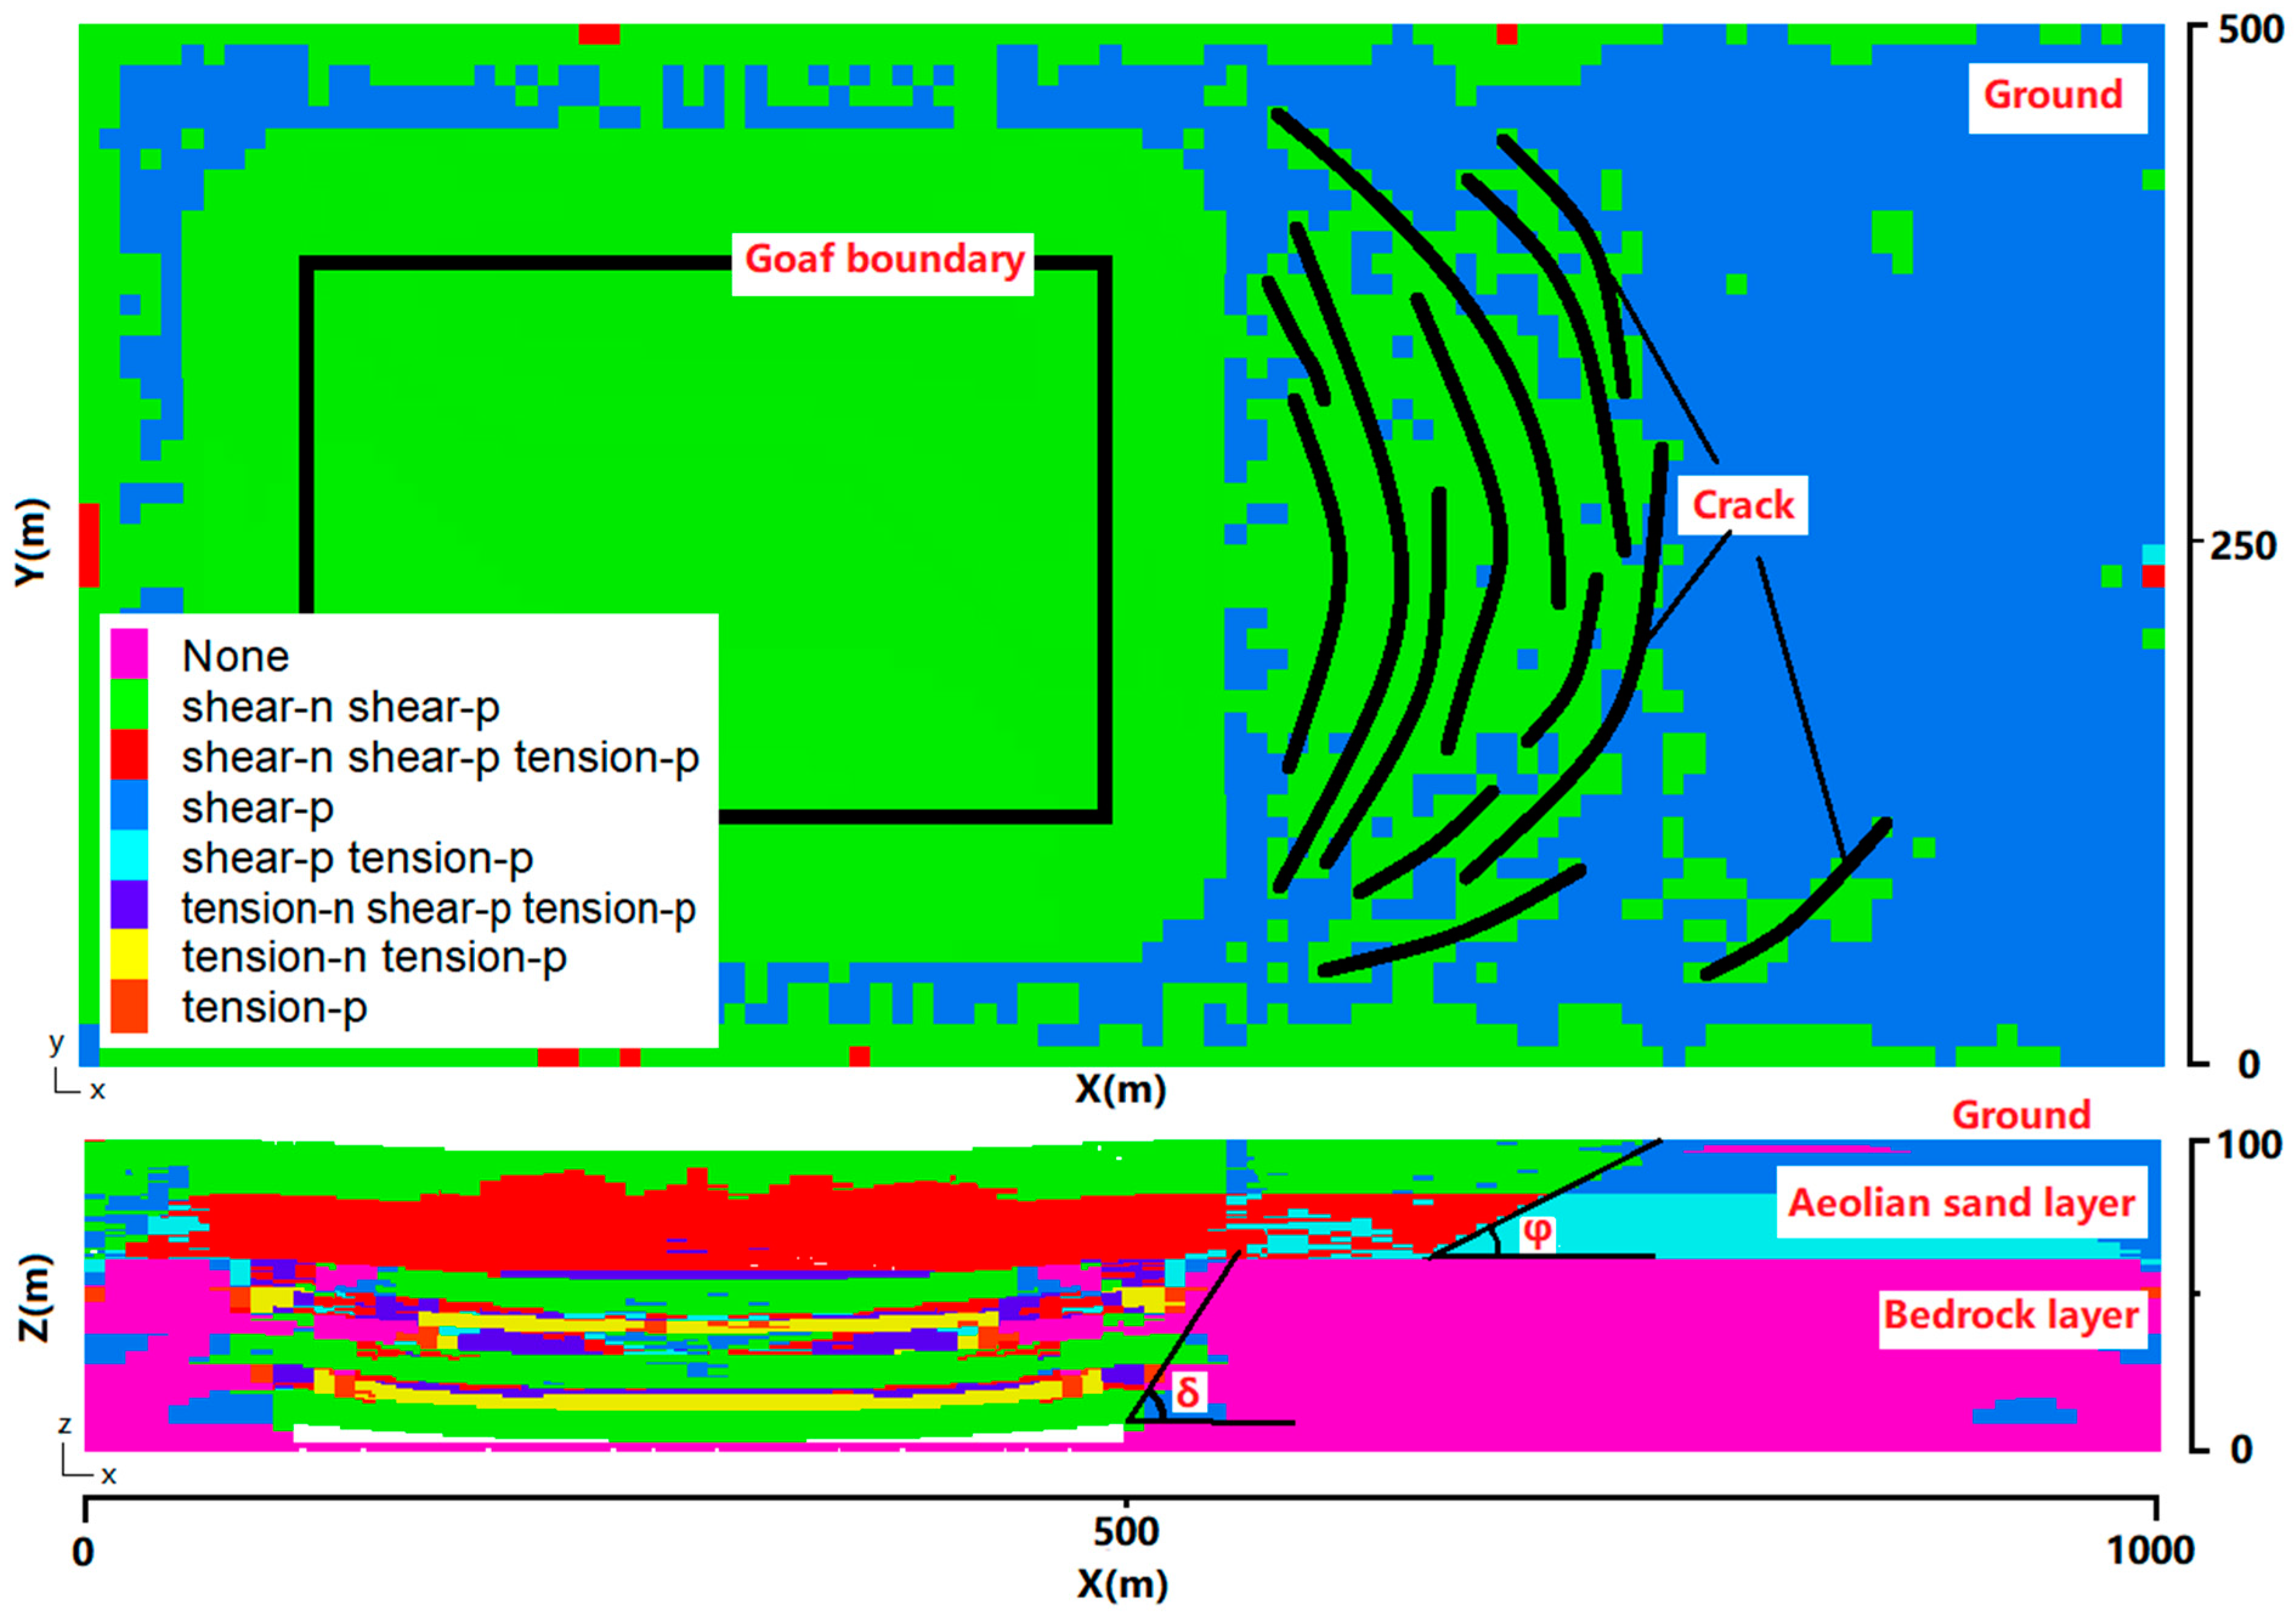
As shown in
Figure 10, shear failure and tensile failure show a layered structure in the horizontal direction and alternately appear in the vertical direction. The upper aeolian sand is mainly sheared, and the lower of aeolian sand is mainly tensile failure. The movement angle is different in the aeolian sand layer and the bedrock layer. The movement angle of the aeolian sand layer is smaller, while the movement angle of the bedrock layer is larger [
43]. The movement angle in the TAS layer is smaller than that in the bedrock, which enlarges the range of the subsidence basin and expands the scope of ground damage.
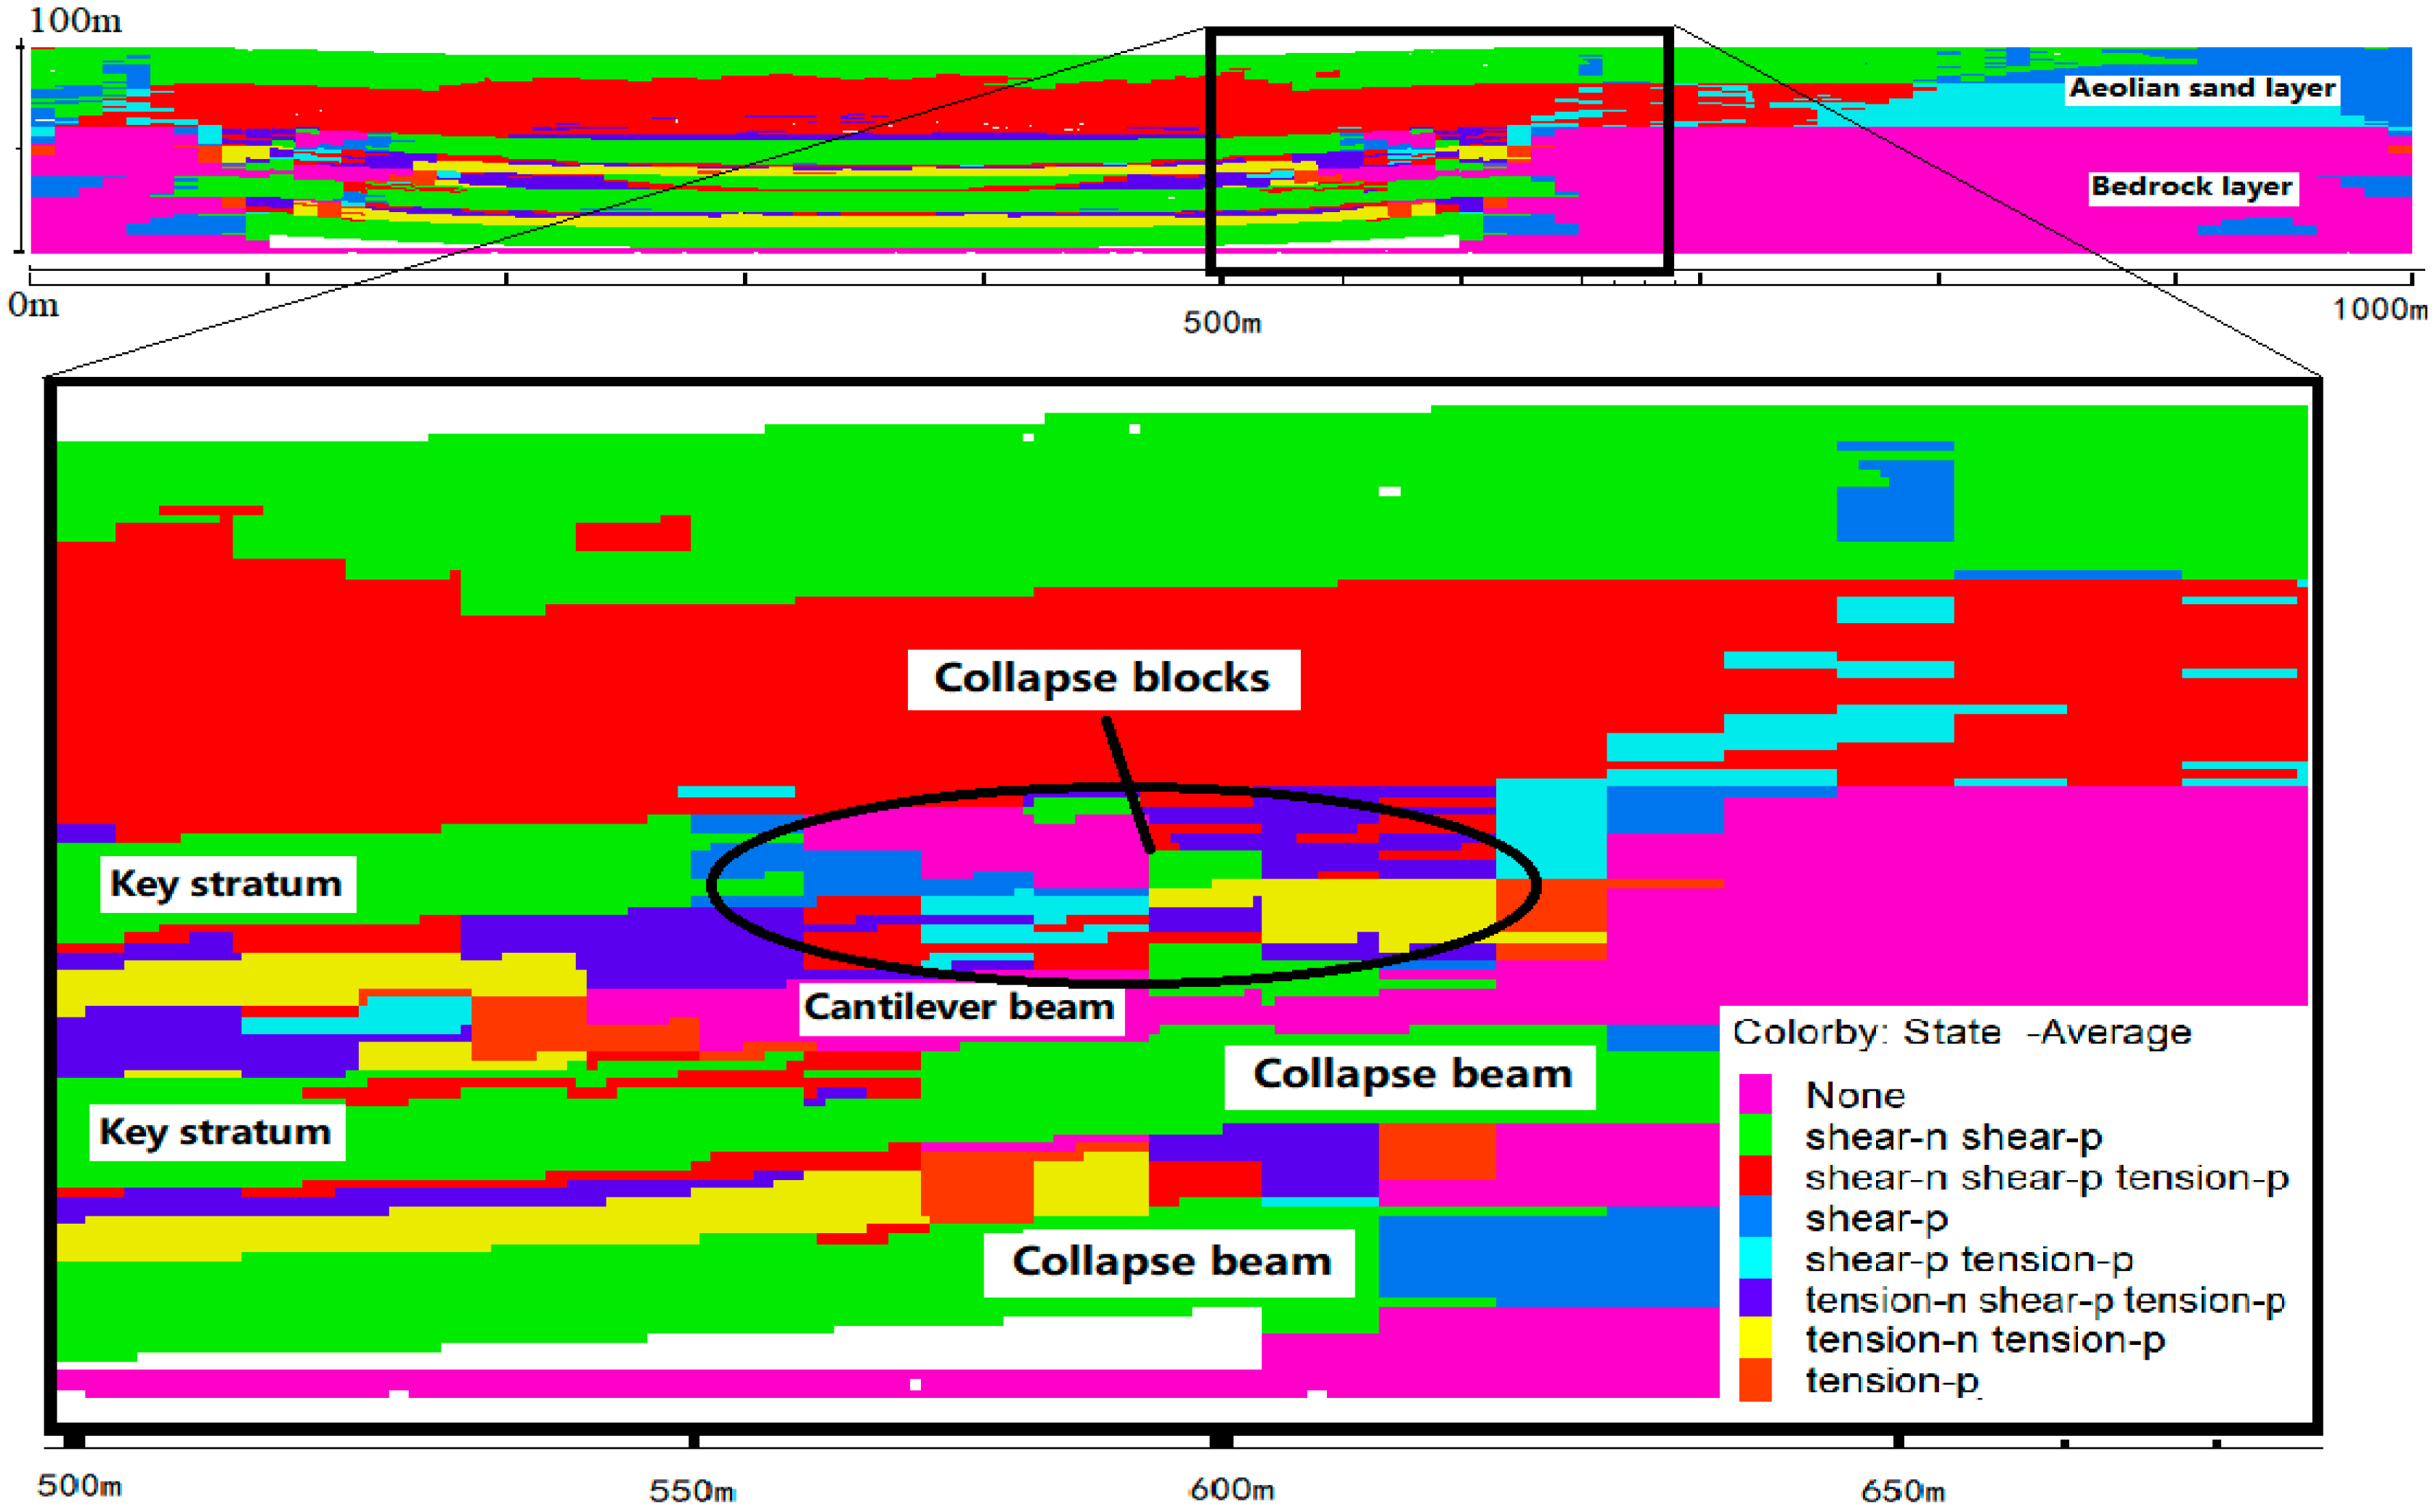
Overburden collapse can be divided into two stages, initial collapse and periodic collapse, as show in
Figure 11. The initial fracture distance is usually larger than the periodic fracture distance. After the initial collapse, with the advance of the working face, the overburden forms a cantilever structure. When the maximum bearing capacity is reached, periodic collapse occurs. Then, the overburden directly collapses to the goaf, the height of the collapse zone is approximately 24 m. The collapse block is 40–50 m long, and it is consistent with the theoretical calculation. the collapse block is gradually crushed and compacted. The block provides a bearing capacity to support the upper broken key stratum.
According to the cloud map of the numerical simulation, under this geological condition. The key stratum exists in the form of “cantilever beam” before collapse and “masonry beam” after collapse. There are a large number of fractures and fissures between blocks. With the continuous advancement of the working face, cracks in the overburden stratum continue to develop, and run through the whole bedrock layer, and there is no “bending zone” in the overburden. The cracks directly connect to the surface and form conduction with the surface.
4. Discussion
In this paper, we show that the overburden failure caused by the mining SBTCS, when the ratio of depth to thickness is less than 15(H/h = 13.43), can be divided into two stages: initial collapse and periodic collapse. According to the theoretical calculation, the initial collapse distance is greater than the collapse step, approximately 55 m on average, and the collapse step is approximately 45 m on average in the Daliuta Coal Mine.
The results of theoretical calculations are within the range of numerical simulation results. The movement angle in the loose thick aeolian sand layer is small, which expands the range of surface damage. A weak stress interlayer is generated between the overburden and the aeolian sand layer. This may be the cause of much sheer, tension and compression failure on the ground, as shown in
Figure 12. This study provides a mechanical analysis basis for the surface damage caused by mining shallow and thick coal seams, and provides a basis for surface environmental treatment and ecological restoration.
The study of coal mine surface damage can improve our understanding of mine management and land reclamation, and be conducive to ecological mine restoration. The research on mining SBTCS has strong regional characteristics. In different geological conditions and rock stratum conditions, resulting overburden and surface damage also have different status [
43,
44,
45]. Hou [
34] and Huang [
33] adopt the same calculation method as our study. Huang studies the failure mechanism of mining shallow coal seams and uses the result to control the ground pressure. Hou adopts the key stratum theory, puts forward the method of composite rock beams, and calculates the relevant parameters of rock beams. Although the stratigraphic conditions are quite different, the methods and ideas of theoretical analysis are correct. The study area and environment in Zou [
4] is very close to our study. They obtained the conclusion that overburden failure presents periodic collapse and initial collapse, which is consistent with this study. However, we further analyzed the stress distribution characteristics of overburden and the variation regular pattern of movement angle in loose layers and bedrock layers.
The study area is located in an arid desert area in China. The influence of groundwater on overburden is not considered in this study. The study of the interaction between overburden and groundwater is a complex and long term process. Through the monitoring of surface water level, overburden pore water pressure and overburden stress change, the interaction relationship between overburden and water can be obtained, the coupling model of overburden failure and groundwater can be established, and the interaction relationship between overlying rock and groundwater can be obtained. The occurrence conditions and geological structure of coal seams in the study area are simple, belonging to horizontal coal seams with few faults. For complex geological conditions, such as coal seam dip angle and faults, further research will be carried out later in the research process. When there are dip angles and faults in overburden and coal seams, a variety of numerical simulation models with different dip angles and different fault forms can be constructed by simulation to study the characteristics of overburden and surface failure under complex conditions from the perspective of numerical simulation. According to mining subsidence theory and mechanical theory [
44,
45,
46], the surface damage range can be calculated more accurately rather than qualitative analysis. When mining SBTCS, the DTR and aeolian sand thickness to bedrock thickness ratio (ASBR) should be considered. It reflects the relationship between coal seam thickness and buried depth, and the structural composition of bedrock. The change in DTR and ASTR have a key impact on the overburden and surface damage caused by mining SBTCS, which is also a subject worthy of in depth study in the future.


