Abstract
River water quality is a serious concern among scientist and government agencies due to increasing anthropogenic activities and uncontrolled industrial discharge to rivers. The present study was conducted near the river mouth of the Kerian River to assess heavy metal pollution during COVID-19 pandemic-lockdown conditions and post-COVID-19 pandemic-unlock conditions. Twelve samples of shallow, middle, and bottom depths were collected at four locations along a 9.6 km reach. A concentration of eight heavy metals including Cadmium, Chromium, Copper, Iron, Manganese, Nickel, Lead, and Zinc were extracted through atomic absorption spectrometry. Total suspended solid was measured during laboratory experimentation. The results showed that, during the pandemic, concentrations of Nickel, Zinc, and Iron were high at shallow, middle, and bottom depths, respectively. Decreasing orders of heavy metal concentration are variable at different depths due to either their high sinking tendency with other existing components of water matrix or the anthropogenic source. However, almost all values of heavy metals are under the permissible limit of National Water Quality Standards of Malaysia and Food and Drug Administration. A possible reason for the lack of heavy metal pollution may be the restriction of anthropogenic activities during the COVID-19 pandemic. Additionally, no significant differences were observed in total suspended solid.
1. Introduction and Background
River water pollution is one the most critical issues in the world. Surface water quality, especially river water quality, is declining due to anthropogenic activities and uncontrolled discharge of anthropogenic sources [1,2]. Anthropogenic sources can be in the form of industrial waste, discharge from agricultural land, mining, and sewage. Fertilizers and pesticide used in agricultural land washed during precipitation and drain into river causes increment in nitrate and phosphate concentration [3,4]. Total suspended solid concentration also increases due to soil erosion from agricultural land. Uncontrolled discharge of industrial waste in river water containing pollutants such as zinc, cyanide, copper, lead, mercury, and cadmium causes fish death and an increment in toxic levels [5]. Pollution due to heavy metal is also a serious issue because it is non-degradable by natural processes and its existence in soil and sediment leads to rapid release as it sinks into watercourses [6]. A concentration of essential heavy metals under an acceptable limit is good for health; however, if it exceeds the acceptable limit, these heavy metals become harmful and extremely toxic for humans, animals, and aquatic ecosystem health [7,8].
In the last decade, several studies have analyzed heavy metal pollution in different parts of Malaysia. Ishadi et al. [9] examined water quality and habitat suitability of a hemipteran community upstream of the Kerian River. They used three heavy metals but did not compare with any water quality standards. Ibrahim et al. [10] compared the presence of heavy metals in river water and pumping-well water for a Riverbank filtration (RBF) system upstream of the Kerian River. They found that, out of 10 heavy metals, iron and arsenic exceed the standard values set by the Ministry of Health, Malaysia. The probable reason of this was due to the excess use of pesticides on the agricultural land by which the upstream of the Kerian River is mostly surrounded. Billah et al. [11] investigated metal contamination in the tropical Miri estuary of Sarawak, Malaysia, and found that iron was the highest contaminated metal. Their study was substantial to portray deterioration in water quality due to anthropogenic pollution, though it would have been interesting to differentiate the reading, had the data been collected during the COVID-19 lockdown period. Chowdhury et al. [12] assessed water quality effected due to anthropogenic pollution sources from the Sungai Selangor basin. They found that most sampling stations fall under Class 3 of the National Water Quality Standards of Malaysia (NWQSM), indicating that extensive treatment is required. Nonetheless, the differentiation could have been substantiated if the additional data were recorded during the COVID-19 lockdown. Ibrahim et al. [6] analyzed metal contamination at nine stations along the Sg. Sembilang due to anthropogenic and natural sources. They found that some heavy metals exceeded the NWQSM limit. Zanuri et al. [13] assessed the marine water quality of Penang Island to investigate the mass mortality of cultured fishes. They found that the concentration of cadmium, copper, iron, and nickel exceeded the permissible levels according to Malaysia Marine Water Quality Class 2. Due to this, the area may no longer be suitable for aquaculture or recreational purposes. It was also noted that their study was carried out during pre-COVID-19 times, whereby the data was collected from 2016 to 2017. Lee Goi [14] studied pre- and post-COVID-19 water qualities of Malaysian rivers using published papers and newspaper articles. They found that, in pre-COVID-19 conditions, 53% of the river’s water quality in Malaysia was categorized as slightly polluted or polluted. While, in post COVID-19 condition, some polluted river became clearer than previous conditions. Their work provides an insight into the analysis of river water quality during pre- and post-COVID-19 periods. Razak et al. [15] studied heavy metal pollution in the Linggi River, Negeri Sembilan, Malaysia. They found that concentrations of heavy metals were under the permissible limits of NWQSM, but that the index showed low-level heavy metal contamination. Moreover, aluminum and zinc came under a medium potential risk, while arsenic and manganese came under low potential risk that impacted negatively on aquatic organisms and human health.
Overall, none of the studies have been reported near the river mouth of the Kerian River, where several industrial and agricultural activities have been increasing. However, this study was conducted during the COVID-19 pandemic, when there were restrictions on anthropogenic activities such as industrial lockdown near the vicinity of the Kerian river (limitation in industrial waste release) and after the COVID-19 pandemic, when the restrictions were removed. Therefore, the objective of this study is to assess heavy metal pollution near the river mouth of the Kerian River along a 9.6 km reach covering several industrial and agricultural waste drain areas. With regard to the industries, it is highlighted that the Kerian River is surrounded by industries such as semi-conductor manufacturing plants, paper, palm oil, rubber, and furniture factories. This study would be helpful in understanding the current status of pollution in the Kerian River. As none of the studies have previously reported in this area, the results of this study could be a reference for future heavy metal pollution studies.
2. Materials and Methods
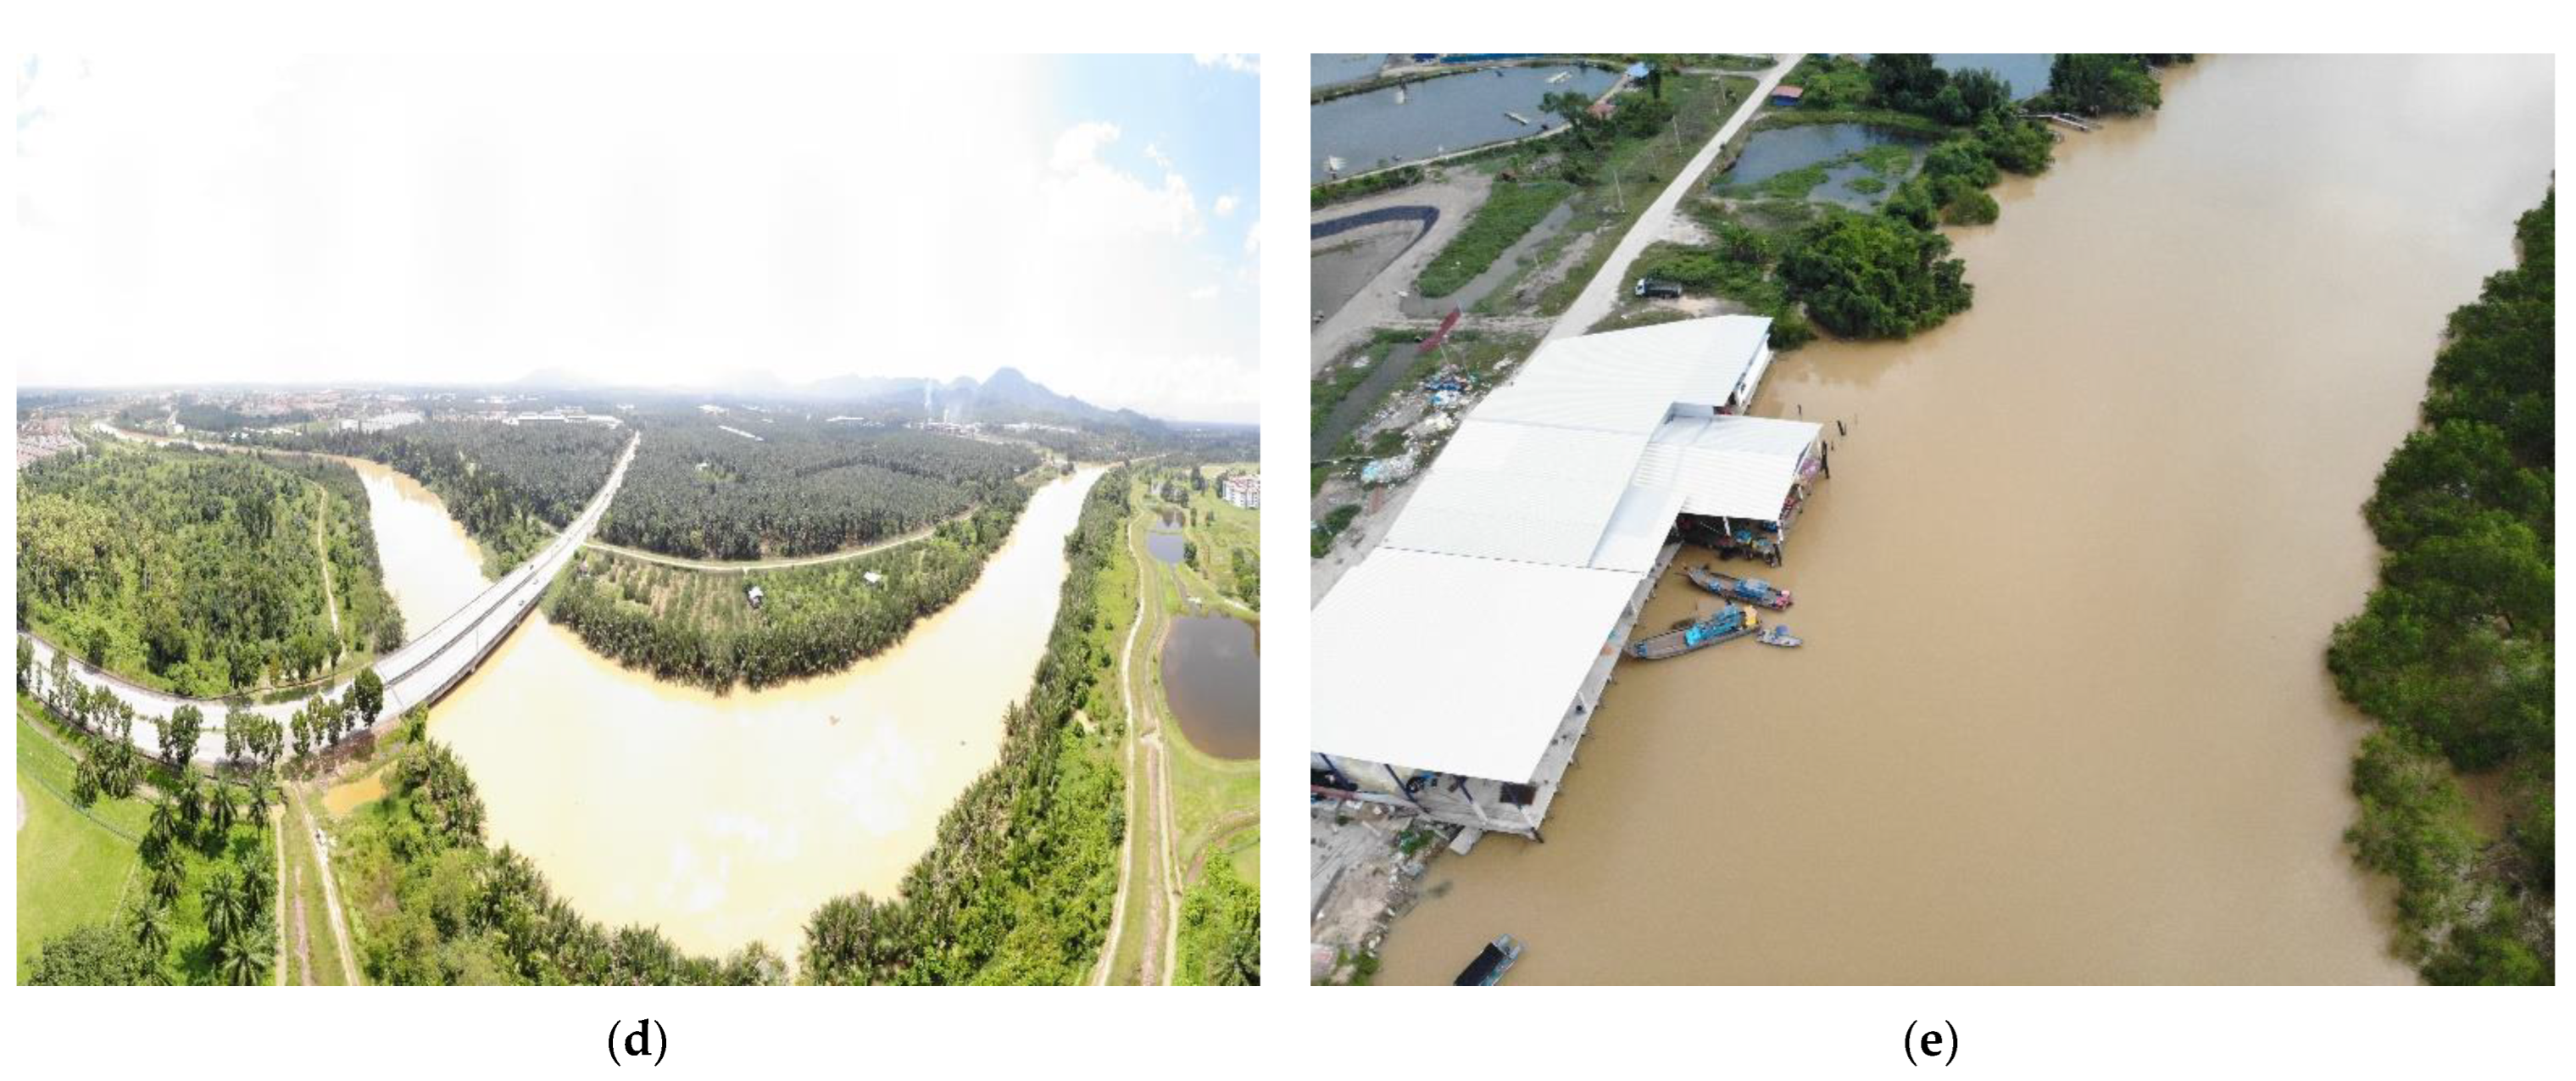
2.1. Study Area and Data Collection
The study area was the downstream part of the Kerian River, situated in the state of Perak, the northern part of the Peninsular Malaysia. The area lies between latitudes 5°8′24″ and 5°10′41.94″ N and longitudes 101°24′12.89″ and 100°29′56.44″ E (Figure 1).

Figure 1.
Study area (a) location of study area; water sampling sites (b) S1 (c) S2 (d) S3 (e) S4.
Total length of the Kerian River is 104 km, and it originates from the Bintang Range and flows south-westward towards the Malacca Straits near the town of Nibong Tebal [16]. In this study, a 9.6 km reach near the river mouth was selected due to the presence of settlement and industrial area. Average annual rainfall and temperature in the area is 2560.3 mm and 28 °C, respectively. As the area situated near the river mouth, the elevation ranged from 0 to 32 m.
Nibong Tebal is home to several manufacturing industries which are located across the vicinity of Kerian River. The domain of these industries comprises of metal machining, rubber industry, paper industry, and furniture industry [17]. In addition to this, the area also accommodates food-based industry, i.e., sugar, sauce, and biscuit factories. Nonetheless, overall, Nibong Tebal has 617 registered companies. These companies have an estimated turnover of RM 8.716 billion and employ a number of employees estimated at 17,025. The population of Nibong Tebal town, as of 2021, is 40,072 as per the GeoNames geographical database. From an agricultural point of view, the area around Kerian River is home to sugar cane, rice, and palm tree plantation. Land use such as forested areas, paddy fields, palm oil plantations, orchards, and areas of settlement are distributed along the Kerian River basin [18]. The existing environment of the Kerian River has been heavily developed into agricultural lands [19]. The area is divided into two categories: non-agricultural and agricultural lands. The major crops are rubber, rice (Kerian Rice Irrigation Schemes), and palm oil. Apart from the aforementioned positive parameters, there lies a threat of industrial wastewater pollution. In this regard, it is an urgent need to curb industrial waste pollution in Kebun Kuyung, near Nibong Tebal in the Seberang Perai Selatan district. Nonetheless, aquatic life in Sungai Kerian, especially fish and prawns, that are the main catch for small fishers here, will be more seriously affected and reduced, subsequently threatening their income.
In the proposed work, twelve water samples at four sites along the 9.6 km reach were collected to study the water quality condition of the Kerian River during and after the pandemic, whereby, in the manuscript, terms such as “during pandemic” are known as the lockdown period, and “after pandemic” or “post-pandemic” are known as the unlock period. Water samples were collected during rainy season due to the high possibility of pollution during high flows. During the pandemic, samples were collected in January 2021, while, in post-pandemic, samples were collected in January 2022. At each site, three samples were collected at different depths, such as shallow, middle, and bottom. Location and distance of different sites are given in Table 1.
Table 1.
Locations of water samples collected for heavy metal pollution assessment.
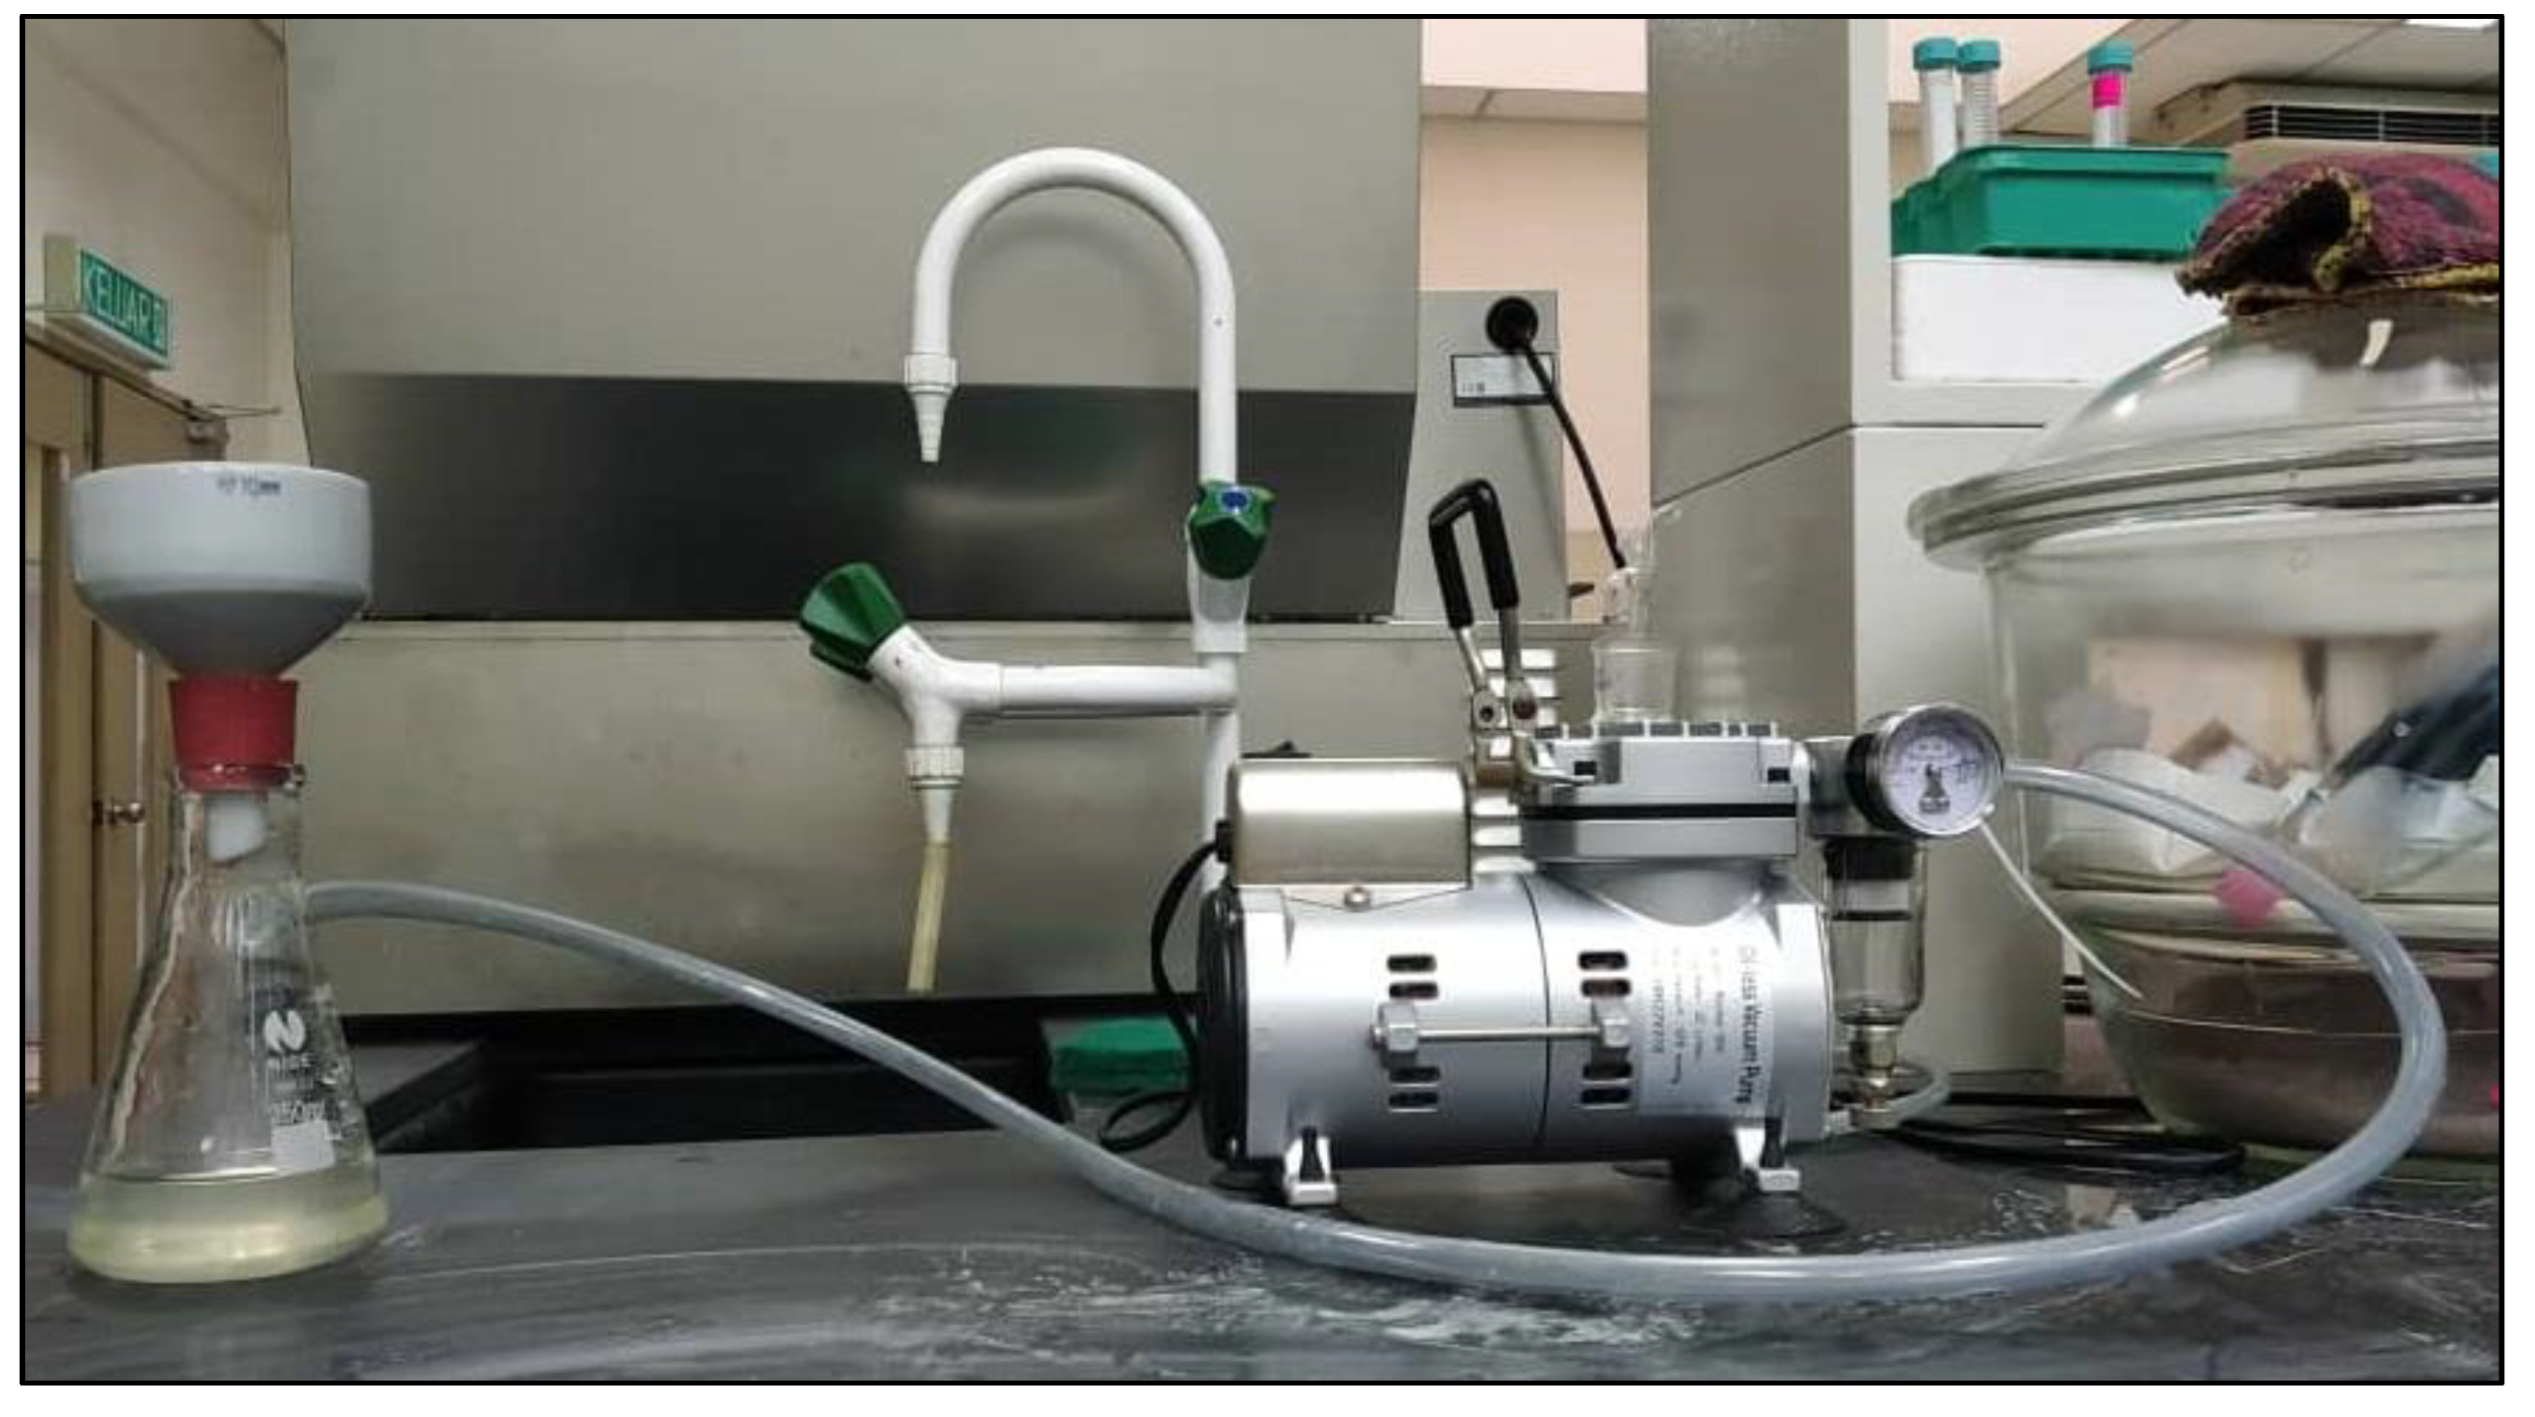
2.2. Laboratory Experiments and Data Processing
Three liters of each collected water sample were first concentrated in a sandy oven at 80 °C until the volume reached 50 mL. A total of 4 mL of concentrated sulfuric acid (Merck, Kenilworth, NJ, USA, 98%) was added to each sample and digested by Digesdahl apparatus for 3 min. Then, 10 mL hydrogen peroxide (Merck, 30%) was added and heated until oxidation was completed. After cooling, each sample filtered by filter (Whatman filter Merck, 0.45 m). The filtrate was diluted by deionized water for a final volume of 50 mL. The prepared samples were analyzed by a Graphite furnace atomic absorption spectrometry (GFAAS, Modal AAnalyst300) to determine the metals.
Vacuum filtration was considered to be a reliable approach to measure sediment weight in a sample. In the conventional method, potassium permanganate was usually added in order to allow the sediments to deposit at the base before filtration. However, in the present study, since the samples were to be used for atomic absorption spectroscopy (AAS) for determination of sediment composition, we avoided the addition of potassium permanganate to the samples. We passed water samples through the filter paper in the vacuum filtration apparatus (Figure 2). After water filtration, we kept the filter papers in the drying oven at a temperature of 104 °C for 24 h. Finally, the sediment load in each sample was measured by calculating the difference in weight of filter paper before and after the experiment. The analytical weight balance used in the present study had count of a least 0.01 mg.
Figure 2.
Vacuum filtration setup.
2.3. Heavy Metal and Statistical Analysis
Basic statistics such as mean, standard deviation, minimum and maximum values of total suspended solid (TSS), and heavy metal concertation at different sites were compared to obtain their variations. Decreasing orders of heavy metals were also analyzed. Heavy metal values were compared with National Water Quality Standards of Malaysia, Food and Drug Administration, drinking water standards, irrigation water standards, aquatic life standards, and surface water standards [20].
3. Results and Discussion
3.1. Experimental Results of Total Suspended Solid and Heavy Metals
Average laboratory results of TSS and eight heavy metals such as Cadmium (Cd), Chromium (Cr), Copper (Cu), Iron (Fe), Manganese (Mn), Nickel (Ni), Lead (Pb), and Zinc (Zn) at shallow, middle, and bottom depths are presented in Table 2. Detailed results are given in Table A1, incorporated in Appendix A.
Table 2.
Average laboratory results of TSS (mg/L) and eight heavy metals (ppm) at different depths.
3.2. Average Concentration Order of TSS and Heavy Metals during and after the Pandemic
Industrial and agricultural waste discharge into river is one of the major concerns in developing countries. A high concentration of heavy metals causes water pollution that deteriorates water quality and affects human health. The average results of TSS and heavy metal concentration at shallow, middle, and bottom depths in the Kerian River are shown in Table 2. Based on the mean concentration of heavy metals during the COVID-19 pandemic-lockdown period, decreasing order at shallow depth in the Kerian River is Ni > Zn > Cd > Mn > Cu > Fe > Pb > Cr. At middle depth, the decreasing order is Zn > Cu > Cd > Mn > Ni > Fe > Pb > Cr, while, at bottom depth, the decreasing order is Fe > Cu > Zn > Ni > Cd > Pb > Mn > Cr. From these orders, it is clear that Cr and Pb are almost in same position at different depths. The concentration of Ni is high in shallow water but medium at other depths, which indicates that Ni settling tendency is lower in river water. However, concentration of Fe is lower at shallow and middle depths, but high in bottom that indicates Fe settling tendency is high in Kerian River. Similarly, the concentration of Cd and Mn is lower at bottom depth, which indicates lower settling tendency in the Kerian River. The settling of heavy metals may be due to the different binding capacities of the different metals with other existing components of the water matrix, such as micro particles or micro vegetation, which may be in suspended, colloidal, or dissolved form.
After the pandemic-unlock period, the decreasing order of heavy metals changed. At a shallow depth, the order was Fe > Zn > Mn > Ni > Pb > Cr > Cu > Cd, at middle depth was Fe > Zn > Pb > Cr > Mn > Ni > Cu > Cd, and at bottom depth, the order was Fe > Ni > Zn > Mn > Pb > Cr > Cu > Cd. This clearly shows that the Fe concentration is highest at different depths, indicating a high Fe source in industrial waste. Cu and Cd are lowest at all depths, indicating the lowest concentration in industrial waste.
Average results showed that TSS concentration is high at middle depth followed by shallow depth and bottom depth. Slight variation was observed during and after the pandemic, which are discussed in the following sections.
3.3. Variation in TSS Concentration during and after COVID-19 along the Kerian River
During the pandemic-lockdown period, TSS concentration at shallow depth varies from 12 to 24 mg/L, with a standard deviation (SD) of 4.9 mg/L. This concentration at middle depth varies from 41 to 63 mg/L, with an SD of 8.6 mg/L, and, at bottom depth, it varies from 3 to 39 mg/L, with an SD of 14.5 mg/L. This indicates more variation in bottom depth. After the pandemic, the concentration increases to 26.3% at shallow depth and 14.3% at middle depth, though declines at bottom depth (42.9%) (Figure 3).
Figure 3.
Concentration of TSS at shallow, middle, and bottom depths during and after the pandemic in the study area.
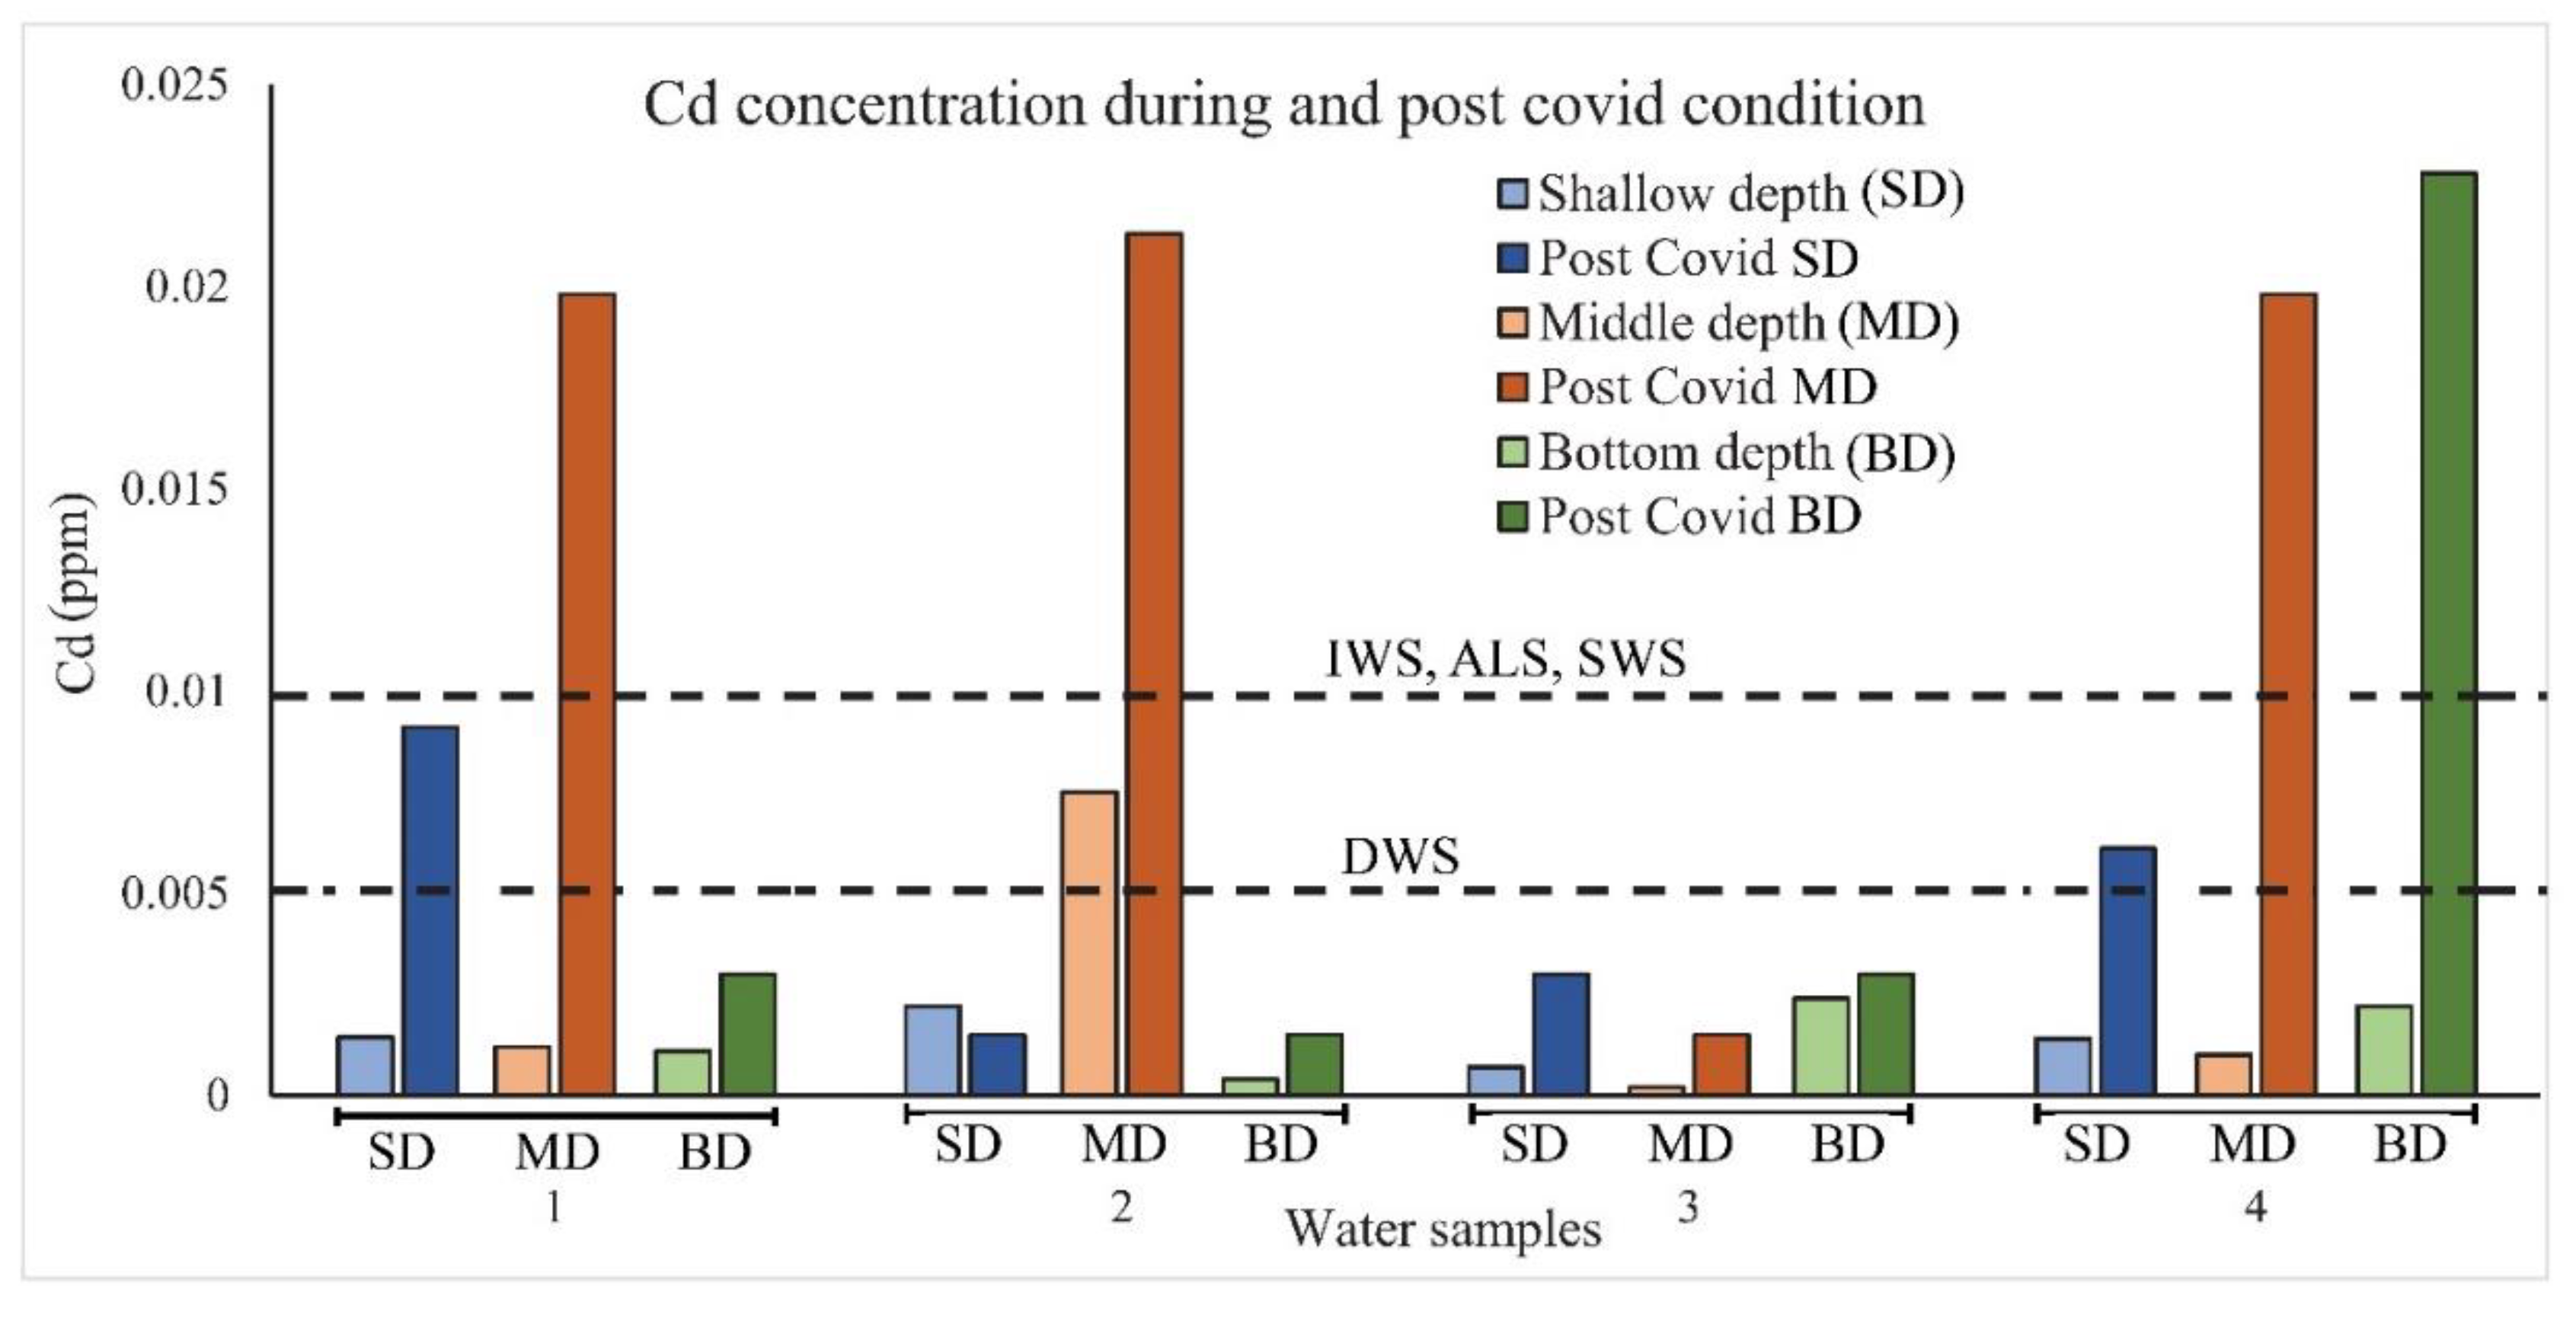
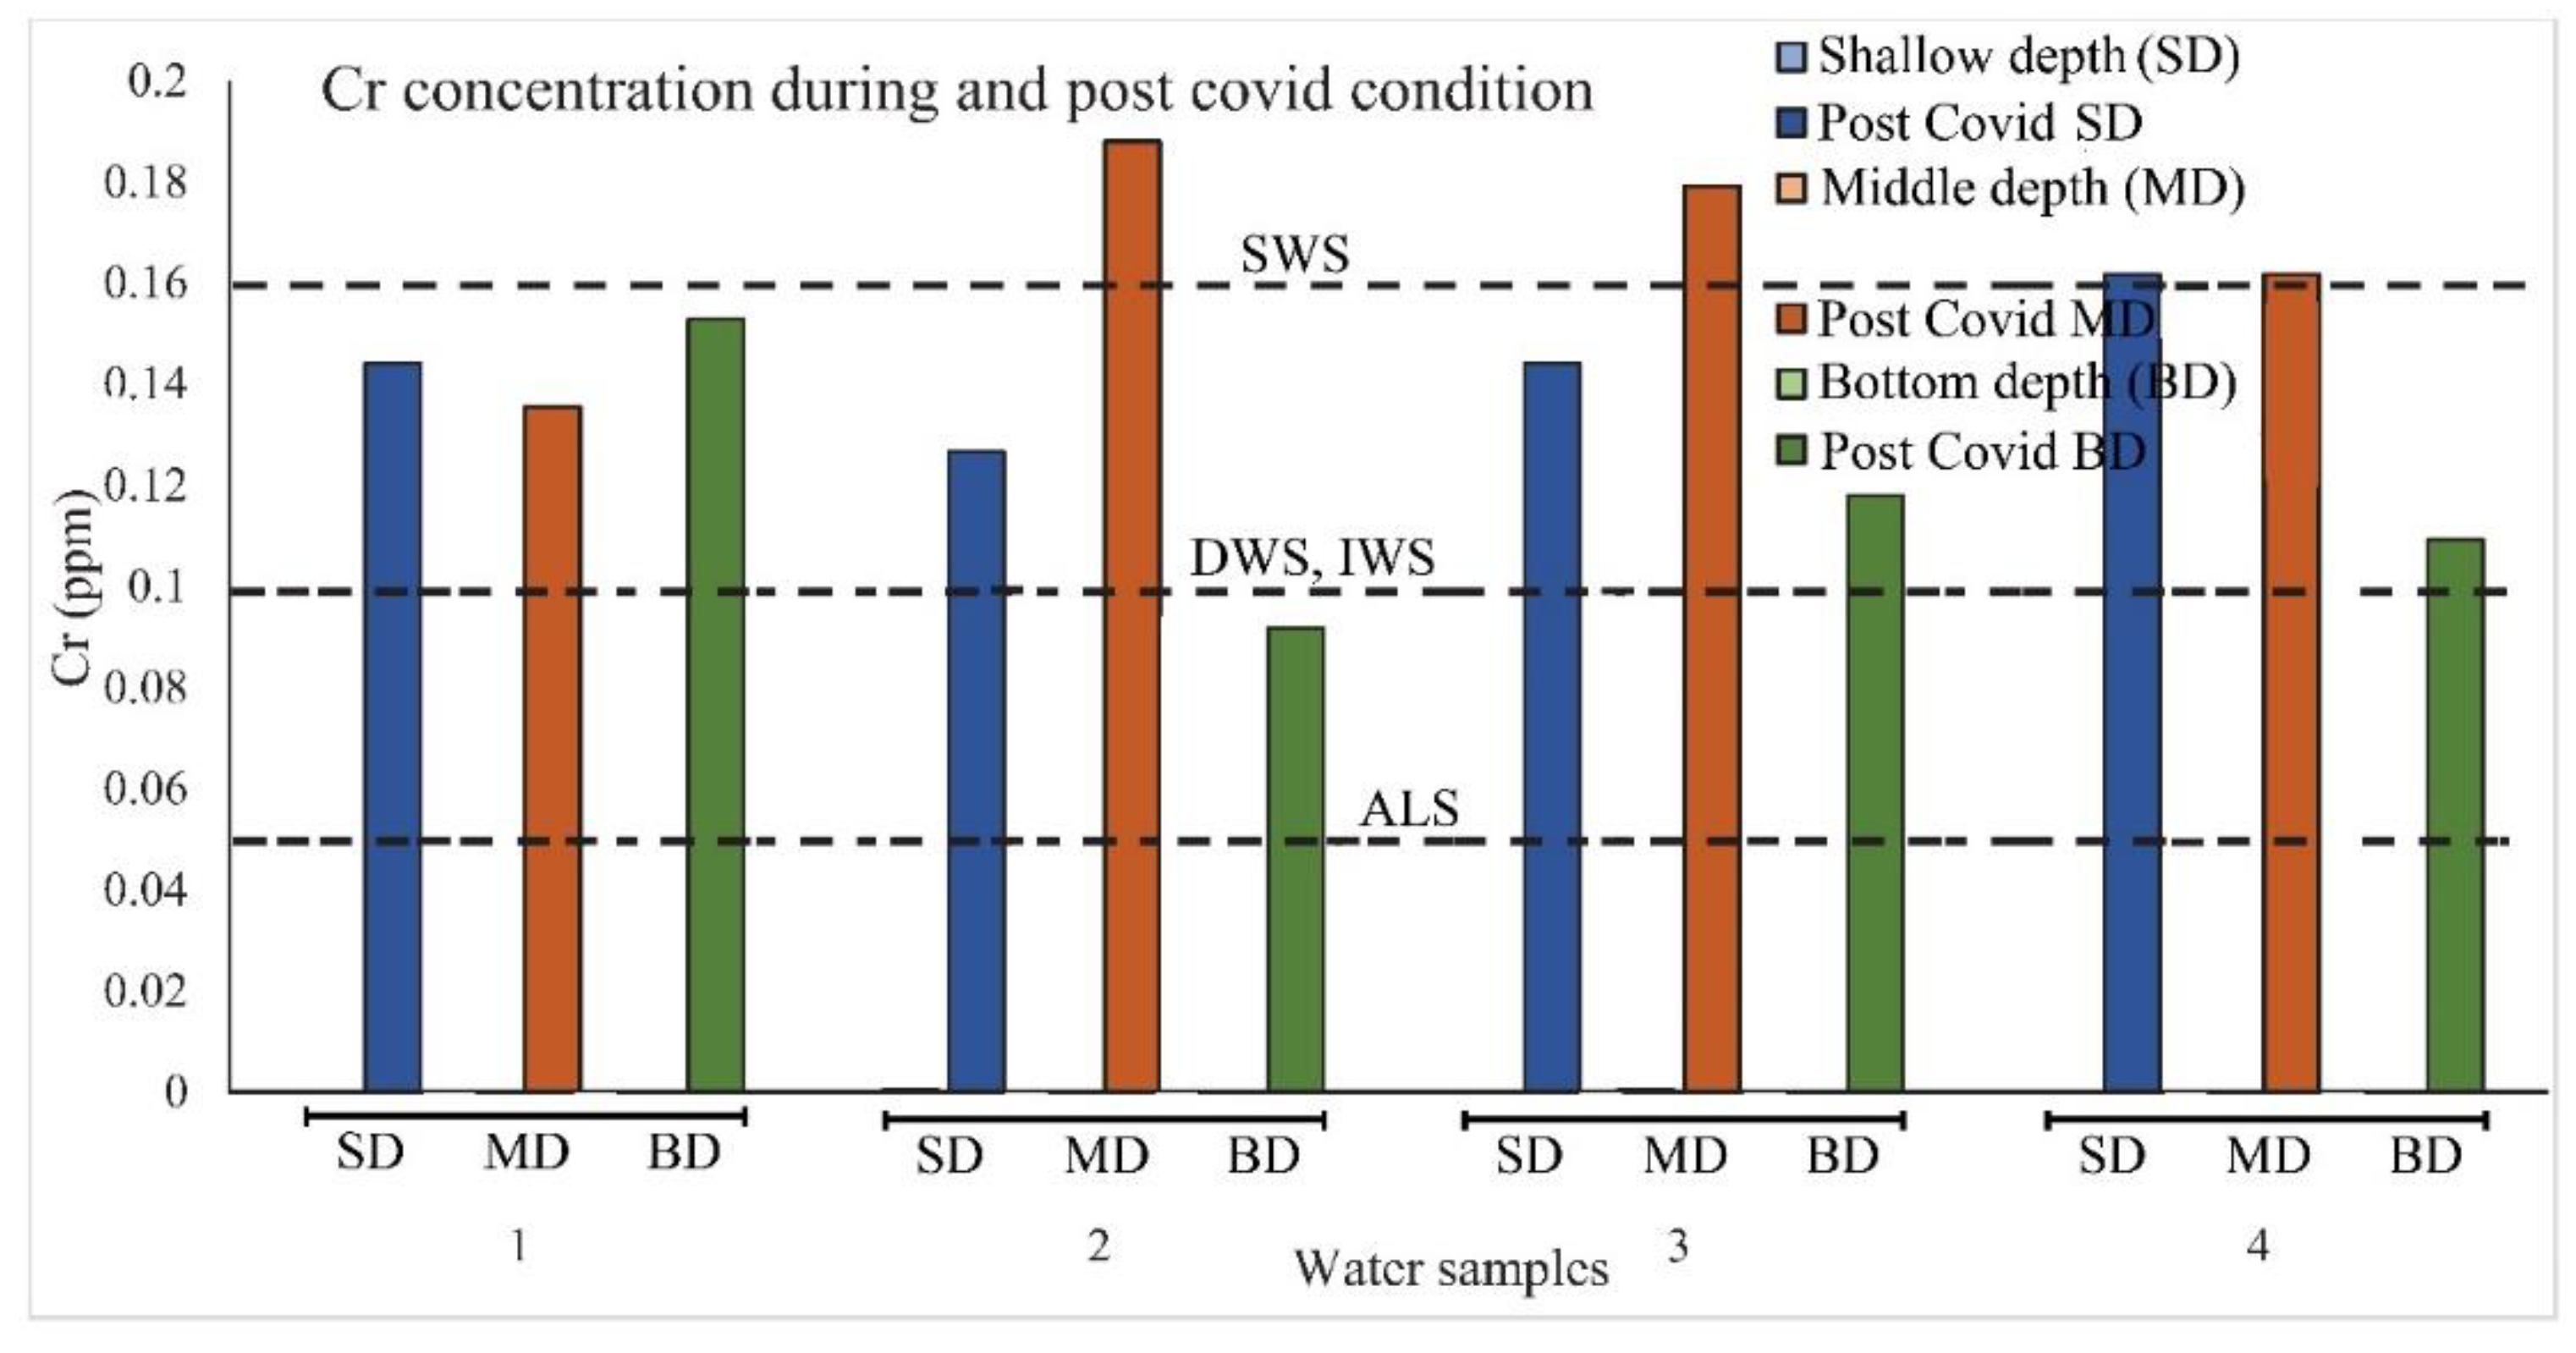
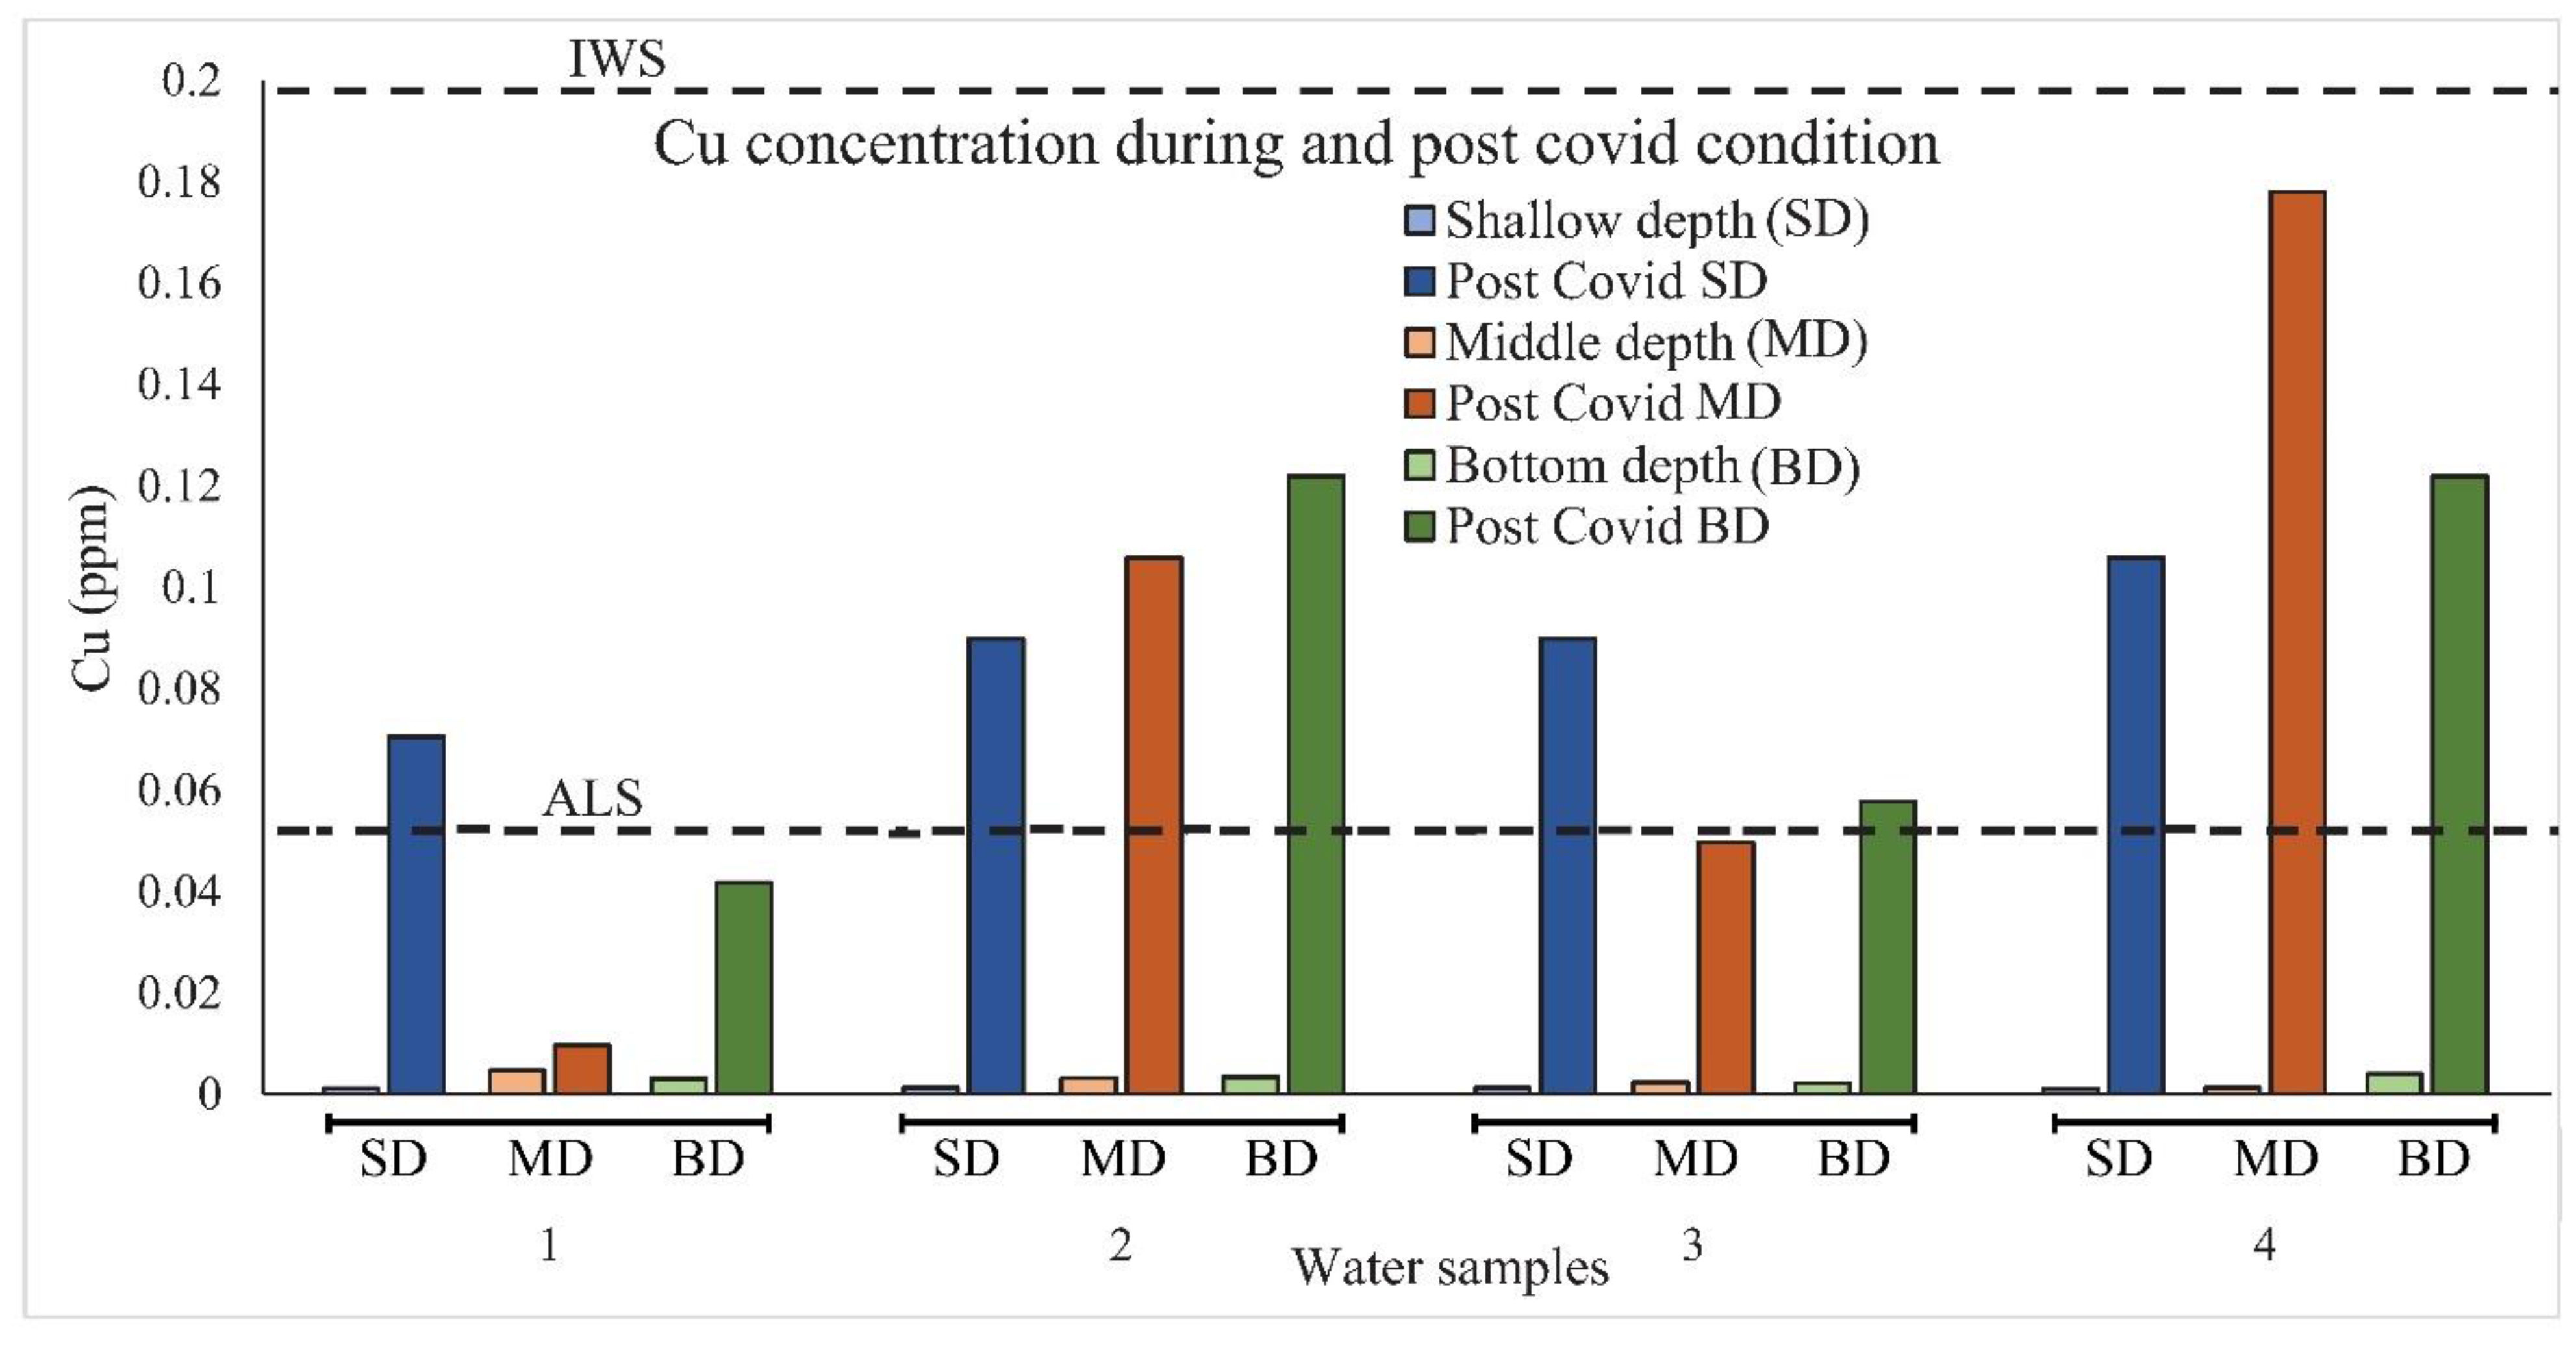
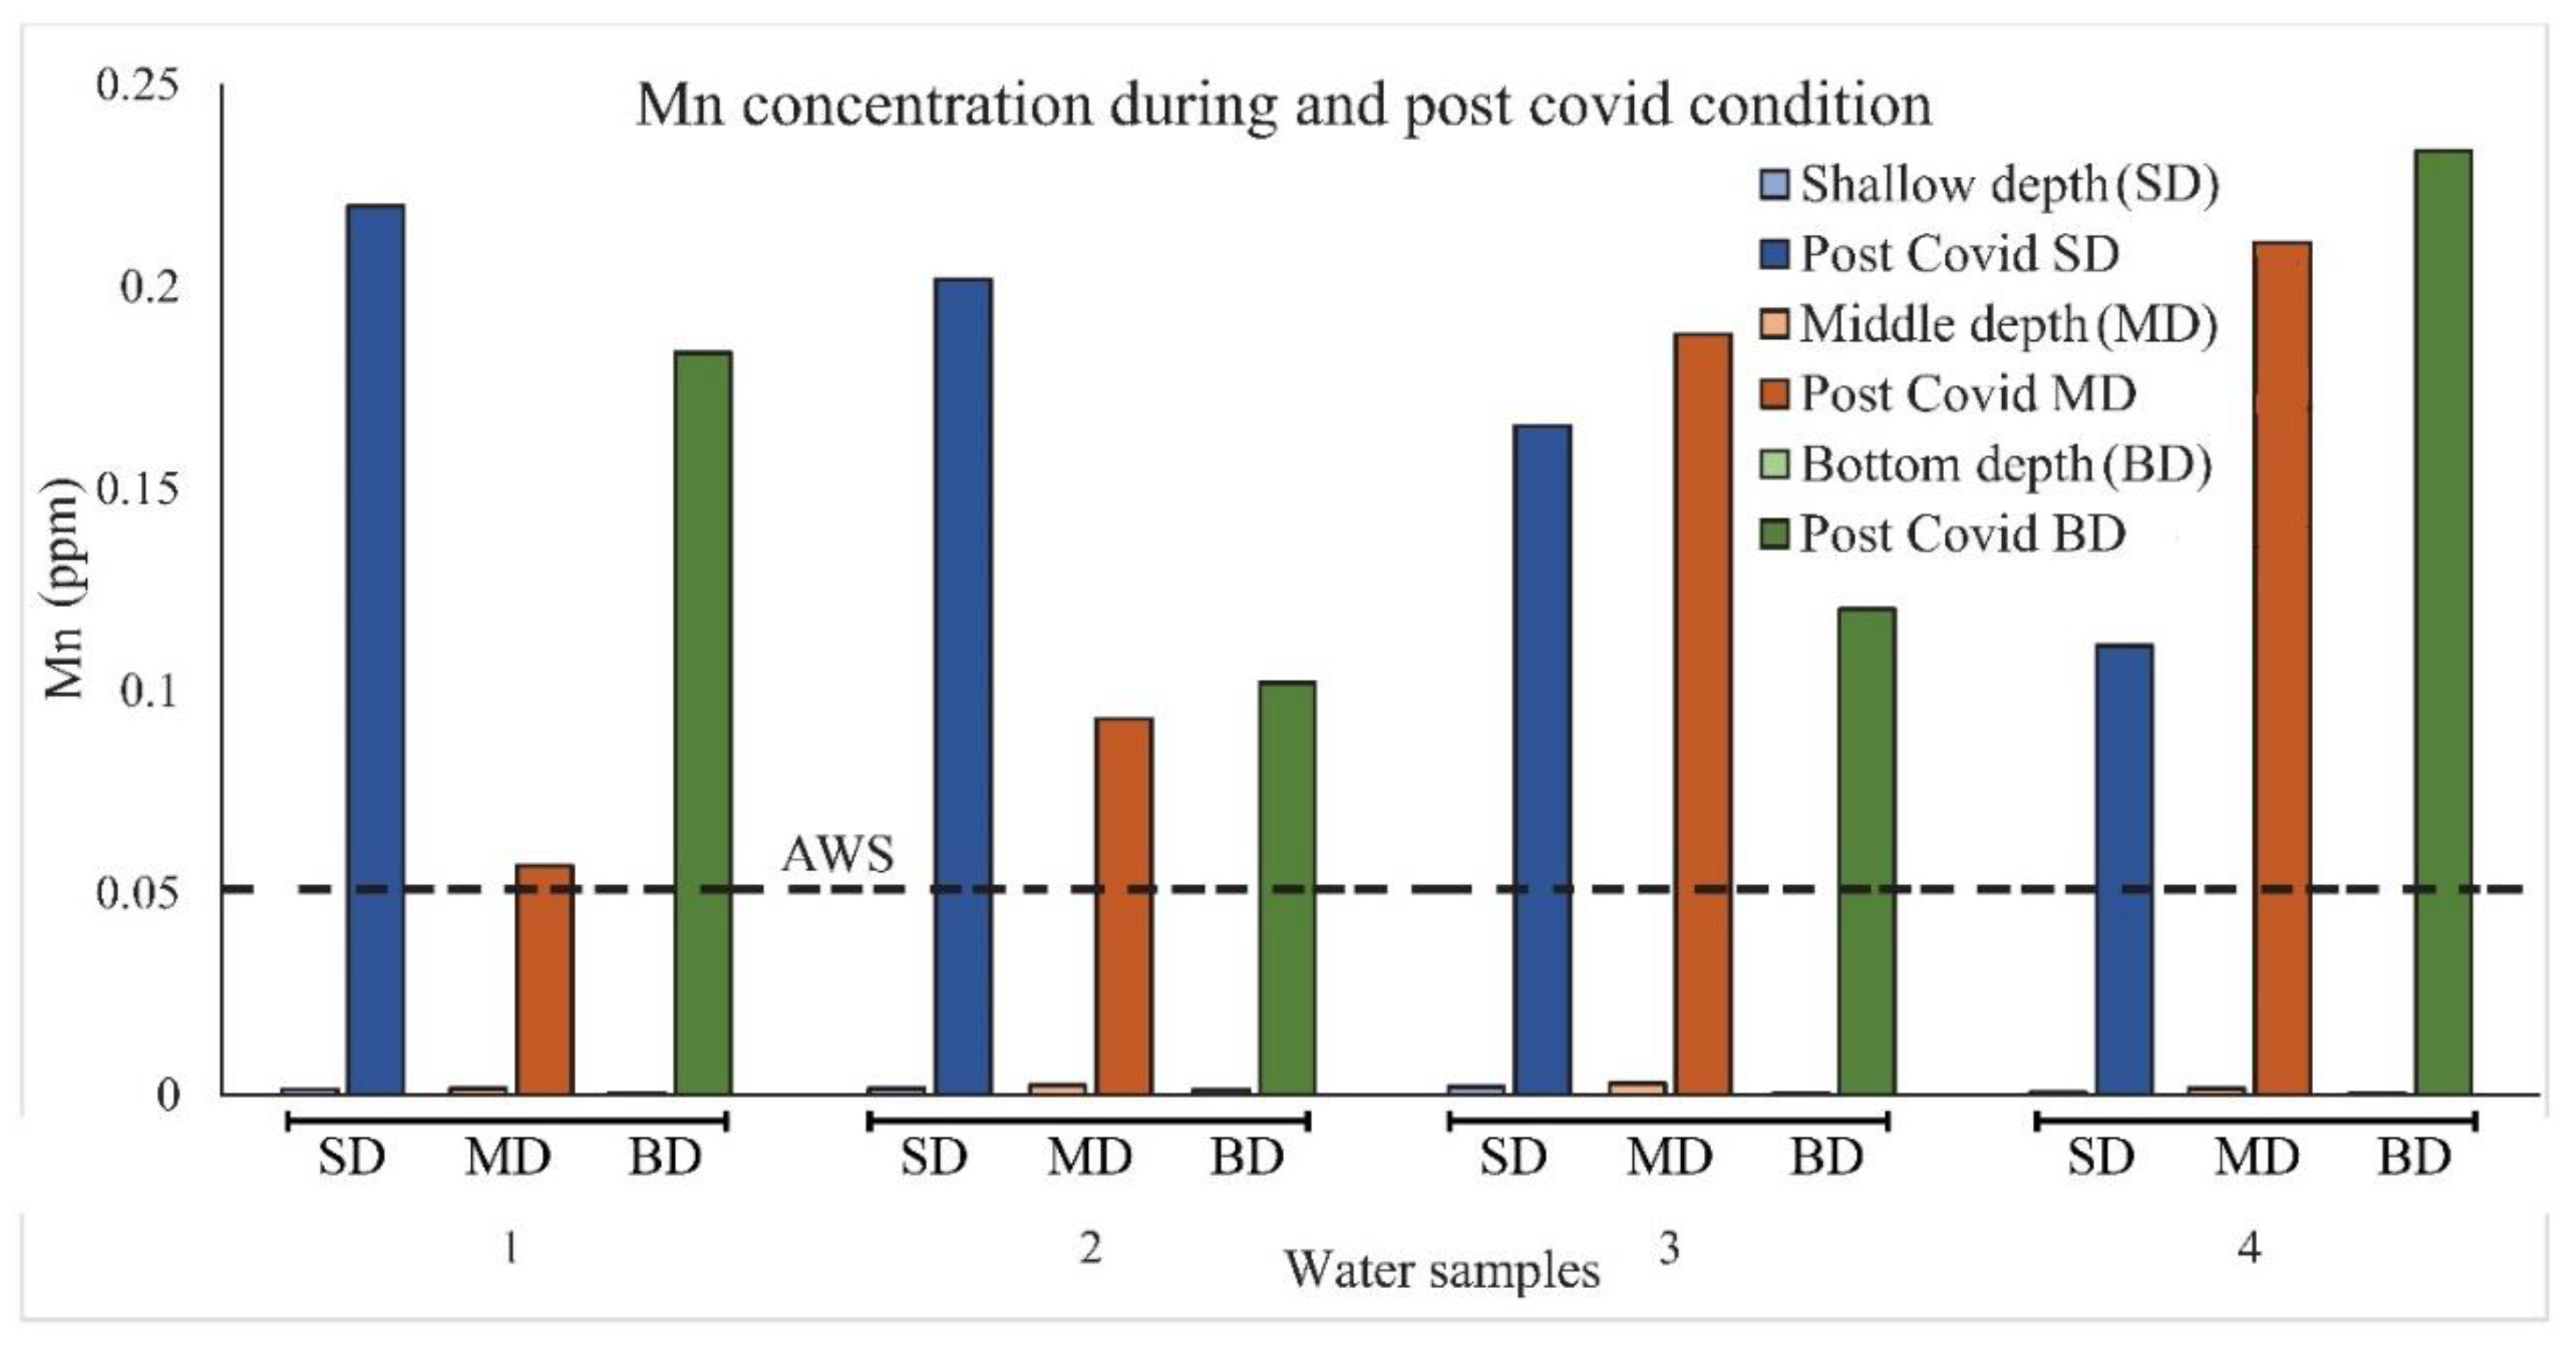
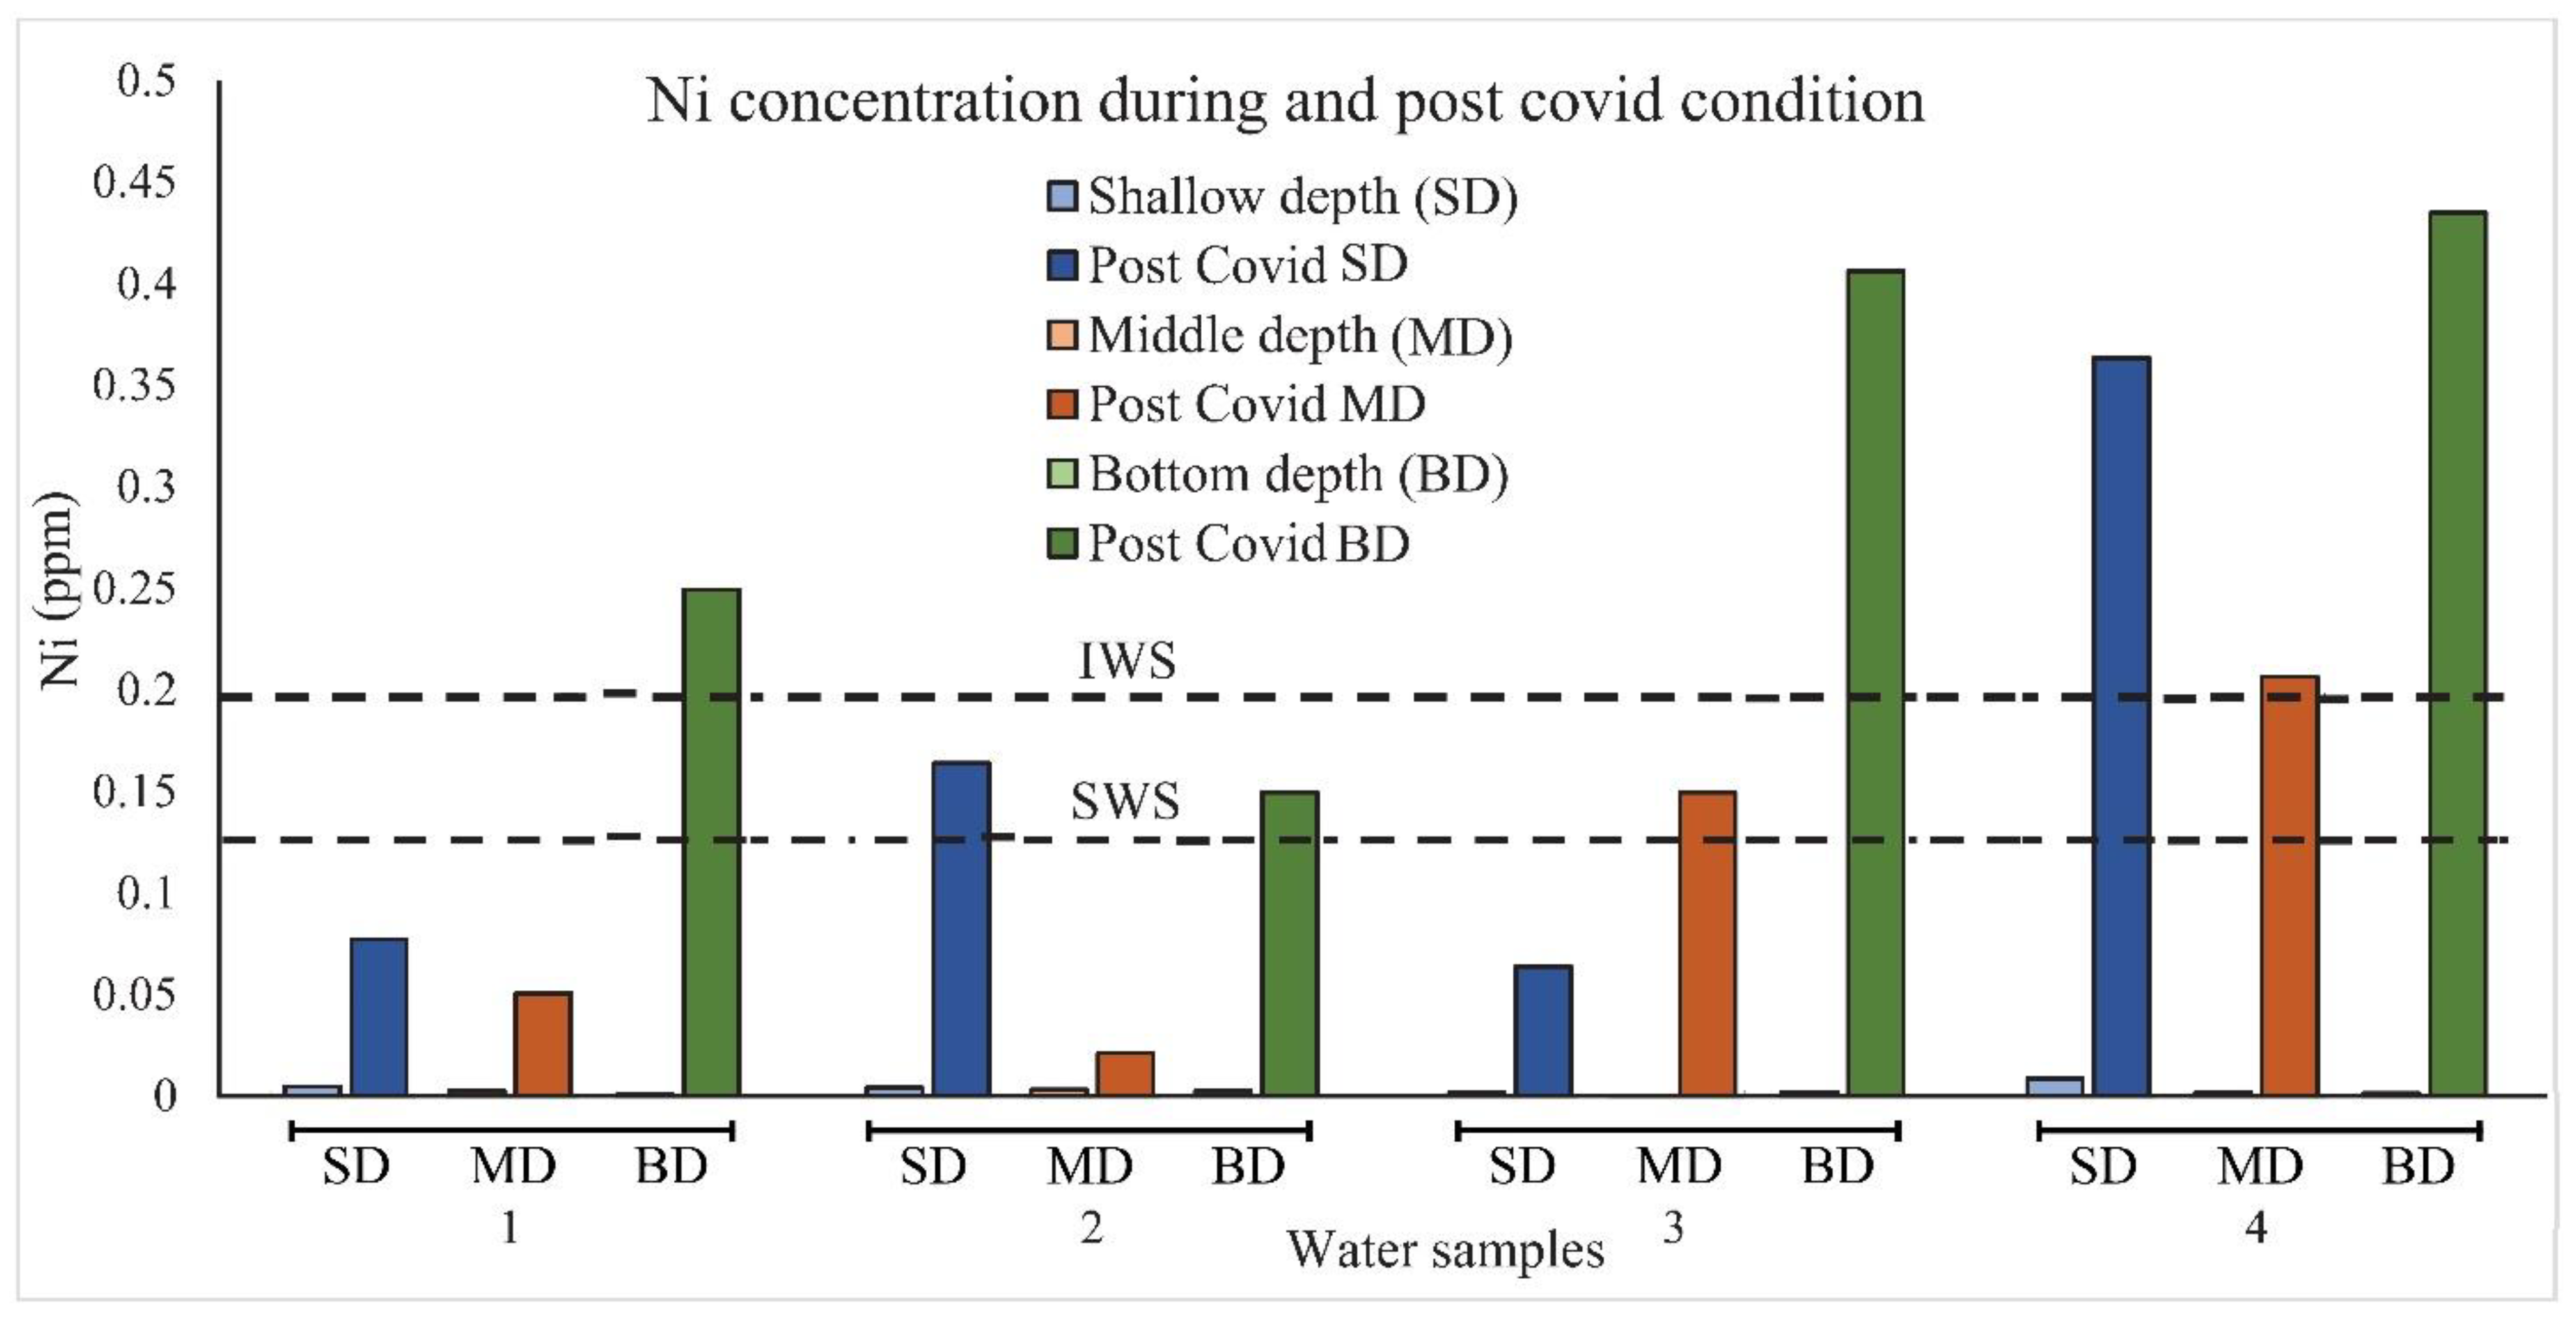
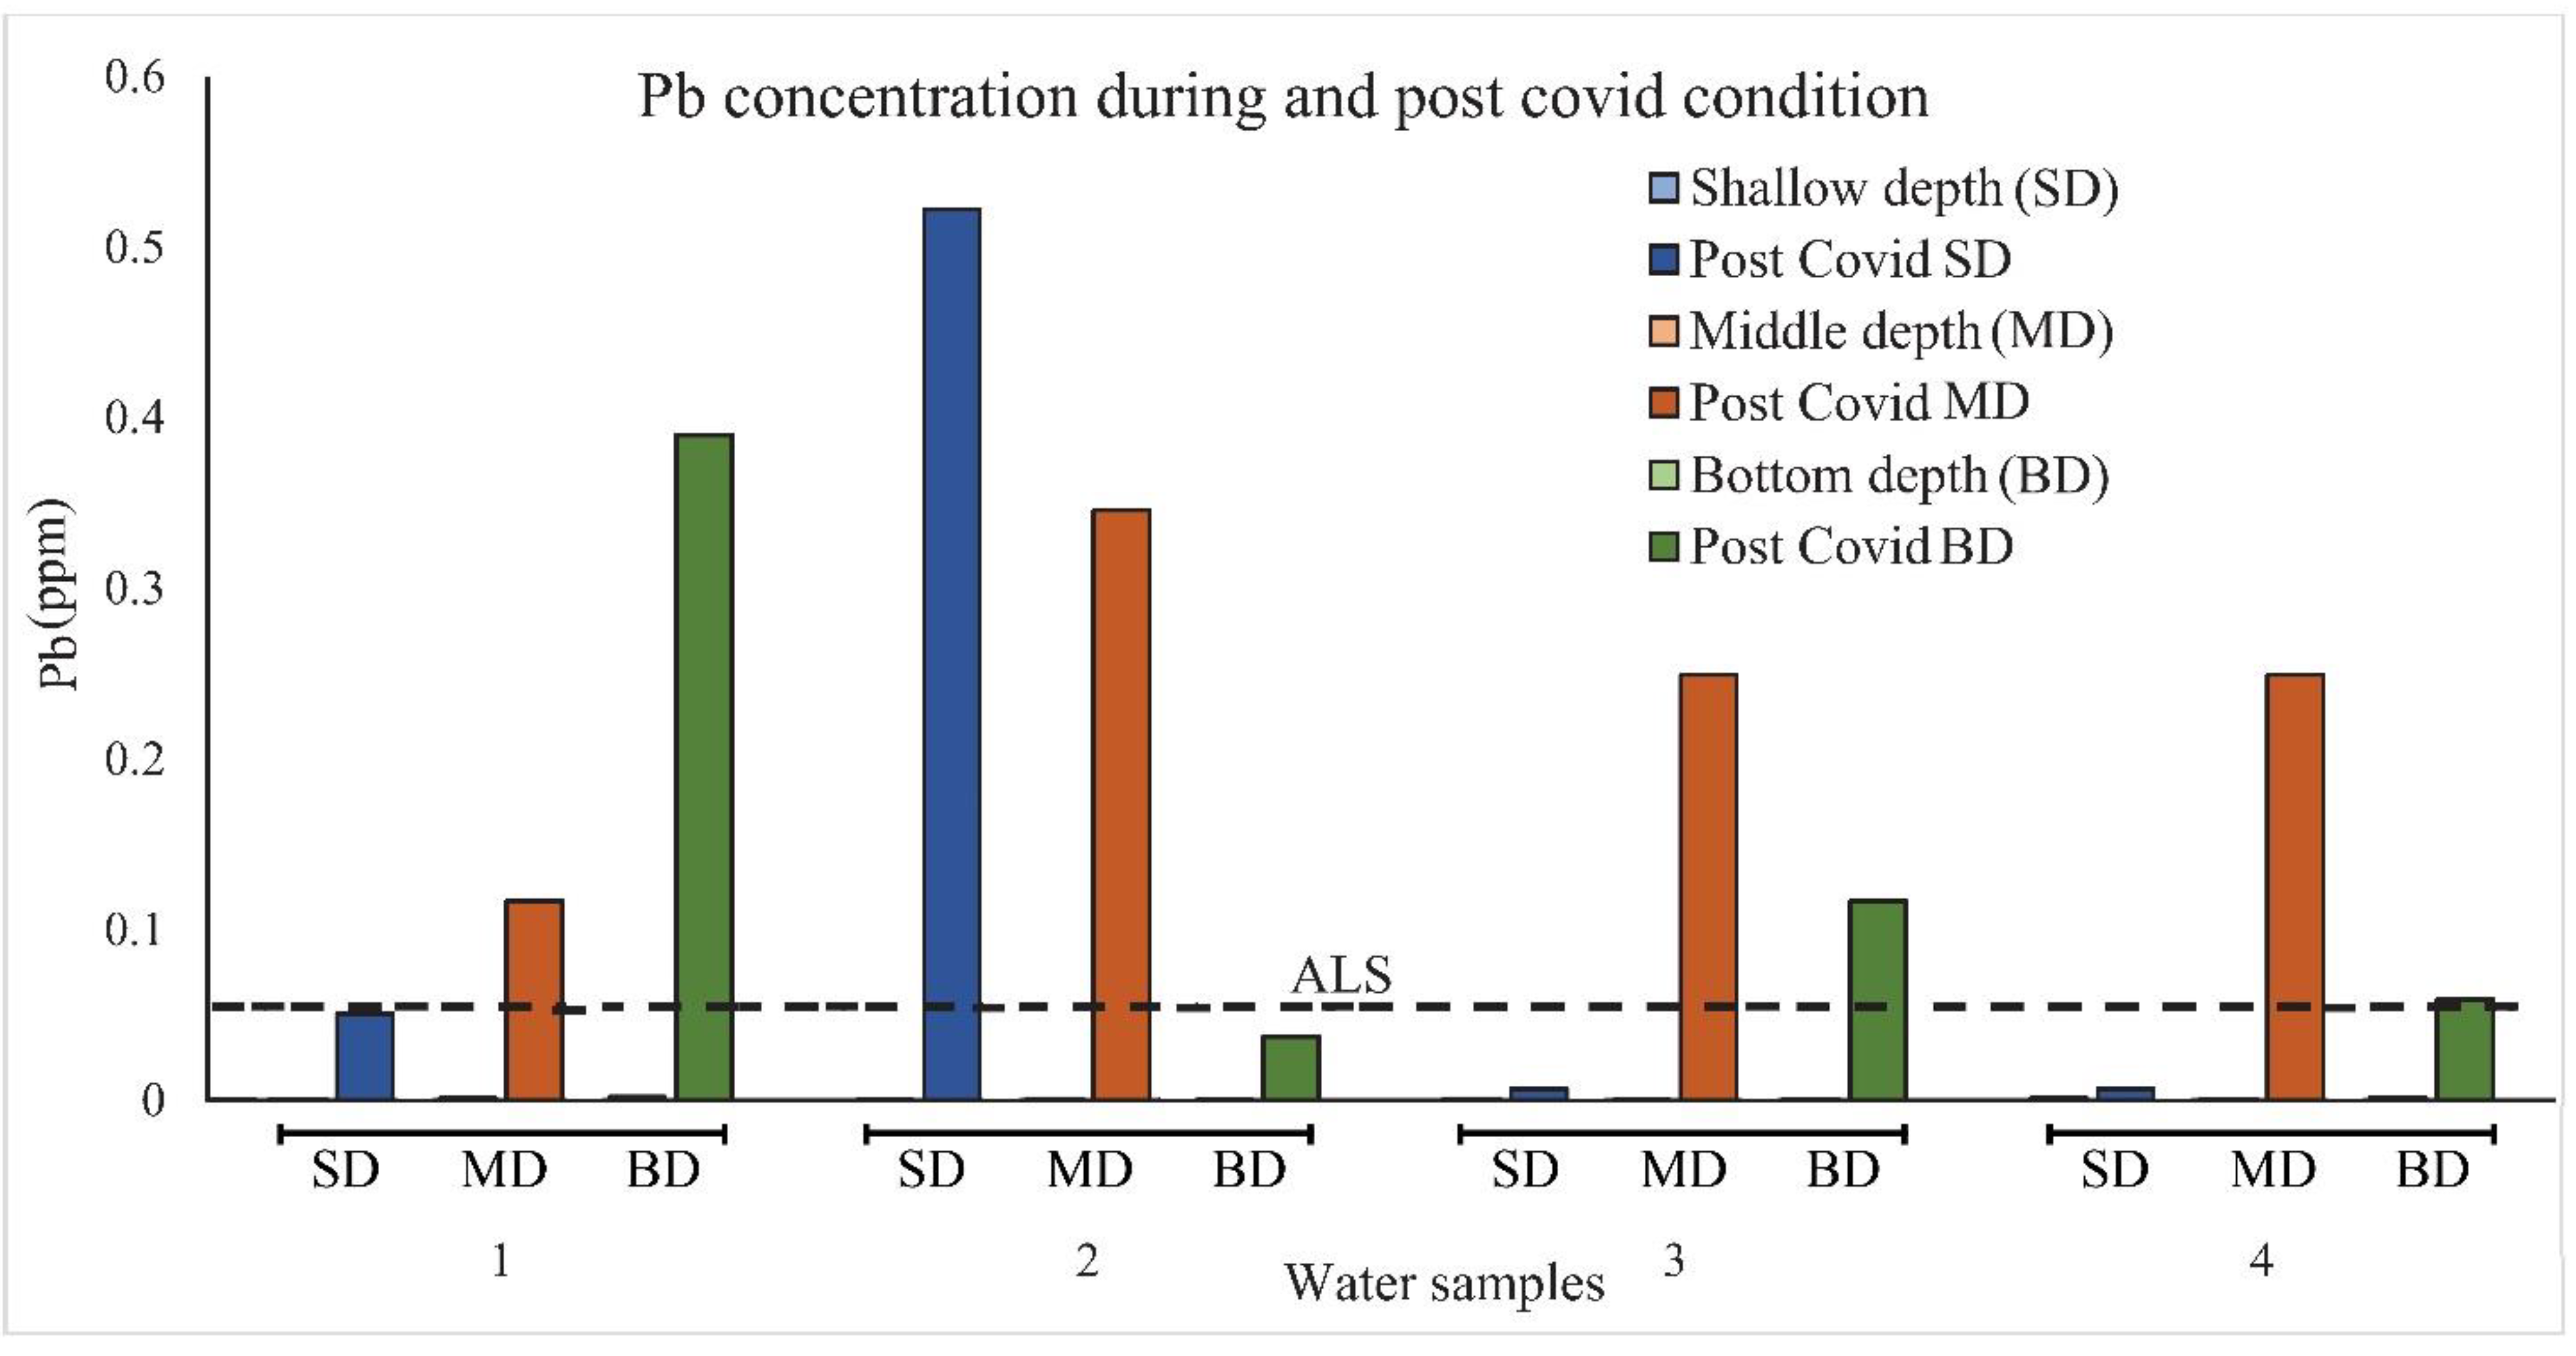
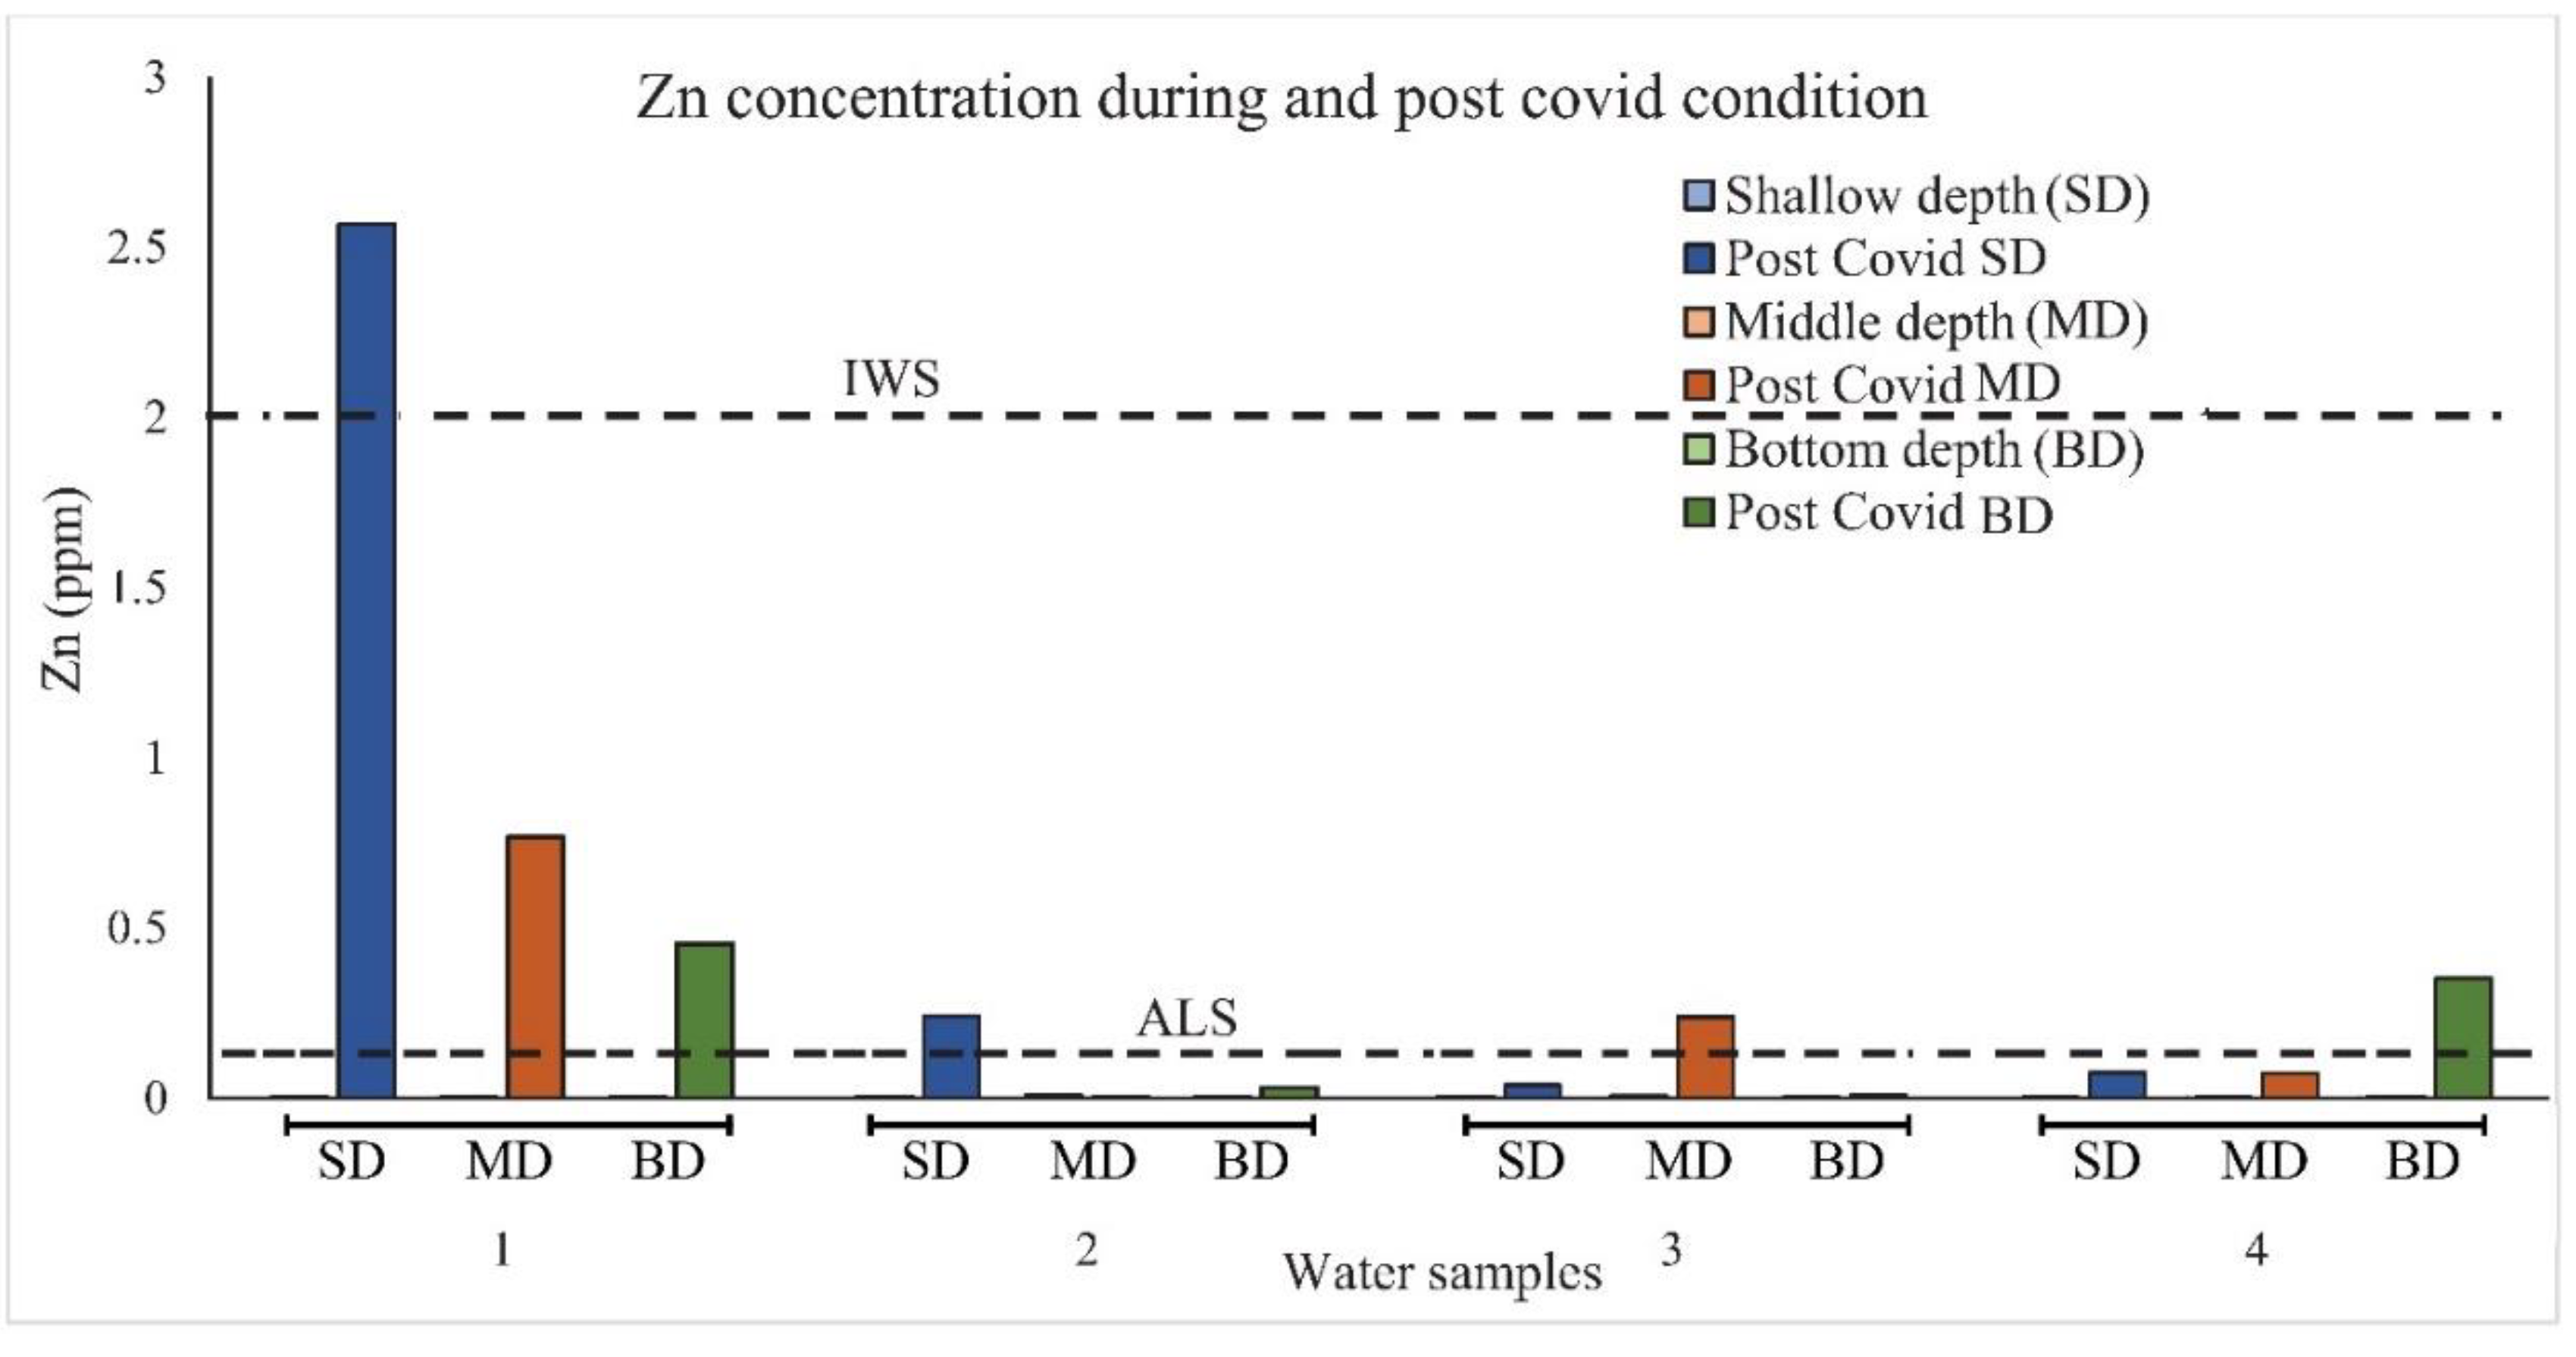
3.4. Variation in Heavy Metal Concentration during and after COVID-19 along the Kerian River
During the pandemic-lockdown period, Cd concentration at shallow depth varies from 0.0007 to 0.0022 ppm with a standard deviation (SD) of 0.00053 ppm. This concentration at middle depth varies from 0.0002 to 0.0075 ppm with an SD of 0.0029 ppm, and, at bottom depth, it varies from 0.0004 to 0.0024 with an SD of 0.0008 ppm. This indicates that more variation at middle depth is reported at site number 2. After the pandemic-unlock period, the concentration increased to 79.3% at shallow depth, 85.08% at middle depth, and 61.7% at bottom depth (Figure 4).
Figure 4.
Concentration of Cadmium at shallow, middle, and bottom depths during and after the pandemic in the study area.
According to National Water Quality Standards of Malaysia (NWQSM), almost all TSS values are in natural condition during and after the pandemic except at middle depth (Class IIA/IIB). Results of middle depth indicate that conventional treatment is required for water supply and is sensitive to aquatic species.
According to National Water Quality Standards of Malaysia (NWQSM), almost all Cd values are under Class IIA/IIB during the pandemic, indicating that conventional treatment is required for water supply and is sensitive to aquatic species. According to Food and Drug Administration (FDA), Cd concentration for drinking water should not exceed 0.005 ppm. Compared to Cd concentration in the study area, most of the sites crossed the permissible limit. Fluctuation in Cd values at different sites indicates anthropogenic and industrial sources in the area. These sources are steel industry, fertilizers, and nuclear emission plants, metal plating and electroplating, plastic industry, and nickel–cadmium batteries [1]. After the pandemic-unlock period, half of the samples fall under Class V, indicating that they are not suitable for drinking and irrigation purposes.
During the pandemic-lockdown period, Cr concentration at shallow depth ranged from 0.0001 ppm to 0.0003 ppm with an SD of 0.0001 ppm. At middle depth, Cr concentration ranged from zero ppm to 0.0003 ppm with an SD of 0.0001 ppm, while, at the bottom depth, it varied from 0.0001 ppm to 0.0002 ppm, with an SD of 0.00004 ppm. More variation was observed at site numbers 2 and 4. After the pandemic-unlock period, the concentration increased to 99.8% at shallow depth, 99.9% at middle depth, and 99.8% at bottom depth (Figure 5).
Figure 5.
Concentration of Chromium at shallow, middle, and bottom depths during pandemic-lockdown and after the pandemic-unlock period in the study area.
According to NWQSM, all Cr values are in natural condition and indicate that no practical treatment is required for the water supply. According to FDA, the Cr concentration of the study area is under permissible limit (1 ppm). The lowest concentration of Cr in the study shows its source from natural deposits such as rocks and soil [1]. However, fluctuation in Cr values at different sites are from industrial waste discharge which contain very low Cr concentration. After the pandemic-unlock period, almost all samples come under Class V, thereby indicating that they are not suitable for drinking and irrigation purposes.
During the pandemic-lockdown period, Cu concentration at shallow depth varies from 0.001 ppm to 0.0013 ppm with an SD of 0.0001 ppm. At middle depth, it varies from 0.0012 ppm to 0.0047 ppm with an SD of 0.0013 ppm. Whereas, at the bottom depth, it varies from 0.0022 ppm to 0.004 ppm, with an SD of 0.0006 ppm. More variation was found at middle depth followed by bottom and shallower depth. High variation among different depths was found at site number 1. After the pandemic-unlock period, the concentration increases to 98.6% at shallow depth, 85.6% at middle depth, and 95.6% at bottom depth (Figure 6).
Figure 6.
Concentration of Copper at shallow, middle, and bottom depths during pandemic-lockdown and after the pandemic-unlock period in the study area.
According to NWQSM, all Cu values are in natural condition, which indicates that no practical treatment is required for the water supply. According to FDA, Cu concentrations of the study area are under a permissible limit (1 ppm). Cu can be released from different sources such as chemical industry, mining, pesticide industry, and metal piping [1]. The second highest concentration at middle and bottom depth in the study showed its industrial source. After the pandemic-unlock period, all samples except a few come under Class V, indicating that they are not suitable for drinking and irrigation purposes.
During the pandemic-lockdown period, Fe concentration at shallow depth ranged from 0.0003 ppm to 0.002 ppm with an SD of 0.00061 ppm. At middle depth, it varied from 0.0011 ppm to 0.0029 ppm with an SD of 0.00068, while, at the bottom depth, it varied from 0.0002 ppm to 0.009 ppm with an SD of 0.0033 ppm. High variation was observed at bottom depth. After the pandemic-unlock period, the concentration increased to 99.8% at shallow depth, 99.9% at middle depth, and 99.1% at bottom depth (Figure 7).
Figure 7.
Concentration of Iron at shallow, middle, and bottom depths during pandemic-lockdown and after the pandemic-unlock period in the study area.
According to NWQSM, all Fe values are in natural condition, indicating that no practical treatment is required for the water supply. According to FDA, Fe concentrations of the study area are under the permissible limit (0.3 ppm). Generally, the source of Fe is from soil and rocks. A high difference in Fe values is reported only at site number 1, indicating an industrial or anthropogenic source. After the pandemic-unlock period, all samples except a few come under Class V, thereby indicating that they are not suitable for drinking and irrigation purposes
Mn concentration at shallow depth varies from 0.0006 ppm to 0.002 ppm with an SD of 0.0005 ppm. At middle depth, it varies from 0.0015 ppm to 0.0028 ppm with an SD of 0.0005 ppm, whereas, at the bottom depth, it varies from 0.0003 ppm to 0.0012 ppm, with an SD of 0.00035 ppm. Similar variation was observed at both shallow and middle depths. After the pandemic-unlock period, the concentration increases to 99.2% at shallow depth, 99.1% at middle depth, and 99.5% at bottom depth (Figure 8).
Figure 8.
Concentration of Manganese at shallow, middle, and bottom depths during pandemic-lockdown and after the pandemic-unlock period in the study area.
According to NWQSM, all Mn values are in natural condition, which indicates that no practical treatment is required for the water supply. According to FDA, Mn concentrations of the study area are under the permissible limit (0.05 ppm). As Mn values are under the permissible limit, its source must be natural, such as soil and rocks. It is interesting to observe a sudden drop of Mn values at site number 4 at both shallow and middle depths, and it slightly increases at the bottom depth. This may be due to adsorption or the ion exchange of Mn by riverbed material such as soil and sand. After the pandemic-unlock period, all samples fell under Class V, thereby indicating that they are not suitable for drinking and irrigation purposes.
During the pandemic-lockdown period, Ni concentration at shallow depth ranged from 0.0015 ppm to 0.0086 ppm with an SD of 0.0025 ppm. At middle depth, it ranged from zero ppm to 0.003 ppm with an SD of 0.0011 ppm. Whereas, at the bottom depth, it ranged from 0.0011 ppm to 0.0026 ppm, with an SD of 0.0006 ppm. High variation was observed at shallow depth followed by bottom and middle depths. After the pandemic-unlock period, the concentration increased to 96.4% at shallow depth, 94.9% at middle depth, and 99.2% at bottom depth (Figure 9).
Figure 9.
Concentration of Nickel at shallow, middle, and bottom depths during pandemic-lockdown and after the pandemic-unlock period in the study area.
According to NWQSM, all Ni values are in natural condition, indicating that no practical treatment is required for the water supply. According to FDA, Ni concentrations of the study area are under the permissible limit (0.1 ppm). As shown in Figure 8, at shallow depth, the sudden rise in Ni value at site number 4 may be due to industrial discharge or anthropogenic activity. After the pandemic-unlock period, all samples except a few fall under Class V, thereby indicating that they are not suitable for drinking and irrigation purposes.
During the pandemic-lockdown period, at shallow depth, Pb concentration ranged from 0.0004 ppm to 0.0013 ppm with an SD of 0.0003 ppm. Pb concentration at middle depth ranged from 0.0001 ppm to 0.0012 ppm with an SD of 0.00042 ppm. Whereas, at bottom depth, it ranged from 0.0004 ppm to 0.0022 ppm, with an SD of 0.0007 ppm. High variation was observed at bottom depth followed by middle and shallow depths. After the pandemic-unlock period, the concentration increased to 88.6% at shallow depth, 99.6% at middle depth, and 98.8% at bottom depth (Figure 10).
Figure 10.
Concentration of Lead at shallow, middle, and bottom depths during pandemic-lockdown and after the pandemic-unlock period in the study area.
According to NWQSM, all Pb values are in natural condition, indicating that no practical treatment is required for the water supply. According to FDA, Pb concentrations of the study area are under the permissible limit (0.01 ppm). At site number 1, Pb concentration was high at the bottom depth; however, at site number 4, it was same the concentration at shallow depth. After the pandemic-unlock period, half of the samples except a few fall under Class V, thereby indicating that they are not suitable for drinking and irrigation purposes.
Zn concentration at shallow depth varies from 0.001 ppm to 0.0032 ppm with an SD of 0.0008 ppm. At middle depth, it varies from 0.0006 ppm to 0.006 ppm with an SD of 0.002 ppm. Whereas, at the bottom depth, it varies from 0.0014 ppm to 0.0034 ppm with an SD of 0.0008 ppm. High variation was observed at middle depth followed by shallow and bottom depths. After the pandemic-unlock period, the concentration increased to 96.6% at shallow depth, 60.7% at middle depth, and 92.7% at bottom depth (Figure 11).
Figure 11.
Concentration of Zinc at shallow, middle, and bottom depths during pandemic-lockdown and after the pandemic-unlock period in the study area.
According to NWQSM, all Zn values are in natural condition, indicating that no practical treatment is required for the water supply. According to FDA, Zn concentrations of the study area are under the permissible limit (5.0 ppm). Again, at site number 4, Zn values suddenly drop at both shallow and middle depths, while they increase at the bottom depth. This may be due to the adsorption and ion exchange of Zn by suspended sediments. After the pandemic-unlock period, half of the samples except a few come under Class V, thereby indicating that they are not suitable for drinking and irrigation purposes.
3.5. Comparison Heavy Metals with Different Standards at Kerian River
Heavy metal values were compared with drinking water standards (DWS), irrigation water standards (IWS), aquatic life standards (ALS), and surface water standards (SWS) to understand the use of Kerian River water for different purposes. Overall, the results of the comparison showed that the Kerian River water is under permissible limits of drinking, irrigation, aquatic life, and surface water standards. Concentrations of heavy metals after the pandemic-unlock period crossed the standard limits, which is not required here to be compared. A summary of results is given in Table 3.
Table 3.
Comparison of heavy metal concentration after the pandemic-unlock period at different depths with drinking water standards (DWS), irrigation water standards (IWS), aquatic life standards (ALS), and surface water standards (SWS).
4. Conclusions
This study was conducted to analyze the baseline values of the total suspended solid and heavy metals during and post-COVID-19 pandemic. The study reports that concentrations of heavy metals are under permissible limits of National Water Quality Standards of Malaysia, Food and Drug Administration, and standards of drinking water, irrigation water, and aquatic life. However, there are variations in different depths at the same sampling site. The possible reason for those heavy metal values that suddenly drop from one site to another could be the high settling tendency in Kerian River due to binding capacities with other existing components of water matrix such as micro particles or micro vegetation. They may be in suspended, colloidal, or dissolved form. Whereas, for those heavy metal values that suddenly raised from one site to another, the possible reason could be an anthropogenic source. High concentrations of Ni, Zn, and Fe were reported at shallow, middle, and bottom depths, respectively. Overall, the possible reason for the lack of heavy metal pollution may be due to COVID-19 restrictions on anthropogenic activities. Whereas, before the post-pandemic period, heavy metal values increased from 60% to 100% from during pandemic conditions. This confirms that the increment is due to anthropogenic activities after releasing COVID-19 restrictions. Furthermore, no significant effect was observed on total suspended solid values in post-pandemic conditions.
Author Contributions
Conceptualization, M.N.A. and E.A.B.; Data curation, E.A. and J.B.J.; Formal analysis, M.N.A., M.T.A., J.B.J. and M.D.; Investigation, E.A. and M.D.; Methodology, M.N.A., M.T.A. and J.B.J.; Project administration, E.A.B.; Resources, M.D.; Supervision, E.A.B.; Writing—original draft, M.N.A.; Writing—review and editing, M.T.A. and E.A. All authors have read and agreed to the published version of the manuscript.
Funding
This study was funded by Research Creativity and Management Office, Universiti Sains Malaysia. The authors would like to acknowledge the grant RU Top-Down 1001/PAERO/870052.
Institutional Review Board Statement
Not applicable.
Informed Consent Statement
Not applicable.
Data Availability Statement
Not applicable.
Conflicts of Interest
The authors declare no conflict of interest.
Appendix A
Table A1.
Laboratory results of eight heavy metals (ppm) with their standard deviations at different depths.
Table A1.
Laboratory results of eight heavy metals (ppm) with their standard deviations at different depths.
| Parameters | Sample No. | Water Sample 1 | Water Sample 2 | Water Sample 3 | Water Sample 4 | ||||||||
|---|---|---|---|---|---|---|---|---|---|---|---|---|---|
| Depth | Shallow | Middle | Bottom | Shallow | Middle | Bottom | Shallow | Middle | Bottom | Shallow | Middle | Bottom | |
| Cd | During pandemic | 0.0014 ± 0.0002 | 0.0012 ± 0.0066 | 0.0011 ± 0.0060 | 0.0022 ± 0.0064 | 0.0075 ± 0.0066 | 0.0004 ± 0.0068 | 0.0007 ± 0.0076 | 0.0002 ± 0.0070 | 0.0024 ± 0.0056 | 0.0014 ± 0.0064 | 0.0010 ± 0.0064 | 0.0022 ± 0.0058 |
| Post pandemic | 0.0091 ± 0.0000 | 0.0198 ± 0.0001 | 0.0030 ± 0.0001 | 0.0015 ± 0.0001 | 0.0213 ± 0.0000 | 0.0015 ± 0.0001 | 0.0030 ± 0.0000 | 0.0015 ± 0.0005 | 0.0030 ± 0.0001 | 0.0061 ± 0.0000 | 0.0198 ± 0.0001 | 0.0228 ± 0.0001 | |
| Cr | During pandemic | 0.0002 ± 0.0002 | 0.0001 ± 0.0002 | 0.0002 ± 0.0002 | 0.0003 ± 0.0004 | 0.0002 ± 0.0000 | 0.0001 ± 0.0000 | 0.0002 ± 0.0002 | 0.0003 ± 0.0002 | 0.0002 ± 0.0004 | 0.0001 ± 0.0002 | 0.0000 ± 0.0002 | 0.0002 ± 0.0004 |
| Post pandemic | 0.1441 ± 0.0001 | 0.1354 ± 0.0001 | 0.1528 ± 0.0000 | 0.1266 ± 0.0001 | 0.1878 ± 0.0000 | 0.0917 ± 0.0001 | 0.1441 ± 0.0000 | 0.1790 ± 0.0001 | 0.1179 ± 0.0000 | 0.1616 ± 0.0001 | 0.1616 ± 0.0001 | 0.1092 ± 0.0000 | |
| Cu | During pandemic | 0.0012 ± 0.0003 | 0.0047 ± 0.0004 | 0.0031 ± 0.0004 | 0.0013 ± 0.0008 | 0.0032 ± 0.0001 | 0.0034 ± 0.0006 | 0.0012 ± 0.0008 | 0.0023 ± 0.0006 | 0.0022 ± 0.0004 | 0.0010 ± 0.0000 | 0.0012 ± 0.0002 | 0.0040 ± 0.0004 |
| Post pandemic | 0.0705 ± 0.0001 | 0.0096 ± 0.0001 | 0.0417 ± 0.0001 | 0.0898 ± 0.0001 | 0.1058 ± 0.0002 | 0.1219 ± 0.0001 | 0.0898 ± 0.0000 | 0.0497 ± 0.0000 | 0.0577 ± 0.0002 | 0.1058 ± 0.0001 | 0.1780 ± 0.0000 | 0.1219 ± 0.0001 | |
| Fe | During pandemic | 0.0011 ± 0.0010 | 0.0017 ± 0.0014 | 0.0029 ± 0.0040 | 0.0009 ± 0.0009 | 0.0014 ± 0.0004 | 0.0018 ± 0.0016 | 0.0003 ± 0.0006 | 0.0029 ± 0.004 | 0.0002 ± 0.0018 | 0.0020 ± 0.0016 | 0.0011 ± 0.0028 | 0.0032 ± 0.0022 |
| Post pandemic | 7.1373 ± 0.0005 | 7.0440 ± 0.0002 | 7.0090 ± 0.0000 | 6.1808 ± 0.0009 | 6.8107 ± 0.0008 | 7.4872 ± 0.0001 | 7.0206 ± 0.0001 | 7.2306 ± 0.0001 | 0.3136 ± 0.0003 | 0.3603 ± 0.0004 | 0.8385 ± 0.0005 | 0.0920 ± 0.0001 | |
| Mn | During pandemic | 0.0014 ± 0.0010 | 0.0015 ± 0.0014 | 0.0004 ± 0.0008 | 0.0016 ± 0.0008 | 0.0023 ± 0.0013 | 0.0012 ± 0.0005 | 0.0020 ± 0.0016 | 0.0028 ± 0.0004 | 0.0003 ± 0.0012 | 0.0006 ± 0.0023 | 0.0016 ± 0.0023 | 0.0005 ± 0.0007 |
| Post pandemic | 0.2200 ± 0.0002 | 0.0567 ± 0.0004 | 0.1837 ± 0.0001 | 0.2018 ± 0.0002 | 0.0930 ± 0.0004 | 0.1020 ± 0.0001 | 0.1655 ± 0.0000 | 0.1882 ± 0.0010 | 0.1202 ± 0.0001 | 0.1111 ± 0.0001 | 0.2109 ± 0.0002 | 0.2336 ± 0.0003 | |
| Ni | During pandemic | 0.0047 ± 0.0051 | 0.0025 ± 0.0051 | 0.0011 ± 0.0038 | 0.0040 ± 0.0034 | 0.0030 ± 0.0044 | 0.0026 ± 0.0062 | 0.0015 ± 0.0059 | 0.0000 ± 0.0078 | 0.0019 ± 0.0062 | 0.0086 ± 0.0088 | 0.0018 ± 0.0076 | 0.0013 ± 0.0050 |
| Post pandemic | 0.0790 ± 0.0002 | 0.0505 ± 0.0001 | 0.2492 ± 0.0003 | 0.1636 ± 0.0001 | 0.0209 ± 0.0008 | 0.1493 ± 0.0001 | 0.0637 ± 0.0003 | 0.1493 ± 0.0004 | 0.4061 ± 0.0001 | 0.3633 ± 0.0001 | 0.2064 ± 0.0007 | 0.4347 ± 0.0005 | |
| Pb | During pandemic | 0.0009 ± 0.0020 | 0.0012 ± 0.0020 | 0.0022 ± 0.0042 | 0.0004 ± 0.0014 | 0.0010 ± 0.0031 | 0.0004 ± 0.0022 | 0.0009 ± 0.0025 | 0.0001 ± 0.0025 | 0.0008 ± 0.0031 | 0.0013 ± 0.0026 | 0.0007 ± 0.0023 | 0.0013 ± 0.0020 |
| Post pandemic | 0.0508 ± 0.0001 | 0.1169 ± 0.0004 | 0.3898 ± 0.0005 | 0.5220 ± 0.0000 | 0.3458 ± 0.0005 | 0.0373 ± 0.0002 | 0.0068 ± 0.0001 | 0.2492 ± 0.0000 | 0.1169 ± 0.0001 | 0.0068 ± 0.0006 | 0.2492 ± 0.0004 | 0.0593 ± 0.0007 | |
| Zn | During pandemic | 0.0021 ± 0.0004 | 0.0028 ± 0.0005 | 0.0026 ± 0.0008 | 0.0022 ± 0.0002 | 0.0060 ± 0.0010 | 0.0016 ± 0.0008 | 0.0032 ± 0.0018 | 0.0050 ± 0.0001 | 0.0014 ± 0.0005 | 0.0010 ± 0.0004 | 0.0006 ± 0.0000 | 0.0034 ± 0.0015 |
| Post pandemic | 2.5686 ± 0.0021 | 0.7675 ± 0.0006 | 0.4533 ± 0.0001 | 0.2416 ± 0.0001 | 0.0039 ± 0.0001 | 0.0298 ± 0.0001 | 0.0369 ± 0.0000 | 0.2380 ± 0.0000 | 0.0063 ± 0.0002 | 0.0733 ± 0.0001 | 0.0722 ± 0.0004 | 0.3522 ± 0.0001 | |
References
- Yunus, K.; Zuraidah, M.A.; John, A. A review on the accumulation of heavy metals in coastal sediment of Peninsular Malaysia. Ecofeminism Clim. Chang. 2020, 1, 21–35. [Google Scholar] [CrossRef]
- Tahiru, A.A.; Doke, D.A.; Baatuuwie, B.N. Effect of land use and land cover changes on water quality in the Nawuni Catchment of the White Volta Basin, Northern Region, Ghana. Appl. Water Sci. 2020, 10, 198. [Google Scholar] [CrossRef]
- Wang, Z.J.; Li, S.L.; Yue, F.J.; Qin, C.Q.; Buckerfield, S.; Zeng, J. Rainfall driven nitrate transport in agricultural karst surface river system: Insight from high resolution hydrochemistry and nitrate isotopes. Agric. Ecosyst. Environ. 2020, 291, 106787. [Google Scholar] [CrossRef]
- Esteller, M.V.; Martínez-Valdés, H.; Garrido, S.; Uribe, Q. Nitrate and phosphate leaching in a Phaeozem soil treated with biosolids, composted biosolids and inorganic fertilizers. Waste Manag. 2009, 29, 1936–1944. [Google Scholar] [CrossRef] [PubMed]
- Othman, F.; Chowdhury, M.S.U.; Wan Jaafar, W.Z.; Faresh, E.M.M.; Shirazi, S.M. Assessing risk and sources of heavy metals in a tropical river basin: A case study of the Selangor river, Malaysia. Polish J. Environ. Stud. 2018, 27, 1659–1672. [Google Scholar] [CrossRef]
- Ibrahim, T.N.B.T.; Othman, F.; Mahmood, N.Z. Baseline Study of Heavy Metal Pollution in a Tropical River in a Developing Country. Sains Malays. 2020, 49, 729–742. [Google Scholar] [CrossRef]
- Elmorsi, R.R.; Abou-El-Sherbini, K.S.; Abdel-Hafiz Mostafa, G.; Hamed, M.A. Distribution of essential heavy metals in the aquatic ecosystem of Lake Manzala, Egypt. Heliyon 2019, 5, e02276. [Google Scholar] [CrossRef] [PubMed]
- Ali, H.; Khan, E. Bioaccumulation of non-essential hazardous heavy metals and metalloids in freshwater fish. Risk Human Health Environ. Chem. Lett. 2018, 16, 903–917. [Google Scholar] [CrossRef]
- Ishadi, N.A.M.; Rawi, C.S.M.; Ahmad, A.H.; Abdul, N.H. The influence of heavy metals and water parameters on the composition and abundance of water bugs (Insecta: Hemiptera) in the kerian river basin, Perak, Malaysia. Trop. Life Sci. Res. 2014, 25, 61–79. [Google Scholar] [PubMed]
- Ibrahim, N.; Aziz, H.A.; Yusoff, M.S. Heavy metals concentration in river and pumping well water for river bank filtration (RBF) system: Case study in Sungai Kerian. J. Teknol. 2015, 74, 59–67. [Google Scholar] [CrossRef][Green Version]
- Billah, M.M.; Mustafa Kamal, A.H.; Idris, M.H.; Ismail, J. Mangrove Macroalgae as Biomonitors of Heavy Metal Contamination in a Tropical Estuary, Malaysia. Water Air Soil Pollut. 2017, 228, 347. [Google Scholar] [CrossRef]
- Chowdhury, M.S.U.; Othman, F.; Jaafar, W.Z.W.; Mood, N.C.; Adham, M.I. Assessment of pollution and improvement measure of water quality parameters using scenarios modeling for Sungai Selangor Basin. Sains Malays. 2018, 47, 457–469. [Google Scholar] [CrossRef]
- Zanuri, N.B.M.; Abdullah, M.B.; Darif, N.A.M.; Nilamani, N.; Hwai, A.T.S. Case study of marine pollution in Teluk Bahang, Penang, Malaysia. IOP Conf. Ser. Earth Environ. Sci. 2020, 414, 012032. [Google Scholar] [CrossRef]
- Lee Goi, C. The river water quality before and during the Movement Control Order (MCO) in Malaysia. Case Stud. Chem. Environ. Eng. 2020, 2, 100027. [Google Scholar] [CrossRef]
- Razak, M.R.; Aris, A.Z.; Zakaria, N.A.C.; Wee, S.Y.; Ismail, N.A.H. Accumulation and risk assessment of heavy metals employing species sensitivity distributions in Linggi River, Negeri Sembilan, Malaysia. Ecotoxicol. Environ. Saf. 2021, 211, 111905. [Google Scholar] [CrossRef]
- Nordin, N.F.M.; Mohamad, H.; Alarifi, H. Numerical modelling of seepage analysis using SEEP/W: A case study for the Kerian River Flood Mitigation Project (Phase 3) in Bandar Baharu, Kedah. IOP Conf. Ser. Mater. Sci. Eng. 2021, 1101, 12007. [Google Scholar] [CrossRef]
- Ansari, E.; Akhtar, M.N.; Abdullah, M.N.; Othman, W.A.; Bakar, E.A.; Hawary, A.F.; Alhady, S.S. Image Processing of UAV Imagery for River Feature Recognition of Kerian River, Malaysia. Sustainability 2021, 13, 9568. [Google Scholar] [CrossRef]
- Amelia, Z.S.; Che Salmah, M.R.; Abu Hassan, A. Diversity and distribution of dragonfly (Odonata: Insecta) in the Kerian River basin, Kedah-Perak, Malaysia. USU Reposit. 2006, 14. Available online: https://www.researchgate.net/publication/42320353_Diversity_and_Distribution_of_Dragonfly_OdonataInsecta_in_the_Kerian_River_Basin_Kedah-Malaysia (accessed on 19 November 2021).
- Ansari, E.; Akhtar, M.N.; Bakar, E.A.; Uchiyama, N.; Kamaruddin, N.M.; Umar, S.N.H. Investigation of Geomorphological Features of Kerian River Using Satellite Images BT—Intelligent Manufacturing and Mechatronics; Bahari, M.S., Harun, A., Zainal Abidin, Z., Hamidon, R., Zakaria, S., Eds.; Springer: Singapore, 2021; pp. 91–101. [Google Scholar]
- National Water Quality Standards for Malaysia. Available online: https://environment.com.my/wp-content/uploads/2016/05/River.pdf (accessed on 21 November 2021).
Publisher’s Note: MDPI stays neutral with regard to jurisdictional claims in published maps and institutional affiliations. |
© 2022 by the authors. Licensee MDPI, Basel, Switzerland. This article is an open access article distributed under the terms and conditions of the Creative Commons Attribution (CC BY) license (https://creativecommons.org/licenses/by/4.0/).