Abstract
This paper investigates the impact of doubly-fed induction generator (DFIG) wind farms on system stability in multi-generator power systems with low-frequency oscillations (LFOs). To this end, this paper establishes the interconnection model of the equivalent generators and derives the system state equation. On this basis, an updated system state equation of the new power system with integrated wind power is further derived. Then, according to the updated system state equation, the impact factors that cause changes in the system damping characteristics are presented. The IEEE two-area four-machine power system is used as a simulation model in which the LFOs occur. The simulation results demonstrate that the connection of wind power to the power feeding area (PFA) increases the damping ratio of the dominant mode of inter-area oscillation from −0.0263 to −0.0107, which obviously improves the system stability. Furthermore, the wind power integration into PFA, as the connection distance of the wind power increases, gradually decreases the damping ratio of the dominant mode of the inter-area oscillation to −0.0236, approaching that of no wind power in the system. Meanwhile, with the increase in the wind power output capacity, the damping ratio of the dominant mode of the intra-area and inter-area oscillation increases, and the maximum damping ratios reach 0.1337 and 0.0233, respectively.
1. Introduction
The expansion of the integration of clean and efficient renewable energy sources such as wind and solar energy has exacerbated the gradual expansion of the modern power grid interconnection and caused an unprecedented complexity of the energy system [1,2,3]. Hence, the security and stability of the power system should be taken seriously [4]. A typical hazard in a power system is the interaction among generators or regional power grids, which results in the damping characteristic changes of the power systems and thus may produce low-frequency oscillations (LFOs) [5]. The synchronous generator angles start oscillating with each other in low frequencies of 0.1–2.5 Hz following grid disturbances. These oscillations are usually poorly damped and can lead to system collapse [6]. A famous example of a grid failure is the blackout that occurred at Western Systems Council Coordinated (WSCC) in August 1996 [7]. A series of system failures occurred in eastern North America, which eventually led to system instability and resulted in the blackout disaster on August 14, 2003 [8]. There was a major grid disturbance in the northern region at 02:33 on 30 July 2012. The northern regional grid load was about 36,000 MW at the time of the disturbance. Subsequently, there was another grid disturbance at 13:00 on 31 July 2012, resulting in the collapse of the northern, eastern, and north-eastern regional grids. A total load of about 48,000 MW was affected in this blackout [9]. The power oscillations at different stages and degrees were observed during these big blackouts. LFO seriously affects the power transmission capacity and threatens the stable operation of the power grid and even causes power failure accidents due to grid instability [10].
Due to the increase in power demand and to reduce global warming, the power grid is moving more and more to renewable energy integration, in which wind power is the most important renewable source of energy all over the world. The impact of integrated wind power on the power system stability is also a long-term problem which in turn arouses the interest of many researchers around the world [11]. The authors in [12] proposed the stability problems of the power systems early, including large-scale wind power in which the impact of intra-area and inter-area oscillations is studied under the condition of wind power integrated into the power systems. It is found that the damping effect of the constant speed wind turbine (WT) on the power systems is more effective than that of the variable speed WT because of the effects of the induction generator. In [13], the authors have analyzed the power system oscillation modes of the two-area four-machine system with small disturbance and studied the changes of the oscillation modes under the situation of a wind farm replacing a synchronous generator in the system. Aiming at the integration of the wind power into Norwegian power grids, E. Hagstrøm et al. [14] studied the impact of the integrated wind power on the interval oscillation damping of northern European power grids and tested the impact of different types of generators on the inter-area oscillation damping of Norway and Sweden. In [15], the generic dynamic model of WT with a doubly-fed induction generator (DFIG) is presented, and the small-signal stability mathematical model is derived. G. Tsourakis et al. [16] studied the response modes of DFIG in wind power plants and their impact on the electromechanical oscillation of interconnected power systems. L. Yang et al. [17] carried out a mathematical model for DFIG. Through eigenvalue sensitivity analysis, the most sensitive parameters of the Hopf bifurcation of DFIG power generation system can be determined. Thus, the Hopf bifurcation boundaries of the key parameters are analyzed to facilitate the parameterization of DFIG WT system and ensure system stability. H. Li et al. [18] proposed a fuzzy control strategy to suppress the LFOs of the power system after the doubly-fed induction generators (DFIGs) are integrated into the power grid. M. Singh et al. [19] studied the potential damping interval oscillation mode of the wind farm. The result shows that the intra-area oscillation mode is a phenomenon of oscillation in a single or a group of generators with another set of generators on a weak transmission link. R. Effatnejad et al. [20] studied the LFO suppression strategy of power systems in the case of the integrated wind power. The angular velocity difference signal of the two generators is used as the input signal of the damping controller. The conventional damping controller is replaced by the fuzzy controller, and the controller parameters are optimized by the intelligent optimization algorithm. In [21], a method was proposed for the separate examination of the two impact factors, the change of load flow and dynamic interaction brought about by the DFIG on the electromechanical oscillation modes of the power systems. J. G. Slootweg and W. L. Kling [22] established a 7-order WT mathematical model for doubly-fed wind turbines and revealed the impact of shafting and the wind speed on the system’s forced LFOs in the condition of the wind power integrated into the power systems through the small-signal linear analysis method. In order to solve the dynamic stability problem of the large wind farms, X. Zhang et al. [23] proposed a power grid operation method based on variable inertia control. A variable inertia control strategy for WT was proposed to improve the damping and frequency stability of power oscillation between the areas. In [24], a line modal potential energy (LMPE) method was proposed for the inter-area oscillation analysis and damping control of DFIGs. The study attempts to design the damping control loop using the LMPE approach from the network viewpoint. L. Simon et al. [25] described an optimization enabled wide-area damping control (WADC) for DFIG to mitigate both the intra-area and the inter-area oscillations. The main purpose in [26] was to improve the synchrony generator’s transient and dynamic performance using local DFIGs. The impact of wind power integrated into the existing power system is multi-dimensional. There are still many uncertain results that cannot be ignored in the coordinated development of wind power and the large power grid to maintain system stability in the future power grid. Based on the above investigation and explanations, the main contributions of this research are summarized as follows:
- The two-area interconnection system and its mathematical model are established and analyzed, and the system state equation is deduced before and after the wind power integration.
- Three impact factors of the integrated wind power on the LFOs of the power system are proposed and the eigenvalues of the intra-area and inter-area oscillation of the power system are identified by the total least squares-estimation of signal parameters via rotational invariance techniques (TLS-ESPRIT) algorithm.
- By comparing the changes of the damping characteristics of the system before and after wind power integration, the impact on the LFOs of the system is obtained, which provides a reference for the design of the wind power plants, as well as the stability of the power system with small disturbance.
The remaining sections of this paper are organized as follows: Section 2 establishes the model of the two-area interconnection power system and derives the system state equation. The damping characteristics of the system integrated with the wind power consisting of the DFIGs are analyzed. The impact factors of wind power connection on the LFOs are mainly related to the area option of the integrated wind power, including a power feeding area (PFA) or a power receiving area (PRA), the connection distance, and the output capacity of the integrated wind power. Section 3 shows the example simulation and result analysis based on the simulation of the IEEE two-area four-machine power system. Firstly, the eigenvalues of the intra-area and inter-area oscillation modes of the system are calculated. Secondly, considering the variation of each impact factor, the changes in the damping characteristics of the simulation model are reflected by the eigenvalues of the modes of the intra-area and inter-area oscillation. Finally, through the quantitative analysis of the modal eigenvalues and the changes of the damping ratios, the effect of the different impact factors of the integrated wind power on the LFOs of the power system is obtained and discussed. Section 4 addresses the conclusion of the paper.
2. Analysis of Damping Characteristics
The LFOs of large-scale power systems usually include intra-area and inter-area oscillation. The intra-area oscillation is mainly the relative sway between different generators in the area. The inter-area oscillation is the relative swing between multiple generator groups in one area and multiple generator groups in other areas. According to the equivalent principle of the center of inertia (COI) [27], multiple generator groups in the area are taken to be COI equivalent, which can simplify the damping analysis of the system. Hence, the interconnection between two groups of generators can be studied by using a simplified system consisting of two equivalent generators.
2.1. Analysis of Damping Characteristics of the Two-Area Interconnection Power Systems
The equivalent model of the two-area interconnection system is shown in Figure 1. The inter-area oscillation is equivalent to the oscillation between the synchronous generators Geq1 and Geq2. Taking the active power transmitted from area A1 to area A2 as an example, it can be said that area A1 is PFA, while area A2 is PRA. Then, the equivalent rotor angular velocity increment of Geq1 and Geq2 will show the same frequency reverse characteristic, as well as the equivalent power angle increment.
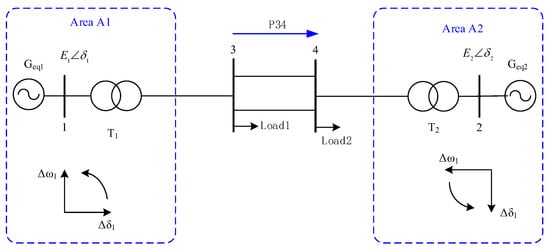
Figure 1.
Equivalent model of the two-area interconnection system.
The classical second-order equations are adopted as the rotor motion mathematical model of Geq1 and Geq2. The mechanical power of the prime movers is constant, and the excitation system dynamics are ignored while the load is treated as constant impedance. The rotor motion equation of the COI equivalent synchronous generator is represented as follows:
Using the Heffron–Phillips model, rewriting (1) in the matrix form, it is represented as follows:
According to the system’s circuit analysis, based on the superposition theorem of the model shown in Figure 1, the output electromagnetic power and are calculated as represented in (3).
where
At a certain operating point, the rotor angle difference of Geq1 and Geq2 has the relation . According to (3), the synchronous torque coefficients can be calculated as follows:
The state matrix can be extracted from (2), and its characteristic equation is represented by:
Through matrix transformation and the Schur theorem, Equation (5) can be transformed into a fourth-degree equation with one variable with respect to , as represented in (6).
Idealizing the damping moment coefficient and the same inertia time constant of the equivalent generator results in , or . Therefore, (6) can be simplified as follows:
The eigenvalues are obtained by solving the equation as follows:
In general, , , , are greater than zero in normal operation. According to the Routh system stability criterion, Equation (8) shows that the real parts of the three non-zero eigenvalues are all negative, and the conjugate eigenvalues and represent the electromechanical oscillation modes of the interconnected system. If the system is abnormal, such as or , that is or , the real part of eigenvalue will be located on the imaginary axis or the right half-space of the complex plane. The corresponding consequences are that the system damping is zero or negative, which results in continuous or growth oscillation of the power systems. If it is not intervened in, the power systems under the conditions of instability will be out-of-step, splitting finally.
2.2. Analysis of Damping Characteristics of the Two-Area Interconnection Power Systems Integrated with Wind Power
The wind farm marked by ellipse dotted lines in Figure 2 is incorporated into the two-area interconnection system. The wind farm can be represented by a single machine of a large-capacity DFIG [25]. The schematic diagram of a DFIG integrating the power grid is shown in Figure 3.
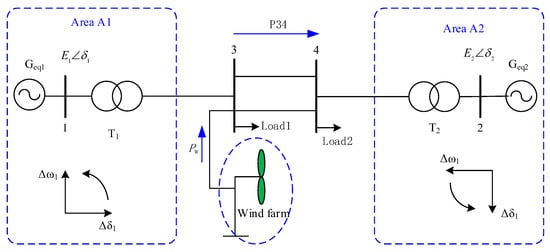
Figure 2.
Two-area interconnection system integrated with wind farm.
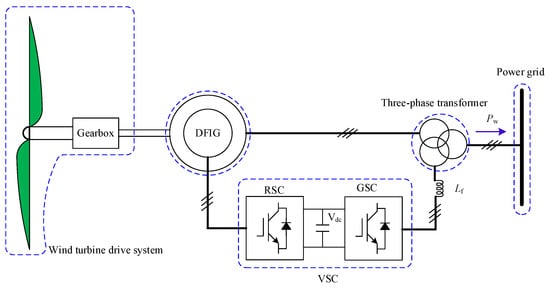
Figure 3.
Schematic diagram of DFIG integrated into power grid.
Neglecting the system line loss, the electromagnetic power increments and of Geq1 and Geq2 mentioned in (1) are rewritten as (9).
Labeling , Equation (9) can be simplified as follows:
As the system structure is stable and the load remains unchanged, the active power of the PFA and PRA is increased or decreased by the same amount. Hence, the active power increment of the interconnected two-area systems in Figure 2 remains in the balance after the integration of the wind farm to the grid, and the mathematical relationship is represented as follows:
is not a state variable. When LFOs occur in the system, the changing trend of the power increment at any node is consistent with that of the frequency increment at the same point of the system. The power and frequency for any point have the same oscillation mode. Therefore, it can be considered that their increments have a proportional relationship, which can be simplified as follows:
Similarly, there is a linear relationship between the frequency increment of the system and the rotor angular velocity of the system generator. In the case that the regional structure is not completely symmetrical, the proportional relation can be represented as follows:
The linear relationships between (12) and (13) with regard to the state variables and are represented in (14).
Uniting (10)–(14), the state variables can represent and . Combining with rotor motion (1) derived from the above second-order classical model, the wind farm is incorporated into the PFA corresponding to area A1, and the state equation is represented in (15). When the wind power is incorporated into the PRA corresponding to area A2, the state equation is represented in (16).
The impact of integrated wind power on the power system damping is mainly investigated through the quantitative changes of the system damping characteristics. Before and after the integration, the change of damping characteristics can be discussed according to (2), (15), and (16).
Keeping the system structure unchanged, the damping sum of all the modes of the system is constant and equals the sum of all the characteristic roots of the system [28]. Furthermore, the sum of diagonal elements in (2) is always equal. When wind power is incorporated into the PFA, it can be seen from (15) that the damping sum of the system is . The damping increment is , which is the relation of , , . , , and are a relation of , , , , and , which are fixed. However, , , , and may result in changes of , , and , which cause the change of . When the wind power is incorporated into the PRA, it can be observed from (16) that the damping sum of the system is . The damping increment is , in which there is . Similarly, , , , and result in the changes of , , and , which cause the change of .
Based on the mathematical derivation and analysis above, the system damping increment may be positive or negative in the impact of the integrated wind power on the power systems. The effect depends on the various parameters of the integrated wind power, such as how far it is connected to the grid, how large-scale the capacity is, and in which area the integrated location is, PFA or PRA. The wind power impact is related to the actual changes of system damping, according to the practical structure of the power systems containing the wind farm.
3. Simulation Example and Result Analysis
3.1. The Impact of the Different Areas of Wind Power on the System LFOs
In this paper, the wind farm is connected to the double loop line of the IEEE two-area four-machine power systems [27]. Before the connection of the wind farm, area A1 is mainly composed of generators G1 and G2, and area A2 is mainly composed of generators G3 and G4. Area A1 is set to transmit 413 MW of active power to area A2 through the tie line. Hence, area A1 is the PFA, and area A2 is the PRA. According to the literature [25], the wind farm consisting of DFIGs can be simulated by an equivalent DFIG denoted with Gw, which is connected to node 7 in the PFA and node 9 in the PRA, as shown in Figure 4 and Figure 5, respectively. The green ellipse dotted line frame in Figure 4 and Figure 5 is the integrated wind farm. The wind farm is equivalent, practically, to the WT of 25 DFIGs, which has the capacity of 2 MW for each one. Hence, the capacity of GW equals 50 MW.
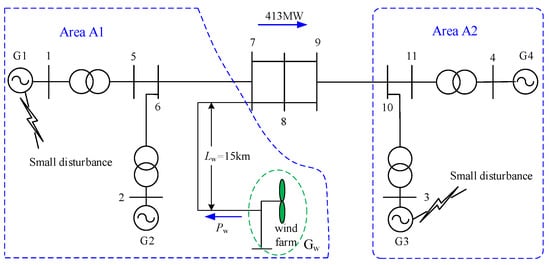
Figure 4.
The wind power integrated into the PFA.
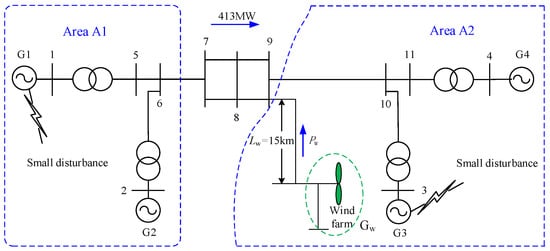
Figure 5.
The wind power integrated into the PRA.
Before the DFIG reaches a stable operating state, it needs a period of 10–15 s from the start to the stable state. Therefore, the small disturbance is set at t = 20 s after the DFIG starts. The square wave pulse signals, with 5% of the stable transmission voltage, which is set as the small disturbance with a duration of 0.1 s, are added to G1 and G3 at the same time. Under the perturbation excitation, the intra-area oscillation of the rotor angular velocity of the synchronous generator and the inter-area oscillation of the active power of the tie line between node 7 and node 9 are observed.
In the paper, three operating conditions are studied under the condition of the no-power system stabilizer (PSS) in the system. First, the IEEE two-area four-machine power systems suffer small disturbances without integrated wind power. Second, the power system suffers small disturbance with the wind power integrated into the PFA, as shown in Figure 4. Third, the power system suffers small disturbance with the wind power integrated into the PRA, as shown in Figure 5. According to the data of the oscillation modes in Table 1, Table 2 and Table 3, the mode distributions of the intra-area oscillation in G1–G4 are drawn out in Figure 6a–d and that of the intra-area oscillation in the tie line are illustrated in Figure 6e in three operating conditions. The variables and denote the real part and imaginary part of the eigenvalue, respectively. The eigenvalues of the oscillation modes are identified by the TLS-ESPRIT algorithm [29] in the paper. The variable is the damping ratio of the corresponding mode, which is equal to . The intra-area oscillation modes are characterized with the oscillation mode parameters of the rotor angular velocity of the four generators (G1–G4). The inter-area oscillation modes are characterized with the oscillation mode parameters of the active power in the tie line [30]. The conjugate eigenvalues are symmetrically distributed about the real axis in the complex plane; so, the imaginary part is not depicted in Figure 6.

Table 1.
Oscillation modes of the system without wind power.
Table 2.
Oscillation modes of the system with wind power integrated into PFA.
Table 3.
Oscillation modes of the system with wind power integrated into PRA.
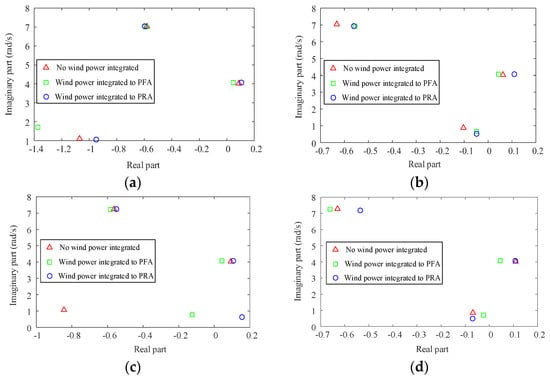
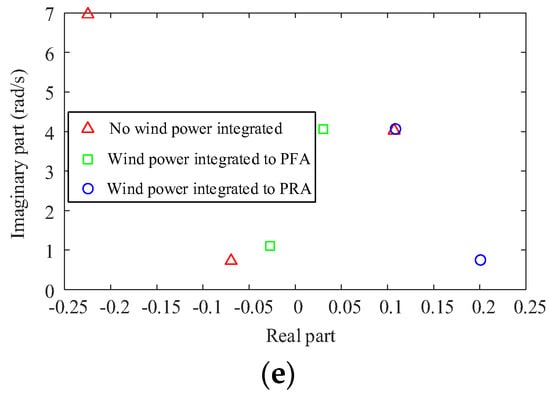
Figure 6.
The modes distributions of intra-area oscillation and inter-area oscillation. (a) G1; (b) G2; (c) G3; (d) G4; and (e) tie line.
The following are the discussions on Figure 6:
(1) The green squares corresponding to the eigenvalues of each mode under the three conditions are mainly located on the left of the red angle. The eigenvalues on the corresponding complex plane generally shift to the left under the condition of wind power integrated into the PFA, compared with no wind power in the system. The damping characteristics are improved and the LFOs are suppressed.
(2) The blue circles corresponding to the eigenvalues of each mode in the three operating conditions are mainly located on the right of the red angle. The eigenvalues on the corresponding complex plane generally shift to the right when the wind power is integrated into the PRA, compared with the condition of no wind power in the system. When the wind power is integrated into the PRA, the damping characteristics become worse and the LFOs are aggravated slightly.
(3) The wind power integration has an impact on the dominant mode of the rotor angular velocity oscillation of the four generators G1~G4. The variation range of the eigenvalues is small, and the impact is not significant. However, the intra-area oscillation of the active power of the tie line is obviously suppressed, which can be observed from the existence of the red angle but no blue circle or green square nearby in Figure 6e. In addition, the corresponding eigenvalue of the blue circle in the lower right corner of Figure 6e indicates that wind power integrated into the PRA increases the oscillation modes and weakens the damping characteristics of the system.
Figure 7 represents the fact that the damping ratio of Mode#1 of the dominant mode of the intra-area oscillation fluctuates in the range of 0.07 to 0.09, which shows that the wind power has a slight impact. However, with the wind power integration into the PFA, the damping ratio of the dominant mode of the inter-area oscillation changes from −0.0266 to −0.0107, which in turn improves the damping characteristics of the system. In contrast, the damping ratio of the wind power integration into PRA is −0.0269, which is a slight decrease. The minimum damping ratio of the intra-area oscillation is reduced to −0.2483, corresponding to Mode#3 on G3, and that of the inter-area oscillation in Mode#2 is reduced to −0.2642.
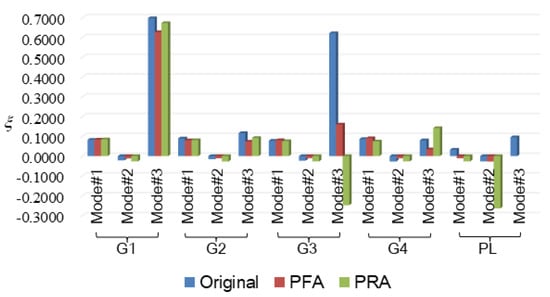
Figure 7.
Changes of damping ratio before and after wind power integration.
3.2. The Impact of Connection Distance of the Wind Power on the System LFOs
The schematic diagram of a single line of the IEEE two-area four-machine power systems, including the integrated wind power whose connection distance can be adjusted, is shown in Figure 8. Area A1 consists of the generators G1 and G2 and the wind farm. The capacity of the wind farm is set at 50 MW, which is equivalently provided by 25 DFIGs of 2 MW in the simulation. The thick red line marked with represents the connection distance of the wind power and is used as an adjustable object. The area A2 mainly consists of G3 and G4. As area A1 is set to transmit 413 MW of active power to area A2 through the tie line, A1 and A2 represent the PFA and the PRA, respectively. The small disturbance, including the disturbance amplitude and the disturbance period, is set the same as Section 3.1. is set as 10 km, 50 km, 100 km, 200 km, and 300 km, respectively. With the different connection distances of the integrated wind power, the oscillation modes of the rotor angular velocity of G1–G4 and the active power of the tie line are tested and recorded in Table 4, Table 5, Table 6, Table 7 and Table 8.
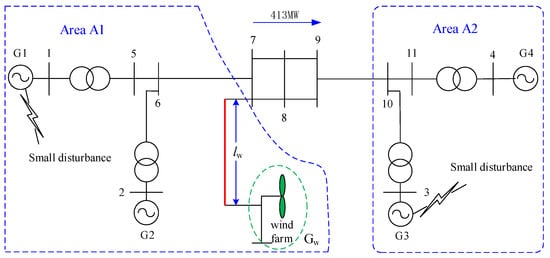
Figure 8.
Schematic diagram of adjustable connection distance of integrated wind power.
Table 4.
= 10 km.
Table 5.
= 50 km.
Table 6.
= 100 km.
Table 7.
= 200 km.
Table 8.
= 300 km.
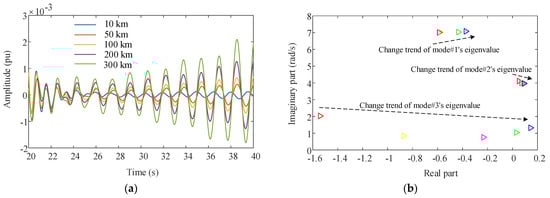
Figure 9.
Rotor angular velocity oscillation of G1: (a) Oscillation output; (b) eigenvalues distribution.
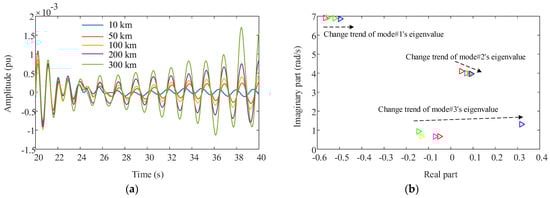
Figure 10.
Rotor angular velocity oscillation of G2: (a) Oscillation output; (b) eigenvalues distribution.
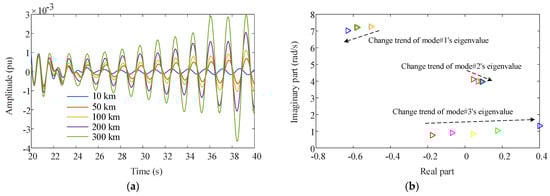
Figure 11.
Rotor angular velocity oscillation of G3: (a) Oscillation output; (b) eigenvalues distribution.
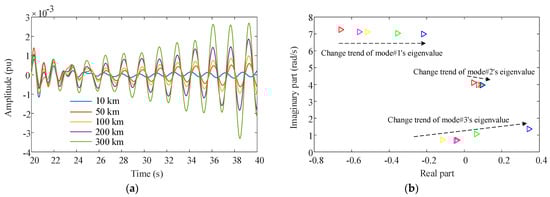
Figure 12.
Rotor angular velocity oscillation of G4: (a) Oscillation output; (b) eigenvalues distribution.
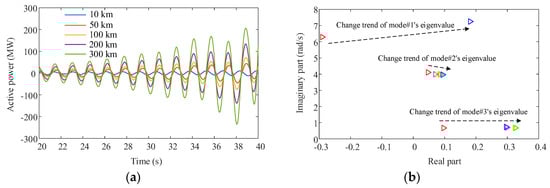
Figure 13.
Active power oscillation of the tie line: (a) Oscillation output; (b) eigenvalues distribution.
According to Figure 9a, Figure 10a, Figure 11a, Figure 12a and Figure 13a, as the connection distance of the wind power increases from 10 km to 300 km; the vibration amplitudes of both intra-area and inter-area oscillations present an increasing trend. In the period of 20 s after the small disturbance occurs, the overall damping ratio of the system decreases. Therefore, the LFO problem worsens, and the system stability weakens.
Figure 9b, Figure 10b, Figure 11b, and Figure 12b describe the eigenvalue distributions of the oscillation modes of the rotor angular velocity of G1–G4 related to the different connection distances of the wind power. Figure 13b describes the eigenvalue distributions of the active power oscillation modes of the tie line with the connection distance changes. It is illustrated that the eigenvalues of each mode generally move to the right in the complex plane with the connection distance increased, which makes the overall system stability worse. Although mode#1′s eigenvalue of G3 moves to the left in the complex plane, the weak and negative damping characteristics of the other two dominant modes determine the increasing amplitude of the intra-area LFOs. On the other hand, it is shown that the inter-area LFOs increase significantly with the connection distance increased in Figure 13.
In addition, it can be seen from Figure 14 that the damping ratio of the dominant mode of the intra-area oscillation is little changed with the increase in distance. With the change of distance from 10 km to 300 km, the damping ratios of the active power of the tie line are −0.0114, −0.0174, −0.0194, −0.0215, and −0.0236, successively, showing an obvious decrease. The damping characteristic of the inter-area oscillation obviously deteriorates, and the system stability becomes worse.
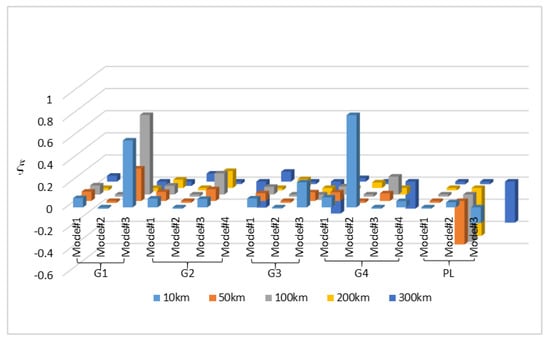
Figure 14.
Changes of damping ratio for a different connection distance.
3.3. The Impact of the Capacity of the Wind Power on the System LFOs
The wind farm with adjusted capacity is integrated into the IEEE two-area four-machine power systems, as shown in Figure 15. The wind farm is equivalent to a DFIG whose capacity can be set at a different value. The equivalent DFIG is connected to bus node 7 in area A1 of the power systems. The connection distance is fixed at 15 km, which benefits the wind power transmission. In order to study the impact of the capacity of the integrated wind power on the LFOs of the power systems, the capacity of the wind power is set at different values. The wind power output is adjusted by the number of DFIGs of 2 MW, and the other parameters of the system were the same as those in Figure 6 in Section 3.2.
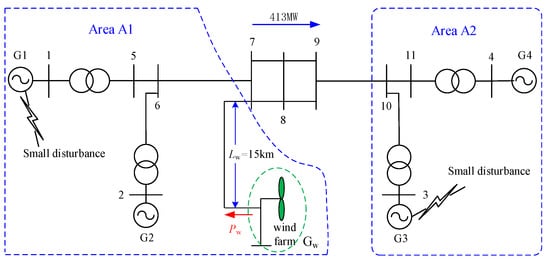
Figure 15.
Schematic diagram of the adjustable capacity of integrated wind power.
The capacity of the integrated wind power is set as 10 MW, 50 MW, 100 MW, 300 MW, and 500 MW, respectively. The impact of different capacities on the oscillation modes of the intra-area and inter-area LFOs is tested. The oscillation modes of the rotor angular velocity of G1–G4 and the active power of the tie line are tested and shown in Table 9, Table 10, Table 11, Table 12 and Table 13. Figure 16a, Figure 17a, Figure 18a, Figure 19a and Figure 20a show that the amplitude of both the intra-area oscillations and the inter-area oscillations presents a decreasing trend with the capacity of the wind power increased from 10 MW to 500 MW. Figure 16b, Figure 17b, Figure 18b, Figure 19b and Figure 20b describe the eigenvalues of the oscillation modes of the rotor angular velocity of G1–G4 and the active power of the tie line with the changes of the capacity of the integrated wind power.
Table 9.
= 10 MW.
Table 10.
= 50 MW.
Table 11.
= 100 MW.
Table 12.
= 300 MW.
Table 13.
= 500 MW.
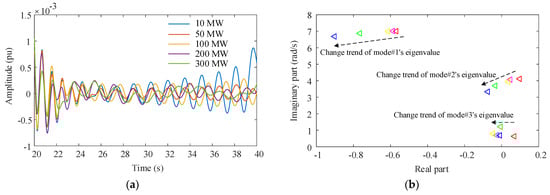
Figure 16.
Rotor angular velocity oscillation of G1: (a) Oscillation output; (b) eigenvalues distribution.
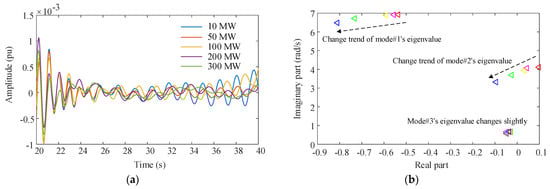
Figure 17.
Rotor angular velocity oscillation of G2: (a) Oscillation output; (b) eigenvalues distribution.
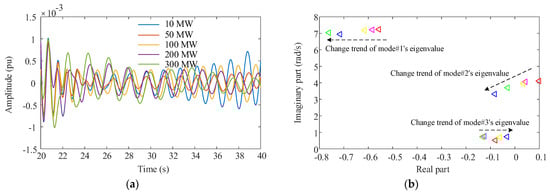
Figure 18.
Rotor angular velocity oscillation of G3: (a) Oscillation output; (b) eigenvalues distribution.
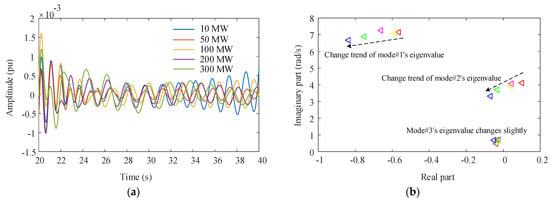
Figure 19.
Rotor angular velocity oscillation of G4: (a) Oscillation output; (b) eigenvalues distribution.
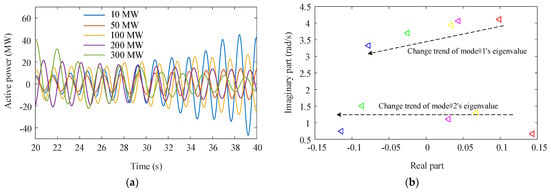
Figure 20.
Active power oscillation of the tie line: (a) Oscillation output; (b) eigenvalues distribution.
According to Figure 16a, Figure 17a, Figure 18a, Figure 19a and Figure 20a, in the period of 20 s after the small disturbance occurs, the overall damping ratio of the system increases. Therefore, the LFOs have been alleviated, and the power system stability is enhanced. In addition, from the point of view of the eigenvalue change shown in Figure 16b, Figure 17b, Figure 18b, Figure 19b and Figure 20b, the eigenvalue of each mode generally moves to the left in the complex plane. It means that the system’s stability is enhanced. The imaginary part of the modal eigenvalues shows a downward trend as a whole. Therefore, the dominant mode frequency of the local oscillation and the interval oscillation decreases with the increase in the wind power output. It is worthy of attention that the damping of the dominant modes of the active power of the tie line increases significantly with the increase in the wind power output capacity. The larger capacity of the integrated wind power suppresses the LFOs better; the damping characteristics of the system are improved, and the system stability is obviously enhanced.
As shown in Figure 21, the damping ratio of the dominant mode of the intra-area oscillation (Mode#1) shows an increasing trend, and the damping ratio of the dominant mode of the regional oscillation also shows an increasing trend. The maximum damping ratio will reach 0.1337 and 0.0233, respectively, and the stability of the system will be improved.
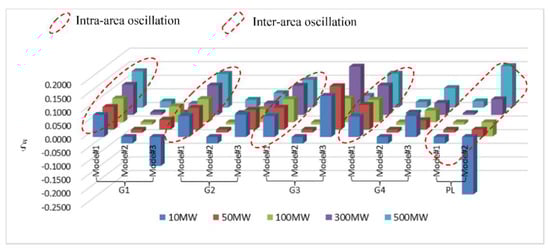
Figure 21.
Changes of damping ratio for different output capacities.
4. Conclusions
This paper conducts a detailed theoretical derivation and analysis of the damping characteristics of the two-area interconnected power system. The mathematical relations are used to analyze the changes in the damping characteristics caused by wind power integration into the two-area interconnected system. The LFO model of the IEEE two-area four-machine power system is selected as an example to analyze the impact of wind power integration on the damping characteristics of the power system. The results are summarized as follows:
(1) The wind power consisted of DFIGs which are integrated into the PFA to suppress the system‘s LFOs. In contrast, the integration to the PRA increases the LFOs slightly.
(2) With the increase in the connection distance of the wind power, the amplitudes of both the intra-area and the inter-area oscillations tend to increase. The system’s LFOs increase, and its stability weakens.
(3) As the capacity of the integrated wind power increases, the amplitudes of the intra-area and inter-area oscillations tend to decrease, and the damping ratio of the system increases as a whole. The stability of the system is enhanced, and the LFO problem is alleviated to some extent.
As is known from the analysis of the above results, wind power integration not only changes the structure of the power systems, but also alters the damping characteristics of the large-scale interconnected systems. Not only should the design and construction of the wind farms be optimized, but the appropriate grid parameters should also be constructed to improve the stability of the power system.
Author Contributions
Conceptualization, J.C., T.J., M.A.M., A.A. and U.D.; methodology, J.C., T.J. and M.A.M.; software, J.C., T.J. and M.A.M.; validation, J.C., T.J., M.A.M., A.A. and U.D.; formal analysis, J.C., T.J. and M.A.M.; investigation, J.C., T.J., M.A.M., A.A. and U.D.; methodology, J.C., T.J. and M.A.M.; resources, J.C., T.J. and M.A.M.; data curation, J.C., T.J., M.A.M., A.A. and U.D.; writing—original draft preparation, J.C., T.J. and M.A.M.;writing—review and editing, J.C., T.J., M.A.M., A.A. and U.D.; visualization, J.C., T.J. and M.A.M.d; supervision, T.J. and M.A.M.; project administration, A.A. and U.D.; funding acquisition, A.A. and U.D.; All authors have read and agreed to the published version of the manuscript.
Funding
This research received no external funding.
Institutional Review Board Statement
Not applicable.
Informed Consent Statement
Not applicable.
Data Availability Statement
The data supporting the reported results are available in the manuscript.
Acknowledgments
The authors would like to thank the Estonian Centre of Excellence in Zero Energy and Resource Efficient Smart Buildings and Districts, ZEBE, grant TK146, funded by the European Regional Development Fund to support this research. Furthermore, this work was supported by the scientific research project of Fuzhou Polytechnic under Grant FZYKJRCQD202101.
Conflicts of Interest
The authors declare no conflict of interest.
Nomenclature
| Subscripts, Superscripts, and Sets | |
| Geq1, Geq2 | Equivalent synchrony generator. |
| j, k | Serial number of the equivalent synchrony generator. |
| Mark of . | |
| G1, G2, G3, G4 | Synchrony generators of the IEEE two-area four-machine power systems. |
| Mode#1, Mode#2, Mode#3, Mode#4 | Oscillation modes of the rotor angular velocity of the synchrony generators G1–G4 and the active power oscillation modes of the tie line from node 7 to node 9 in the IEEE two-area four-machine power systems. |
| Variables and Constants | |
| Power angle increment of the jth synchrony generator. | |
| Rotor angular velocity increment of the jth synchrony generator. | |
| Inertia time constant of the synchrony generator j. | |
| Electromagnetic power increment of the synchrony generator j. | |
| Damping torque coefficient of the synchrony generator j. | |
| Synchronous torque coefficient between the synchrony generator j and k, . | |
| State matrix of the interconnected systems with two equivalent synchrony generators. | |
| , | No-load electromotive force of the synchrony generator Geq1 and Geq2. |
| Stable voltage on the integrated node of the wind power, which is assumed to be constant. | |
| , | System impedance of Geq1 and Geq2 acting as source, respectively. |
| , | Transfer impedance between Geq1 and Geq2. |
| , , , | Impedance angle of , , , , respectively. |
| , , , | Impedance complementary angle of , , , , respectively. |
| , | Rotor angle of Geq1 and Geq2, respectively. |
| , | Rotor angle difference between Geq1 and Geq2, . |
| , | Rotor angle difference between Geq1 and Geq2 at some operating point, . |
| Power angle of the wind farm as an equivalent DFIG. | |
| Power angle increment of the wind farm as an equivalent DFIG. | |
| , | Reactance between Geq1 and the integrated node of wind farm. Reactance between Geq2 and the integrated node of wind farm. |
| The eigenvalue of the equation . | |
| Identity matrix. | |
| Increment of active power provided by the wind farm. | |
| Frequency increment of the integrated node of the wind farm. | |
| System characteristic coefficient of the active power increment of the wind farm with respect to , that is, . | |
| Proportional coefficient between and . | |
| Proportional coefficient between and . | |
| , | , . |
| , | , . |
| Real part of a mode eigenvalue or damping factor. | |
| Imaginary part of a mode eigenvalue or oscillation angle frequency. | |
| Damping ratio, . | |
References
- Tan, H.; Yan, W.; Ren, Z.; Wang, Q.; Mohamed, M.A. A robust dispatch model for integrated electricity and heat networks considering price-based integrated demand response. Energy 2022, 239, 121875. [Google Scholar]
- Chen, J.; Alnowibet, K.; Annuk, A.; Mohamed, M.A. An effective distributed approach based machine learning for energy negotiation in networked microgrids. Energy Strategy Rev. 2021, 38, 100760. [Google Scholar]
- Alnowibet, K.; Annuk, A.; Dampage, U.; Mohamed, M.A. Effective Energy Management via False Data Detection Scheme for the Interconnected Smart Energy Hub–Microgrid System under Stochastic Framework. Sustainability 2021, 13, 11836. [Google Scholar]
- Mohamed, M.A.; Mirjalili, S.; Dampage, U.; Salmen, S.H.; Obaid, S.A.; Annuk, A. A cost-efficient-based cooperative allocation of mining devices and renewable resources enhancing blockchain architecture. Sustainability 2021, 13, 10382. [Google Scholar]
- Du, W.; Bi, J.; Wang, H.; Yi, J. Inter-area low-frequency power system oscillations caused by open-loop modal resonance. IET Gener. Transm. Distrib. 2018, 12, 4249–4259. [Google Scholar]
- Shen, C.; An, Z.; Dai, X.; Wei, W.; Ding, L. Measurement-based solution for low frequency oscillation analysis. J. Mod. Power Syst. Clean Energy 2016, 4, 406–413. [Google Scholar]
- Kosterev, D.N.; Taylor, C.W.; Mittelstadt, W.A. Model validation for the August 10, 1996 WSCC system outage. IEEE Trans. Power Syst. 1999, 14, 967–979. [Google Scholar]
- Fairley, P. The unruly power grid. IEEE Spectr. 2004, 41, 22–27. [Google Scholar]
- Report of the Enquiry Committeeon Grid Disturbance in Northern Region on 30th July 2012 India Northern, Eastern & North-Eastern Region on 31 July 2012. New Dehli, India, 2012. Available online: http://nrpc.gov.in/wp-content/uploads/2017/11/grid_disturbance_report.pdf (accessed on 13 February 2022).
- Chen, J.; Mohamed, M.A.; Dampage, U.; Rezaei, M.; Salmen, S.H.; Obaid, S.A.; Annuk, A. A multi-layer security scheme for mitigating smart grid vulnerability against faults and cyber-attacks. Appl. Sci. 2021, 11, 9972. [Google Scholar]
- Rezaei, M.; Alharbi, S.A.; Razmjoo, A.; Mohamed, M.A. Accurate location planning for a wind-powered hydrogen refueling station: Fuzzy VIKOR method. Int. J. Hydrogen Energy 2021, 46, 33360–33374. [Google Scholar]
- Slootweg, J.G.; Kling, W.L. The impact of large scale wind power generation on power system oscillations. Electr. Power Syst. Res. 2003, 67, 9–20. [Google Scholar]
- Sanchez-Gasca, J.J.; Miller, N.W.; Price, W.W. A modal analysis of a two-area system with significant wind power penetration. In Proceedings of the IEEE PES Power Systems Conference and Exposition, New York, NY, USA, 10–13 October 2004; Volume 2, pp. 1148–1152. [Google Scholar]
- Hagstrøm, E.; Norheim, I.; Uhlen, K. Large-scale wind power integration in Norway and impact on damping in the Nordic grid. Wind Energy 2005, 8, 375–384. [Google Scholar]
- Wu, F.; Zhang, X.P.; Godfrey, K.; Ju, P. Small signal stability analysis and optimal control of a wind turbine with doubly fed induction generator. IET Gener. Transm. Distrib. 2007, 1, 751–760. [Google Scholar]
- Tsourakis, G.; Nomikos, B.M.; Vournas, C.D. Effect of wind parks with doubly fed asynchronous generators on small-signal stability. Electr. Power Syst. Res. 2009, 79, 190–200. [Google Scholar]
- Yang, L.; Xu, Z.; Østergaard, J.; Dong, Z.Y.; Wong, K.P.; Ma, X. Oscillatory Stability and Eigenvalue Sensitivity Analysis of A DFIG Wind Turbine System. IEEE Trans. Energy Convers. 2011, 26, 328–339. [Google Scholar]
- Li, H.; Liu, S.; Ji, H.; Yang, D.; Yang, C.; Chen, H.; Zhao, B.; Hu, Y.; Chen, Z. Damping control strategies of inter-area low-frequency oscillation for DFIG-based wind farms integrated into a power system. Int. J. Electr. Power Energy Syst. 2014, 61, 279–287. [Google Scholar]
- Singh, M.; Allen, A.J.; Muljadi, E.; Gevorgian, V.; Zhang, Y.; Santoso, S. Interarea Oscillation Damping Controls for Wind Power Plants. IEEE Trans. Sustain. Energy 2015, 6, 967–975. [Google Scholar]
- Effatnejad, R.; Zare, A.; Choopani, K.; Effatnejad, M. DFIG-based damping controller design to damp low frequency oscillations in power plant industry. In Proceedings of the 2016 International Conference on Industrial Informatics and Computer Systems (CIICS), Sharjah, United Arab Emirates, 13–15 March 2016. [Google Scholar]
- Du, W.; Bi, J.; Cao, J.; Wang, H.F. A Method to Examine the Impact of Grid Connection of the DFIGs on Power System Electromechanical Oscillation Modes. IEEE Trans. Power Syst. 2016, 31, 3775–3784. [Google Scholar]
- Li, C.; Zhang, W.; Liu, R. Forced low frequency oscillation of wind-integrated power systems. In Proceedings of the 2016 IEEE Power & Energy Society Innovative Smart Grid Technologies Conference (ISGT), Minneapolis, MN, USA, 6–9 September 2016. [Google Scholar]
- Zhang, X.; Fu, Y.; Wang, S.; Wang, Y. Effects of two-area variable inertia on transient stabilisation in interconnected power system with DFIG-based wind turbines. IET Renew. Power Gener. 2017, 11, 696–706. [Google Scholar]
- Liu, C.; Cai, G.; Ge, W.; Yang, D.; Liu, C.; Sun, Z. Oscillation Analysis and Wide-Area Damping Control of DFIGs for Renewable Energy Power Systems Using Line Modal Potential Energy. IEEE Trans. Power Syst. 2018, 33, 3460–3471. [Google Scholar]
- Simon, L.; Swarup, K.S.; Ravishankar, J. Wide area oscillation damping controller for DFIG using WAMS with delay compensation. IET Renew. Power Gener. 2019, 13, 128–137. [Google Scholar]
- Eshkaftaki, A.A.; Rabiee, A.; Kargar, A.; Boroujeni, S.T. An Applicable Method to Improve Transient and Dynamic Performance of Power System Equipped With DFIG-Based Wind Turbines. IEEE Trans. Power Syst. 2020, 35, 2351–2361. [Google Scholar]
- Kundur, P. Power System Stability and Control; McGraw-Hill: New York, NY, USA, 1994. [Google Scholar]
- Zhao, S.; Chang, X.; He, R.; Ma, Y. Borrow damping phenomena and negative damping effect of PSS control. Proc. CSEE 2004, 24, 7–11. [Google Scholar]
- Chen, J.; Tao, J.; Mohamed, M.A.; Wang, M. An adaptive TLS-ESPRIT algorithm based on an S-G filter for analysis of low frequency oscillation in wide area measurement systems. IEEE Access 2019, 7, 47644–47654. [Google Scholar]
- Tan, H.; Ren, Z.; Yan, W.; Wang, Q.; Mohamed, M.A. A wind power accommodation capability assessment method for multi-energy microgrids. IEEE Trans. Sustain. Energy 2021, 12, 2482–2492. [Google Scholar]
Publisher’s Note: MDPI stays neutral with regard to jurisdictional claims in published maps and institutional affiliations. |
© 2022 by the authors. Licensee MDPI, Basel, Switzerland. This article is an open access article distributed under the terms and conditions of the Creative Commons Attribution (CC BY) license (https://creativecommons.org/licenses/by/4.0/).