Article

Come Out of a Hiding Place: How Are Cover Crops Allocated on Finnish Farms?

by
Pirjo Peltonen-Sainio
1,* and
Lauri Jauhiainen
2
1
Natural Resources Institute Finland (Luke), FI-00790 Helsinki, Finland
2
Natural Resources Institute Finland (Luke), FI-31600 Jokioinen, Finland
*
Author to whom correspondence should be addressed.
Sustainability 2022, 14(5), 3103; https://doi.org/10.3390/su14053103
Submission received: 15 February 2022 / Revised: 4 March 2022 / Accepted: 4 March 2022 / Published: 7 March 2022

Abstract

:
Cover crops (CCs) may provide many ecosystem services for crop production systems, and interest has increased in the cultivation of CCs among Finnish farmers. Piloting farmers applied for agricultural payments to support the cultivation of CCs (AP-CCs) in 2020. Novel data with a total of 34,515 field parcels with CCs from 5747 farms was used to assess how farmers allocated CCs depending on farm and parcel characteristics. Pioneering farmers often had conventional, large farms with cereal areas exceeding 25%, and expertise with special crop(s). Conventional farmers seemed to allocate CCs to large parcels. The allocation of CCs was not solely dictated by cash crops. Cover crops were planted more frequently in parcels close to waterways. Conventional farmers allocated CCs to parcels with a history of highly monotonous cereal sequencing. Hence, farmers seem to benefit from ecosystem services provided by CCs: increasing spatial diversity, reducing the environmental footprint, and improving soil health. This novel understanding is used to support the implementation of CCs beyond pilot farms and to develop a decision support system for their allocation. The ultimate goal is to support a transition towards more sustainable crop production systems with currently underutilized CCs in high-latitude conditions.

1. Introduction

Farmers allocate cash crops to field parcels by acknowledging crop features, parcel characteristics, management requirements, and logistics [1]. In Finland, field parcel characteristics vary a lot within a farm and between farms [1]. To support farmers in rational land use and to help with land use changes, free-of-charge decision-support systems have been developed to support the allocation of field parcels according to their characteristics and productivity as either sustainably intensified parcels for food production, extensified parcels for greening purposes, or for afforestation to mitigate climate change [2]. Another, interactive tool is also available which supports farmers to diversify cereal-dominated crop rotations [3]. So far, diverse choices of cover crops (CCs) with many usages, such as under-sown CCs, over-wintering CCs, catch crops, and break-CCs, are not included in any of the decision support tools offered for Finnish farmers. Examples of CC-related toolboxes are available [4,5]. However, success with CCs is highly condition dependent, and thereby, it calls for an understanding of how the benefits provided by CCs can be attained in each region [6]. Decision support systems need to acknowledge special local features of the farming systems—and high-latitude conditions bring with plenty of specialties for agricultural production, e.g., concerning crop choices, crop growth dynamics, production risks [7,8,9,10] and risks to environment [11].
This study provides essential background information which can be used for the future development of tools for farmers to support the transition towards the cultivation of CCs, which may bring numerous so far largely unexploited benefits to the northern, cereal-dominated crop production systems [12,13,14,15,16]. In a recent study, CCs were shown to have substantial potential on Finnish farms because only 14% of the area considered to be suitable for CCs is currently being used [17]. Finnish farmers have shown increased interest in the cultivation of CCs [11], but they still have uncertainties because they are not yet experienced in cultivation techniques and are not familiar with all the potential CC species. An agricultural payment to support the cultivation of CCs (AP-CCs) has been recently launched in Finland. Register of farmers who applied for AP-CCs provided the first opportunity to contact and gather pioneering farmers’ modus operandi and experiences with CCs. This national data (register) covered a total of 34,515 field parcels on 5747 farms. This study aimed to first gather nationwide data on farm and parcel characteristics to understand how pioneering farmers allocate CCs on their farms depending on the farm size, farming system, and physical field parcel characteristics, and whether the allocation of CCs to parcels is solely dictated by a cash crop. Furthermore, the aim was to understand how farmers allocated CCs considering the rotational history of a parcel, and thereby, may aim to benefit from services CCs provide for soil health. How farmers allocate CCs to parcels differing in features, such as the slope of the land and proximity to a waterway, was considered as a potential measure to mitigate environmental impacts of agriculture.

2. Materials and Methods

Data on farms that had applied for AP-CCs for the growing season 2020 (i.e., the first year with such available data) were provided by Finnish Food Authority (FFA). This included information on 34,515 field parcels on 5747 farms. Background information was available for 30,317 fields. In addition, these farms had 111,404 field parcels not included in the AP-CCs which were used as a reference to model the probability of selecting field parcels for AP-CCs. The data was prepared for analyses with different targets and depending on the use, the number of parcels and farms which changed. There was no data on CCs choices per se, but only information that they were cultivated on certain field parcel(s) on a farm as CCs. The number of CCs per farm ranged from 1 to 58 (the lower quartile 2, the median 4, the upper quartile 8). Cash crops for the field parcels with CCs were gathered from data provided by FFA by using the field parcel identity code.
The rotational history of the field parcels with CCs in 2020 was determined by using data on the crop species that were grown in each field parcel in 2016–2020 (FFA data). Only fields with a complete history were included in the analysis. If a field parcel had more than one agricultural parcel, it was included in the analysis only in the case that a major agricultural parcel covered at least 70% of the area of the field parcel. Rotations were classified according to [9].
Data on the farming system (conventional and organic) were provided by the FFA for all farms that had applied for AP-CCs for the 2020 growing season. The registry of the FFA is based on the farm identity number. By using the identity number, the geographical regions of the farms were located. The areas covered by 16 Centers for Economic Development, Transport and the Environment, ELY Centers were merged to form four main regions: South, West, East/North Finland, and the inland region. The farm sizes were available in the registry of the FFA, and these were grouped as <30 ha, 30–59 ha, 60–99 ha, and ≥100 ha.
Seven field parcel characteristics were gathered from different official sources (if not otherwise specified, data was provided by the FAA). These included the following: (1) the parcel size (<0.5 ha, 0.5–0.9 ha, 1.0–2.9 ha, 3.0–4.9 ha and ≥5.0 ha); (2) the parcel distance to the farm center (<0.3 km, 0.3–1.19 km, 1.2–5.0 km and >5 km); (3) the field slope (<1.3%, 1.3–2.89%, 2.9–6.99% and ≥7.0%); (4) the field shape (<0.3, 0.3–0.49, 0.5–0.69 and ≥0.7); (5) the parcel proximity to a waterway, next to any waterway (lake, river or main ditch) (0 m, ≤300 m and >300 m); (6) the dominant soil type of the parcel (coarse mineral soils such as Haplic Podzol 1 and 2, clay soils like Vertic Cambisol, Eutric Cambisol, Gleyic Cambisol and Gleysols, and organic soils such as Fibric/Terric Histosol 1 and 2 and Dystric Gleysol); and (7) ownership, i.e., whether the farm was owned by the farmer or leased.
The farm center was characterized as the mid-point of the median field. The median field was a field that minimized the average Euclidean distance between the field and other fields of the farm. The field slope was the average soil surface slope of the field, calculated in a 25 × 25 m grid from the laser scanning data produced by the NLS National Land Survey of Finland. The shape was measured as the square root of the area of the field divided by the length of its boundaries divided by four, i.e., the shape is 1.00 for a completely square field. Information on how the proximity to waterways was measured is available in [18]. The dominant soil type was determined according to [19].
A logistic regression was used to analyze the data. In a logistic regression the response variable is the probability that an event will occur (e.g., whether the farmer uses a cover crop on a farm), hence the response variable is constrained between 0 and 1 using a logit link function. A logistic regression has the additional advantage that all of the predictors can be binary, a mixture of categorical and continuous or just continuous. Most predictors in the current study were categorical.
A logistic regression produces odds ratios associated with each predictor value. The ‘odds’ of an event are defined as the probability of the outcome event occurring divided by the probability of the event not occurring. An odds ratio of 1.00 indicates that the event under study is equally likely in both values of the predictor. In each analysis, one level of predictor variable was selected as a reference (e.g., region: East/North Finland; Farming system: organic; farm size: ≥100 ha). An odds ratio greater than 1.00 indicates that the event is more likely in the studied level of the predictor than in the reference, whilst an odds ratio less than 1.00 indicates that the event is less likely in the studied level of the predictor than in the reference. A 95% confidence limit for the odds ratio defines how high and how low the actual population odds ratio might be. The confidence limits are related to the p-values such that the odds ratio will not be statistically significant if the confidence limit contains the value of 1.00.
A logistic regression was used to derive odds ratios with 95% confidence limits for all studied response variables. All the potential predictor variables were included in the model; therefore, the odds ratios obtained are called adjusted odds ratios (an adjusted odds ratio is an odds ratio that has been adjusted to account for other predictor variables in a model). These analyses were performed by the SAS/logistic procedure (SAS Institute Inc., Cary, NC, USA).

3. Results

3.1. Characterizing FARMS That Benefit from SP-CCs

Many farm and field parcel characteristics had an impact on how likely it was that farmers would apply for AP-CCs for their farms. Farmers in West Finland more frequently used this incentive measure than those in North Finland, while farmers in South Finland least frequently took advantage of this opportunity (Table 1). Conventional farmers applied for the AP-CCs more frequently than organic farmers, as did farmers with more than 100 ha of field area on a farm. This incentive measure was hardly ever used by farmers with small farms (<60 ha) or even those with 60–99 ha farms.
Large field parcels were favored for cultivation of CCs. There were increasing probabilities for use of CCs from <0.5 ha field size to 1.0–2.9 ha size, but larger parcels (3.0–4.9 ha and especially ≥5.0 ha) were less and less favored by farmers for CCs. Furthermore, farmers with high share of cereal area on a farm took more frequent advantage of the AP-CCs) than those having <25% of cereal area. Farmers who cultivated special crop(s) in a farm used CCs more frequently than those without special crop (Table 1).

3.2. Allocation of CCs to Cash Crops Depending on the Region and Farm Size

Farmers planted CCs only on some of the field parcels on a farm and only on a part of the parcels allocated to certain cash crops. For some 78% of parcels planted with winter rapeseed (Brassica rapa L., B. napus L.) and 74% of those with faba beans (Vicia faba L.) as cash crops farmers had utilized AP-CCs, and they did the same for 62% of the parcels with spring rapeseed (Table 2). The share of parcels that had been allocated for AP-CCs on a farm ranged from some 50% to 56% for the following cash crops (in descending order): winter rye (Secale cereale L.), green fodder, winter wheat (Triticum aestivum L.), peas (Pisum sativum L.), oats (Avena sativa L.), cereal intercrops, and sugar beet (Beta vulgaris var. altissima). The share of parcels was 43–49% for cereal–legume intercrops, spring wheat, potatoes (Solanum tuberosum L.), and barley (Hordeum vulgare L.), and only 19% for caraway (Carum carvi L.) as a cash crop.
Regions differed in the shares of land area devoted to different cash crops (Table 2). The region had an impact on how frequently conventional farmers used CCs on parcels (across all cash crops) with a descending order from West Finland, inland regions, South Finland, and East/North Finland (Table 3). These frequencies, however, differed depending on the harvested cash crop of a parcel. Only conventional farms were included in this study because they had sufficient cases per region and cash crop, in contrast to the data for organic farms. For example, oats, barley, and spring wheat were more common cash crops in East/North Finland than elsewhere. Cereal and cereal–legume intercrops were rarely used as cash crops for CCs in South Finland. Cereal–legume intercrops were often used as cash crops in East/North and West Finland, while cereal intercrops in West Finland and inland regions. Potatoes were rarely used as cash crop for CCs in West Finland, while rapeseed in any of the regions compared to East/North Finland. These regional differences are, however, partly attributable to the regional differences in the cultivation intensity of cash crops (Table 2).
An increase in the farm size systematically increased the probability that conventional farmers would use CCs on their farms when studied across all cash crops and when cereal–legume intercrops were cultivated as cash crops (Table 4). Organic farmers with a farm size of 30–99 ha used CCs more frequently than those with ≥100 ha. On small conventional farms (<60 ha), barley was favored as a cash crop for the allocation of CCs more frequently than on farms with ≥100 ha. Spring wheat was less frequently used as a cash crop for CCs on very small farms (<30 ha) when compared to very large farms (≥100 ha).

3.3. Allocation of CCs to Cash Crops Depending on Field Parcel Characteristics

The field parcel characteristics had on the impact of the probabilities of how farmers allocated CCs on their farms, but also depending on the harvested cash crop. An increase in the parcel size systematically increased the probability that conventional farmers would cultivate CCs on a parcel when studied across all cash crops or barley was the cash crop (Table 5). The same trend was found when oats, spring wheat, cereal intercrops, and rapeseed were used as cash crops in fields where CCs were allocated, but with these cash crops large field parcels (3–4.9 ha) did not differ from the very large parcels (≥5.0 ha).
The distance from a parcel to the farm center was the only field parcel characteristic that did not differ in the case that all the cash crops were grouped together. Some cash-crop-dependent differences were found in the allocation of CCs depending on the distance to the farm center. For example, when potatoes were the primary crop, CCs were more frequently found on parcels next to the farm center (<0.3 km) than >1.2 km apart (Table 6). When the CCs had cereal intercrops as cash crops, they were more often >5 km apart from the farm center than next to the farm center, which was, however, the opposite to the case of winter wheat as a cash crop. When CCs had cereal–legume intercrops and green fodder as a cash crop, they were not allocated to the most distant or closest field parcels to the farm center, but rather somewhere between. Leased land may often be far away from the farm center. When analyzed across all cash crops, leased parcels more frequently had CCs than parcels owned by a farmer (Table 7). However, when either oats, spring wheat, or winter wheat were used as cash crops, CCs were more often grown on owned field parcels.
Both on conventional and organic farms, field parcels that were close to (≤300 m) a waterway more often had CCs than those further away (Table 8). Parcels with CCs were less frequently >300 m apart from a waterway and more frequently right next to it (Figure 1). The allocation of CCs differed depending on the soil type only when analyzed across all cash crops on conventional farms: CCs were found more frequently on clay soils than coarse mineral soils, and least often on organic soils. In general, CCs were allocated systematically more often to flat than sloping fields when analyzed across all cash crops, and this was also the case for winter wheat as a cash crop. However, considering potatoes as a cash crop, flat parcels were least favored by farmers (Table 8).

3.4. Crop Sequencing on Parcels Allocated for CCs

When considering the rotational history of the field parcels, CCs were most frequently allocated to parcels with cereal species monoculture rotations (i.e., barley after barley or oats after oats) (Figure 2). These cereal species monoculture rotations as well as cereal monoculture rotations (i.e., rotations with more diverse sequencing of cereal species) were more frequently found for cases in which the farmers had applied for AP-CCs for the field parcels, when compared to parcels without CCs. Cover crops were allocated to break-crop rotations also slightly more frequently in the case of AP-CCs, but less often on parcels with diverse crop rotations or any unspecified rotation when compared to other parcels on the farm than those which had applied for AP-CCs.
The contract for planting CCs was made for 2020, and in this particular year, 88% of field parcels with CCs had spring cereal, barley, oats, or wheat as cash crops. A total of 67% of the parcels with CCs in 2020 had spring cereals also in 2019, 54% in 2018, 44% in 2017, 37% in 2016, 33% in 2015, and 30% still in 2014 (Figure 3). These shares underline the long history of monotonous cereal sequencing of parcels with CCs in 2020. Some 13% of field parcels with CCs had spring cereals for one, two, or three years during 2016–2020. Only 5% of the field parcels with CCs in 2020 did not have spring cereals at all during the five-year period. A total of 7% of parcels with CCs had winter cereals in one year and 2% in two years, but never more frequently than two years out of five (Figure 4). Rapeseed (16% of field parcels), peas (3%), and faba beans (4%) were used as break-crops in rotations, and therefore, they were usually grown only once during 2016–2020 on parcels with CCs. A total of 5–6% of field parcels with CCs in 2020 included grasslands in one or two years, while 8–9% of them did so for three or four years during the five-year period. Green fallow was also sporadically grown on field parcels with CCs.

4. Discussion

When ideotyping farmers who benefited from the available subsidies, i.e., those who had applied for AP-CCs in 2020, it was found that they were most frequently conventional farmers with large farm sizes of ≥100 ha of agricultural land, ≥25% of field area dedicated to cereals, and furthermore, they cultivated special crop(s) (Table 1). On the other hand, farmers used CCs for barley as a cash crop more frequently in small farms (<60 ha) than those ≥100 ha, which was contrary to spring wheat and cereal-legume intercrops (Table 4).
Farmers who applied for AP-CCs were more often located in West Finland and inland regions than in East/North and South Finland (Table 1). In the case of conventional farmers only, the descending order changed somewhat when analyzed across all cash crops, ranging in this case as follows: West Finland → inland regions → South Finland → East/North Finland (Table 3). However, the cash crop had some impacts, but regional differences need to be considered relative to total cultivation area in a region. In East/North Finland, CCs were more frequently used for all spring cereals, cereal–legume intercrops, rapeseed, and potatoes as cash crops, but in the case of spring wheat and rapeseed, this was attributable to low cultivation areas in this region (Table 2).
Farmers favored large field parcels (≥5 ha) for CCs. The parcel size ranges a lot on Finnish farms, and large field parcels are considered to be the primary food production capital on a farm [2]. Finding that farmers favor large parcels for CCs suggests that they aim to benefit from the ecosystem services provided by CCs such as restoring soil health [12] and improving the nutrient dynamics, cycling, and scavenging [16,20]. Large parcels may have some logistics benefits when considering farming practices as well: the concomitance of CCs may require some additional management operations compared to the cash crop grown as a monocrop [21].

4.1. Field Parcel Allocation for CCs Independently or Dictated by the Cash Crop?

Farmers allocate different cash crops to field parcels by acknowledging many crop features, parcel characteristics, management requirements, and logistics [1]. It is likely that farmers first allocate cash crops in an accustomed way to parcels by considering the cultivation history and characteristics of a parcel, and thereafter, CCs are allocated in accordance with the target cash crop. For example, winter wheat was more frequently allocated to flat than sloping fields [1] as were CCs when winter wheat was the cash crop (Table 8). Large field parcels (≥5 ha) were systematically more frequently used for CCs in general, and in the case of spring cereals, their intercrops or rapeseed were used as cash crops (Table 5). Farmers prefer to allocate all these crops to large parcels [1] and thereby, the allocation of CCs were dictated by the cash crops.
However, many departures from this trend of allocating CCs along with cash crops were found. For example, according to earlier studies, potatoes and winter cereals are allocated to field parcels without primarily considering the distance to farm center [1]. Acknowledging this, CCs were over-represented for parcels that were close to the farm center (Table 6). Interestingly, when green fodder was grown as a cash crop for CCs, the CCs were more frequently allocated to parcels that were far away from the farm center. As perennial grasslands are typically next to the farm center [1], parcels available for green fodder are likely to be further away, as were the CCs allocated to parcels growing green fodder as a cash crop. Leased parcels were in general used more frequently for CCs than owned parcels (Table 7). Leased parcels are allocated more frequently than owned parcels to oats [1], but CCs were allocated less frequently to leased parcels with oats as the cash crop. Cover crops were allocated less frequently to leased than owned parcels with spring or winter wheat as a cash crop (Table 7), but ownership did not impact the allocation of wheat per se [1]. The field slope was not an important driver for the allocation of potatoes [1], but in the case of CCs, they were more often allocated to sloping than flat fields (Table 8).
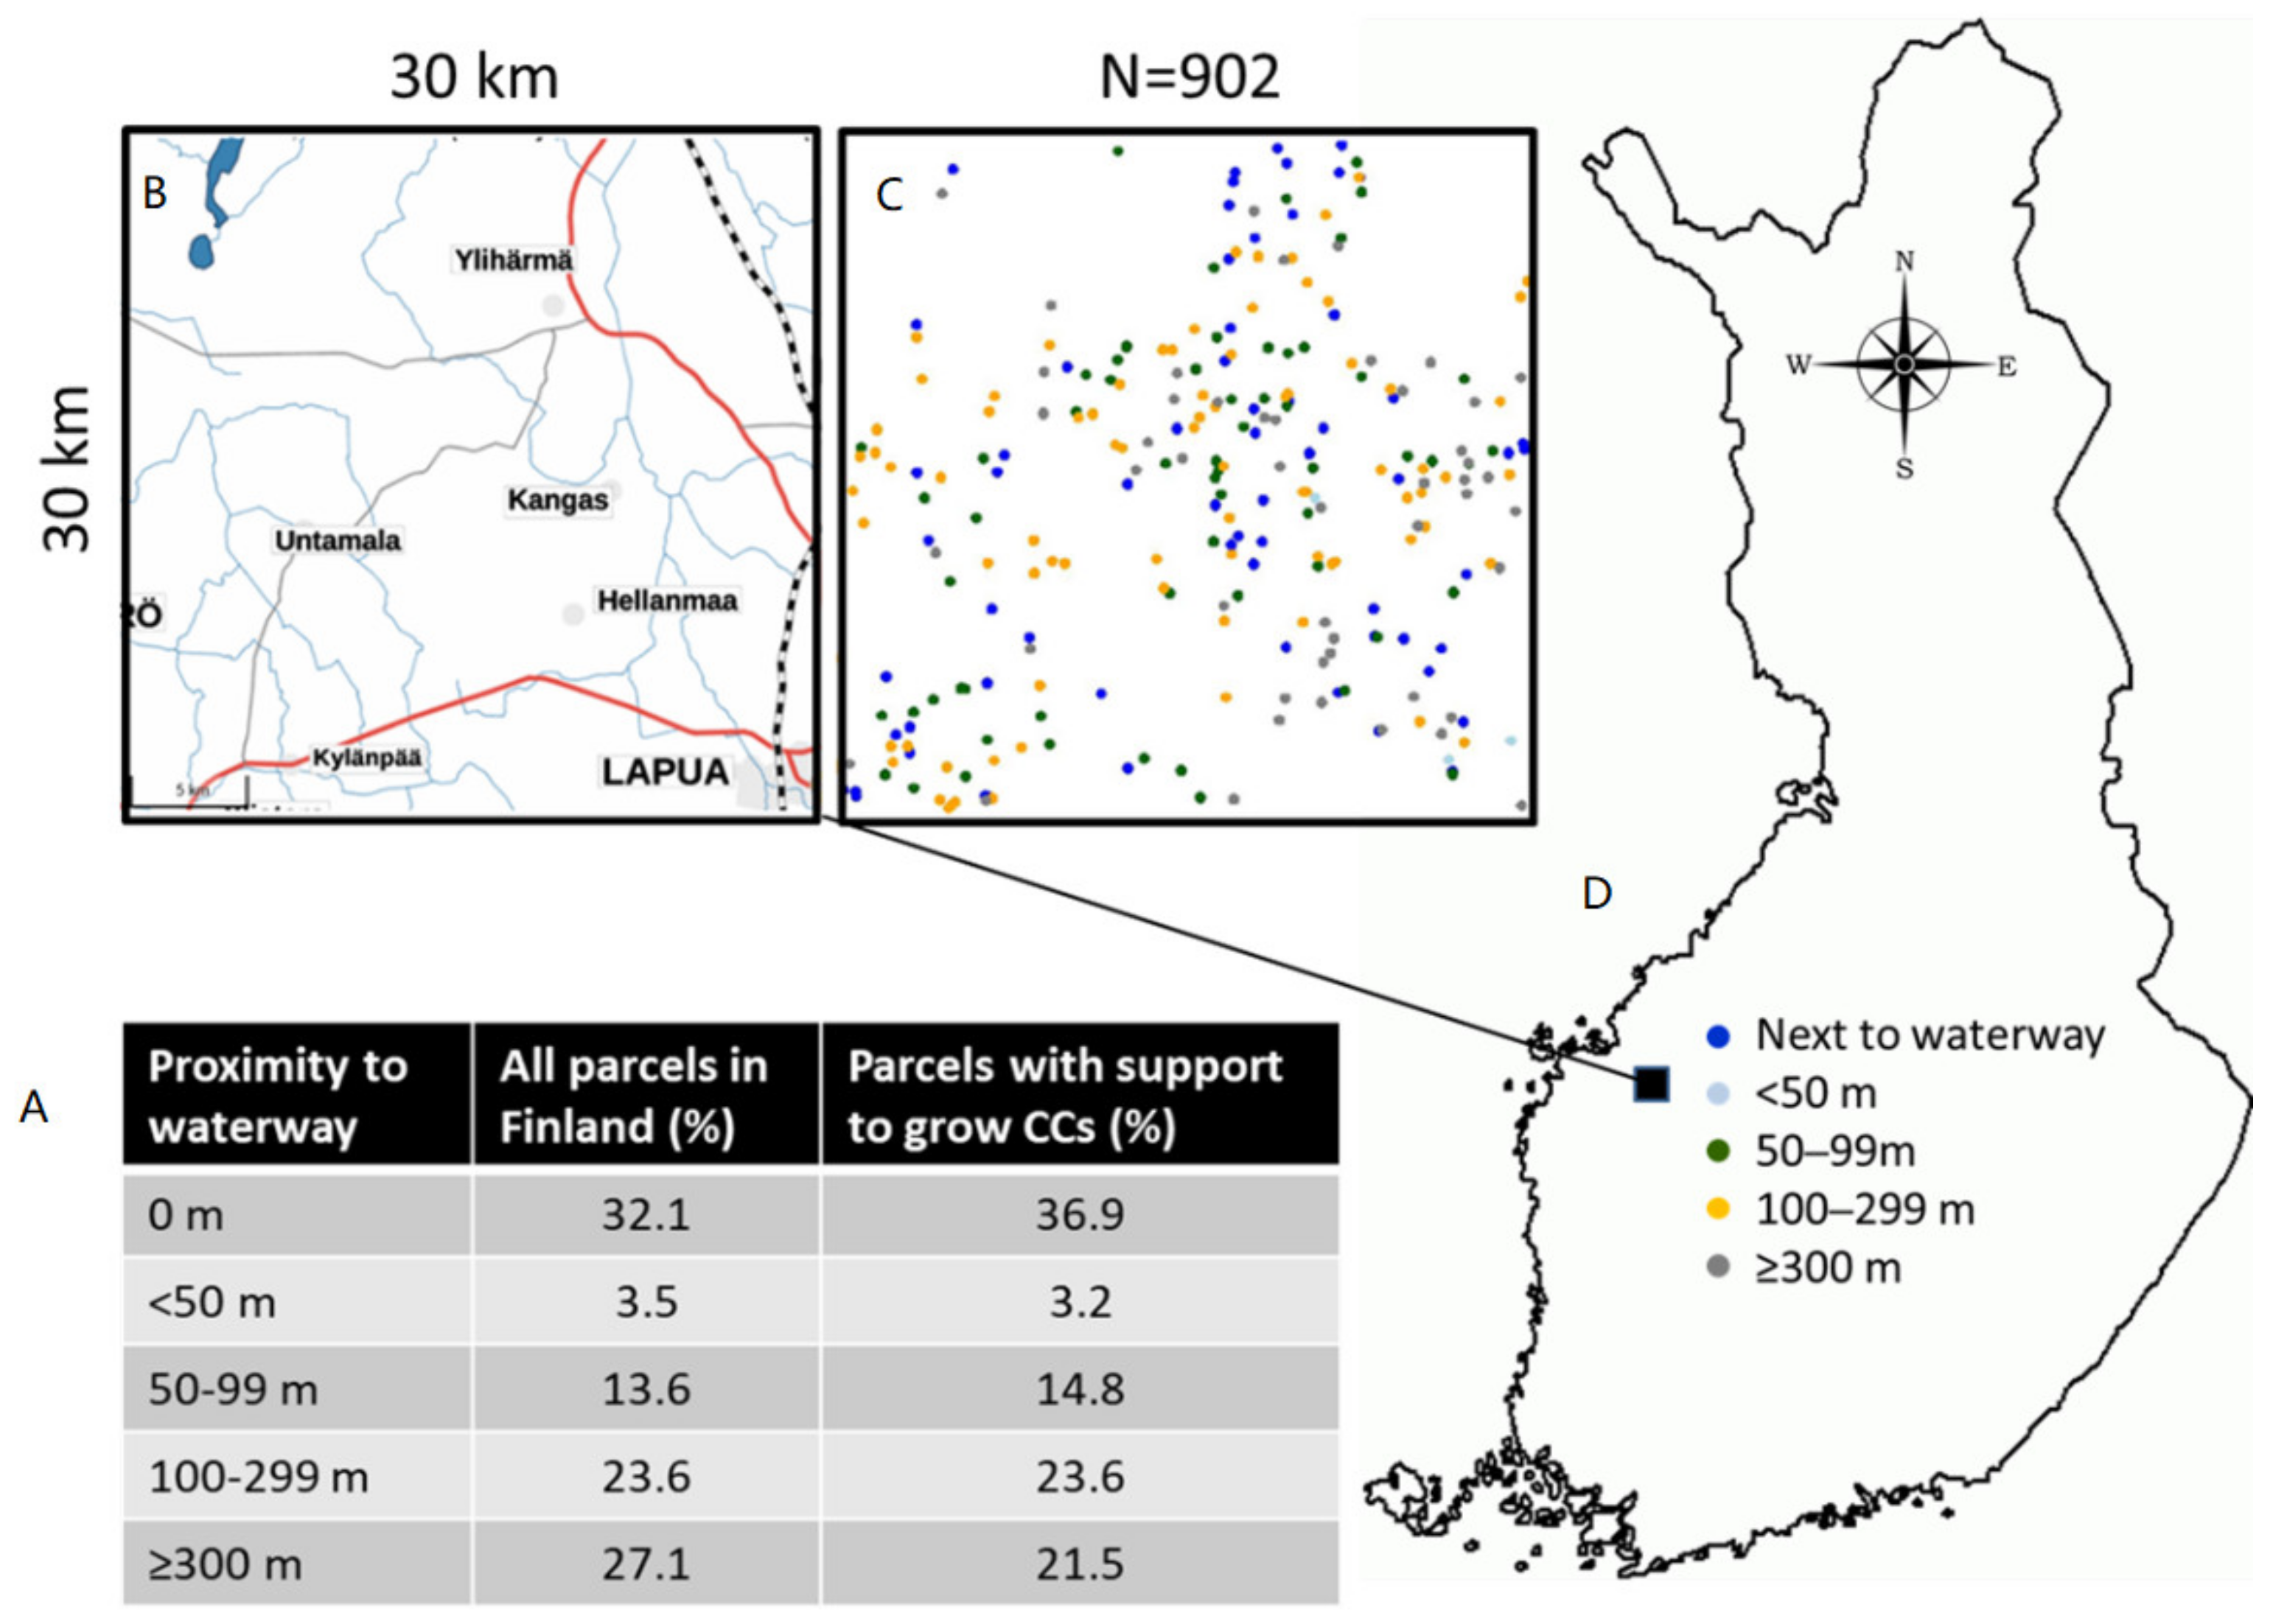
Considering the opportunities to reduce the environmental footprint of agriculture, CCs were used more frequently close to waterways than far away from it (≥300 m) (Figure 1). This indicates that farmers likely aimed to benefit from CCs to reduce nutrient leaching [11,20,22] and the erosion risk [6,13], which are potential ecosystem services provided by CCs for Finnish agricultural systems [23]. Cover crops were favored on clay and coarse mineral soils over organic soils (Table 8), which may, however, be partly attributable to regional differences in soil types: organic soils are most common in northern parts of the country, i.e., with lower agricultural land areas than elsewhere. Nonetheless, CCs provide a means to increase the green vegetation period at the expense of bare ground. This can have potential for carbon sequestration [24].

4.2. Farmers Stressed Rotational History of Parcels on Allocation of CCs

The share of field parcels allocated to each of the cash crops with CCs was high, in general (52% as an average across all cash crops), on farms which had applied for AP-CCs in 2020 (
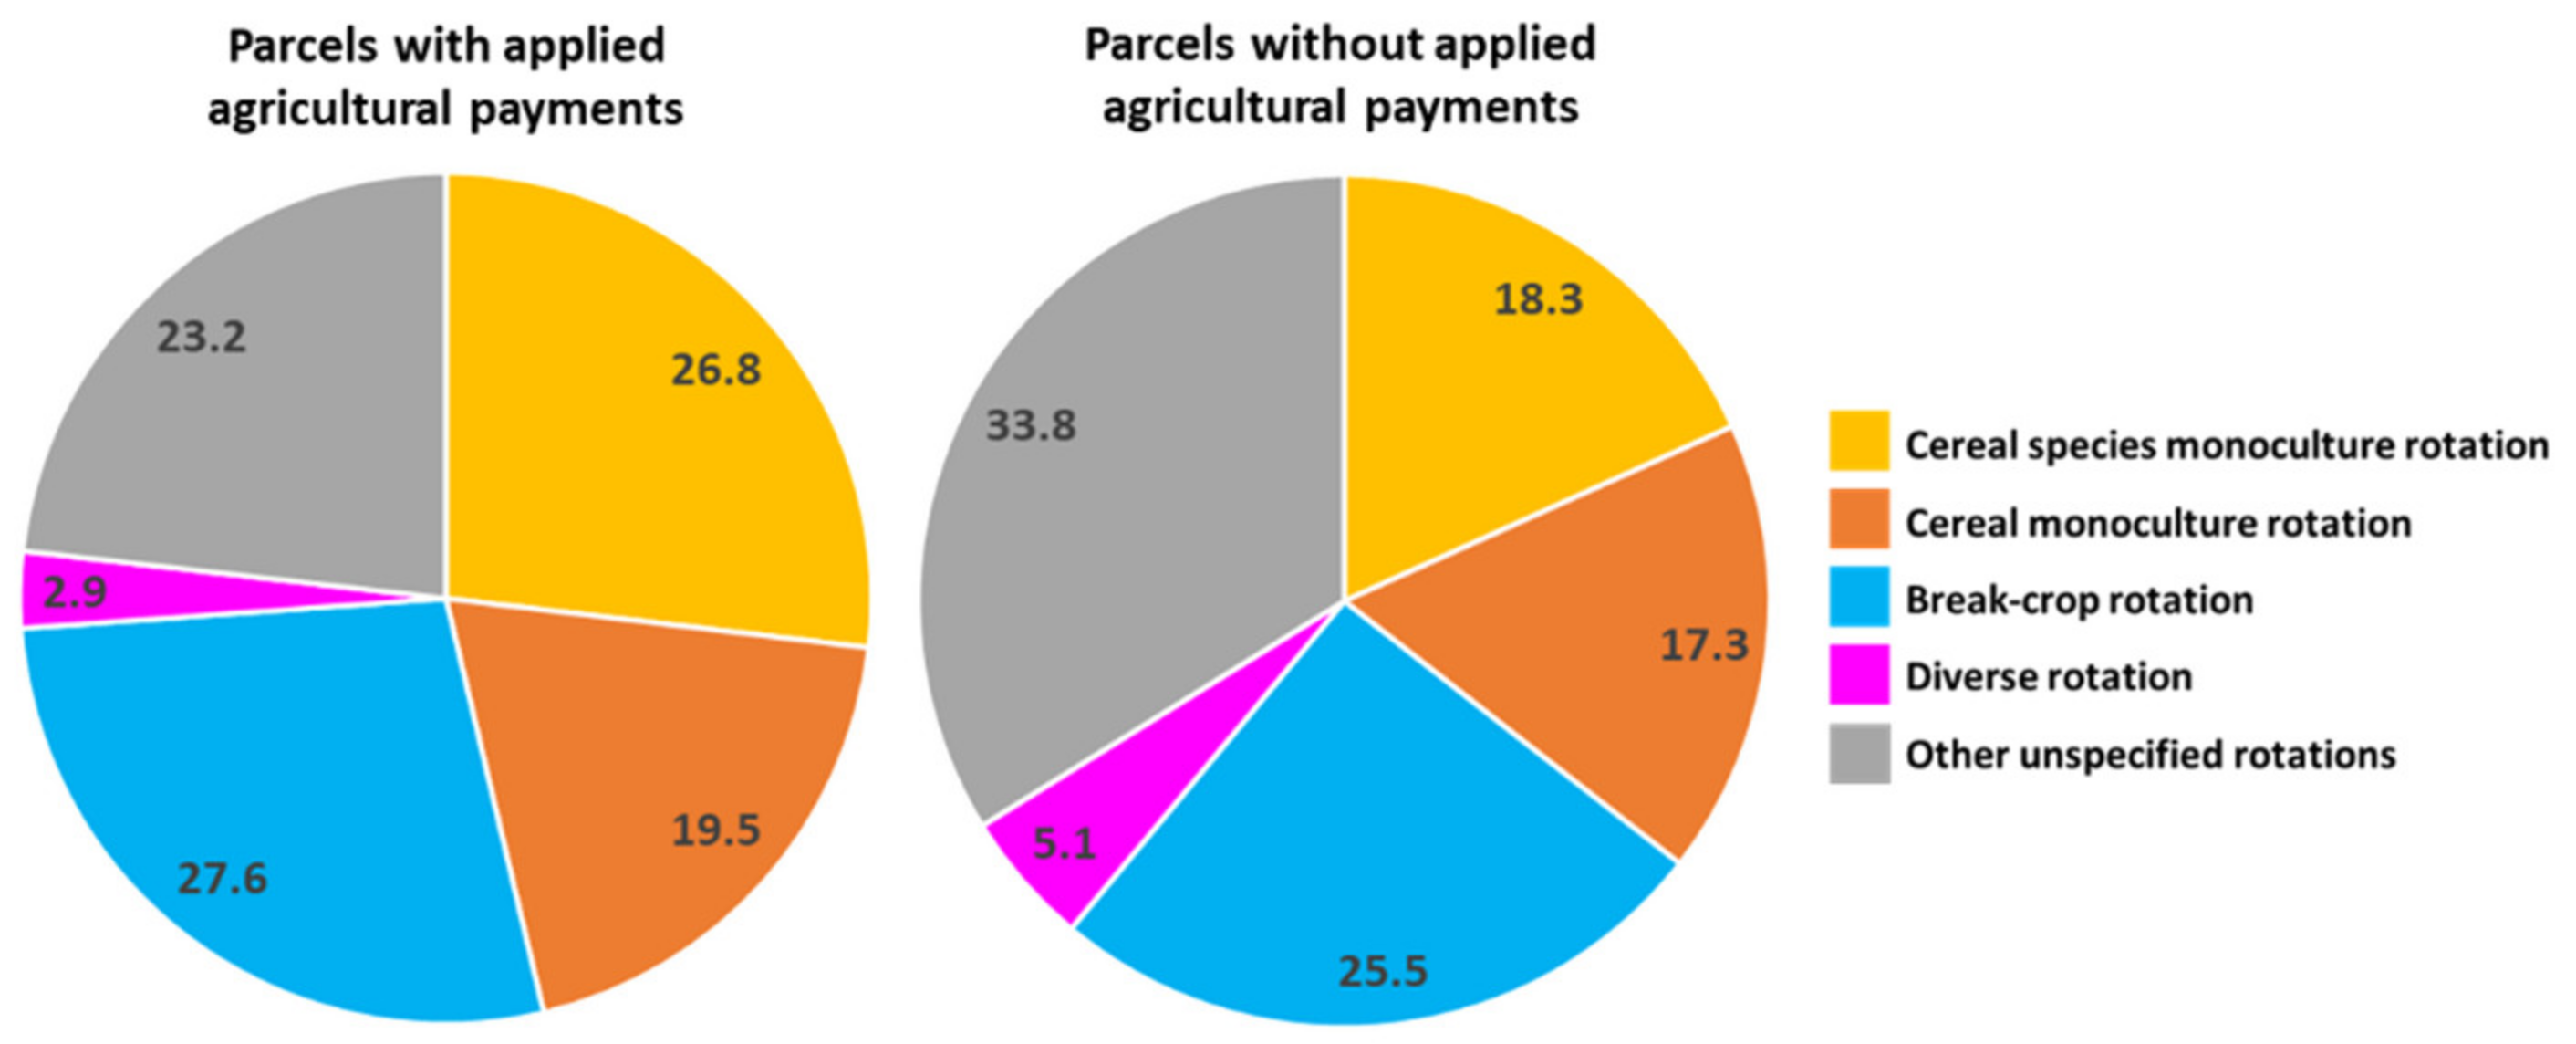
Table 2). Cash crops with low cultivation areas on a farm (e.g., because of being minor crops or crops that have specific requirements for crop rotation due to abiotic risks) accounted for the highest shares of field parcels with CCs. When compared to the share of different rotations, which farmers had applied for AP-CCs, CCs were allocated to field parcels that had a history of cereal species monoculture rotations, i.e., barley after barley or oats after oats four to five times in a five-year period (Figure 2).
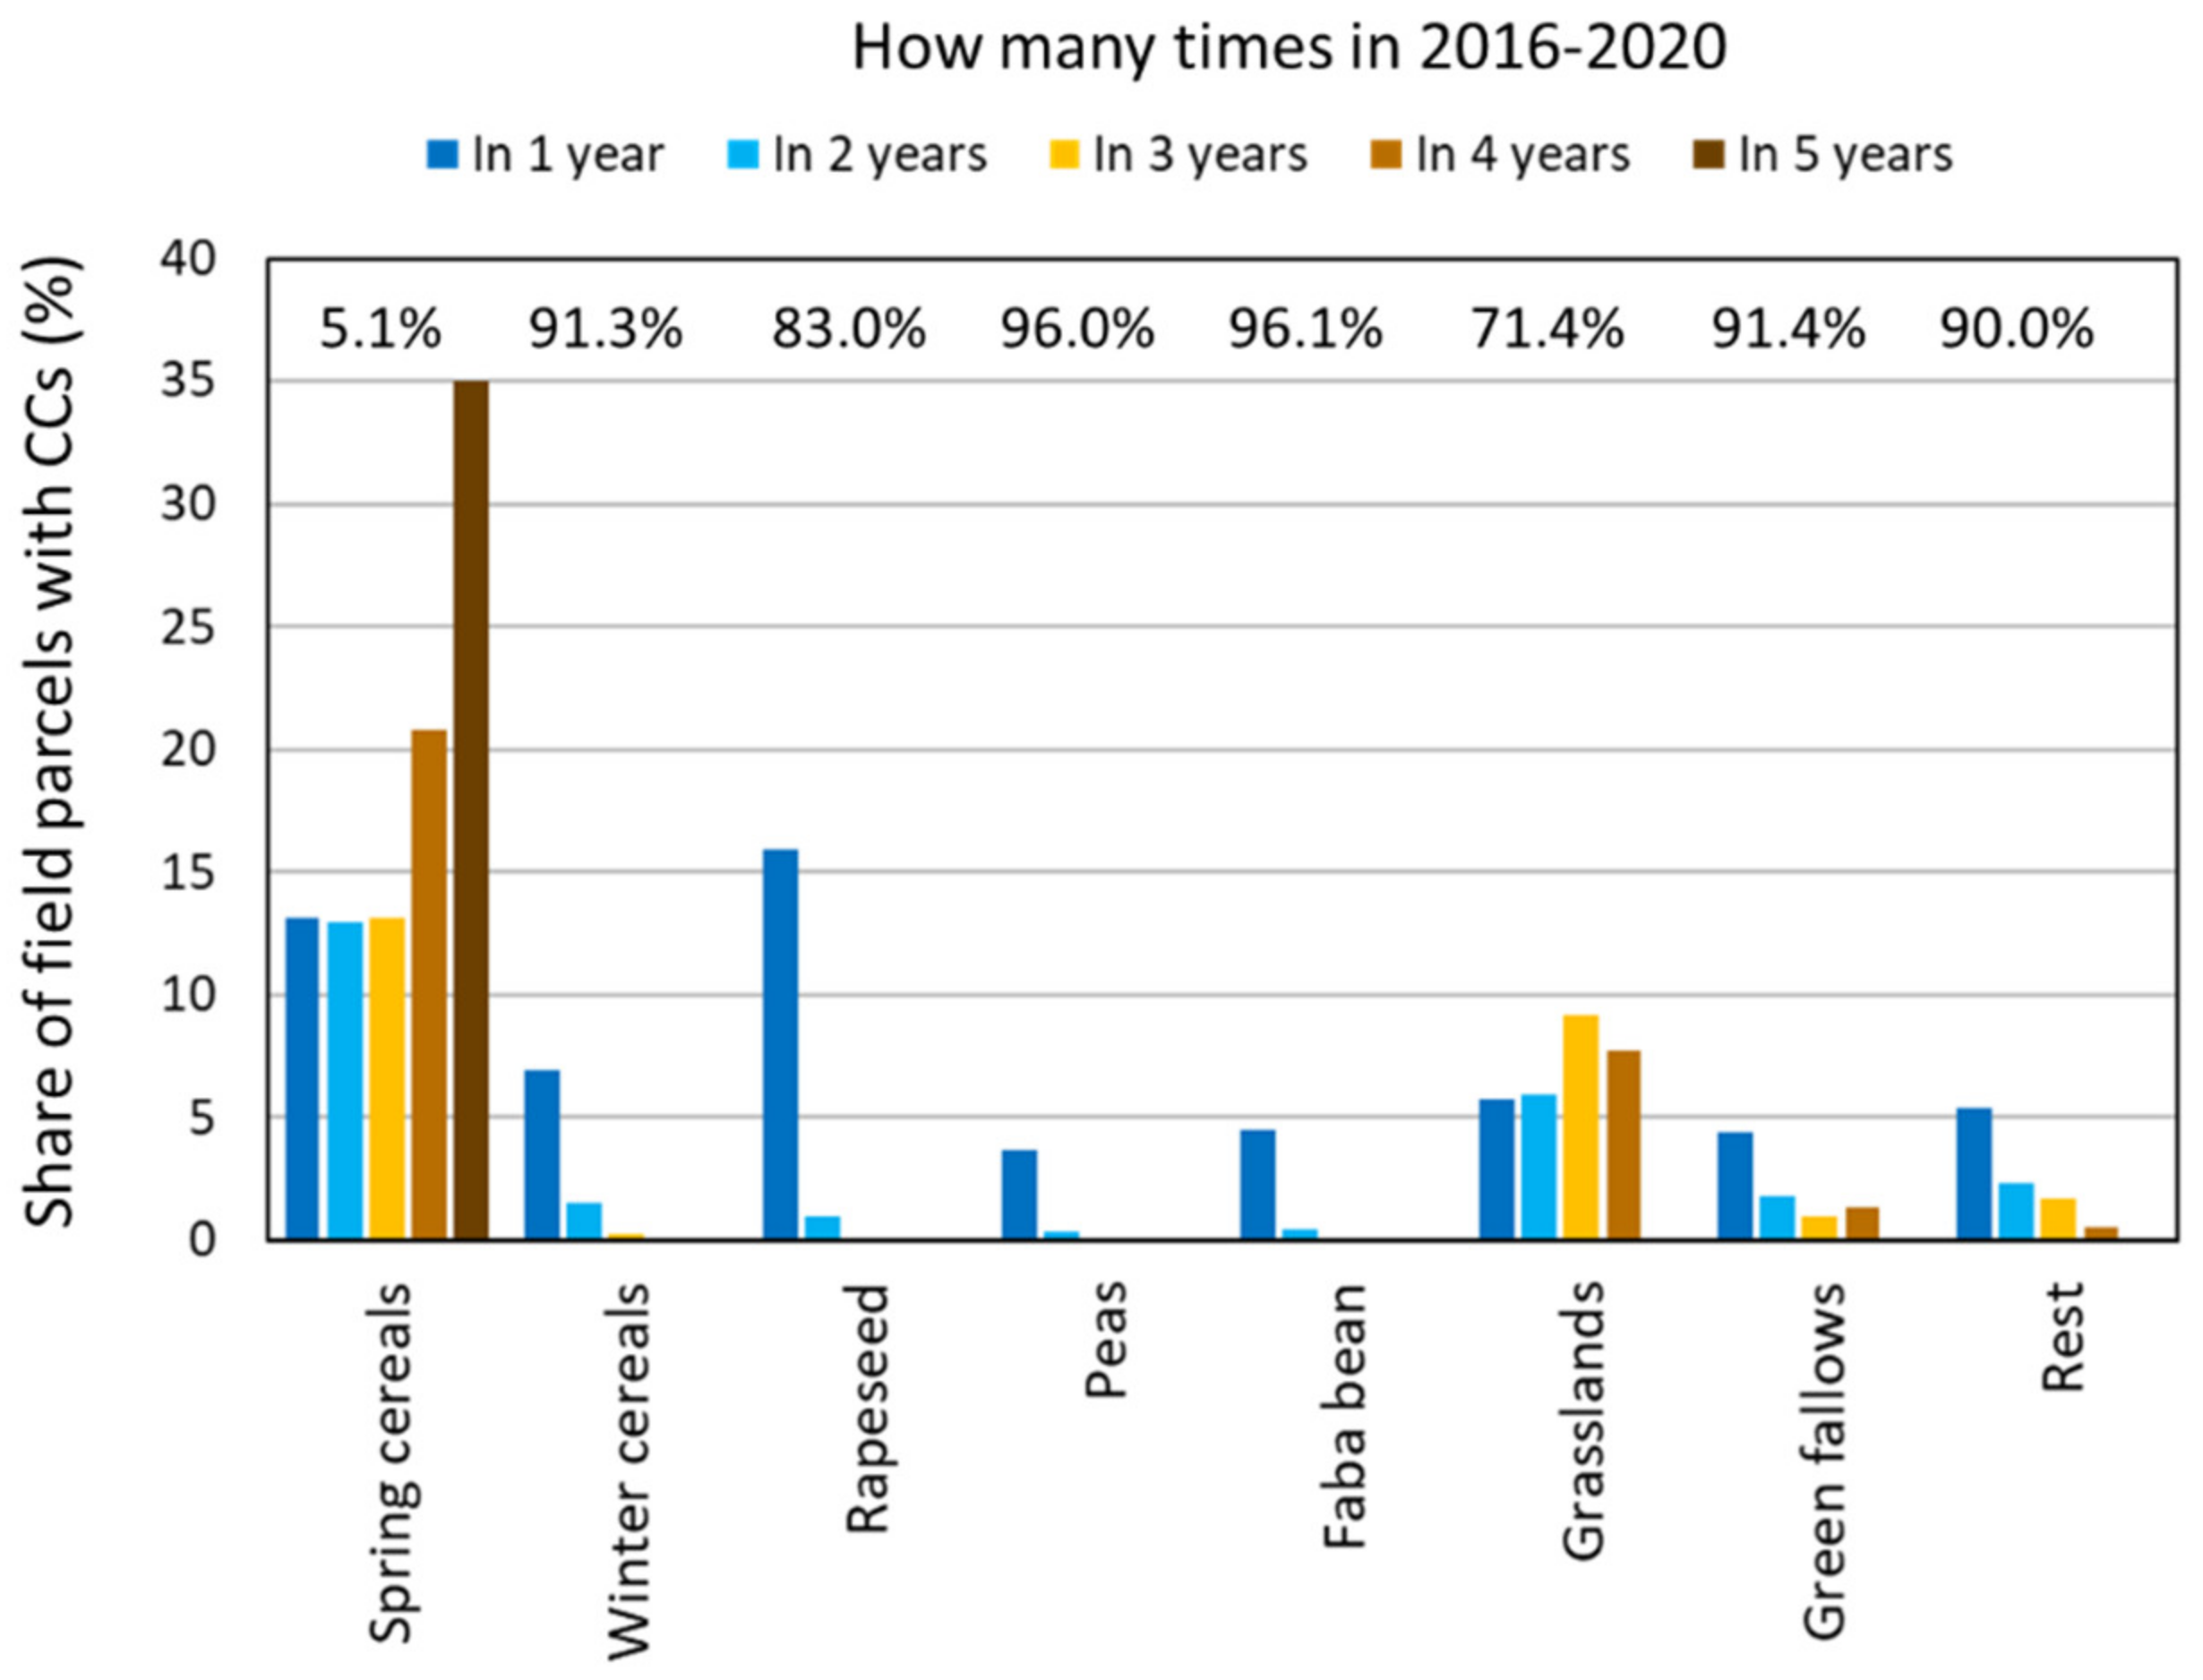
Farmers allocated CCs to cereal monoculture rotations (with a diverse choice of cereals), as well as to break-crop rotations, but not so for diverse rotations. A striking difference between spring cereals when compared to any other cash crop used for CCs was apparent when assessing how many times in 2016–2020 different cash crops were used (Figure 3 and Figure 4). With CCs, farmers increase spatial diversity per se, but it is likely that their primary motivation for the cultivation of CCs is to restore soil structure, conditions, and functionality. All these are important ecosystem services provided by CCs [12] and appreciated also by Finnish farmers [23].

5. Conclusions

Pioneering farmers who applied for agricultural payments available for the cultivation of CCs in 2020 were characterized to have conventional, large farms with cereal areas exceeding 25% of their agricultural land, and expertise in special crop production. Conventional farmers preferred large parcels for the cultivation of CCs, and this agreed with all cash crop choices. The allocation of CCs seemed to be dictated by a cash crop, but this was not the case with many other parcel characteristics. For example, CCs were allocated less frequently to leased than owned parcels with spring or winter wheat as a cash crop, even though according to earlier studies, ownership does not impact the allocation of wheat per se. Furthermore, sloping land was not an important driver for the allocation of potatoes to field parcels, but in the case of CCs with potatoes as a cash crop, they were more often allocated to sloping than flat fields. The contribution of CCs to reducing nutrient leaching and erosion was probably the aim of farmers when CCs were used more frequently close to waterways rather than far from them. Most importantly, conventional farmers allocated CCs to field parcels suffering from extremely monotonous cereal sequencing. The results of this study indicate that the allocation of CCs in a farm is not haphazard, but farmers aim to benefit from ecosystem services that are provided by the cultivation of CCs, such as increases in spatial diversity, reduction in the environmental footprint, and improvements of soil health. This study provides an essential understanding to support the implementation of CCs by farmers also beyond pilot farms and helps the transition towards more sustainable crop production systems at high latitudes.

Author Contributions

Conceptualization, P.P.-S. and L.J.; methodology, P.P.-S. and L.J.; software, L.J.; validation, L.J.; formal analysis, L.J.; investigation, P.P.-S. and L.J.; resources, P.P.-S. and L.J.; data curation, L.J. and P.P.-S.; writing—original draft preparation, P.P.-S.; writing—review and editing, P.P.-S. and L.J.; visualization, P.P.-S.; project administration, P.P.-S.; funding acquisition, P.P.-S. All authors have read and agreed to the published version of the manuscript.

Funding

This work was financed by the Ministry of Agriculture and Forestry in Finland, project Evergreen Revolution with Cover Crops—Best Practices to Enhance C Sequestration (IKIVIHREÄ), grant no. VN/5082/2021-MMM-2 (Catch the Carbon-program) and Luke’s strategic funding on project Farmer-specific methods to sustainably intensify agricultural systems by closing yield gaps (F-Specific).

Institutional Review Board Statement

Not applicable.

Informed Consent Statement

Not applicable.

Data Availability Statement

Restrictions apply to the availability of the used data. Data was obtained from Finnish Food Authority and are available by applying directly from this Authority (https://www.ruokavirasto.fi/en/about-us/services/, accessed on 14 February 2022). Open data on the share of areas for each cash crop in different regions of Finland available at https://stat.luke.fi/en/ (accessed on 14 February 2022).

Conflicts of Interest

The authors declare no conflict of interest.

References

  1. Peltonen-Sainio, P.; Jauhiainen, L.; Sorvali, J.; Laurila, H.; Rajala, A. Field characteristics driving farm-scale decision-making on land allocation to primary crops in high latitude conditions. Land Use Policy 2018, 71, 49–59. [Google Scholar] [CrossRef]
  2. Peltonen-Sainio, P.; Jauhiainen, L.; Laurila, H.; Sorvali, J.; Honkavaara, E.; Wittke, S.; Karjalainen, M.; Puttonen, E. Land use optimization tool for sustainable intensification of high-latitude agricultural systems. Land Use Policy 2019, 88, 104104. [Google Scholar] [CrossRef]
  3. Peltonen-Sainio, P.; Jauhiainen, L.; Latukka, A. Interactive tool for farmers to diversify high-latitude cereal-dominated crop rotations. Int. J. Agric. Sustain. 2020, 18, 319–333. [Google Scholar] [CrossRef]
  4. Crossland, M.; Fradgley, N.; Creissen, H.; Howlett, S.; Baresel, J.P.; Finckh, M.R.; Girling, R. An online toolbox for cover crops and living mulches. Aspects Appl. Biol. 2015, 129, 1–6. [Google Scholar]
  5. Jian, J.; Lester, B.J.; Du, X.; Reiter, M.S.; Stewart, R.D. A calculator to quantify cover crop effects on soil health and productivity. Soil Till. Res. 2020, 199, 104575. [Google Scholar] [CrossRef]
  6. Blanco-Canqui, H.; Shaver, T.M.; Lindquist, J.L.; Shapiro, C.A.; Elmore, R.W.; Francis, C.A.; Hergert, G.W. Cover crops and ecosystem services: Insights from studies in temperate soils. Agron. J. 2015, 107, 2449–2474. [Google Scholar] [CrossRef] [Green Version]
  7. Peltonen-Sainio, P.; Jauhiainen, L. Lessons from the past in weather variability: Sowing to ripening dynamics and yield penalties for northern agriculture from 1970 to 2012. Reg. Environ. Chang. 2014, 14, 1505–1516. [Google Scholar] [CrossRef]
  8. Peltonen-Sainio, P.; Jauhiainen, L. Risk of low productivity is dependent on farm characteristics: How to turn poor performance to advantage? Sustainability 2019, 11, 5504. [Google Scholar] [CrossRef] [Green Version]
  9. Peltonen-Sainio, P.; Jauhiainen, L. Unexploited potential to diversify monotonous crop sequencing at high latitudes. Agric. Syst. 2019, 174, 73–82. [Google Scholar] [CrossRef]
  10. Peltonen-Sainio, P.; Jauhiainen, L. Large zonal and temporal shifts in crops and cultivars coincide with warmer growing seasons in Finland. Reg. Environ. Chang. 2020, 20, 89. [Google Scholar] [CrossRef]
  11. Aronsson, H.; Hansen, E.M.; Thomsen, I.K.; Liu, J.; Øgaard, A.F.; Känkänen, H.; Ulén, B. The ability of cover crops to reduce nitrogen and phosphorus losses from arable land in southern Scandinavia and Finland. J. Soil Water Conserv. 2016, 71, 41–55. [Google Scholar] [CrossRef] [Green Version]
  12. Ruis, S.J.; Blanco-Canqui, H. Cover crops could offset crop residue removal effects on soil carbon and other properties: A review. Agron. J. 2017, 109, 1785. [Google Scholar] [CrossRef]
  13. Daryanto, S.; Fu, B.; Wang, L.; Jacinthe, P.; Zhao, W. Quantitative synthesis on the ecosystem services of cover crops. Earth-Sci. Rev. 2018, 185, 357–373. [Google Scholar] [CrossRef]
  14. Osipitan, O.A.; Dille, J.A.; Assefa, Y.; Knezevic, S.Z. Cover crop for early season weed suppression in crops: Systematic review and meta-analysis. Agron. J. 2018, 110, 2211. [Google Scholar] [CrossRef] [Green Version]
  15. De Notaris, C.; Rasmussen, J.; Sørensen, P.; Olesen, J. Nitrogen leaching: A crop rotation perspective on the effect of N surplus, field management and use of catch crops. Agric. Ecosyst. Environ. 2018, 255, 1–11. [Google Scholar] [CrossRef]
  16. Wittwer, R.A.; van der Heijden, M.G.A. Cover crops as a tool to reduce reliance on intensive tillage and nitrogen fertilization in conventional arable cropping systems. Field Crops Res. 2020, 249, 107736. [Google Scholar] [CrossRef]
  17. Peltonen-Sainio, P.; Jauhiainen, L.; Joona, J.; Mattila, T.; Hydén, T.; Känkänen, H. Farm characteristics shape farmers’ traditional and novel cover crop choices in the northern european agricultural systems. Land Use Policy 2022. submitted. [Google Scholar]
  18. Peltonen-Sainio, P.; Laurila, H.; Jauhiainen, L.; Alakukku, L. Proximity of waterways to finnish farmlands and associated characteristics of regional land use. Agric. Food Sci. 2015, 24, 24–38. [Google Scholar] [CrossRef] [Green Version]
  19. Lilja, H.; Uusitalo, R.; Yli-Halla, M.; Nevalainen, R.; Väänänen, T.; Tamminen, P. Suomen Maannostietokanta: Maannoskartta 1:250,000 Ja Maaperän Ominaisuuksia. MTT n Selvityksiä 2006, 114, 1–70. (In Finnish) [Google Scholar]
  20. De Notaris, C.; Olesen, J.; Sørensen, P.; Rasmussen, J. Input and mineralization of carbon and nitrogen in soil from legume-based cover crops. Nutr. Cycl. Agroecosyst. 2020, 116, 1–18. [Google Scholar] [CrossRef]
  21. Alonso-Ayuso, M.; Gabriel, J.L.; Hontoria, C.; Ibáñez, M.Á.; Quemada, M. The cover crop termination choice to designing sustainable cropping systems. Eur. J. Agron. 2020, 114, 126000. [Google Scholar] [CrossRef]
  22. Valkama, E.; Lemola, R.; Känkänen, H.; Turtola, E. Meta-analysis of the effects of undersown catch crops on nitrogen leaching loss and grain yields in the nordic countries. Agric. Ecosyst. Environ. 2015, 203, 93–101. [Google Scholar] [CrossRef]
  23. Peltonen-Sainio, P.; Jauhiainen, L.; Mattila, T.; Joona, J.; Hydén, T.; Känkänen, H. Pioneering farmers value agronomic performance of cover crops and their impacts on soil and environment. Agric. Syst. 2022. under revision. [Google Scholar]
  24. Poeplau, C.; Don, A. Carbon sequestration in agricultural soils via cultivation of cover crops—A meta-analysis. Agric. Ecosyst. Environ. 2015, 200, 33–41. [Google Scholar] [CrossRef]
Figure 1. Proximity to waterways of field parcels with agricultural payment applied to grow cover crops (CCs) in Finland (A) and a 30 km × 30 km case region with the highest number of CCs (n = 902) The top left panel (B) shows waterways in blue, and the right panel (C) all the field parcels with CCs. The map (D) shows the location of the case region in Finland as well as the color codes for proximity to waterway.
Sustainability 14 03103 g001
Figure 2. Shares of different five-year rotations (2016–2020) on farms which had applied for agricultural payments to grow cover crops in 2020. The shares are shown for field parcels using the agricultural payments (in total 28,564, on the left-hand side) and those which were not (in total 69,573, on the right-hand side). Grassland and green-fallow rotations were excluded.
Sustainability 14 03103 g002
Figure 3. Share of field parcels [in total 28,564 linked to applied agricultural payments to grow cover crops (CCs) in 2020] where spring cereals were grown as cash crops in 2020 and both in 2020 and one by one each preceding year.
Sustainability 14 03103 g003
Figure 4. Cultivation history of field parcels (in total 34,515) for which farmers applied for agricultural payments to grow cover crops (CCs) in 2020, shown as the share of field parcels for each cash crop in the case that the number of years out of five (2016–2020) were one, two, three, four and five or none (in parenthesis above the bars).
Sustainability 14 03103 g004
Table 1. Odds ratios (OR) with 95% confidence limits (CL) showing the probability of a farmer planting a cover crop (CC) on a farm by applying for an agricultural payment for the cultivation of CCs. When the odds ratio is <1.00 a CC is planted significantly less frequently, and when the odds ratio is >1.00, it is planted significantly more frequently compared to the reference (heading in italics), provided that the confidence limit does not include the value 1.00.
CharacteristicOR95% CL
Region (p < 0.001) compared to East/North Finland
South Finland0.710.660.76
West Finland2.172.032.31
Inland1.040.971.11
Farming system (p < 0.001) compared to organic
Conventional4.754.345.20
Farm size (p < 0.001) compared to ≥100 ha
<30 ha0.050.050.05
30–59 ha0.170.160.18
60–99 ha0.390.370.41
Mean field parcel size (p < 0.001) compared to ≥5.0 ha
<0.5 ha0.380.170.88
0.5–0.9 ha2.392.092.73
1.0–2.9 ha3.252.973.57
3.0–4.9 ha1.941.762.14
Cereal area in a farm (p < 0.001) compared to ≥25%
<25%0.230.220.24
Special crop area in a farm (p < 0.001) compared to >0%
0%0.380.360.39
Table 2. The share of the field parcels on each cash crop, for which a farmer has applied for an agricultural payment for the cultivation of cover crops in 2020 (in total 34,515) (data from Finnish Food Authority) and the share of areas for each cash crop in each main region (data from https://stat.luke.fi/en/, accessed on 14 February 2022).
Cash CropShare of Parcels with CCs (%)Share of Land Area (%)
South FinlandWest FinlandInland RegionEast/North Finland
Barley43.329.738.032.333.8
Oats50.324.128.834.120.1
Spring wheat45.126.68.012.93.5
Winter wheat53.93.80.81.60.1
Winter rye56.32.51.01.50.7
Cereal intercrops49.90.20.80.72.6
Cereal–legume intercrops48.50.40.70.53.4
Peas51.92.51.51.51.1
Faba beans73.52.30.41.00.3
Spring rapeseed62.22.51.71.81.8
Winter rapeseed78.30.20.10.20.3
Caraway18.81.10.92.21.6
Potatoes43.60.63.60.60.7
Sugar beet49.81.31.10.50.0
Green fodder54.62.412.78.630.1
Table 3. Odds ratios (OR) with 95% confidence limits (CL) showing the impact of the region on the probability that a conventional farmer has planted cover crops (CCs) on field parcels by applying for an agricultural payment for their cultivation, and how this differed depending on the cash crop. When the odds ratio is <1.00, a CC is planted significantly less frequently, and when it is >1.00, the CC is planted significantly more frequently compared to the reference (heading in italics), provided that the confidence limit does not include the value 1.00.
Region Compared to East/North FinlandOR95% CL
Across all cash crops (p < 0.001)
South Finland1.731.631.83
West Finland2.942.803.08
Inland1.911.812.01
Barley as a cash crop (p < 0.001)
South Finland0.770.690.87
West Finland0.840.760.92
Inland0.940.851.05
Oats as a cash crop (p = 0.05)
South Finland0.840.720.98
West Finland0.850.740.98
Inland0.810.700.94
Spring wheat as a cash crop (p < 0.01)
South Finland0.570.400.83
West Finland0.690.481.00
Inland0.640.440.93
Cereal intercrop as a cash crop (p < 0.001)
South Finland0.350.190.67
West Finland1.451.012.06
Inland1.741.192.54
Cereal-legume intercrop as a cash crop (p < 0.01)
South Finland0.200.070.61
West Finland0.950.372.41
Inland0.520.181.47
Rapeseed as a cash crop (p = 0.01)
South Finland0.180.070.72
West Finland0.170.050.64
Inland0.120.030.44
Potatoes as a cash crop (p < 0.001)
South Finland0.700.291.64
West Finland0.330.140.77
Inland0.570.231.40
Table 4. Odds ratios (OR) with 95% confidence limits (CL) showing the impact of farm size on the probability that a conventional farmer has planted cover crops (CCs) on field parcels by applying for the agricultural payment for their cultivation, and how this differed depending on the cash crop. When the odds ratio is <1.00, CCs are planted significantly less frequently, and when the odds ratio is >1.00, they are planted significantly more frequently compared to the reference (heading in italics), provided that the confidence limit does not include the value 1.00.
Farm Size Compared to ≥100 haOR95% CL
Across all cash crops (p < 0.001) *
<30 ha0.520.500.54
30–59 ha0.690.670.71
60–99 ha0.810.780.84
Barley as a cash crop (p < 0.001)
<30 ha1.221.121.33
30–59 ha1.151.071.24
60–99 ha1.050.981.13
Spring wheat as a cash crop (p = 0.03)
<30 ha0.780.650.95
30–59 ha0.940.811.09
60–99 ha1.040.911.20
Cereal-legume intercrop as a cash crop (p < 0.01)
<30 ha0.280.130.61
30–59 ha0.320.150.69
60–99 ha0.660.301.44
* For organic farms (p < 0.001) the farm size for all cash crops in descending order of OR: 30–59 ha (OR 2.04) → 60–99 ha (OR 1.92) → <30 ha (OR 1.66) → ≥100 ha (OR 1.00).
Table 5. Odds ratios (OR) with 95% confidence limits (CL) showing the impact of the field parcel size on the probability that a conventional farmer has planted cover crops (CCs) on parcels by applying for the agricultural payment for their cultivation, and how this differed depending on the cash crop. When the odds ratio is <1.00, CCs are planted significantly less frequently, and when the odds ratio is >1.00, they are planted significantly more frequently compared to the reference (heading in italics), provided that the confidence limit does not include the value 1.00.
Field Parcel Size Compared to ≥5 haOR95% CL
Across all cash crops (p < 0.001)
<0.5 ha0.440.410.47
0.5–0.9 ha0.540.510.56
1.0–2.9 ha0.690.660.72
3.0–4.9 ha0.860.830.90
Barley as a cash crop (p < 0.001)
<0.5 ha0.650.570.75
0.5–0.9 ha0.690.620.76
1.0–2.9 ha0.780.720.84
3.0–4.9 ha0.870.790.96
Oats as a cash crop (p < 0.001)
<0.5 ha0.710.610.83
0.5–0.9 ha0.770.690.87
1.0–2.9 ha0.800.720.89
3.0–4.9 ha0.910.811.02
Spring wheat as a cash crop (p < 0.001)
<0.5 ha0.670.510.88
0.5–0.9 ha0.730.600.88
1.0–2.9 ha0.670.580.78
3.0–4.9 ha0.900.761.06
Cereal intercrop as a cash crop (p = 0.03)
<0.5 ha0.410.230.73
0.5–0.9 ha0.570.350.91
1.0–2.9 ha0.600.390.90
3.0–4.9 ha0.730.461.17
Rapeseed as a cash crop (p < 0.001)
<0.5 ha0.690.222.14
0.5–0.9 ha0.230.110.52
1.0–2.9 ha0.340.180.63
3.0–4.9 ha0.720.361.45
Table 6. Odds ratios (OR) with 95% confidence limits (CL) showing the impact of the distance to the farm center on the probability that a conventional farmer has planted cover crops (CCs) on field parcels by applying for the agricultural payment for their cultivation, and how this differed depending on the cash crop. When the odds ratio is <1.00, a CC is planted significantly less frequently, and when the odds ratio is >1.00, it is planted significantly more frequently compared to the reference (heading in italics), provided that the confidence limit does not include the value 1.00.
Distance to Farm Center Compared to <0.3 kmOR95% CL
Cereal–intercrops as a cash crop (p = 0.01)
>5.0 km1.811.162.84
1.2–5.0 km1.320.911.90
0.3–1.19 km0.990.711.39
Cereal–legume intercrop as a cash crop (p = 0.02)
>5.0 km1.330.463.87
1.2–5.0 km0.910.461.81
0.3–1.19 km2.161.154.04
Potatoes as a cash crop (p = 0.03)
>5.0 km0.560.340.92
1.2–5.0 km0.690.490.99
0.3–1.19 km0.960.691.32
Winter wheat as a cash crop (p = 0.04)
>5.0 km0.290.130.68
1.2–5.0 km0.680.351.35
0.3–1.19 km0.700.381.29
Green fodder as a cash crop (p < 0.01)
>5.0 km3.631.409.40
1.2–5.0 km3.721.757.91
0.3–1.19 km3.151.705.85
Table 7. Odds ratios (OR) with 95% confidence limits (CL) showing the impact of ownership of a field parcel on the probability that a conventional farmer has planted cover crops (CCs) on parcels by applying for the agricultural payment for their cultivation, and how this differed depending on the cash crop. When the odds ratio is <1.00, a CC is planted significantly less frequently, and when the odds ratio is >1.00, it is planted significantly more frequently compared to the reference (heading in italics), provided that the confidence limit does not include the value 1.00.
Compared to Owned Field ParcelOR95% CL
Across all cash crops (p < 0.001)
Leased parcel1.101.071.13
Oats as a cash crop (p < 0.01)
Leased parcel0.910.860.97
Spring wheat as a cash crop (p < 0.01)
Leased parcel0.840.750.94
Winter wheat as a cash crop (p < 0.001)
Leased parcel0.390.240.64
Table 8. Odds ratios (OR) with 95% confidence limits (CL) showing the impact of some significant field parcel characteristics on the probability that a conventional farmer has planted cover crops (CCs) on field parcels by applying for the agricultural payment for their cultivation depending on cash crop. When the odds ratio is <1.00, a CC is planted significantly less frequently, and when the odds ratio is >1.00, a CC is planted significantly more frequently compared to the reference (heading in italics), provided that the confidence limit does not include the value 1.00.
Field Parcel CharacteristicOR95% CL
Proximity to waterway (p < 0.001) compared to >300 m across all cash crops *:
Next to1.181.131.23
≤300 m1.121.091.15
Soil type (p < 0.001) compared to organic soils across all cash crops:
Coarse mineral soils1.191.131.23
Clay soils (Vertic Cambisol)1.351.281.42
Other clay soils1.361.291.43
Field slope (p < 0.001) compared to 2.9–6.99 across all cash crops:
<1.31.091.051.13
1.3–2.891.081.041.12
≥7.00.800.740.87
Field slope (p = 0.01) compared to 2.9–6.99 when potatoes as a cash crop:
<1.30.560.390.80
1.3–2.890.700.481.02
≥7.01.090.402.96
Field slope (p < 0.001) compared to 2.9–6.99 when winter-wheat as a cash crop:
<1.33.121.765.55
1.3–2.891.921.113.32
≥7.00.590.181.95
* For organic farms (p = 0.04) proximity to waterway across all cash crops: ≤300 m differed (OR 1.33) from >300 m (OR 1.00).
Publisher’s Note: MDPI stays neutral with regard to jurisdictional claims in published maps and institutional affiliations.

