Abstract
Four (04) different types of clays from Burkina Faso were studied for their potential applications in the production of calcined clays as substitution materials for Portland cement. The study aimed at analyzing the factors affecting their reactivity. The untreated clays were subjected to various tests to highlight the intrinsic properties that can influence their reactivity. After the treatment by calcination, the clays were subjected to various pozzolanicity tests and microstructural analysis in order to evaluate their influence on the microstructure of the cement paste. The results showed that the reactivity of calcined clays is strongly related to the intrinsic properties of the raw clays, such as the content and the structure of kaolinite: disordered kaolinite reacts better than ordered kaolinite. After the calcination, the reactivity depends on the amorphous phase (amorphous content) of the clays, which influences the strength activity index. This study established a correlation between different parameters to easily identify the main properties of calcined clays that can influence their pozzolanic reactivity. All the results showed that the kaolinite content is a determining factor in the reactivity of clays before calcination. However, the study showed that the amorphous content of kaolinite is the determining parameter of the reactivity of calcined clays, as calcination can lead to the recrystallization of kaolinite.
1. Introduction
The world’s demography has experienced remarkable growth in recent years, accompanied by the need for housing and infrastructure. As the world has evolved, the construction of modern housing has been heavily based on the use of Portland cement. Thanks to its mechanical, physical and durability properties, Portland cement remains one of the most widely used materials in construction. This has led to the proliferation of cement industries throughout the world. Portland cement maintains its strength thanks to the “clinker”, which constitutes a major constituent of its composition, depending on the class of cement. However, the clinker manufacturing process is very energy-intensive and generates a lot of carbon dioxide (CO2). It should be noted that the cement industries contribute an estimated 5% of global CO2 emissions [1,2,3,4]. Thus, in recent years, efforts have been made to limit the environmental impact of cement production. The aim is to find natural or artificial materials that meet certain criteria to be used as total or at least partial substitutes for clinker, or as supplementary cementing materials (SCMs).
Numerous studies have shown that industrial by-products, such as silica fume, fly ash, rice husk ash or simply natural materials, such as tuff, granite dust and limestone fillers, among others, meet the specific criteria of reactivity and/or filler [5,6,7,8,9]. These by-products can therefore be used as partial substitutes for clinker or supplementary cementing materials. One of the solutions for reducing CO2 emissions in cement manufacturing is to use metakaolin, which is generally a calcined clay [8]. Many authors have evaluated the usage of calcined clays as partial substitutes or supplementary cementing materials. The results have shown that clays rich in kaolinite are the most reactive when they are activated [10].
Chakchouk et al. [11] studied different types of clays and showed that the clays containing the highest content of kaolinite give better mechanical strength resulting from their reactivity. Cardinaud et al. [12] showed that kaolinite content is a determining factor in a binary system (clinker + calcined clay), while it does not affect long-term performance in a ternary system (clinker + limestone + calcined clay). It should also be noted that kaolinite content is not the only factor that influences reactivity. Many authors have highlighted the influence of calcination temperature, calcination time and calcination mode on the reactivity of clays. Indeed, a temperature range from 650 °C to 800 °C would be the most favorable for the transformation of kaolinite into an amorphous and reactive phase of metakaolinite [13,14,15]. In addition to the calcination, the reactivity of clays also depends on their ordered or disordered crystalline structure and their fineness [10,16,17]. Zolfagharnasab et al. [18] have shown that the reactivity of clays depends not only on the kaolinite content and calcination temperature, but also on their crystallinity. Indeed, the calcined kaolinite clays contain amorphous alumina-siliceous minerals with disordered structures that can easily react with portlandite (CH). This results in the formation of secondary calcium silicate hydrates (CSH) and calcium alumina-silicate hydrates (CASH) in additional to the primary hydration products of cement [19]. Argin et al. [20] have shown that combining calcined clay with calcium hydroxide as a cement replacement increases the reactivity of calcined clays. They also noted that when the calcination temperature is high, the kaolinite content decreases. Zhao et al. [21] showed another approach towards improving reactivity by combining calcined clay with synthetic C-S-H seeds in substitution for Portland cement. This approach showed that the reactivity of calcined clays is accelerated in the presence of synthetic C-S-H seeds. Analysis of the mineralogical and chemical compositions and of some physical properties in previous studies has shown that the calcined clays presenting good reactivity are characterized by a higher content of kaolinite and a smaller fineness (Table 1).

Table 1.
Mineralogical and chemical and physical properties of calcined clays in previous studies.
It is therefore not easy to determine exactly the main factors that affect the reactivity of clays, especially since they generally come from different sources. CSH and CASH products are mainly responsible for the development of mechanical resistance and durability properties in cement. Therefore, many studies have commonly used the development of the strength and strength activity index of cement and additions as the main parameter for the assessment of the pozzolanic reactivity of those additions. The proceedings of the third international conference on calcined clays included a set of works on the reactivity parameters of different clays [22]. Most of the works have linked the reactivity of clays to the kaolinite content, and few have tried to couple several techniques for the assessment of the reactivity of calcined clays.
The aim of this paper was to determine the parameters that influence the pozzolanic reactivity of clay materials. This was achieved based on the analysis of various parameters, other than the strength activity index, of at least four types of clays before and after calcination. The aim was specifically to study some geotechnical properties of raw clays, their mineralogical compositions and the degree of disorder of their mineralogical structures before calcination. After calcination, the amorphous phase of the clays was determined by the amorphous content test to analyze its influence on the development of compressive strength. Furthermore, the study analyzed the pozzolanicity of calcined clays and assessed their influence on the microstructure and strength of the cement matrix. Thus, the originality of this work was on the one hand to analyze various samples in order to better identify the main factors of reactivity, and on the other hand, to establish a correlation between the different parameters in order to determine the simplest/most appropriate and most suitable techniques for determining the reactivity of clays.
2. Materials and Experimental Method
2.1. Raw Materials
Four different types of clays denoted as A1, A2, A3 and A4 were collected from different locations in Burkina Faso (Figure 1). Clays A1 and A3 were collected, respectively, from the regions of Wamtenga and Tougou, and A2 and A4 from the region of Titao. On site, samples were extracted from a depth of 1 m at different points. In the laboratory, the samples from the same site were homogenized. A fraction of the samples was washed and sieved on a 400 µm sieve for the geotechnical analyses. Another fraction of samples was crushed/grounded and sieved on an 80 µm sieve for calcination and usage in the rest of the study.
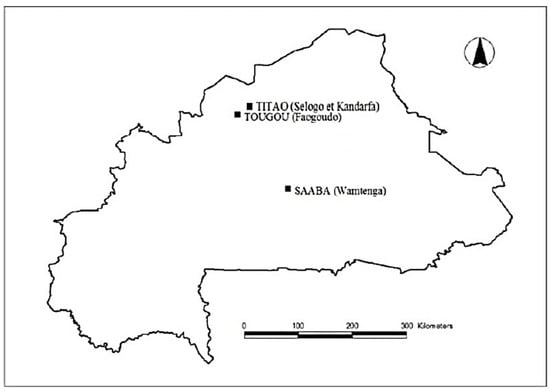
Figure 1.
Geographical locations of clay quarries [23].
The cement CEM I 42.5 R, produced by CIMFASO, was used for control purposes and substitutions with calcined clays, according to the EN 197-1 standard [24]. It was subjected to chemical and mineralogical characterization and particle size analysis. The chemical composition was determined by ICP-OES (Inductively Coupled Plasma-Optical Emission Spectrometry) using the Perkin Elmer TM optima 7000 DV type equipped with a CCD sensor. The chemical composition and some physical properties of cement are presented in Table 2. Table 2 shows that the major constituents of CEM I are calcium and silicon oxides, which form alite, as identified in the XRD (Figure 2). CEM I also contains alumina and ferric oxide, forming C4AF. Some traces of sulfur (probably from gypsum), magnesium and other minor elements were also detected. The XRD analysis presented in Figure 2 shows that CEM I is mainly composed of alite (C3S), some ferrite (C4AF), calcite (CaCO3) and a few traces of gypsum (CaSO4·H2O) to regulate setting. The mineral composition is in good agreement with the chemical composition. Thus, the presence of C3S in high contents could induce high mechanical strength in the cement, specifically at a younger age. For all mortar formulations, a superplasticizer of type Sika ViscoCrete Krono-951 was used at 0.5% content of the mass of the binder.
Table 2.
Chemical composition and physical properties of the cement CEM I.
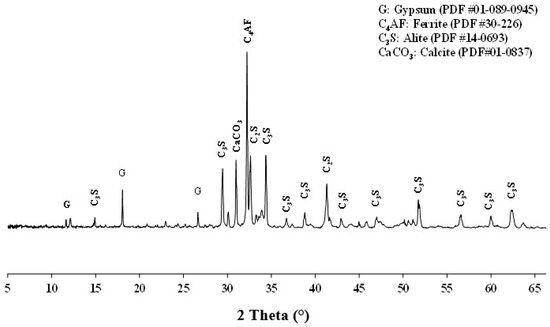
Figure 2.
X-ray diffraction of CEM I.
2.2. Experimental Method
2.2.1. Geotechnical Analysis
The geotechnical analysis of the clays consisted of determining the Atterberg limits according to the standard NP 94-051 [25]. The Atterberg limits allowed the positioning of the clays on the Holtz and Kovacs diagram [11,26]. The positions on this diagram provide some preliminary information on the main constituents in clay minerals.
2.2.2. Microstructural Analyses: Set-up of Calcination Conditions and Monitoring of Hydration
Before characterization, all the samples were ground to 80 µm using a type RS200 vibratory crusher (Haan, Germany). After grinding, the samples were subjected to various microstructural analyses: X Ray diffraction (XRD), infrared spectroscopy and thermogravimetric analysis (TGA). XRD was performed to identify the mineral composition of the samples. The acquisition of X-ray diffraction (XRD) patterns was performed using a D8 Advance diffractometer (Bruker, Mannheim, Germany) equipped with CuKα radiation (λKα = 0.154186 nm), at a step size of 0.02° (2θ) between 5° and 70° (2θ), and a step time of 1.3 s. The XRD data were analyzed using EVA software 13.0.0.3. The infrared (IR) analysis was performed using a ThermoFisher Scientific IS50 spectrometer in ATR (Attenuated Transmittance Resonance) mode. This test allowed determination of the amorphous, semi-amorphous or crystallized structure of the samples from different approaches. The TGA was performed using a Setaram Setsys device, in the temperature range between 30 and 1100 °C, with a heating rate of 10 °C/min under air environment at a flow rate of 20 mL/min. For each sample, the initial mass was 50 mg. This analysis was used to determine the kaolinite content in each sample and the appropriate range of calcination temperature.
- Treatment and analysis of the composition of calcined clays
Following the TGA, the temperature of calcination of the clays was set at 700 °C. The calcination was conducted on clays ground and sieved on 80 µm, in an electric furnace in two phases: three hours of temperature increase from the ambient temperature (30 °C) to 700 °C, and three hours at the soaking temperature (700 °C), followed by cooling in the furnace. After the calcination, the clays were analyzed for chemical and mineral compositions using X Ray fluorescence, XRD, TGA and IR. The physical properties were also characterized: the particle size analysis was carried out by laser diffraction using Malvern Mastersizer 200 device using the dry method. The specific gravity was determined using a helium pycnometer. The specific surface area was determined by Blaine method.
- Monitoring of the hydration of the paste of the mix of cement and calcined clays
A hydration monitoring was conducted to analyze the influence of additions (calcined clays) on the microstructure of cement paste. For this purpose, the pastes were prepared at the same consistency by mixing 75% CEM I and 25% calcined clay by mass percentage. The water demand for reaching normal consistency evolved in the range of 0.35 to 0.33 for clay A to A4. A 100% CEM I paste was used as a reference. After mixing, the pastes were kept in sealed plastic boxes to avoid water evaporation. After 28 days of hydration, all samples were ground under the same conditions to the same fineness (80 µm) and subjected to XRD and TGA using the same method and equipment.
2.2.3. Pozzolanicity
The ASTM C618 standard [27] defines a “pozzolan as a material which in itself has no binding properties, but which, under certain conditions of temperature and humidity, can react with calcium hydroxide to form compounds with binding properties”. Firstly, the pozzolanicity of an addition is assessed based on its chemical composition. The standard stipulates that the sum in mass percentages of the oxides (SiO2 + Al2O3 + Fe2O3) contained in the addition must be greater or equal to 70%, the mass content of SO3 must be less than or equal to 4% and the glass content (%SiO2 + %CaO) must be ≥34%. Secondly, for a 25% substitution rate in the cement, the addition must have a strength activity index at 7 and 28 days of at least 75%. If these two conditions are verified, the material can be considered as Class N pozzolan. Therefore, this method was used to assess the pozzolanicity of calcined clays. Additional methods, both qualitative and quantitative, such as the amorphicity test, Frattini test, modified Chapelle test and electrical conductivity were used to confirm the pozzolanicity of the calcined clays.
- Amorphicity test
Calcination is the process of amorphization of materials, so after this process it is important to determine their amorphous phases. The determination of the amorphous phase consists of monitoring the dissolution kinetics of aluminosilicates in a solution of hydrofluoric acid at 1% volumetric concentration. This test was developed by Keyser in the ceramics domain, and previously used by Sore [23] for the assessment of the amorphicity of calcined clays. It consisted of introducing 1 g (m1) of the sample of calcined clays which passed through an 80 µm sieve into 200 mL of the acidic solution and keeping it therein for 40 min. The solution was filtered, the residue was dried in an oven at 105 °C for 24 h and a second mass m2 was weighed. The amorphous content (AC) was determined using Equation (1).
- Frattini test
In the Frattini test, the aqueous solution containing samples of calcined clays was made from 20 g of blended binder (15 g of CEM I and 5 g of calcined clay) and mixed with 100 mL of distilled water. The samples were left to cure for 7, 14 and 28 days in sealed containers and kept in an oven at 40 °C. At the test time, the samples were filtered through an 8 µm pore-size filter paper and cooled to ambient temperature. The filtrate was analyzed by titration to determine the concentration of OH− using 0.1 mol/L HCl solution with methyl orange indicator, and the concentration of CaO was analyzed by pH adjustment to 12.5 followed by titration with 0.03 mol/L EDTA (Ethylenediaminetetraacetic acid) solution. This test compares the concentrations of CaO and OH− ([CaO], [OH−]) contained in the aqueous solution at 7, 14 and 28 days of hydration with the solubility curve in an alkaline solution at the same temperature. According to the EN 196-5 [28], the sample is considered as active pozzolan when the couple ([CaO], [OH−]) is under the solubility curve. The calcium ion saturation curve is given by Equation (2).
- Modified Chapelle test
This test consists of putting the calcined clay in a saturated lime solution and evaluating its pozzolanic reactivity by the quantity of lime it can fix. According to the conformity criteria of metakaolin of the NF P 18-513 standard [29], the minimum quantity to be fixed is 630 mg per gram of addition. The test consists of preparing a solution in which 1 g of calcined clay and 2 g of CaO are added to 250 mL of water at 90 °C in a plastic bottle. After 16 h storage in an oven (90 °C), the solution is cooled to room temperature and filtered. A measurement of 25 mL of the filtrate is titrated with a 0.1 mol/l HCl solution using phenolphthalein as indicator, while 25 mL of the white solution (calcined clay-free), prepared under the same conditions by dissolving 60 g of sucrose in 250 mL of water, is also titrated under the same conditions. The quantity of lime fixed by the calcined clay is given by Equation (3); where V1 and V2 represent the volumes of HCl used to titrate, respectively, the white solution of sucrose and the solution with calcined clay.
- Electrical conductivity
This test was proposed by Luxan et al. [30] and modified by Yu et al. [31]. This test consists of dissolving 2 g of the addition in 200 mL of a saturated lime solution and measuring the evolution of the electrical conductivity of the solution over time. The principle of this test is based on the hypothesis that the electrical conductivity of the aqueous solution is controlled by the presence of Ca2+ ions released by the lime. In the presence of the mineral addition, the Ca2+ ions are fixed by the silica and/or alumina contained in the addition. This decreases the concentration of Ca2+ ions and consequently results in a decrease in the electrical conductivity of the solution. The reactivity of the addition is evaluated by the decrease in the electrical conductivity of the solution.
- Strength activity index
The strength activity index is calculated from the compressive strength of a standard mortar. The standard mortar is produced as described by the EN 196-1 standard [32], mixing 1350 g of standard sand, 450 g of cement CEM I and 225 g of water. Test mortars are prepared by substitution (mass substitution) of 25% CEM I for each type of calcined clay, e.g., 337.5 g of CEM I for 112.5 g of calcined clay, keeping the other constituents the same. All samples were demolded after 24 h and stored to cure in lime-saturated water at 20 °C with relative humidity at 100%, and crushed at 7, 14, 28 and 90 days to determine their compressive strengths. The strength activity index (SAI), expressed as a percentage, is defined by Equation (4); where CSi (MPa) and CS0 (MPa) respectively represent the strength of the test mortar and the control mortar.
3. Results and Discussion
3.1. Geotechnical and Physical Properties of Clays
The geotechnical properties of clay materials before calcination are listed in Table 3. These results indicate that the first three clay materials (A1, A2, A3) have the highest plasticity indexes (17–22), while the clay material A4 has the lowest plasticity index (8). Thus, the first three materials may have a higher content of clay minerals, while the last material has a lower plasticity index and thus possibly lower content of clay minerals [11,33].
Table 3.
Geotechnical properties of the non-calcined clay materials.
According to their liquidity limits and plasticity indexes, the clay materials were positioned in the diagram of Holtz and Kovacs (Figure 3). It indicates that A1 and A3 are located within the boundaries of the illite domains. Sample A2 is within the boundaries of the kaolinite domain and could therefore be mostly composed of this clay mineral. However, A4 is not in any of the domains in the diagram. This may suggest that this clay contains very low contents of clay minerals. However, these results will be confirmed by XRD and infrared analyses.
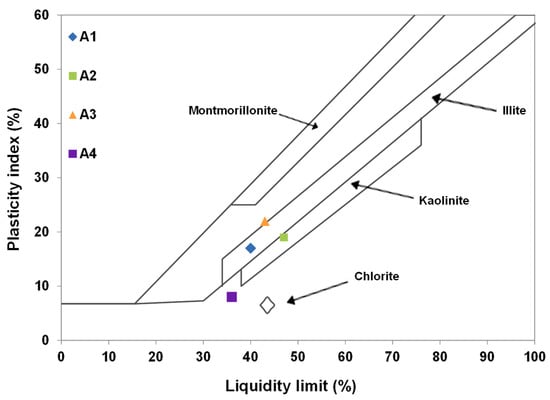
Figure 3.
Position of the clay materials on the diagram of Holtz and Kovacs.
The physical properties were measured after the calcination of the clays. The results show that all the calcined clays had a specific density of 2.62–2.68, Blaine specific surface area of 4480–6610 cm²/g. Sample A1 had the highest specific surface area (6608 cm²/g), which was indeed justified by its smallest particle diameter corresponding to 10% passing (D10 of 0.89 µm), median diameter (D50 of 2.78 µm) and diameter corresponding to 90% passing (D90 of 7.54 µm) compared to other samples. This suggests that A1 would be more reactive than other samples, given the highest degree of fineness of the sample.
3.2. Microstructural Characteristics of Non-Calcined Clay
3.2.1. Thermogravimetric Analysis of Non-Calcined Clays
Thermal analysis facilitates understanding of the different phase changes that occur in the structure of clays under the effect of temperature. The purpose of this test was to determine the optimal activation temperature for the calcination in order to produce more reactive additions. The results of the tests are shown in Figure 4.
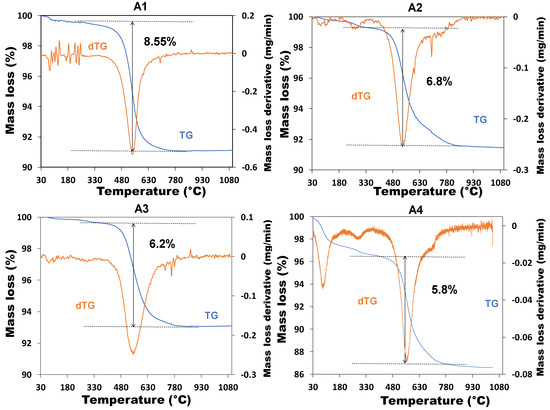
Figure 4.
Thermograms of non-calcined clay.
The analysis of the results focused on the temperature range corresponding to the dehydroxylation of the kaolinite (400–700 °C). For all samples, the transformation of kaolinite took place at temperatures ranging from 500 °C to 700 °C, which was in agreement with the literature [34,35]. In this temperature range, the transformation by dehydroxylation of the kaolinite was accompanied by significant mass losses in different amounts for different samples. The mass loss was estimated at 8.6%, 6.8%, 6.2% and 5.8%, respectively, for the clay materials A1, A2, A3 and A4. This corresponded to the loss of water from the hydroxyl groups in the kaolinite minerals in each sample, which led to the restructuring of kaolinite into metakaolinite [17]. It showed that A1 and A4 respectively undergo the highest and lowest loss of water related to kaolinite.
From these mass losses relative to the dehydroxylation of the kaolinite, the content of kaolinite was calculated using Equation (5), where TKaolinite (%) represents the content of kaolinite, PM (%) represents the loss in mass related to the dehydroxylation of kaolinite calculated from the TGA, MK (258.16 g/mol) represents the molar mass of the kaolinite and Mwater (18.02 g/mol) the molar mass of the water.
Table 4 shows that all the samples had kaolinite content greater than 40%, while sample A1 had the highest kaolinite content (61.3%), and A4 had the lowest content (41.6%). Several authors agree that this is the minimum content of kaolinite (40%) for good pozzolanic reactivity [22]. Therefore, the sample A1 was likely to be more reactive compared to the other samples. In view of the results of the thermal analysis, the calcination of clays was set at a temperature of 700 °C.
Table 4.
Estimation of the content of kaolinite in clay.
3.2.2. Mineral Composition of Non-Calcined Clays
The X-ray diffraction allowed the identification of crystallized minerals present in the clays. Figure 5 indicates that all the samples contained mostly kaolinite, characterized by the intensity of the diagnostic peak at 12°. However, the peak intensity of the kaolinite in sample A4 was extremely low, which suggests a low content of kaolinite, contrary to A1. These results confirm those of the thermal analysis. Following these results, it could be expected that sample A1, followed by A2 and A3, would be highly reactive. Sample A4 had the lowest kaolinite content compared to the others, therefore could show the lowest reactivity compared to the others.
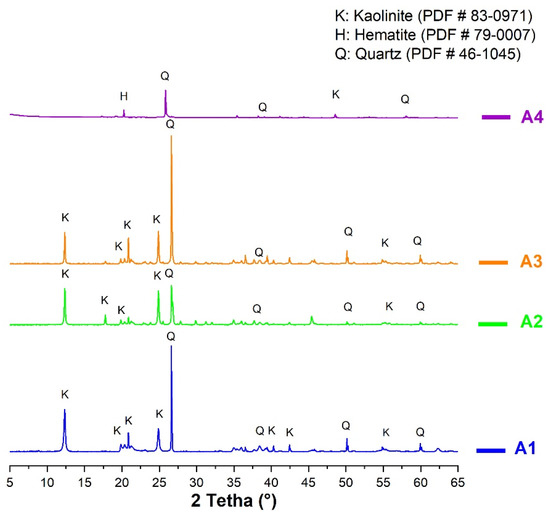
Figure 5.
X-ray diffraction of non-calcined clays.
3.2.3. Infrared Analysis of Non-Calcined Clays
Infrared analysis is commonly used to identify minerals in clay materials, their structures and possibly the different variations in their structures [36]. In the structure of clay minerals, the absorption bands of the O-H and Si-O groups play an important role in their identification [16]. The spectrum corresponding to kaolinite is characterized by bands between 1000 and 900 cm−1 and bands between 3700 cm−1 and 3600 cm−1 [15,36].
Figure 6 clearly indicates, for all samples, the appearance of bands corresponding to kaolinite, with stronger intensities for sample A1 and weak intensities for other samples. Based on the study of Truche [33], the spectra are similar to those of a synthetic illite/kaolinite mixture with a predominance of kaolinite, because these spectra are closer to those of pure kaolinite (bands at 915 and 1015). This observation, although qualitative, confirms the results of the geotechnical and XRD analyses.
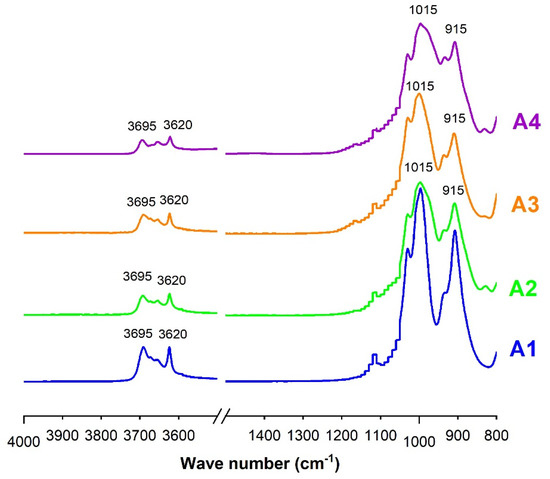
Figure 6.
Infrared spectra of non-calcined clays.
Vaculikova et al. [16] have proposed a quantitative approach for the assessment of the ordered or disordered structure of kaolinite. This approach is based on the calculation of two crystallinity indices, CI1 and CI2, from the vibration bands corresponding to wave numbers 3695 cm−1, 3620 cm−1 and 915 cm−1. This approach considers the vibrations of the O-H bonds of kaolinite and the vibrations of the Si-O-Si bonds, which correspond to kaolinite and/or quartz. The indices CI1 and CI2 are defined by Equations (6) and (7), where I3695, I915 and I3620 correspond to the absorbance intensities at 3695 cm−1, 915 cm−1, and 3620 cm−1, respectively. From the values of CI1 and CI2, the clay is classified as badly ordered when CI1 < 0.7 and CI2 > 1.2, partially orderly when 0.7 < CI1 < 0.8 and 0.9 < CI2 < 1.2, and ordered when CI1 > 0.8 and CI2 < 0.9.
Another numerical approach for the assessment of the structural crystallinity of kaolinite has been proposed by Bich et al. [15]. This consists of calculating two crystallinity indices, P0 and P2. P0 is defined as the ratio of the transmittance intensity at 3620 cm−1 and 3700 cm−1. P2 is defined as the ratio of the intensity at 3670 cm−1 and 3650 cm−1. This approach only considers the vibration bands of the O-H bonds of kaolinite. Thus, the structure of the kaolinite is well ordered when P0 > 1 and P2 < 1. However, in a disordered structure, the intensity of transmittance at 3670 cm−1 disappears, and thus P2 cannot be calculated; therefore the structure assessment is based on P0 only [36].
Table 5 shows that all samples showed disordered structures, regardless of the considered approach. Thus, all samples were expected to have a reactivity. However, there was a certain contrast in the assessment of the structure of sample A1, which was classified as disordered by the approach of Bich et al. [15] and partially ordered by Vaculikova et al. [16]. The Bich approach can be regarded as more accurate, because it is based on the O-H bonds of kaolinite. However, this should be confirmed by the various results from pozzolanicity tests.
Table 5.
Degree of disorder and ranking of non-calcined clays calculated from infrared analysis.
3.3. Pozzolanicity of Calcined Clays
3.3.1. Chemical Composition and Amorphicity of Calcined Clays
The chemical compositions of calcined clays are presented in Table 6. It shows that all the clays were rich in silica (SiO2 of 50–70%), alumina (Al2O3 of 20–40%) and ferrite (Fe2O3 of 1–5%), with some loss on ignition (LOI of about 1%). According to ASTM 618-05 [27], the pozzolanicity of the additions was based on their chemical composition; i.e., their content in SiO2, Al2O3, Fe2O3 and SO3. The compliance criteria are summarized in Table 6. It shows that all samples complied with the criteria SO3 < 4%, SiO2 + Al2O3 + Fe2O3 > 70%, SiO2 − CaO > 34% and LOI < 10%.
Table 6.
Chemical compositions of calcined clays.
Table 7 shows that the fraction of amorphous calcined clay was around 38–70%. Sample A1 had a higher amorphous rate (70%) than other samples (46% for A2, 42.7% for A3, 38.4% for A4). This suggests that sample A1 would potentially have the highest reactivity, given that amorphous additions are usually more reactive.
Table 7.
Amorphous content of calcined clays.
3.3.2. Frattini Test
The test was performed at 7, 14 and 28 days and the results are shown in Figure 7. The pozzolanic reactivity of a sample is characterized by the position of the points ([OH−], [Ca2+]) below the solubility curve. The results show that the pozzolanic reactivity of all the clays increased over time, i.e., more points are under the curve over time. This can be explained by the fact that the residual concentrations of OH− and Ca2+ ions decrease with the cement hydration and pozzolanic reaction of the additions. This reflects the pozzolanic reactivity of the clays, which consume these ions as they are produced [37,38]. At 7 days, only clay A1 is below the solubility curve, showing that this sample had a high reactivity kinetics compared to the other clays.
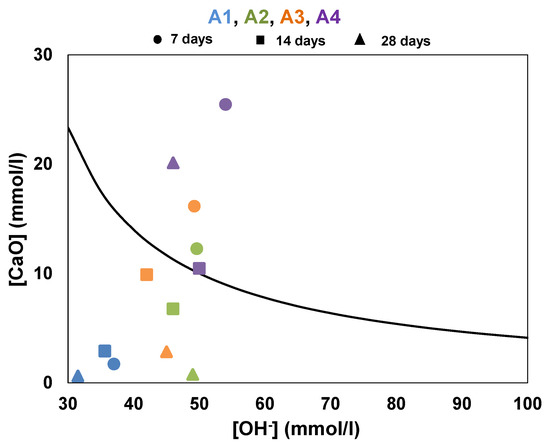
Figure 7.
Results of Frattini test on calcined clays at 7, 14 and 28 days.
For clay A4, the trend is slightly different; from 7 to 14 days, a decrease in the concentration of Ca2+ ions is observed, bringing it closer to the solubility curve. However, at 28 days, the concentration of Ca2+ ions increases again and point A4 moves far above from the solubility curve. This demonstrates its low reaction kinetics and the fixation capacity of portlandite produced by cement hydration. Thus, at 28 days, all clays were classified as pozzolanic except A4. This test shows that clay A1 was the most reactive, followed by clays A2 and A3.
3.3.3. Modified Chapelle Test
The results of the Chapelle test are presented in Figure 8. The results indicate that samples A1, A2 and A3 were above the minimum threshold (630 mg/g) set by NF P 18-513 [29] and therefore could be classified as for pozzolanic clays. Sample A1 stood out slightly from the others, and therefore could be considered as highly pozzolanic. Sample A4 was below the threshold and could not be considered as pozzolan. These results confirm those of the amorphous rate and Frattini test.
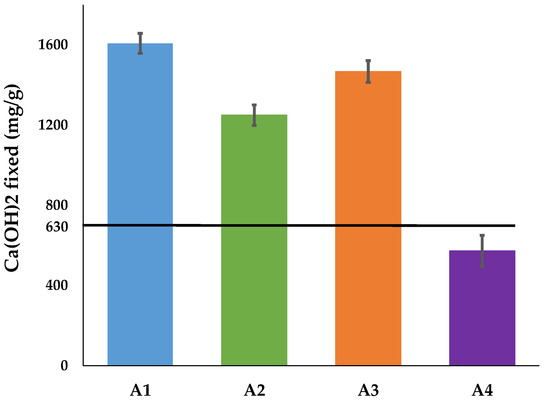
Figure 8.
Results of the Modified Chapelle test on calcined clays.
3.3.4. Electrical Conductivity
Figure 9 shows the results of the electrical conductivity test. Conductivity measurements were taken at shorter time intervals at the beginning to evaluate the reactivity kinetics of the additions in the early stages.
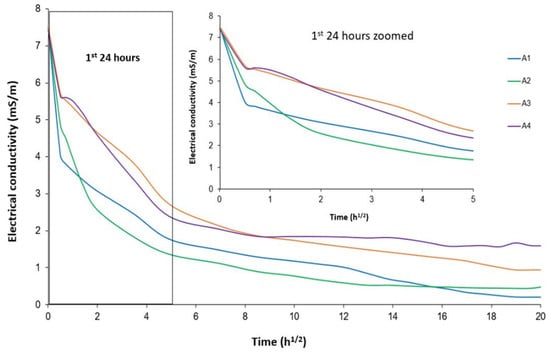
Figure 9.
Electrical conductivity of calcined clays solution.
These results show that, for all samples, the electrical conductivity of the solutions decreased very quickly in the first 24 h and stabilized very slowly. The decrease in electrical conductivity was related to the decrease in the ions (Ca2+, OH−) in the solutions. This reflects the strong kinetics of all samples to fix the portlandite dissolved in the solution [31]. The most reactive clay would consume the highest number of these ions and at the highest rate. For clay A4, from 72 h onwards, the conductivity stabilized and only decreased slightly, while it continued to decrease for the other samples. This confirms the results from the Frattini test, which showed the reactivity of A4 occurred only in the first few days and stabilized thereafter. Up to 240 h, clay A2 still showed the decrease in electrical conductivity, and therefore seemed to be more reactive than A1. Beyond 240 h, clay A1 showed a continuous decrease in electrical conductivity, and therefore seemed to be more reactive than clay A4. This highlights that the higher content of kaolinite, which had a disordered structure in clay A1, made reaction possible at early and extended times compared to the other clays. Thus, in the long term, clay A1 had the best reactivity, followed by A2, A3 and finally A4.
3.3.5. Strength Activity Index (SAI)
Strength activity indices were calculated on the compressive strength of mortar tested at 7, 14, 28 and 90 days to assess the contribution of additions to the mechanical strength of cement mortar. The results are presented in Figure 10.
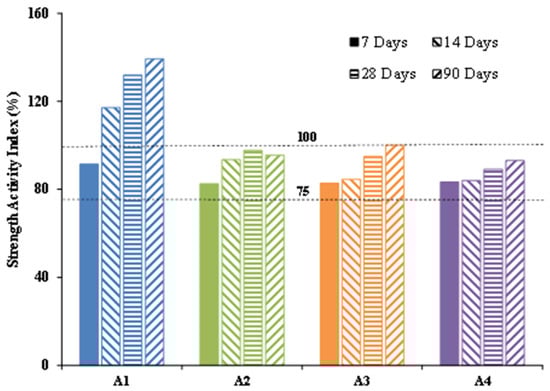
Figure 10.
Strength activity indices of calcined clays at 7, 14, 28 and 90 days.
For all the samples, the strength activity indices (SAI) were higher than 75% for all test times. According to ASTM C618-05 standard [27], all these clays were therefore classified as class N pozzolans. Moreover, the sample A1 clearly stood out from the others; it had an SAI far above 100% at 7 days and 140% at 90 days compared to other samples, whose SAI were below 100% even after 90 days. This confirms the various pozzolanicity tests, which pointed out that sample A1 had better pozzolanic reactivity than other samples.
At 7 days, all the samples showed a SAI below 100% (91% for A1, 82% for A2, 82% for A3 and 83% for A4) with respect to the control. However, this decrease was less than 25%. This means that none of the samples were inert, otherwise the dilution effect would have reduced the SAI to less than 75% [39]. From 14 days, only the strength of sample A1 evolved very quickly to reach an SAI higher than 100%. This confirms the Frattini test, which showed that sample A1 presented a kinetics of reactivity higher than the others. Samples A2 and A3 also reacted over time, but only to a limited extent. Indeed, in the presence of a highly reactive addition, pozzolanic activity continues on the long term and leads to the formation of additional hydrates, contributing to the densification of the microstructure, which consequently results in an improvement in mechanical performance.
3.4. Hydration Monitoring and Microstructural Changes in Cement Paste
The results of the hydration monitoring are shown in Figure 11 and Figure 12. The analyses were carried out on the samples cured for 28 days. Figure 11 shows that the main hydration products identified by the XRD were portlandite (CH), calcium silicate hydrate (CSH) and calcium aluminosilicate hydrate (CASH). The analysis also reveals the presence of calcite (CaCO3), ettringite and quartz. The abundance of CASH in the cement pastes containing calcined clays shows that the aluminasilicates contained in the calcined clays reacted with the portlandite to form additional CSH and CASH. This hypothesis is confirmed by the occurrence of new CASH-related (11°, 21°, 34° and 39°) peaks that do not exist on the diffractograms of the control sample (Figure 11). This confirms the pozzolanic reactivity of all clays. By focusing on the peaks corresponding to the portlandite (16°), it appears that the intensity of these peaks decreases in the presence of calcined clays. This constitutes an indicator of the consumption of portlandite through its pozzolanic reaction with the calcined clay. Moreover, it is obvious that the peak intensity of portlandite was lowest in the pastes containing sample A1 compared to other samples. This also indicates a better consumption of portlandite by sample A1, given its higher reactivity than other samples.
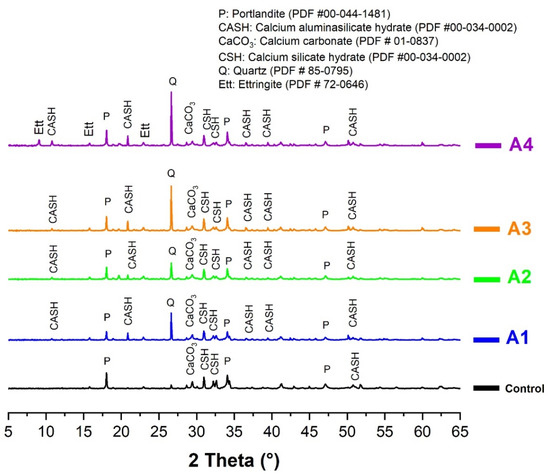
Figure 11.
XRD spectra of cement pastes made of CEM I and A1, A2, A3 and A4 cured at 28 days.
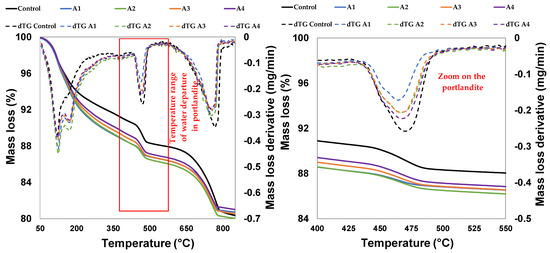
Figure 12.
Thermograms of cement pastes made of CEM I and A1, A2, A3 and A4 cured at 28 days.
Qualitative and quantitative approaches are well known for the identification of portlandite and CaCO3. However, the identification and quantification of CSH and CASH remain complex, so this part of the work was based on the monitoring of portlandite (through TGA) which reflected the pozzolanic reaction of the calcined clays. Figure 12 shows the dehydration of the portlandite (CH) in the control paste and the pastes with different calcined clays, as characterized by the mass loss between 440 °C and 500 °C. It shows that the mass loss corresponding to the control paste (CEM I) was higher than that of CEM I substituted by calcined clay. However, this decrease varied according to the type of calcined clay. It clearly appears that the mass loss was lowest with sample A1, followed by A2 and A3, and was highest with sample A4. From the thermograms, the residual portlandite contents were estimated and summarized in Table 8. It shows that the paste containing A1 had lower content of residual portlandite than the rest of the samples compared to the reference paste. These results confirm the results of all the pozzolanicity analyses. Thus, according to their ability to react with portlandite in cement, sample A1 is ranked reactive, followed by A2, A3 and A4.
Table 8.
Estimated residual portlandite content at 28 days from the TGA curve.
3.5. Synthesis of Results
This section summarizes the results of all the pozzolanicity tests. At the end of these different tests, a ranking of different clays was established and summarized in Table 9. In view of this ranking, clay A1 showed the highest reactivity throughout all the tests. This result could be attributed to its highest content of kaolinite, estimated before the calcination, and its highest amorphous content compared to other clays.
Table 9.
Classification of different clays.
The results show that kaolinite content is a determining factor in the reactivity of clays, since the A1 sample with the highest kaolinite content showed the highest reactivity. This is in agreement with the previous studies summarized in Table 1. Based on Bich’s approach [15], it can be concluded that the sample with the most disordered mineralogical structure presents the highest reactivity (Table 6). Thus, in addition to the parameters mentioned in Table 1, it is worth adding that the mineralogically disordered structure is one of the determining criteria in the reactivity of clays.
Figure 13 shows the correlations between some of the pozzolanicity parameters with the strength activity index (SAI). The correlations were proposed on the SAI and one parameter before calcination (kaolinite content) and two others after calcination (amorphous content and concentration of residual CaO from the Frattini test at 14 day). The choice of these parameters was based on the simplicity and rapidity of their implementation with respect to the SAI and the reliability of their results.
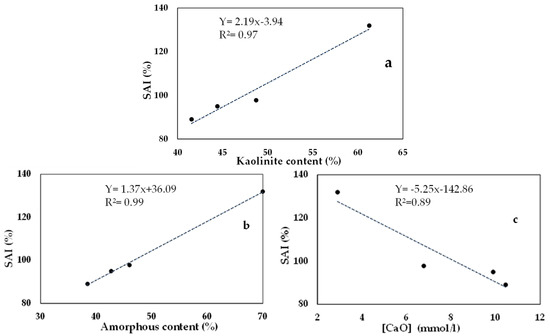
Figure 13.
Correlation of strength activity index: SAI and (a) kaolinite content, (b) amorphous content, and (c) concentration of residual CaO from Frattini test at 14 days.
These correlations show that before calcination, the kaolinite content is a determining criterion in the choice of potential calcined clay. They show that the SAI increases with the content of kaolinite in the clay (Figure 13a). It should also be noted that an ordered or disordered structure in kaolinite also influences reactivity. This is confirmed by the fact that the SAI increases with the amorphous content in the calcined clay (Figure 13b). After calcination, these correlations show that the capacity to fix portlandite (residual [CaO]) by the calcined clay is inversely related to its SAI (Figure 13c), and therefore to its amorphous content.
4. Conclusions
The present study assessed the suitability of clay, from at least 4 different sources and using various techniques, as an addition to cement. In view of the results from the different pozzolanicity tests on the clays before and after calcination, the following conclusions can be drawn:
- Form the geotechnical point of view, the plasticity of the clay before calcination suggests that clays A1, A2, and A3 contained clay minerals of kaolinite and/or illite. This was further confirmed by the mineralogical analyses, which showed that A1 and A4, respectively, contained the highest and lowest content of kaolinite.
- Before calcination, the analysis of the mineralogical parameters showed that the kaolinite content and the level of disorder in the structure of the clays were determining factors in their reactivities. This was suggested by the strength activity index which recorded the highest value for A1 and the lowest value for A4.
- After calcination, the pozzolanicity tests showed that the amorphous rate was the most important determining factor; indeed, the samples with the highest content of amorphous phase were the most reactive.
- The analysis of the microstructure revealed an occurrence of supplementary calcium aluminasilicates hydrate (CASH) in the pastes containing the calcined clays, contrary to the control paste. This qualitatively result highlights the reactivity of the samples without making a difference in their classification.
- The correlation established between some parameters with the strength activity index confirms that, before calcination, high content of kaolinite is the main parameter to look at in order to reach better mechanical performance. After calcination, the amorphous content is the determining parameter in the choice of calcined clays. This correlation could also allow assessment of the performances of additions in cement without having to perform mechanical tests on mortar.
- As a result of all these analyses, sample A1 was classified as the best clay among the four studied samples.
It can be concluded from the present study that, after analysis of four different clays, the kaolinite content and the amorphous phase are the determining parameters in the reactivity of clays, which is in agreement with the literature. In addition, since the amorphous content test is easier to perform than the mechanical test, the present study also endorses the substitution of amorphous content analysis for the strength activity index test in the prediction of the reactivity of clays.
According to the literature, the temperature of calcination and the degree of fineness are also identified as determining factors in the reactivity of calcined clays. The effects of these parameters could not be studied in this work. Thus, it is recommended to assess their influence on the reactivity of clays using various techniques. This will allow confirmation of the correlations established between different parameters at 700 °C and specific degrees of fineness.
Author Contributions
Conceptualization, C.R., A.M., S.O.S., E.P. and P.N.; methodology, C.R., A.M., S.O.S., E.P. and P.N.; formal analysis, C.R., A.M., S.O.S., E.P. and P.N.; investigation, C.R., A.M., S.O.S., E.P. and P.N.; writing—original draft preparation, C.R.; writing—review and editing, C.R., A.M., S.O.S., E.P. and P.N. All authors have read and agreed to the published version of the manuscript.
Funding
This research received no external funding.
Institutional Review Board Statement
Not applicable.
Informed Consent Statement
Not applicable.
Data Availability Statement
Not Applicable.
Acknowledgments
The authors would like to thank the Deutscher Akademischer Austrauschdienst (German Academic Exchange Service: DAAD-Germany) and Erasmus for their support provided during the entire experimental work.
Conflicts of Interest
The authors declare no conflict of interest.
References
- Gmür, R.; Thienel, K.C.; Beuntner, N. Influence of aging conditions upon the properties of calcined clay and its performance as supplementary cementitious material. Cem. Concr. Compos. 2016, 72, 114–124. [Google Scholar] [CrossRef]
- Barcelo, L.; Kline, J.; Walenta, G.; Gartner, E. Cement and carbon emissions. Mater. Struct. Constr. 2014, 47, 1055–1065. [Google Scholar] [CrossRef]
- Benhelal, E.; Zahedi, G.; Shamsaei, E.; Bahadori, A. Global strategies and potentials to curb CO2 emissions in cement industry. J. Clean. Prod. 2013, 51, 142–161. [Google Scholar] [CrossRef]
- Andrew, R.M. Global CO2 emissions from cement production, 1928–2017. Earth Syst. Sci. Data 2018, 10, 2213–2239. [Google Scholar] [CrossRef]
- Jani, P.; Imqam, A. Class C fly ash-based alkali activated cement as a potential alternative cement for CO2 storage applications. J. Pet. Sci. Eng. 2021, 201. [Google Scholar] [CrossRef]
- Kabre, S.; Savadogo, N.; Lawane, A.; Messan, A. Physical Mechanical Properties and Durability of Mortars Containing Tuff from Burkina Faso as Partial Substitution of CEM I. Am. J. Civ. Eng. Archit. 2018, 6, 46–53. [Google Scholar] [CrossRef][Green Version]
- Liu, F.; Shuhua, P.; Wang, H.; Kong, Y.; Ouyang, L. Effect of tuff powder on the hydration properties of composite cementitious materials. Powder Technol. 2020, 137974. [Google Scholar] [CrossRef]
- Ntimugura, F.; Sore, S.O.; Bello, L.; Messan, A. The Influence of Metakaolin from Saaba (Burkina Faso) over Physico-Mechanical and Durability Properties of Mortars. Open J. Civ. Eng. 2017, 389–408. [Google Scholar] [CrossRef]
- Ramadji, C.; Messan, A.; Prud’homme, E. Influence of granite powder on physico-mechanical and durability properties of mortar. Materials 2020, 13, 5406. [Google Scholar] [CrossRef]
- Tironi, A.; Trezza, M.A.; Scian, A.N.; Irassar, E.F. Assessment of pozzolanic activity of different calcined clays. Cem. Concr. Compos. 2013, 37, 319–327. [Google Scholar] [CrossRef]
- Chakchouk, A.; Samet, B.; Mnif, T. Study on the potential use of Tunisian clays as pozzolanic material. Appl. Clay Sci. 2006, 33, 79–88. [Google Scholar] [CrossRef]
- Cardinaud, G.; Rozière, E.; Martinage, O.; Loukili, A.; Barnes-Davin, L.; Paris, M.; Deneele, D. Calcined clay—Limestone cements: Hydration processes with high and low-grade kaolinite clays. Constr. Build. Mater. 2021, 277, 122271. [Google Scholar] [CrossRef]
- Wang, Y.; Shui, Z.; Huang, Y.; Sun, T.; Yu, R.; Wang, G. Improving the pozzolanic activity of metakaolin by urea intercalation technique. Constr. Build. Mater. 2018, 172, 19–28. [Google Scholar] [CrossRef]
- Danner, T.; Norden, G.; Justnes, H. Applied Clay Science Characterisation of calcined raw clays suitable as supplementary cementitious materials. Appl. Clay Sci. 2018, 162, 391–402. [Google Scholar] [CrossRef]
- Bich, C.; Ambroise, J.; Péra, J. Influence of degree of dehydroxylation on the pozzolanic activity of metakaolin. Appl. Clay Sci. 2009, 44, 194–200. [Google Scholar] [CrossRef]
- Vaculíková, L.; Plevová, E.; Vallová, S.; Koutník, I. Characterization and differentiation of kaolinites from selected czech deposits using infrared spectroscopy and differential thermal analysis. Acta Geodyn. Geomater. 2012, 8, 59–67. [Google Scholar]
- Konan, K.L.; Soro, J.; Andji, J.Y.Y.; Oyetola, S.; Kra, G. Etude comparative de la déshydroxylation/amorphisation dans deux kaolins de cristallinité différente Comparative study of dehydroxylation/amorphization in two kaolins with different crystallinity. J. Soc. Ouest-Afr. Chim. 2010, 30, 29–39. [Google Scholar]
- Zolfagharnasab, A.; Ramezanianpour, A.A.; Bahman-zadeh, F. Investigating the potential of low-grade calcined clays to produce durable LC 3 binders against chloride ions attack. Constr. Build. Mater. 2021, 303, 124541. [Google Scholar] [CrossRef]
- Wei, J.; Gencturk, B. Hydration of ternary Portland cement blends containing metakaolin and sodium bentonite. Cem. Concr. Res. 2019, 123, 105772. [Google Scholar] [CrossRef]
- Argın, G.; Uzal, B. Enhancement of pozzolanic activity of calcined clays by limestone powder addition. Constr. Build. Mater. 2021, 284, 122789. [Google Scholar] [CrossRef]
- Zhao, D.; Khoshnazar, R. Hydration and microstructural development of calcined clay cement paste in the presence of calcium-silicate-hydrate (C–S–H) seed. Cem. Concr. Compos. 2021, 122, 104162. [Google Scholar] [CrossRef]
- Bishnoi, S. RILEM Bookseries Calcined Clays for Sustainable Concrete. In Proceedings of the 3rd International Conference on Calcined Clays for Sustainable Concrete, New Delhi, India, 15–17 October 2019. [Google Scholar]
- Sore, S.O. Synthèse et Caractérisation Des Liants Géopolymères à Base Des Matériaux Locaux du Burkina Faso en Vue D’une Stabilisation Des Briques en Terre Comprimées (BTC). Ph.D. Thesis, Institut 2iE, Ouagadougou, Burkina Faso, 2017. [Google Scholar]
- EN 197-1A1; Ciments-Partie 1: Composition, Spécifications et Critères de conformité Des Ciments Courants; Association Française de Normalisatio: Saint-Denis La Plaine CEDEX, France, 2012.
- NF P 94-051; Sols: Reconnaissance et Essais-Détermination des Limites D’Atterberg-Limite de Liquidité à la Coupelle-Limite de Plasticité au Rouleau; Association Française de Normalisation: Saint-Denis La Plaine CEDEX, France, 1993.
- Raisi, E.M.; Amiri, J.V.; Davoodi, M.R. Influence of rice husk ash on the fracture characteristics and brittleness of self-compacting concrete. Eng. Fract. Mech. 2018, 199, 595–608. [Google Scholar] [CrossRef]
- ASTM C618; Standard Specification for Coal Fly Ash and Raw or Calcined Natural Pozzolan for Use in Concrete; ASTM International: West Conshohocken, PA, USA, 2019.
- EN 196-5; Méthodes D’essais Des Ciments-Partie 5: Essai de Pouzzolanicité Des Ciments Pouzzolaniques; Association Française de Normalisation: Saint-Denis La Plaine CEDEX, France, 2006.
- NF P 18-513; Métakaolin: Spécifications et Critères de Conformité; Association Française de Normalisation: Saint-Denis La Plaine CEDEX, France, 2012.
- Luxan, M.D.; Madruga, F.; Saavedra, J. Rapid evaluation of pozzolanic activity of natural products by conductivity measurement. Cem. Concr. Res. 1989, 19, 63–68. [Google Scholar] [CrossRef]
- Yu, Q.; Sawayama, K.; Sugita, S.; Shoya, M.; Isojima, Y. The reaction between rice husk ash and Ca(OH)2 solution and the nature of its product. Cem. Concr. Res. 1999, 29, 37–43. [Google Scholar] [CrossRef]
- EN 196-1; Méthodes D’essais Des Ciments Partie 1: Détermination Des Résistances Mécaniques; Association Française de Normalisation: Saint-Denis La Plaine CEDEX, France, 2006.
- Truche, C. Caractérisation et Quantification des Minéraux Argileux Dans les Sols Expansifs Par Spectroscopie Infrarouge Aux échelles du Laboratoire et du Terrain. Ph.D. Thesis, Université Paul Sabatier-Toulouse III, Toulouse, France, 2011. [Google Scholar]
- Perlot, C.; Rougeau, P. Intérêt des Métakaolins Dans Les Bétons. Les Ed. Du CERIB, 2007, 65. Available online: https://www.researchgate.net/publication/292747265_Interet_des_metakaolins_dans_les_betons (accessed on 14 January 2022).
- Ilic, B.; Mitrovic, A.; Milicic, L. Thermal treatment of kaolin clay to obtain metakaolin. Chem. Ind. 2010, 64, 351–356. [Google Scholar] [CrossRef]
- Lorentz, B.; Shanahan, N.; Stetsko, Y.P.; Zayed, A. Characterization of Florida kaolin clays using multiple-technique approach. Appl. Clay Sci. 2018, 161, 326–333. [Google Scholar] [CrossRef]
- Liu, Y.; Lei, S.; Lin, M.; Xia, Z.; Pei, Z.; Li, B. Influence of calcined coal-series kaolin fineness on properties of cement paste and mortar. Constr. Build. Mater. 2018, 171, 558–565. [Google Scholar] [CrossRef]
- Tironi, A.; Cravero, F.; Scian, A.N.; Irassar, E.F. Pozzolanic activity of calcined halloysite-rich kaolinitic clays. Appl. Clay Sci. 2017, 147. [Google Scholar] [CrossRef]
- Donatello, S.; Tyrer, M.; Cheeseman, C.R. Cement & Concrete Composites Comparison of test methods to assess pozzolanic activity. Cem. Concr. Compos. 2010, 32, 121–127. [Google Scholar] [CrossRef]
Publisher’s Note: MDPI stays neutral with regard to jurisdictional claims in published maps and institutional affiliations. |
© 2022 by the authors. Licensee MDPI, Basel, Switzerland. This article is an open access article distributed under the terms and conditions of the Creative Commons Attribution (CC BY) license (https://creativecommons.org/licenses/by/4.0/).