Abstract
Analysis of the research productivity for any university is so important in order to raise its international ranking. Rankings offer universities evidence that the education they deliver is of high quality and top standard. A student’s level of dedication to their studies directly affects the outcome of their academic career. Sitting in on a lecture at a top-five rated institution is far less significant than actively contributing (engaging with classmates, doing research, etc.) at a top-50 ranked university. Using a SciVal dataset of 13 university entities across the Kingdom of Saudi Arabia over a span of 5 years (2017–2021), we conducted a scientometric study for three categories, namely Output (O), Impact (I), and Collaboration (C), incorporating a total of 18 features. The methodology for selecting universities in this research depended on selecting the best universities in the Kingdom of Saudi Arabia in terms of the number of published research papers and the number of citations. This article aims to forecast the pattern of development and shortcomings faced by researchers from around the country from 2017 to 2021. The dataset is evaluated at the university level with homogenized features termed as “Scholar Plot” (SP), a popular approach to maintain and encourage development at the individual level. It is concluded that variances in efficiency within each knowledge field are the major drivers of heterogeneity in scientific output. Disparities in quality and specialization play a lesser impact in influencing productivity differences. The measure of such disparities using the mean of the group’s significance is illustrated using a t-tests statistical approach.
1. Introduction
During the past centuries, a huge gap existed between the literate and illiterate. The elite group was mostly among the ones able to read, write, and speak predominantly in English. Since the evolution of homo-sapiens over 300,000 years ago and the appearance of the first letter around 3500 BC, there has always been a focus on the writing ability [1]. Throughout history, this communication skill is often alluded to as a broad dissociation line between illiterates and literates [2]. However, these skills are not adopted by human beings naturally, learning them willingly or unwillingly through the society they are a part of. Many philosophers often refer to these skills as “artificial” [3] as they are developed untimely and unequally. Through an immeasurable effort put forward by educational societies to convert the illiterates to literates, the dissociation line is narrowed considering the learned communication skills through education. Humans who are unable to cope with the ongoing research to manipulate, invent, express, or extend their ideas to mileage the current design or plan are still considered educated illiterates [4] and/or old world [5]. Most of the available resources to become acquainted with the current trends are available in their digital forms through online resources, such as e-learning blogs, journals, web articles, electronic magazines, and online learning platforms: Coursera, Saylor, etc. Apart from literacy (from the modern era), one needs to be digitally literate with the knowledge of how to use online resources. Hence, the modern era is also referred to as the digital literacy era [6].
To further narrow down the dissociation line, efforts are being made by academic education bodies globally to accentuate the students and faculty from being in the obscurity of uneducated literates or the old world. Apart from course-related learning, systematic investigations to demonstrate facts and reach contemporary conclusions, often termed “research”, are emphasized amongst students and faculty. This accentuation is achieved by incorporating research as a grading parameter for students and as a promotion, award, and recognition framework for faculties. Researchers in [7] propose Dynamic Data Envelopment Analysis (DDEA) and Inverse DDEA (IDDEA) for evaluating such parameters’ citation analysis [8]. To keep track of all such parameters, clearly defined metrics set by renowned scientific organizations such as Scopus, Science Direct, Elsevier, and Web of Science are taken into consideration. A bibliometric tool, such as the SciVal research metric guidebook [9] and patent metrics [10] by Scopus-Elsevier, is often used to adhere to the article-level metrics, journal-level metrics, author-level metrics, and institutional-level metrics for mapping affinities in research organizations [11,12]. To globally influence these metrics, the need for internationalization of research institutes and higher education [13,14] has become evident in the globalization of higher education and inflating international research collaborations [15].
With the inclusion of such scientometric studies for the students and faculties, the academic entity gains recognition in terms of Quacquarelli Symonds (QS) ranking [16] and Times Higher Education ranking. Attaining, maintaining, and improving the QS ranking is not an easy assignment. It is affected by several scenarios, such as autonomy between researchers and managers of autonomous, heterogeneous, and managed research organizations along with the internal sharing of authority [17]. In simple words, the working environment has a great impact on the technological research output in an academic ecosystem [18]. Academic publishing is mostly encouraged among institutions in high-impact factor journals in order to maintain quality and visibility for further research [19]. The most common issue experienced by many research groups is the conflict of interest among co-authors, which can be avoided by simple strategies put forward by [20]. At the entity level, the research is mapped onto a plot popularly known as the Scholar Plot (SP), serving as an information interface for performance valuation [21].
The integrity of various performance metrics can be statistically analyzed using various statistical approaches based upon parameters such as sample size, level of confidence, paired/unpaired samples, etc. On the basis of the normal deviate Z-test, a large-sample theory is developed [22]. As a result, the Z-test cannot be used for small sample sizes (N < 30) since the distribution of different statistics is not normal. In 1908, W. S. Gosset devised a novel procedure and test of significance known as the “exact sample t-test”; Professor R. A. Fisher subsequently improved it in 1926 to cope with small samples. In t-tests, the basic assumption is that the populations from which samples are collected have normal distributions (parent populations) and samples are selected at random and are independent to one another [23]. In order to compare the means of the same group or item under two different circumstances, a paired t-test is used. An unpaired t-test examines the averages of two groups that are unconnected or independent of one another. The variance across groups is considered to be equal in an unpaired t-test. The variance is not expected to be equal in a paired t-test. The simplest basic representation of a t-test is expressed in Equation (1), which includes two means (M1 and M2) as well as an overall standard error (SE) value for both samples.
The upcoming section discusses the SciVal dataset, metrics, comparison, and analysis of the categorized dataset using various measures of dispersion to conclude the performance of the entities.
2. SciVal Dataset and Metrics
The SciVal dataset was extracted in May 2022. In this study, the methodology for selecting universities was based on selecting the best universities in the Kingdom of Saudi Arabia in terms of the number of published research papers and citations. The two lists were then combined and the best 13 Saudi universities were chosen from that combined list, taking care not to repeat university names. A combination of three categories, namely Output (O), Impact (I), and Collaboration (C), has been illustrated in Figure 1, using a Venn diagram. The union (U) of these three categories is used as a performance evaluation portrayer but indeed, the intersection () of the categories deeply affects the entity ranking and individual researcher ranking using metrics such as citations, h-index, i-10th index, etc.
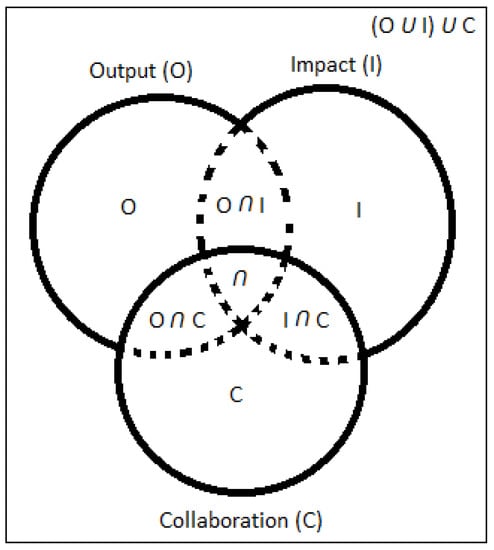
Figure 1.
Venn Diagram for SciVal Dataset.
In this article, 13 university entities, namely King Saud University (KSU), King Abdelaziz University (KAU), King Abdullah University of Science and Technology (KAUST), King Fahd University of Petroleum and Minerals (KFUPM), King Khalid University (KKU), Taif University (TU), Imam Abdulrahman Bin Faisal University (IAU), Prince Sattam Bin Abdulaziz University (PSAU), Taibah University (TAIBAHU), Umm Al-Qura University (UQU), King Saud bin Abdulaziz University for Health Sciences (KSAU-HS), Jazan University (JAZANU), and University of Hail (UOH), serving as academic institutions in the country of Saudi Arabia, are selected from various regions/states. The parameter’s evaluation and analysis are carried out for 18 research metrics, affinity, and features that fall under the three categories mentioned earlier, over a time span of 5 years from 2017 to 2021. The parameters selected for the SciVal dataset fall under either one or more of the categories of Output (O), Impact (I), or Collaboration (C) as illustrated in Table 1.

Table 1.
Research metrics mapped with SciVal categories, ** Output, **** Impact and ****** Collaboration.
For simplicity in classification among the affinities, the following distribution is used in this article, which serves as a widely preferred classification discussed in multiple research articles [24,25].
- Output (O): Scholarly output, publications in Q1, Q2, Q3, and Q4 are included in this category.
- Impact (I): Citation Count, publications in the top 1%, 5%, and 10% journal and citation percentiles fall under this class.
- Collaboration (C): Includes Institutional Collaboration, International Collaboration, National Collaboration, Institutional Collaboration Impact, International Collaboration Impact, and National Collaboration Impact.
All of the metrics’ terminology and illustrations are discussed in this section.
Output (O): Scholarly output is the foremost preferred research metric, signifying productivity in terms of total research outputs from an individual or entity. It is to be noted that journal articles, conference articles, book/book chapters, newsletters, reports, and software are categorized as scholarly output. Academic research articles are counted and their distribution throughout the four quartiles of journal publications is examined in this category [26,27,28,29]. Citation count is the number of times a given article is mentioned in other publications, such as book series, books, book chapters, conferences, etc. The most frequent measure of the research evaluation ecosystem is the number of times a publication is cited. A publishing citation, for example, is not tied to a certain area of study. Even if a zoology paper is referenced by a mechanical engineering publication, the citation is still counted. Using the SciVal dataset, the overall publications and overall citations for 13 Saudi Public Universities are illustrated in Table 2.
Table 2.
Saudi Public Universities Overall Publications and citations.
Using the two-year average of citations to papers published in the journal’s preceding two years, the scientometric index word “Impact Factor” is often used by the journals. There exists four quartiles (Q) in the impact factor rankings: Q1, Q2, Q3, and Q4. These are the four subgroups, or quartiles (Q), that make up the impact factor rankings. Among the journals on the list, the first quarter or top 25% are designated as Q1, journals among the second quarter ranging from 26% to 50% are designated as Q2, whereas journals among the third quarter ranging from 51% to 75% are designated as Q3, and the journals from the last quarter 76% to 100% are designated as Q4.
Impact (I): When a piece of academic work is cited in another work of scholarly work, it is considered to have had an effect/Impact (I) on later research publications [28,30]. The measures of this category’s influence include citation count, and publication in the top 1%, 5%, and 10% journal and citation percentiles which are considered to be time dependent in nature. Similar to the quartile (Q) classification, among the journal list with regard to the impact factor of data source, publication in the top 1% journal percentile is considered as the most prestigious in the world, followed by publications in the top 5% and 10%. Unlike impact factors, which utilize average citations of articles published in the journal’s preceding two years, if the citations count of articles published in a journal are evaluated per year, then they are referred to as journal percentile. The most cited journals are often defined by a widely used journal metric SCImago Journal Rank (SJR), calculated using the SciVal bibliometric tool. Using the SciVal dataset, the publications in the top 1%, 5%, and 10% journal percentile for 13 Saudi Public Universities during the time span of 5 years (2017–2021) are studied.
Regarding the similar harmony, publication in the top 1% citation percentile is considered the most prestigious in the world, followed by publications in the top 5% and 10%. Relative citation rate (RCR) or field weighted citation impact (FWCI) [31,32] has been established as a tool to measure the influence of a paper’s citations. RCR = 1 indicates that the article is referenced precisely as predicted. RCR < 1 indicates that the publication has received fewer citations than predicted. The higher the RCR (>1), the more often the publication is mentioned. If you look at the number of times an article is referenced in the patent, one can see how many times the work of art is being cited in academic output. A patent cited scholarly output is referred to as the average patent citations received per 1000 scholarly outputs. For example, if a company obtains 10,000 academic outputs and 200 patents during an evaluation year, the patent cited scholarly output would be 20 (=200 × 1000/10,000). Using the SciVal dataset, the publications in the top 1%, 5%, and 10% citation percentile for 13 Saudi Public Universities during the time span of 5 years (2017–2021) are discussed.
Collaboration (C): Previous studies reveal that scientists categorize themselves as either academia- or industry-based on their preferences. Researchers with a deeper “passion for scientific knowledge” and/or with a preference for non-monetary rewards seem to be more willing to enter academia, whereas scientists with a substantially larger desire for practical study and monetary incentives are more likely to enter industry. Furthermore, the academic institutional environment fosters the interchange of information and materials, as well as curiosity-driven research. For all of these reasons, academic institutions have a comparative advantage in researching more fundamental topics, whereas enterprises have a competitive edge in development and marketing. As a result, from the perspective of enterprises, engaging with academics helps to focus on areas where they have been best in investigating the project’s more fundamental aspects.
Active collaboration throughout the project helps ensure that the academic side’s expertise is rapidly and easily transferred to the business partner. Similarly, partnering with industry may provide academic scientists with resources, skills, and equipment that may be useful in realizing the scientific potential of a line of study without putting too much emphasis on its commercialization. Hence, this category is considered as one of the dominant classifications which additionally escalates the entity’s output and impact. This category broadly includes academic collaboration in regard to similar entities, academic-corporate collaboration [33] based upon dissimilar entities, single authorship [34,35], institutional collaboration [36], and national and international collaborations [37], clearly depicted in Figure 2a,b. If a scholarly output is authored solitarily, it is referred to as Single Authorship. Whereas, if the scholarly output is authored by multiple individual researchers from same entity, it is referred to as Institutional/Academic collaboration. Whilst, if it is authored by multiple individual researchers among multiple entities from the same country, it is termed as National collaboration. Nevertheless, if it is authored by multiple individual researchers among multiple entities from the multiple countries, it is termed as International collaboration.
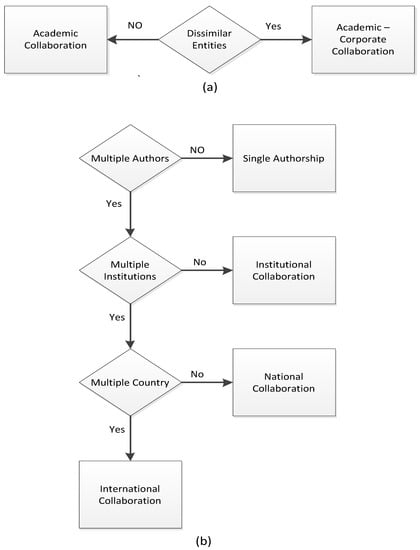
Figure 2.
Collaboration Classifications Flow chart; (a) Dissimilar entities, (b) decisions on different types of collaboration.
The institutional, national, and international collaborations refer to the number of collaborations established. Whereas, the institutional, national, and international collaborations impact refers to the aftermath achieved with such collaborations. Using the SciVal dataset, the institutional, national, and international collaborations for 13 Saudi Public Universities during the time span of 5 years (2017–2021) are weighted.
Good intentions pave the way to partnership. However, only intentions are insufficient to produce well-designed, successful, and long-term collaborative activity. Contemporary policymakers and practitioners believe that challenges in public policy necessitate collaborative responses, which is statistically verified using a measurand termed as collaboration impact. This marked influence is categorized and measured using all the three previously mentioned collaborations, namely Institutional Collaboration Impact, National Collaboration Impact, and International Collaboration Impact.
3. Analysis and Discussion
Over a period of five years, the statistics shown in Figure 3 pertain to 13 distinct entities. One of the indices used to gauge the worth and influence is the cumulative academic output and article citation frequency. It is not evident that the number of citations and publications are correlated. Nevertheless, it is evident that a research article with RCR > 1 receives multiple citations when compared to a research article with RCR < 1. A similar yet homogeneous pattern is seen between the percentage of publications and the share of citations for all the entities except KAU and KAUST entities, experiencing a significant rise in their relative citation share, which was commensurate with their share of output illustrated through Figure 3 in descending order of research articles published versus overall citation frequency. It is evident from the infographic that there has been a significant increase in academic production rate in terms of number of scholarly outputs and citations throughout evaluation years 2017–2021. It is apparent from the infographic that the entities KSU and KAU are most efficient, whereas UOH is found to be the most inefficient entity.
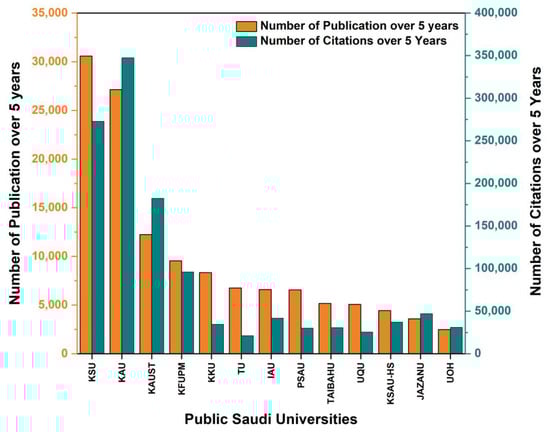
Figure 3.
Number of Scholarly Outputs and Overall Citations during 2017–2021.
To demonstrate the scholarly output precisely, a comparison of distribution of scholarly output among quartiles (Q1 through Q4) is additionally scrutinized. Figure 4 demonstrates that all the entities map a perfect incremental essence in regard to Q1, Q2, Q3 and Q4 throughout the evaluation period from 2017–2021, which signifies a better improvement of the entities coping up, participating, and competing among other entities. As discussed in previous sections, Q1 journals are considered more esteemed when compared to their counterparts (Q2, Q3 and Q4). It is clear from the visualization illustration in Figure 4, that all the public Saudi universities endure a greater portion of scholarly output in Q1 journals with a subsequent decrease in scholarly outputs in Q2, Q3 and Q4 journals. Furthermore, it is observable that the denser output in Q1 improves with time, whereas the denser output in Q4 worsens with time, signifying an improvement among entities.

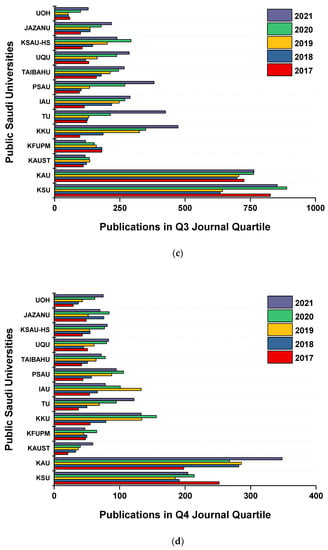
Figure 4.
(a) Q1 journals, (b) Q2 journals, (c) Q3 journals, and (d) Q4 journals.
Figure 5 depicts the statistical data for 13 organizations over a period of 5 years. It is evident from the infographic that the entities have improvement over the course in the top 1%, 5%, and 10% journal and citation percentiles, respectively. From Figure 5a, it is noted that the entities PSAU, TU, and KKU fall short in the top 1% journal percentile category, whereas the entity KAUST surpasses it. From Figure 4b, it is noted that the entities TAIBAHU and KKU fall short in the top 5% journal percentile category, whereas the entities KFUPM and KAUST surpass it. From Figure 5c, it is noted that all the entities reach the top 10% journal percentile category, whereas the entities KFUPM, KAUST, KAU, and KSU surpass it. Furthermore, from Figure 5d, it is noted that the entity TU falls short in the top 1% citation percentile category, whereas the entity KAUST surpasses it. From Figure 5e,f, it is noted that all the entities reach the top 5% and top 10% of citation percentile category, whereas the entities KFUPM, KAUST, KAU, and KSU surpass it. It is also apparent from the visual schema that the entities experience a narrow marginal mold for journal percentiles, whereas they experience a broader marginal (or beyond border) mold for citation percentiles.
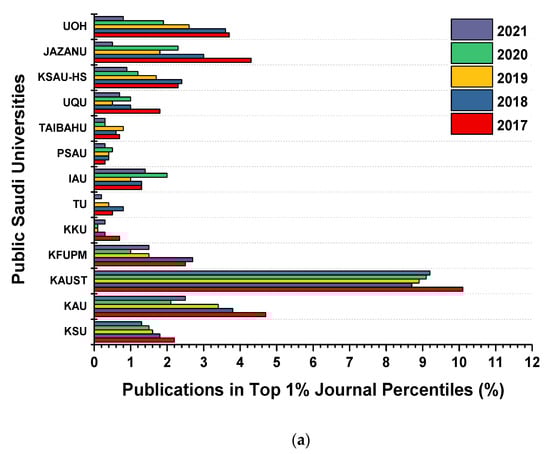
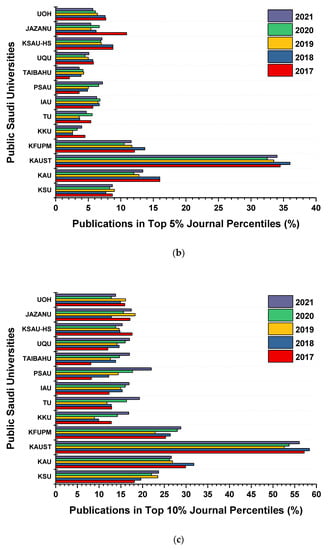
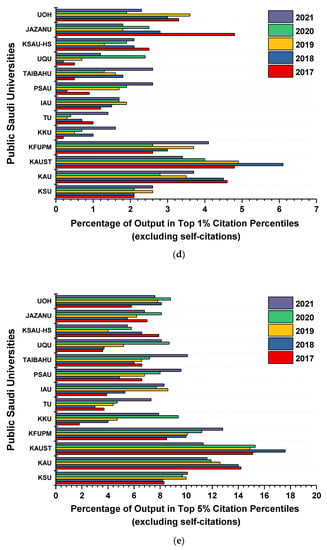
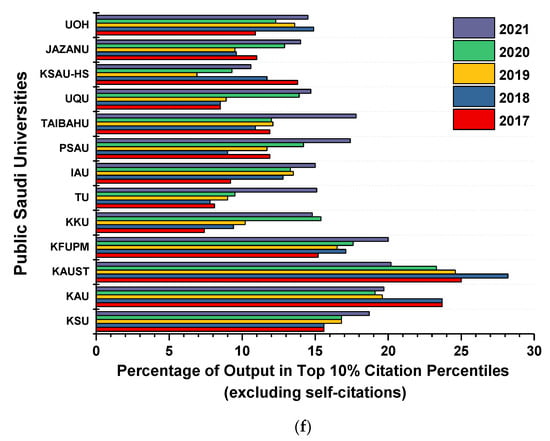
Figure 5.
Publication in (a) Top 1% journal percentile, (b) Top 5% journal percentile, (c) Top 10% journal percentile, (d) Top 1% citation percentile, (e) Top 5% citation percentile, and (f) Top 10% citation percentile.
Collaboration, in simple words, is a task which is achieved jointly. A multilingual, multi-entity, multi-disciplinary, multi-regional collaboration helps in achieving the tasks appropriately. Figure 6 shows the statistical data for 13 entities over a time span of 5 years (2017–2021). It is noticeable that over a course of time, all the entities are coherent towards significant increase in collaboration and its impact throughout the evaluation years 2017–2021. It is clear from the infographic that a low rate of (a) Institutional collaboration and (d) Institutional collaboration impact is indicated when compared to the medium rate of (b) National collaboration and (e) National collaboration impact is indicated, in comparison with the high rate of (c) International collaboration and (f) International collaboration impact indicated.

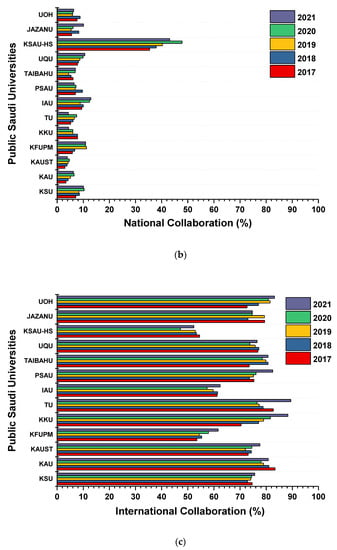
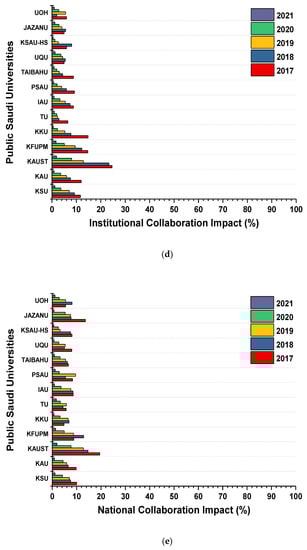
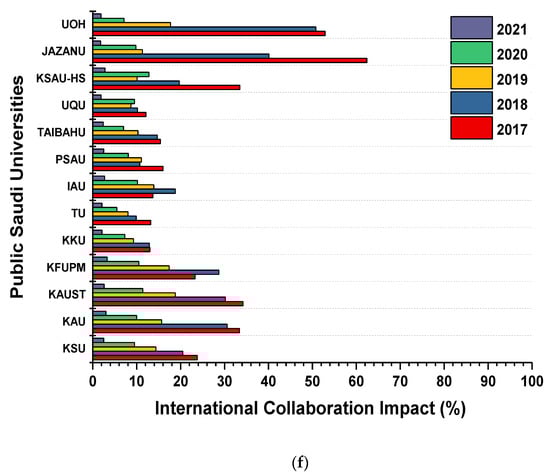
Figure 6.
(a) Institutional Collaboration, (b) National Collaboration, (c) International Collaboration, (d) Institutional Collaboration Impact, (e) National Collaboration Impact, and (f) International Collaboration Impact.
The T-value and p-value are tightly related. They walk together like Tweedledee and Tweedledum. A t-test seeks evidence of a significant difference between population means (2-sample t) or between the population mean and a predicted value (1-sample t). The T-value quantifies the magnitude of the difference in comparison to the variance in the sample data. The T-value is simply the determined difference expressed in units of standard error. The bigger the size of the T-value, the more evidence there is against the null hypothesis. This indicates that there is more evidence than there is a substantial difference. The closer T is to 0, the less certainty that any substantial difference exists. Larger magnitude T-values (either negative or positive) are less prevalent. The extreme left and right tails of any distribution curve show scenarios of getting T-values far from zero. In other words, the likelihood of receiving a higher T-value while sampling from the same population produces a lower p-value. Given the limited possibility of finding a higher T-value when sampling from this group, the p-value is extremely low, indicating that there is a statistically significant difference. As a result, the T-value and p-value are tightly related. Table 3, Table 4 and Table 5 illustrates the p-value and T-Value along with the significance using paired t-tests for Output (O), Collaboration (C), and Impact (I) performance metrics, respectively.
Table 3.
Significance using paired t-tests for Output (O) performance metric.
Table 4.
Significance using paired t-tests for Collaboration (C) performance metric.
Table 5.
Significance using paired t-tests for Impact (I) performance metric.
Finally, the t-test is utilized to investigate the disparities across groups using independent samples. Since the current study requires a comparison of means, we employ these examinations. In addition, the sample t-test is used to evaluate the mean of two independent samples. Comparing the means of two sets may be useful for validating hypotheses about differences in continuous dependent variables. A positive result from the test indicates that there is a statistically significant difference between the groups’ means [38]. As per the obtained p-values and T-values in Table 3 for a sample size (N) of 13 distinct entities with an N-1 level of confidence, a significant difference can be noted from the values of Group-A (Overall publications) and Group-B (Overall Citations) obtained for the T-value of 3.0004 and p-value of 0.0111, denoting the T-value as higher when compared to the lesser p-value. Hence, it can be considered to be statistically significant, pointing towards an appropriate relation between both the groups.
In a similar approach, as per the obtained p-values and T-values in Table 4 for a sample size (N) of 13 distinct entities with an N-1 level of confidence, a lesser difference can be noted from the values of Group-A (Institutional Collaboration) and Group-B (Institutional Collaboration Impact) obtained for the T-value of 0.2782 and p-value of 0.7856, denoting that the T-value cannot be regarded as higher when compared to the lesser p-value. Hence, it can be considered NOT to be statistically significant, inferring towards a less appropriate relation between both the groups. Similarly, a lesser difference can be noted from the values of Group-A (National Collaboration) and Group-B (National Collaboration Impact) obtained for the T-value of 1.5942 and p-value of 0.1369, denoting that the T-value cannot be regarded as higher when compared to the lesser p-value. Hence, it can be considered NOT to be statistically significant, inferring towards a less appropriate relation between both the groups. Additionally, an extremely higher difference can be noted from the values of Group-A (International Collaboration) and Group-B (International Collaboration Impact) obtained for the T-value of 17.7481 and p-value of 0.0001, denoting that the T-value can be regarded as extremely higher when compared to the lesser p-value. Hence, it can be considered to be extremely statistically significant, signaling towards a perfect relation between both the groups.
On the other hand, as per the obtained p-values and T-values in Table 5 for a sample size (N) of 13 distinct entities with an N-1 level of confidence, a lesser difference can be noted from the values of Group-A (Top 1% journal Percentiles) and Group-B (Top 1% citation Percentiles) obtained for the T-value of 0.3923 and p-value of 0.7017, denoting that the T-value cannot be regarded as higher when compared to the lesser p-value. Hence, it can be considered NOT to be statistically significant, inferring towards a less appropriate relation between both the groups. Similarly, a lesser difference can be noted from the values of Group-A (Top 5% journal Percentiles) and Group-B (Top 5% citation Percentiles) obtained for the T-value of 0.6607 and p-value of 0.5213, denoting that the T-value cannot be regarded as higher when compared to the lesser p-value. Hence, it can be considered NOT to be statistically significant, inferring towards a less appropriate relation between both the groups. Additionally, a higher difference can be noted from the values of Group-A (Top 10% journal Percentiles) and Group-B (Top 10% citation Percentiles) obtained for the T-value of 2.6854 and p-value of 0.0198, denoting that the T-value can be regarded as higher when compared to the lesser p-value. Hence, it can be considered to be statistically significant, signaling towards an appropriate relation between both the groups.
4. Conclusions
Finding a suitable and effective methodology for evaluating the performance of universities and their sub-units is critical. Universities, on the other hand, are of high priority for evaluation due to their critical relevance and distinctive position in the knowledge-based economy and in supplying trained and expert workforces for the labor market. SciVal, being a well-known, strong, and widely utilized assessment methodology in a variety of fields, such as industry, service, agriculture, engineering, medicine, and so on, may indeed be appropriate for universities’ evaluations. Because the performance of certain entities in the real world should be assessed throughout time, the Output (O), Impact (I), and Collaboration (C) metrics were used to evaluate and compare the performance of public Saudi Universities. The authors of this study employed a variety of methodologies, including bibliometric, scientometric, citation analytic approaches, along with t-tests statistical analysis to demonstrate the growth and expansion of researchers in academic institutions across the country of Saudi Arabia. Rather than pointing out any entity in terms of performance, this article focuses and demonstrates how this method may be used by entities for the purposes of evaluation, improvement, and maturity by adopting an overall larger view. Considering the information available, the metric Output (O), Impact (I), and Collaboration (C) has significantly improved over time, signifying and providing a better platform for evaluating the effect on the conduct and completion of field research via publications within the SciVal analytics. This article helps to comprehend the modifications necessary to maintain the faculties’ present efficiency levels, as well as the prospective implications of specific increases in their research outputs. Regarding the diverse nature and variances in activities of each faculty, one of the drawbacks of this approach that may be explored in future studies is not taking these disparities into account. Furthermore, evaluating and comparing universities by considering departments or facilities as internal components of each institution may be explored for future developments.
This study centered on the premise that highly cited and alt-metric works are able to satisfy the needs of both established scholars and aspiring researchers; hence, gaining access to a more diverse pool of symbolic resources. When combined, citations and altmetrics provide a comprehensive picture of the variety of outputs that garner respect and other symbolic resources like attention, influence, and prestige. Researchers can use this type of analysis to determine where and how they want to publish their findings, but management teams can use it to consider how they want employees to be compensated and communications professionals can use it to determine which findings are likely to go viral and which need to be promoted more actively. A closer look at the exceptional group could be a good place to start when thinking about how to create results that are respected in the academic community and the wider world. Recommendations and concepts for enhancing research evaluation and the proper use of metrics are provided in the presented Research Assessment. Quantitative measures for publications may be used as part of a more complete evaluation. Metrics may either exaggerate or overlook the apparent “effect” of research, especially when incorporated within a peer-reviewed evaluation process that also involves qualitative assessment. However, the widespread use of publication metrics necessitates that funders, authors, and the publishing industry have a thorough understanding of the benefits and drawbacks of using quantitative measures to approximate the significance of a research project. Understanding the limitations of both individual and aggregate metrics is essential for making effective use of publishing metrics. Publication metrics, when utilized in context, may provide light on the impact of an article, the development of a journal, or the trajectory of a researcher’s professional life.
Author Contributions
Conceptualization, M.S.A., M.A. and M.A.M.; methodology, M.S.A., M.A. and M.A.M.; formal analysis, M.S.A., M.A. and M.A.M.; investigation M.S.A., M.A. and M.A.M.; resources, M.S.A., M.A. and M.A.M.; data curation, M.S.A., M.A., M.A.M. and H.M.A.; writing—original draft preparation, M.S.A., M.A. and M.A.M.; writing—review and editing, M.S.A., M.A., M.A.M. and H.M.A.; visualization, M.S.A., M.A., M.A.M. and H.M.A.; supervision, M.S.A., M.A. and M.A.M.; funding acquisition, M.S.A. All authors have read and agreed to the published version of the manuscript.
Funding
The authors extend their appreciation to the Deanship of Scientific Research at King Khalid University (KKU) for funding this work through the Research Group Program under the Grant Number: (R.G.P.2/133/43).
Institutional Review Board Statement
Not applicable.
Informed Consent Statement
Not applicable.
Data Availability Statement
Not applicable.
Conflicts of Interest
The authors declare no conflict of interest.
References
- Homo Sapiens|The Smithsonian Institution’s Human Origins Program. Smithsonian Institution. Available online: https://humanorigins.si.edu/evidence/human-fossils/species/homo-sapiens (accessed on 26 November 2021).
- Muroi, R. Literacy and tactility: An experience of writing in Kuzuhara Kôtô Nikki (Kuzuhara Kôtô’s diary). Educ. Philos. Theory 2022, 54, 1377–1385. [Google Scholar] [CrossRef]
- Ong, W.J. Orality and Literacy: The Technologizing of the Word; Taylor and Francis: Abingdon, UK, 2005; Volume 79. [Google Scholar]
- Nweke, V. Uneducated-Literates as a Challenge To Humanity: An Imperative for a Complementary Philosophy of Education. J. Arts Sci. 2015. Available online: https://www.academia.edu/download/37320642/NWEKE_VICTOR_-_UNEDUCATED-LITERATES_AS_A_CHALLENGE_TO_HUMANITY.pdf (accessed on 14 September 2022).
- Mettler, T.; Sunyaev, A. Are we on the right track? An update to Lyytinen et al.’s commentary on why the old world cannot publish. Eur. J. Inf. Syst. 2021, 1–14. [Google Scholar] [CrossRef]
- Chigisheva, O.; Soltovets, E.; Dmitrova, A.; Akhtyan, A.G.; Litvinova, S.N.; Chelysheva, Y.V. Digital Literacy And Its Relevance to Comparative Education Researchers: Outcomes of Scival Analytics. Eurasia J. Math. Sci. Technol. Educ. 2021, 17, em2017. [Google Scholar] [CrossRef] [PubMed]
- Foladi, S.; Solimanpur, M.; Jahangoshai Rezaee, M. Inverse Dynamic Data Envelopment Analysis for Evaluating Faculties of University with Quasi-Fixed Inputs. Soc. Indic. Res. 2020, 148, 323–347. [Google Scholar] [CrossRef]
- Lowry, P.B.; Karuga, G.G.; Richardson, V.J. Assessing Leading Institutions, Faculty, and Articles in Premier Information Systems Research Journals. Commun. Assoc. Inf. Syst. 2007, 20, 142–203. [Google Scholar] [CrossRef]
- Elsevier. Research Metrics Guidebook; Elsevier: Amsterdam, The Netherlands, 2018; p. 68. [Google Scholar]
- Elsevier. Scival: Patent Metrics; Elsevier: Amsterdam, The Netherlands, 2016; pp. 1–8. [Google Scholar]
- Rodighiero, D.; Kaplan, F.; Beaude, B. Mapping Affinities in Academic Organizations. Front. Res. Metr. Anal. 2018, 3, 4. [Google Scholar] [CrossRef]
- Mokhnacheva, Y.V.; Tsvetkova, V.A. Development of Research Topics Based on the Terminological Approach (for Example, Immunology and Microbiology According to Scopus–scival Data). Sci. Tech. Inf. Process. 2021, 48, 139–145. [Google Scholar] [CrossRef]
- Cruz-Castro, L.; Jonkers, K.; Sanz-Menéndez, L. The internationalisation of research institutes. In Towards European Science: Dynamics and Policy of an Evolving European Research Space; Edward Elgar Publishing: Cheltenham, UK, 2015; pp. 175–198. [Google Scholar]
- Gornitzka, Å. The Internationalisation of Research and Higher Education; Springer: Dordrecht, The Netherlands, 2008. [Google Scholar]
- Kolesnikov, S.; Woo, S.; Li, Y.; Shapira, P.; Youtie, J. Mapping the emergence of international university research ventures. J. Technol. Transf. 2019, 44, 1134–1162. [Google Scholar] [CrossRef]
- Loyola-Gonzalez, O.; Medina-Perez, M.A.; Valdez, R.A.C.; Choo, K.K.R. A contrast pattern-based scientometric study of the QS world university ranking. IEEE Access 2020, 8, 206088–206104. [Google Scholar] [CrossRef]
- Cruz-Castro, L.; Sanz-Menéndez, L. Autonomy and Authority in Public Research Organisations: Structure and Funding Factors. Minerva 2018, 56, 135–160. [Google Scholar] [CrossRef]
- Petrosyants, D.V.; Simonov, K.V.; Mitrakhovich, S.P.; Iushkov, I.V. Foresight for development of innovation ecosystems in Russian education: Information basis of evaluation. SHS Web Conf. 2021, 103, 02013. [Google Scholar] [CrossRef]
- Liu, F.; Guo, W.; Zuo, C. High impact factor journals have more publications than expected. Curr. Sci. 2018, 114, 955–956. [Google Scholar] [CrossRef]
- Cooke, S.J.; Young, N.; Donaldson, M.R.; Nyboer, E.A.; Roche, D.G.; Madliger, C.L.; Lennox, R.J.; Chapman, J.M.; Faulkes, Z.; Bennett, J.R. Ten strategies for avoiding and overcoming authorship conflicts in academic publishing. Facets 2021, 6, 1753–1770. [Google Scholar] [CrossRef]
- Bai, X.; Liu, Y. International collaboration patterns and effecting factors of emerging technologies. PLoS ONE 2016, 11, e0167772. [Google Scholar] [CrossRef] [PubMed]
- Gaboardi, M.; Rogers, R.; Sheffet, O. Locally Private Mean Estimation: Z-test and Tight Confidence Intervals. In Proceedings of the Twenty-Second International Conference on Artificial Intelligence and Statistics, Naha, Japan, 16–18 April 2019; pp. 2545–2554. [Google Scholar]
- Majeti, D.; Akleman, E.; Ahmed, M.E.; Petersen, A.M.; Uzzi, B.; Pavlidis, I. Scholar Plot: Design and Evaluation of an Information Interface for Faculty Research Performance. Front. Res. Metr. Anal. 2020, 4, 6. [Google Scholar] [CrossRef] [PubMed]
- Chen, C.; Chen, T.; Wang, Z.; Zhao, X. A comparative analysis of China and other countries in metabolic engineering: Output, impact and collaboration. Chin. J. Chem. Eng. 2021, 30, 37–45. [Google Scholar] [CrossRef]
- Cardoso, L.; Silva, R.; de Almeida, G.G.F.; Santos, L.L. A bibliometric model to analyze country research performance: Scival topic prominence approach in tourism, leisure and hospitality. Sustainability 2020, 12, 9897. [Google Scholar] [CrossRef]
- Zharova, A. Measures of University Research Output. Ph.D. Dissertation, College of Economics, Humboldt University, Berlin, Germany, 2018; p. 125. [Google Scholar]
- Pastor, J.M.; Serrano, L. The determinants of the research output of universities: Specialization, quality and inefficiencies. Scientometrics 2016, 109, 1255–1281. [Google Scholar] [CrossRef]
- Craig, B.M.; Cosh, S.M.; Luck, C.C. Research productivity, quality, and impact metrics of Australian psychology academics. Aust. J. Psychol. 2021, 73, 144–156. [Google Scholar] [CrossRef]
- Cascajares, M.; Alcayde, A.; Garrido-Cardenas, J.A.; Manzano-Agugliaro, F. The contribution of Spanish science to patents: Medicine as case of study. Int. J. Environ. Res. Public Health 2020, 17, 3638. [Google Scholar] [CrossRef] [PubMed]
- Abbasi, A.; Jamali, H.R. Research diversification of australian universities and its relationship with citation-based performance and ranking. J. Scientometr. Res. 2020, 9, 236–244. [Google Scholar] [CrossRef]
- Bornmann, L.; Daniel, H.D. What do citation counts measure? A review of studies on citing behavior. J. Doc. 2008, 64, 45–80. [Google Scholar] [CrossRef]
- Hutchins, B.I.; Yuan, X.; Anderson, J.M.; Santangelo, G.M. Relative Citation Ratio (RCR): A New Metric that Uses Citation Rates to Measure Influence at the Article Level. PLoS Biol. 2016, 14, e1002541. [Google Scholar] [CrossRef]
- Ankrah, S.; L-Tabbaa, O.A. Universities-industry collaboration: A systematic review. Scand. J. Manag. 2015, 31, 387–408. [Google Scholar] [CrossRef]
- Barlow, J.; Stephens, P.A.; Bode, M.; Cadotte, M.W.; Lucas, K.; Newton, E.; Nuñez, M.A.; Pettorelli, N. On the extinction of the single-authored paper: The causes and consequences of increasingly collaborative applied ecological research. J. Appl. Ecol. 2018, 55, 1–4. [Google Scholar] [CrossRef]
- Fauchart, E.; Bacache-Beauvallet, M.; Bourreau, M.; Moreau, F. Do-It-Yourself or Do-It-Together: How digital technologies affect creating alone or with others? Technovation 2021, 112, 102412. [Google Scholar] [CrossRef]
- Olechnicka, A.; Ploszaj, A.; Celińska-Janowicz, D. The Geography of Scientific Collaboration; Taylor & Francis: Abingdon, UK, 2018. [Google Scholar]
- Ugoni, A.; Walker, B.F. The t Test: An Introduction. Comsig Rev. 1995, 4, 37. [Google Scholar]
- Hussein Hamdan, M. The Perceptions of Saudi EFL English-Major Students of the Impact of Video Materials on the Improvement the Listening Skill. Int. J. Linguist. 2015, 7, 111. [Google Scholar] [CrossRef][Green Version]


Publisher’s Note: MDPI stays neutral with regard to jurisdictional claims in published maps and institutional affiliations. |
© 2022 by the authors. Licensee MDPI, Basel, Switzerland. This article is an open access article distributed under the terms and conditions of the Creative Commons Attribution (CC BY) license (https://creativecommons.org/licenses/by/4.0/).