Abstract
The Xinjiang Uygur Autonomous Region is a major agri-food export contributor within China. Growing quality requirements for agri-food export, increasing green trade barriers, and a desire to emphasize sustainable trade at regional levels have prompted Xinjiang to pay increased attention to agri-food export competitiveness. The paper uses the export sophistication index to investigate the overall and classificatory export competitiveness of Xinjiang’s Agricultural Products (APs). The results are compared to the national average within China by calculating the relative export sophistication. The research finds that (1) Xinjiang’s APs exports are predominant in medium and medium-low-sophistication products. Along with the expanding scale, its structure has been optimized overall. (2) Horticultural products keep a leading position, not having strong competitiveness in Xinjiang but also far exceeding the national average. However, the bulk APs, livestock products, aquatic products, beverages and tobacco, and other APs have no significant export competitiveness compared to the national average. (3) The export structure of Xinjiang’s APs is highly concentrated in horticultural products, showing an adverse trend in export competitiveness distribution—”the strong getting stronger and the weak getting weaker,” and a slower upgrading than the national average since the outbreak of COVID-19, which requires the attention of policymakers.
1. Introduction
Export competitiveness is an ability to compete globally through expanding export capacity and upgrading export sophistication [1], and weak export competitiveness can seriously influence the sustainable development of agri-food trade [2,3]. In recent years, quality requirements and green trade barriers for agri-food export are becoming higher and higher, and export-oriented sub-national entities are also paying increased attention to the development of agriculture. Correspondingly, regional export competitiveness in a country’s agriculture is becoming more important. The Xinjiang Uygur Autonomous Region (henceforth Xinjiang) has emerged as a robust regional contributor to agriculture production within China and swiftly integrated into the world trade of APs, since China’s World Trade Organization (WTO) accession in December 2001. Xinjiang’s agri-food export more than doubled between 2002 and 2021, with an average growth rate of 5.45% [4].
However, Xinjiang’s agri-food export scale grew slower than the regional economy in agriculture and national agri-food export [5], which does not match the significant and rising status of Xinjiang’s agricultural sector in the whole country [6,7]. The functioning of Xinjiang’s agricultural economy has slowly transformed, moving from a low-integrated agricultural economy with APs export of nearly 11% of agricultural gross domestic product (GDP) in 2002 to an isolated position with an export ratio of less than 2.2% in 2021 [4,8]. The proportions of Xinjiang’s APs export, both in local total goods export and national total APs export, showed overall downtrends, falling from 28.91% and 2.10% to 3.91% and 0.92% over the 2002–2021 period, respectively [4,8]. In addition, Xinjiang’s agri-food exports are predominant in fruit and vegetable products, which are primary products with low value-added [6]. These products are strongly replaceable; that is, they are easily substituted by imports from other countries or regions [9]. Hence, both the decreasing competitiveness in terms of agri-food export scale and the current primary agri-food export structure demonstrate the lack of economic sustainability in Xinjiang’s export-oriented agriculture, which needs upgrading its agri-food export technology structure.
On the other hand, Xinjiang’s geographical position is very strategic. It is a very large and scarcely populated province in the P.R. of China, located northwest of the country. It is a multi-ethnic and underdeveloped area in China. It is also one of the major agricultural production bases, the “core area of the Silk Road Economic Belt”, and close to Central Asian Republics. Since Xinjiang has a large rural population, sustainable agri-food export can be extremely helpful in maintaining long-term social stability, given that agri-food export may be one of the most promising contributors to the increase in farmers’ income, particularly in the earlier stages of development [10]. Then, how to accurately assess its agri-food export competitiveness is critical for a comprehensive sustainability assessment.
There are various ways to measure export competitiveness. However, the traditional methods like the international market share index (IMS), constant market share model (CMS), revealed comparative advantage index (RCA), trade competitiveness index (TC), and diamond model can reflect changes in export scale but can hardly capture the evolution of export structure [11]. On the contrary, the export sophistication index evaluates individual economies’ competitiveness, capturing a range of factors, including technology, ease of product fragmentation, natural resource availability, and marketing [12].
The previous studies that conducted export sophistication analyses considered mainly the industry and service sectors. Because of the peculiarity of agricultural products (APs), the agri-food export structure and its sophistication can differ. Besides, agri-food sectors of sub-national entities and their detailed export competitiveness analysis are usually neglected in empirical works. This paper focuses on Xinjiang as a case study to analyze agri-food export competitiveness by applying the export sophistication index.
This paper contributes to the existing literature on agri-food trade competitiveness in three ways. First, the export sophistication analysis is applied to a specific agricultural area rather than a whole country. Second, it focuses on Xinjiang, a highly relevant but little-studied agricultural area, analyzing the agri-food export competitiveness from a sophistication perspective and highlighting its technology structure. Third, we identify the current export competitiveness of Xinjiang’s APs from the perspective of comprehensive and classificatory studies analysis.
The remainder of this paper is structured as follows. In Section 2 and Section 3, we describe the theoretical background and review the literature. In Section 4, we present the methods and data. In Section 5, we analyze the sophistication of Xinjiang’s APs export structure and assess the overall and classificatory competitiveness of Xinjiang’s APs export. In Section 6 and Section 7, we discuss the results and draw conclusions.
2. Theoretical Background
The concept of competitiveness cannot be separated from international trade theories. Many studies aimed to improve the understanding of competitiveness in international economics [13]. Absolute advantage theory, proposed by Smith [14], assumes that countries embody absolute differences in labor productivity, thereby exporting goods for which they use fewer inputs in production and importing goods for which they do not possess an absolute advantage. Ricardo [15] developed this concept and presented comparative advantage theory, arguing that not absolute but comparative advantages account for bilateral international trade. According to his model, the comparative advantage is based on distinct production technology, and countries need to specialize in those products in which they possess a comparative advantage.
Heckscher [16] and Ohlin [17] further developed the comparative advantage theory and presented the factor endowment theory, holding that the source of comparative advantage is various factor endowments but not technology. Consequently, labor-rich countries should export labor-intensive products while capital-rich countries export capital-intensive products. Considering that the comparative advantage concept was challenged on two grounds: (1) the bilateral trade between countries with similar factor endowments, (2) the countries lacking natural resources performing exceptionally in international trade, Rybczynski [18] presented a new concept of competitive advantage. He pointed out that besides labor and capital differences, other factors such as natural resources, institutions, or macroeconomic environment could also determine the competitiveness of an economy. Porter [19] further stated in his competitiveness advantage theory that a national trade advantage is not simply determined by factor endowments like natural resources, labor, and capital, but to a large extent, industry innovation and upgrading capacity.
Overall, the above theories lay the foundations for assessing export competitiveness. However, the traditional measurements are mainly based on classifying exported products by factor intensity and technological intensity. Both classifications are challenged by a basic problem stemming from the relatively high level of aggregation [12]. To this end, Lall et al. [12] presented “sophistication” as a new classification criterion to distinguish between products and argued that export sophistication is the exported product characteristics which include the embodiment of higher-level technology as an important determinant. Hausmann et al. [20] further established a simple model to explain the rationale of the “export sophistication index” (which they called income/productivity level) based on the cost discovery theory [21]. In this index, the basic assumption is that the more technical the exported products coming from high-income countries, the higher the sophistication of the products. They stated that export sophistication presents both the export structure and the international position of specialization pattern in an economy’s particular industry. Therefore, this index can closely reflect the level of export competitiveness.
3. Literature Review
Previous studies have focused on China’s agri-food trade and its international competitiveness. Many pieces of work have suggested that labor-intensive products possess a significant comparative advantage in the Chinese agri-food trade, while land-intensive products are lacking [22]. Li et al. further investigated the comparative advantage and competitiveness changes for China’s APs. Their findings show that labor-intensive APs sustain a competitive advantage while land-intensive APs suffer a competitive disadvantage [23]. Compared to the large exporting countries of APs, the overall competitiveness of China’s APs is weak, and part of labor-intensive products have international competitiveness [24].
Regarding the classificatory study on agri-food export competitiveness, most researchers have studied the cotton industry [25], fruit and vegetable industry [26,27], soybean industry [28], aquatic products [29,30], and livestock products [31]. These studies mainly applied the IMS, CMS, RCA, TC, and diamond models to measure export competitiveness. However, these traditional methods can hardly reflect the real change in the APs export structure [11].
Researchers focusing on export competitiveness research are moving from “quantity” to “quality”, studying the technology structure in a country’s export [32,33,34]. Hausmann et al. [20] first proposed the measure of the sophistication of an economy’s export basket. Practical applications of this measure have recently been realized in studies on the export competitiveness of manufactured goods [35], services [36], and agricultural products [11,37]. This approach helps measure the changes in the technical level of exported goods, thereby reflecting their levels of competitiveness in the international market [38]. From a product-classification point of view, the export competitiveness of different APs varies greatly, and labor-intensive products have strong international competitiveness compared to land-intensive products that suffer from competitive disadvantages [11]. Yang F.M. and Tian Y.Y. [38] further compared agri-food export competitiveness between China and several developed countries. They found that the Chinese agri-food export technology structure is still predominant in low and medium-low technology products, while aquatic products, horticultural products, and other APs have strong export competitiveness.
Few studies are dedicated to China’s export competitiveness of agri-food sectors at the sub-national level, mainly based on the traditional measurement of trade competitiveness [39,40,41,42], such as MS, TC, RCA, and the diamond model.
Regarding Xinjiang’s agri-food export, its overall competitiveness has decreased recently and remained at a lower-middle level compared to the other regions within China [2,7]. However, the overall export competitiveness of APs calculated by the traditional indices reflects much more change in export scale rather than the change in export structure [11]. In addition, the detailed export competitiveness analysis of APs is usually neglected in empirical works, despite the importance of this topic at the regional level. The existing literature has not yet employed the export sophistication index to elaborate the technology structure of regional APs export, and no quantitative verification study on regional agri-food export competitiveness from the sophistication perspective is available.
Hence, this paper aims to analyze Xinjiang’s APs export competitiveness by using the export sophistication index, considering the overall APs export and its subdivision into classes.
4. Materials and Methods
4.1. Agri-Food Products Classification
The classification of APs is required to investigate the export structure’s essential role in export competitiveness. Although many methods have been used to classify APs trade [13,43,44,45,46], no consensus has been formed. Following the WTO definition [47] and the practice of Lu F. and Mei X. [48], in this paper, we classify APs into six categories (for details, see Appendix A).
4.2. Export Sophistication Measurement Method and Sub-National Data
This paper applies the Hausmann et al. [20] procedure to measure the APs export sophistication. This procedure consists of two steps: first, we construct the associated sophistication level () of each good , by taking the weighted average of the income levels of good exporters, where the weights correspond to the revealed comparative advantage of each country in product .
Here, the numerator of value-share, , is the value of exports of the good by country . The denominator of value-share, , is the total value of country ’s exports. acts as a normalization so that the sum of the coefficients to 1. refers to the per capita income of the country , measured as the gross domestic product (GDP) per capita in constant 2017 international dollar term retrieved from the World Development Indicator (WDI) database of the World Bank [49].
The sophistication level associated with country ’s exports, denoted by , is the weighted average of the for that country, where the weights are the shares of each good in the country’s total exports. This index thus reflects the average level of sophistication of country ’s export basket.
Then following the practice of Yin & Tian [11], the relative export sophistication level of country (refers as ) can be computed by simple comparison of to the average of all the sample exporters (here includes ), thereby aiming to reflect its relative position and the current export competitiveness across all the sample exporters. A value above 1 means higher export competitiveness over the average level of sample countries, while values below 1 point revealed lower export competitiveness than the average.
We measure product-level sophistication () for each year during 2002–2021, using the United Nations (UN) Comtrade database [50]. In order to ensure data consistency and validity of the matching with Chinese customs data, the commodity codes use the 1992 version of Harmonized System (HS 1992). This database, one of the most widely used data sources for trade analysis, offers bilateral trade flows at the 6-digit product level.
This paper focuses on Xinjiang; therefore, we need data split at the sub-national level. We then construct the index for the export baskets of Chinese regions (including 31 provinces and prefectures, except Hong Kong, Macao, and Taiwan), as in Equation (2). The primary source here is Chinese customs data, which report regional-level APs exports and imports by 4-digit product over the 2002–2021 period [8]. Note that to compute the index for each region, the Chinese customs data should be converted into the HS 1992 classification to match the 1992 classification applied in the UN Comtrade database according to the practice of [51]. We also construct the index for regional comparison to correctly assess the level and its relative position of export competitiveness of Xinjiang’s APs across the whole country, as indicated in Equation (3).
5. Results
5.1. The Sophistication of Xinjiang’s APs Export Structure
The annual average of (for details, see Appendix B) for various types of APs exported worldwide during 2002–2021 was calculated using Equation (1). We then, following the practice of Cao and Hanson-Rasmussen [52], compute the quintiles based on these averages and thereby categorize the APs of 83-type into five grades, i.e., high-sophistication products ( $36,721), medium-high-sophistication products ($28,440 $36,721), medium-sophistication products ($20,159 $28,440), medium-low-sophistication products ($11,878 $20,159), and low-sophistication products ( $11,878). The detailed technology structure distribution of APs is reported in Table 1. Accordingly, we can assess the technology structure of Xinjiang’s APs export.

Table 1.
The technology structure distribution of the world’s APs.
Table 2 shows the dynamic distribution of the sophistication of Xinjiang’s exported APs over the 2002–2021 period. This result presents that Xinjiang’s APs exports are concentrated in both medium-sophistication and medium-low-sophistication products. From 2002 to 2021, the cumulative average annual export volume of these products amounted to as high as 87.42%, while the average yearly export proportion of high-sophistication APs is only 0.34%, and that of medium-high-sophistication APs just reaches 5.58%. It is expected that the overall sophistication of Xinjiang’s APs export, to a large degree, is very close to medium-sophistication grade.
Table 2.
Xinjiang’s APs export technology structure, 2002–2021 (ratio %).
5.2. Overall Agri-Food Export Competitiveness of Xinjiang
Figure 1 shows of Xinjiang and its national ranking changes over the period 2002–2021. This bar chart presents an upward trend in the export sophistication of Xinjiang’s APs since 2002. The increased from $14,859 in 2002 to $25,664 in 2021, with an increase of 72.72%, and the corresponding national rankings moved from 31st to 22nd. The export sophistication changed in stages: increasing sharply over the first three years with an average annual increase of 21.71%, then fluctuating within a small range from $19,700 to $24,100 during the period 2005–2020, and passing $25,000 in the year 2021. Its corresponding national rankings, however, fluctuated tremendously over the last two decades, from a fast rise during 2002–2013 (peaking at 4th) to a stable stage of nearby middle level within the country (between 11th and 22nd) during 2014–2021 (represented by the line in Figure 1). In addition, there is a slight fluctuation (except for 2002) near the medium-sophistication grade concerning the export sophistication of Xinjiang’s APs, showing a middle-level sophistication at a national level, as expected. These results indicate that, along with the expanding scale of Xinjiang’s APs export, its structure has been optimized, and the competitiveness, from an export sophistication perspective, has been strengthened.
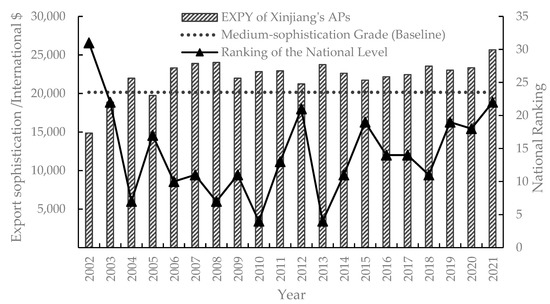
Figure 1.
The change in export sophistication of Xinjiang’s APs and national ranking, 2002–2021. Source: Authors’ computations based on UN Comtrade, WDI, and Chinese customs data.
Analyzing the relative export sophistication gives further insights into the changes in export competitiveness of Xinjiang’s APs described above (Figure 2). Overall, the fluctuated upward (visible with the logarithmic trend line), from less than 0.8 in 2002 to a stable period (1 nearby) during the period 2003–2021. These findings indicate that, overall, the export competitiveness of Xinjiang’s APs had also improved compared to the national average during the period analyzed. However, the trends of change in vary over the different periods. During the first three years (2002–2004), the increase was robust, with an upward trend of , showing a significant improvement in the export competitiveness of Xinjiang’s APs compared to the national average. During 2005–2020, the continuous slight fluctuations between 0.95 and 1.11 demonstrate that the export competitiveness of Xinjiang APs was nearly level-pegging with the country’s average level. It is worth noting that there is a reported decline in from 0.98 to 0.93 during 2020–2021. The result implies that unsurprisingly given the rankings, the competitiveness of Xinjiang’s APs export was losing nationally, though the export sophistication increased and first reached $25,664 over the same period (shown in Figure 1). By contrast, upgrading the export competitiveness of Xinjiang’s APs has occurred slower than the national average since the outbreak of the COVID-19 pandemic, which requires the attention of policymakers.
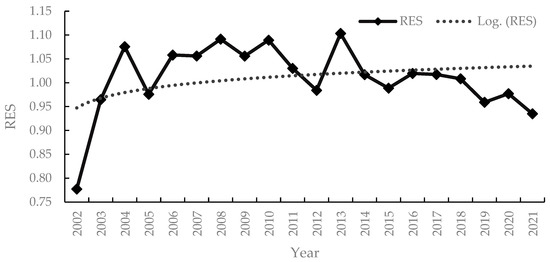
Figure 2.
The trend in relative export sophistication of Xinjiang’s APs compared to the national average, 2002–2021. Source: Authors’ computations based on UN Comtrade, WDI, and Chinese customs data.
In Figure 3, we consider the average annual growth rate of over the study period (2002–2021) across Chinese provinces. We find a relatively higher growth rate in Xinjiang (3.33%, which ranks 4th) here, confirming that the gap between the export competitiveness of Xinjiang’s APs and the national average has shrunk in export sophistication since WTO accession overall.
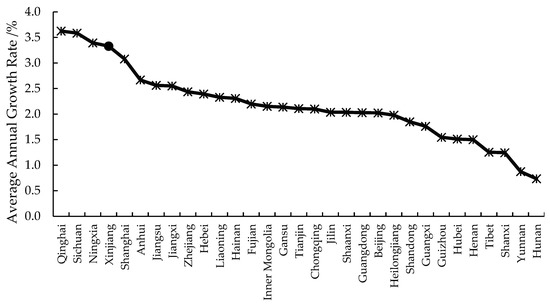
Figure 3.
The average increase in export sophistication of APs across China’s prefectures, 2002–2021. Source: Authors’ computations based on UN Comtrade, WDI, and Chinese customs data.
5.3. Classification of Agri-Food Export Competitiveness of Xinjiang
We have conducted a final analysis of the changes in the export competitiveness of Xinjiang’s various APs. Although the export competitiveness of Xinjiang’s APs has improved overall and maintained nearby the middle level, different kinds of APs exhibit considerable variations in land output, labor productivity, and technological content per year. These variations translate into additional temporal changes in export sophistication and competitiveness of diverse APs. A critical contribution of our classificatory study helps find the significant parts accounting for the lower export sophistication and thereby provides evidence for further upgrading the export structure and enhancing the overall export competitiveness of Xinjiang’s APs.
Figure 4 and Figure 5 show the changes in export sophistication of Xinjiang’s major APs during 2002–2021. The standard deviation in export sophistication among these six major APs over the study period is always substantial, with a figure of 6438 on average. This result indicates a significant difference in the export competitiveness of Xinjiang’s various major APs. The horticultural products constantly held a leading place in the hierarchy of export sophistication, with an average of $17,893. In addition, horticultural products are the most significant contributor to the overall sophistication of Xinjiang’s APs export, with an 81% average share from 2002 to 2021. Over the same period, bulk APs, livestock products, beverage and tobacco, and other APs are much smaller, with 4%, 1%, 1%, and 13% average shares. Therefore, the gap between horticultural products and the other five major APs is quite large, indicating that horticultural products have enormous competitiveness in Xinjiang.
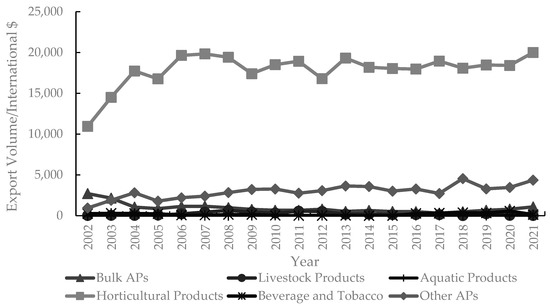
Figure 4.
The export sophistication of Xinjiang’s major APs, 2002–2021. Source: Authors’ computations based on UN Comtrade, WDI, and Chinese customs data.
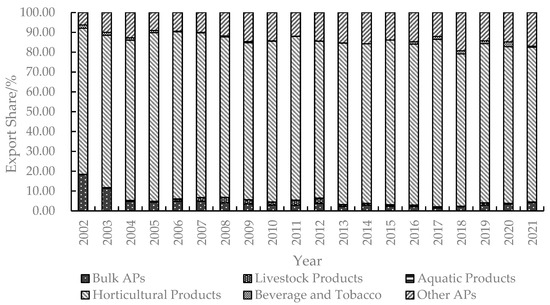
Figure 5.
The percentage of export sophistication of Xinjiang’s major APs, 2002–2021. Source: Authors’ computations based on UN Comtrade, WDI, and Chinese customs data.
Regarding the changes in export sophistication of Xinjiang’s major APs, the trends are also significantly different. Overall, the export sophistication of aquatic products, other APs, horticultural products, and livestock products showed an upward trend from 2002 to 2021, with an increase of 1345%, 365%, 83%, and 30%, respectively. While the rest of the two major APs reported a 60% (bulk APs) and 41% (beverage and tobacco) decline over the same period.
Table 3 presents the position of export sophistication of Xinjiang’s major APs for the whole country during 2002–2021. These national rankings show that only horticultural products constantly held a leading place, ranking among the top 3 during the study period. This result further confirms the strong export competitiveness in horticultural products of Xinjiang within China, while the other five kinds of major APs were in the rear position, with average rankings higher than 20. This result reflects a significant gap in the export competitiveness of these products in Xinjiang compared to other localities in China, requiring policymakers’ attention.
Table 3.
The national rankings in export sophistication of Xinjiang’s major APs, 2002–2021.
In Table 4, we present the relative sophistication of Xinjiang’s various major APs over the 2002–2021 period, aiming to figure out the gap between Xinjiang and the national average. All the horticultural products’ during the study period were more significant than 2, with an average value of 2.537, which clearly shows that horticultural products not have strong competitiveness in Xinjiang but also are far better than the intermediate level in the whole country. The situation of bulk APs, livestock products, aquatic products, beverage and tobacco, and other APs have been less favorable, with lower of less than one. These findings indicate that Xinjiang’s APs, excluding horticultural products, have weak competitiveness and are at much lower levels than the national average. These results align with the above calculations of export sophistication and national rankings (Figure 4 and Figure 5 and Table 3). The dynamic change in the export share of Xinjiang’s APs also helps to explain this competitiveness structure (Table 5).
Table 4.
The relative export sophistication of Xinjiang’s major APs compared to the national average, 2002–2021.
Table 5.
The dynamic change in export share of Xinjiang’s major APs, 2002–2021 (%).
Considering the evolution of Xinjiang’s sophistication over time, distinguishing between labor- and land-intensive products, the recent upgrading of Xinjiang’s APs export is mainly confined to labor-intensive products. Overall, the of all labor-intensive APs has risen rapidly. For instance, the relative export sophistication of aquatic, livestock, and horticultural products increased by 717.6%, 153.25%, and 14.33% between 2002 and 2021. Over the same period, land-intensive APs, such as bulk APs, decreased substantially by 51.5%. Hence, the gap between Xinjiang’s labor-intensive and land-intensive APs export competitiveness among the whole country widened. These results receive strong support from a comparison of export share value in the six kinds of major APs (Table 5). The traditional land-intensive APs, such as bulk APs, have one of the dominant products in Xinjiang’s APs export, showing a sharp decline from 46.68% in 2002 to 6.31% in 2021. Correspondingly, the labor-intensive APs, especially the horticultural products, accounted for 78.661% of total APs export in 2021, while this figure in 2002 was less than 48%.
The relative export sophistication of horticultural, livestock, aquatic, beverages, and tobacco products decreased from 2020 to 2021, showing the same trend as these products’ respective export share of Xinjiang’s APs. However, horticultural products, especially the two types of APs (HS08 and HS20) dominating both the export structure and technology structure, fell slightly with a decrease of 0.70% and 0.31% in export share, respectively (Appendix C). This result essentially accounts for the above opposite trend, i.e., an increase in the export sophistication of Xinjiang’s APs during the period 2020–2021, while the over the same period experienced a decline. Once the horticultural products are excluded from labor-intensive APs, the others of comparative advantages in Xinjiang become “a weaker actor” in the international market, thereby having no evident export competitiveness compared to the national average.
6. Discussion
The results above align with the previous empirical studies and expectations. Zhu and Li [7] and Zhang [2] found that Xinjiang’s APs export has relative competitiveness overall. Zhang further pointed out that Xinjiang’s APs are at a lower-middle competitiveness level among all the provinces and prefectures in China. The conclusions of our study support these viewpoints from the perspective of export sophistication. Statistics show that Xinjiang’s main exported APs were focused on HS08 (Fruit and nuts, edible; peel of citrus fruit or melons) and HS20 (Preparations of vegetables, fruit, nuts, or other parts of plants), with an annual average export share of 19.44% and 54.27%, respectively (see Appendix C for the export share values). HS08 and HS20 are medium-low and medium-sophistication APs, respectively (see Table 1 for the classification), which accounts for the current technology structure predominant of exporting medium-low (an average share of 27.7%) and medium- (a moderate share of 59.71%) sophistication products. Thereby, to a large extent, it results in a slight fluctuation (except in the year 2002) near the medium-sophistication grade, which basically shows the medium-level competitiveness of Xinjiang’s APs export in China.
Additionally, a similar message comes from a comparison in export sophistication of APs between Xinjiang and the whole country. The agri-food export sophistication of Xinjiang has a similar overall uptrend to that of the entire country [53]. Still, it is also higher than the medium-low-sophistication level shown in China’s APs export structure [38].
Regarding the six major APs, labor-intensive products dominate Xinjiang’s APs export compared to land-intensive products [7,54]. The study’s findings confirm these points of view and identify the specific competitiveness structure in the different factor-intensive products following the classification [55]. Currently, the fundamental characteristic of the factor endowment in Xinjiang is the rich labor resources but a shortage of arable land and capital per capita [54]. As expected, labor-intensive APs, especially horticultural products, aquatic products, and some other APs, gained better development in Xinjiang’s APs export. These products also displayed a faster rise in export sophistication than land-intensive products such as bulk APs and tobacco (Figure 4 and Figure 5). However, only horticultural products in Xinjiang show greater export competitiveness than the whole country. Additionally, the gap in export competitiveness between horticultural products and the other APs is still very large from both the export sophistication and relative export sophistication perspectives. The possible reasons why horticultural products become the most competitive APs in Xinjiang are both the local low-cost labor [54] and tremendous demand of off-seasonal fruit and vegetable products from the Central Asian countries close to Xinjiang [56].
The recent literature has also found negative impacts of the COVID-19 pandemic on Xinjiang’s APs export [6]. This result is also consistent with our study’s findings. Still, this negative impact on the export competitiveness of horticultural products in Xinjiang is weaker than for other APs categories, such as the livestock, aquatic, and beverage industries. This finding implies that policymakers need to pay more attention to export sophistication, as it reveals differences among sectors’ competitiveness and can help to identify areas of intervention to increase these sectors’ economic sustainability.
However, one should also be aware of the diversity in the scope and classification of APs and the limitations of the export sophistication index. At present, the scope and classification of APs vary greatly, mainly including the standards of the WTO [47], the European Union [57], and their extended versions proposed by Li & Mei [48] or used by Mizik [58,59,60]. These are all defined based on the HS system or Standard International Trade Classification (SITC), but various standards might result in different conclusions [61]. Thus, researchers should pay attention to the research objectives and the industry classification of different countries. Moreover, Hausmann et al.’s [20] measure of sophistication has been criticized for failing to consider the processing trade factor and the change in export structure. As far as regional export structure in a country is concerned, the entrepôt trade factor also needs to be considered. Therefore, fruitful avenues for further research include the identification of the trade pattern in Xinjiang, which contribute to export sophistication, as well as studies exploring improvements and further applications of this method.
7. Conclusions
Based on the export sophistication index, we have studied changes in Xinjiang’s agri-food export competitiveness and its national position over the 2002–2021 period. This study’s key novelty is an analysis of Xinjiang’s APs export technology structure from the perspective of export sophistication, thereby correctly grasping the agri-food export competitiveness distribution in Xinjiang, which affects its economic sustainability and its status in the Chinese economy.
- (1)
- Xinjiang’s export of APs is dominated by medium and medium-low-sophistication products, which shows a regionally medium-sophistication level. Overall, along with the expanding scale of Xinjiang’s APs export, its structure has been optimized. In addition, its competitiveness has been strengthened, as highlighted by the gradual rise of between 2002 and 2021. Additionally, the export competitiveness of Xinjiang’s APs is also nearby at an intermediate level in the whole country, but its upgrading during 2020–2021 appeared to be slower than the national average since the outbreak of the COVID-19 pandemic, which requires the attention of the policymakers.
- (2)
- There are significant differences between the export competitiveness of Xinjiang’s major APs and its changes, denoted by export sophistication. Horticultural products constantly hold a top place, not have strong competitiveness in Xinjiang, but also are far better than the average level in the whole country. While bulk APs, livestock products, aquatic products, beverages and tobacco, and other APs are less competitive, and the gap between them and horticultural products is quite large.
- (3)
- The gap in export competitiveness between Xinjiang’s labor- and land-intensive APs widened in terms of both absolute and relative sophistication. This result is in line with the theories of comparative advantage and factor endowment. The rich labor resources make the production cost of labor-intensive APs lower. Hence Xinjiang has more comparative advantages in labor-intensive APs, thereby possessing higher competitiveness than land-intensive products. However, once excluding horticultural products from the labor-intensive APs, the others, including aquatic products, livestock products, beverages, and some other products in Xinjiang, become “a weaker actor” in the international market, and have no apparent export competitiveness compared to the national average.
Based on the results above, some implications and recommendations for policymakers were also drawn. On the one hand, the low share of medium-high and high-sophistication exports restricts the overall export competitiveness of Xinjiang’s APs. This result is in line with the export structure predominantly based on raw materials and primary processing of agricultural products in Xinjiang. In this respect, Xinjiang, an immense region rich in agricultural resources and the largest number of inland ports in China, needs to transform the resource and location advantages into long-term economic sustainability by strengthening investment in talent and technology research and introducing advanced technology in some fields. On the other hand, the export structure of Xinjiang’s APs is highly concentrated in horticultural products. It shows an unfortunate trend in export competitiveness distribution: ”the strong getting stronger and the weak getting weaker.” Xinjiang policymakers need to intensify place branding actions and create local APs brands for the horticultural products that enjoy strong competitiveness (especially HS20 and HS08). Special policy measures are required to improve the technical content of livestock, aquatic, and beverage industries’ APs exports and reverse the relative downtrend of other less competitive labor-intensive products.
Author Contributions
Conceptualization, J.W. and Y.Z.; methodology, J.W. and Y.Z.; software, J.W.; validation, J.W., Y.Z., M.C. and Z.M.; formal analysis, J.W. and Z.M.; investigation, Y.Z.; resources, J.W. and Y.Z.; data curation, J.W. and Y.Z.; writing—original draft preparation, J.W. and Y.Z.; writing—review and editing, Z.M. and M.C.; visualization, J.W.; supervision, Y.Z.; project administration, J.W., Z.M. and Y.Z.; funding acquisition, J.W. All authors have read and agreed to the published version of the manuscript.
Funding
This research was sponsored by Natural Science Foundation of Xinjiang Uygur Autonomous Region (Grant No. 2021D01B52).
Data Availability Statement
Publicly available datasets were analyzed in this study. This data can be found here: [https://comtrade.un.org (accessed on 10 July 2022); http://data.drcnet.com.cn (accessed on 10 July 2022); https://data.worldbank.org.cn (accessed on 10 July 2022)].
Conflicts of Interest
The authors declare no conflict of interest.
Appendix A
Table A1.
Product classification scheme of APs trade.
Table A1.
Product classification scheme of APs trade.
| Section | Division Description and HS Codes |
|---|---|
| 1 Bulk APs | 10-Cereals; 11-Products of the milling industry; malt, starches, inulin, wheat gluten; 17-Sugars, and sugar confectionery; 19-Preparations of cereals, flour, starch, or milk; pastrycooks’ products; 1201–1208 Oleaginous seeds, nuts, and fruits; 1507–1515 Vegetable oils and fats, not chemically modified; 5201–5203 Raw cotton; Cotton waste; Cotton, carded or combed |
| 2 Livestock Products | 01-Animals live; 02-Meat and edible meat offal; 04-Dairy produce; birds’ eggs; natural honey; edible products of animal origin, not elsewhere specified or included; 1501–1506 Animal oils and fats; 1601–1603 Meat products; 4101–4103 Raw hides and skins; 4301-Raw fur skins 5001–5003 Raw silk and silk waste; 5101–5103 Wool and animal hair |
| 3 Aquatic Products | 03-Fish and crustaceans, mollusks, and other aquatic invertebrates 1604–1605 Prepared or preserved fish; caviar and caviar substitutes; Crustaceans, mollusks, and other aquatic invertebrates |
| 4 Horticultural Products | 07-Vegetables and certain roots and tubers; edible; 08-Fruit and nuts, edible; peel of citrus fruit or melons; 09-Coffee, tea, mate, and spices; 18-Cocoa and cocoa preparations; 20-Preparations of vegetables, fruit, nuts, or other parts of plants |
| 5 Beverage and Tobacco | 22-Beverages, spirits, and vinegar; 24-Tabacco and manufactured tobacco substitutes |
| 6 Other APs | 05-Animal originated products; not elsewhere specified or included; 06-Trees and other plants, live; bulbs, roots, and the like; cut flowers and ornamental foliage; 13-Lac; gums, resins, and other vegetable saps and extracts; 14-Vegetable plaiting materials; vegetable products not elsewhere specified or included; 21-Miscellaneous edible preparations 23-Food industries, residues and wastes thereof; prepared animal fodder; 1209–1214 Miscellaneous seeds, nuts and fruits; Plants used primarily in industry or pharmacy; Straw, cereal straw, fodder; 1516–1522 refined edible fats or oils; Animal and vegetable waxes; 3301-Essential oil; 3501–3505 Protein-like substances; Modified starches; Colloidal substances; 5301-Flax; 5302-Hemp |
Note: Adapted from the classification of Lu & Mei (2000) [48]. Source: The data comes from the UN Comtrade database, and the product description is streamlined.
Appendix B
Table A2.
The annual average of export sophistication for APs, 2002–2021 (USD).
Table A2.
The annual average of export sophistication for APs, 2002–2021 (USD).
| HS Code | HS Code | HS Code | HS Code | ||||
|---|---|---|---|---|---|---|---|
| 4301 | 45,002 | 1602 | 29,997 | 5103 | 22,843 | 3301 | 15,966 |
| 1518 | 44,987 | 02 | 29,620 | 11 | 22,511 | 5002 | 15,656 |
| 3504 | 42,189 | 01 | 29,500 | 1522 | 21,982 | 17 | 15,524 |
| 3502 | 40,125 | 1210 | 29,320 | 03 | 21,889 | 5003 | 15,052 |
| 1501 | 39,491 | 1601 | 29,309 | 1509 | 21,247 | 1211 | 14,794 |
| 1506 | 38,674 | 1205 | 29,241 | 23 | 21,153 | 18 | 14,540 |
| 3501 | 38,016 | 5301 | 28,842 | 1515 | 20,220 | 1212 | 13,975 |
| 04 | 37,022 | 22 | 27,906 | 1206 | 19,678 | 5202 | 12,673 |
| 1603 | 36,475 | 1519 | 27,833 | 1201 | 19,348 | 5102 | 12,442 |
| 1502 | 36,033 | 1504 | 27,530 | 10 | 19,272 | 1511 | 12,126 |
| 1505 | 34,926 | 5302 | 26,703 | 06 | 19,183 | 14 | 10,260 |
| 1514 | 34,603 | 4102 | 26,026 | 1208 | 18,823 | 09 | 9953 |
| 19 | 34,517 | 05 | 25,751 | 5001 | 18,763 | 1521 | 9493 |
| 21 | 32,760 | 20 | 25,725 | 4103 | 18,477 | 1513 | 7403 |
| 3505 | 31,886 | 1605 | 25,598 | 1516 | 18,191 | 1202 | 7342 |
| 1209 | 31,882 | 1520 | 25,373 | 1507 | 17,305 | 1508 | 5323 |
| 3503 | 31,638 | 1517 | 24,689 | 1512 | 17,136 | 1207 | 5309 |
| 1503 | 30,811 | 1213 | 24,379 | 1604 | 17,040 | 5201 | 5184 |
| 1510 | 30,683 | 4101 | 23,525 | 08 | 16,603 | 5203 | 4038 |
| 1204 | 30,328 | 24 | 23,197 | 13 | 16,468 | 1203 | 3597 |
| 1214 | 30,212 | 5101 | 23,027 | 07 | 16,199 |
Source: Authors’ calculations based on UN Comtrade and WDI data.
Appendix C
Table A3.
The Changes in Export Share of Xinjiang’s Major APs, 2002–2021.
Table A3.
The Changes in Export Share of Xinjiang’s Major APs, 2002–2021.
| HS Code | 2002 | 2003 | 2004 | 2005 | 2006 | 2007 | 2008 | 2009 | 2010 | 2011 | 2012 | 2013 | 2014 | 2015 | 2016 | 2017 | 2018 | 2019 | 2020 | 2021 |
|---|---|---|---|---|---|---|---|---|---|---|---|---|---|---|---|---|---|---|---|---|
| 01 | - | 0.01 | - | - | - | 0.11 | 0.15 | - | - | - | 0.13 | - | - | - | - | - | - | - | - | - |
| 02 | - | - | 0.02 | 0.05 | 0.50 | 0.76 | 1.82 | 1.57 | 1.15 | 1.82 | 1.52 | 0.63 | 0.57 | 0.46 | 0.47 | 0.37 | 0.03 | 0.68 | 0.13 | 0.09 |
| 03 | 0.02 | - | 0.14 | - | 0.09 | - | - | 0.03 | 0.10 | 0.12 | 0.13 | 0.09 | 0.04 | 0.07 | 0.03 | 0.02 | 0.08 | 0.01 | 0.05 | 0.02 |
| 04 | 0.08 | 0.07 | 0.09 | 0.17 | 0.18 | 0.50 | 0.18 | 0.03 | 0.05 | 0.04 | 0.03 | - | 0.10 | - | - | 0.05 | 0.03 | 0.05 | 0.02 | 0.01 |
| 05 | 1.79 | 5.47 | 7.06 | 2.84 | 2.51 | 1.54 | 1.79 | 2.80 | 2.74 | 3.68 | 3.28 | 2.75 | 1.83 | 1.88 | 2.20 | 1.82 | 1.89 | 0.91 | 0.93 | 1.38 |
| 06 | - | 0.02 | 0.05 | 0.02 | 0.14 | 0.04 | 0.02 | 0.01 | - | - | - | 0.03 | 0.03 | 0.75 | 0.10 | 0.05 | 0.03 | 0.01 | - | 0.03 |
| 07 | 1.22 | 1.00 | 1.31 | 6.41 | 2.70 | 2.32 | 2.44 | 3.09 | 5.10 | 3.55 | 2.24 | 3.09 | 6.07 | 6.32 | 6.16 | 4.18 | 2.43 | 1.91 | 2.44 | 1.46 |
| 08 | 1.58 | 4.01 | 7.35 | 14.36 | 14.26 | 12.31 | 12.08 | 18.58 | 20.27 | 21.21 | 20.09 | 18.12 | 16.19 | 20.48 | 21.87 | 35.28 | 31.76 | 35.45 | 32.13 | 31.43 |
| 09 | 0.15 | 0.94 | 1.83 | 4.47 | 0.51 | 1.07 | 1.13 | 0.57 | 0.68 | 0.26 | 0.23 | 0.22 | 0.14 | 0.61 | 0.99 | 1.60 | 1.89 | 1.38 | 1.37 | 1.17 |
| 10 | 3.74 | 3.87 | 0.34 | 0.81 | 1.99 | 1.83 | 0.58 | 1.01 | 1.36 | 1.19 | 0.60 | 0.20 | 0.43 | 0.10 | 0.07 | 0.17 | 0.05 | 0.02 | - | - |
| 11 | 0.09 | 0.18 | 0.68 | 0.53 | 0.78 | 1.92 | 1.63 | 1.03 | 0.22 | 0.59 | 0.37 | 0.32 | 0.27 | 0.06 | 0.02 | 0.06 | 0.04 | 0.01 | 0.02 | 0.02 |
| 13 | 0.72 | 0.97 | 0.35 | 0.34 | 0.38 | 0.59 | 0.38 | 0.72 | 1.55 | - | 2.32 | 3.27 | 3.55 | 1.82 | 0.92 | 1.50 | 1.50 | 1.22 | 0.93 | 1.21 |
| 14 | - | 0.02 | 0.03 | 0.16 | - | - | - | - | 0.08 | - | 0.68 | 0.66 | 0.28 | 0.93 | 0.10 | 0.04 | 0.06 | 0.04 | 0.03 | 0.04 |
| 17 | 0.02 | 1.01 | 0.32 | 0.28 | 0.10 | 0.01 | 0.06 | 0.07 | 0.09 | 0.17 | 0.11 | 0.05 | 0.09 | - | 0.01 | 0.16 | 0.12 | 0.01 | 0.03 | 0.07 |
| 18 | - | - | 0.01 | - | 0.02 | 0.02 | 0.01 | 0.06 | 0.09 | 0.07 | 0.08 | 0.03 | - | - | - | 0.04 | 0.06 | 0.11 | 0.03 | 0.02 |
| 19 | 0.96 | 1.22 | 1.91 | 1.45 | 1.50 | 0.85 | 0.79 | 0.62 | 0.78 | 0.52 | 0.47 | 0.31 | 0.31 | 0.41 | 0.33 | 0.43 | 0.49 | 0.49 | 0.65 | 1.09 |
| 20 | 44.06 | 57.16 | 65.91 | 59.41 | 65.68 | 64.79 | 62.25 | 54.21 | 55.22 | 60.46 | 54.27 | 57.67 | 57.18 | 53.80 | 50.90 | 44.98 | 44.95 | 43.03 | 44.94 | 44.59 |
| 21 | 0.35 | 0.54 | 0.63 | 0.57 | 2.18 | 1.74 | 2.53 | 3.84 | 4.39 | 3.41 | 3.85 | 6.10 | 5.35 | 4.80 | 6.14 | 5.44 | 8.12 | 5.24 | 5.73 | 5.71 |
| 22 | 0.02 | 0.06 | 0.11 | 0.06 | 0.09 | 0.08 | 0.04 | 0.03 | 0.03 | 0.02 | 0.01 | 0.02 | 0.02 | 0.02 | 0.78 | 0.20 | 0.43 | 0.52 | 1.61 | 0.03 |
| 23 | 0.73 | 1.10 | 2.94 | 1.23 | 1.36 | 2.33 | 2.89 | 1.71 | 1.53 | 1.69 | 1.58 | 1.07 | 0.14 | 0.50 | 1.09 | 0.76 | 2.18 | 2.42 | 2.62 | 3.67 |
| 24 | 0.99 | 1.17 | 0.93 | 0.85 | 0.20 | 0.18 | 0.54 | 0.53 | 0.16 | - | 0.03 | 0.16 | - | - | 0.02 | 1.27 | 1.03 | 0.62 | 0.26 | 0.55 |
| 1201 | - | 0.01 | - | - | - | - | - | - | - | 0.05 | 0.01 | - | 0.10 | - | 0.02 | - | - | - | - | - |
| 1202 | 0.01 | - | - | 0.01 | - | - | - | - | - | - | - | - | - | - | - | 0.02 | - | - | - | - |
| 1203 | - | - | - | - | - | - | - | - | - | - | - | - | - | - | - | - | - | - | - | - |
| 1204 | - | - | - | - | - | - | - | - | - | - | - | - | - | - | - | - | - | - | - | - |
| 1205 | - | - | - | - | - | - | - | - | - | - | - | - | - | - | - | - | - | - | - | - |
| 1206 | - | - | - | 0.08 | 0.02 | 0.15 | 0.05 | 0.15 | 0.29 | - | 0.75 | 0.41 | 0.44 | 0.49 | 0.29 | 0.15 | 0.54 | 0.91 | 1.85 | 1.63 |
| 1207 | 0.03 | 0.06 | 0.03 | - | 0.39 | 0.26 | 0.31 | 0.31 | 0.39 | - | 4.33 | 3.49 | 4.60 | 4.13 | 5.34 | 0.62 | 1.36 | 3.78 | 2.64 | 3.48 |
| 1208 | - | - | - | - | - | - | - | - | - | - | - | - | - | - | - | 0.18 | 0.08 | 0.13 | 0.05 | - |
| 1209 | 0.05 | 0.18 | 0.23 | 0.24 | 0.22 | 0.25 | 0.12 | 0.36 | 0.21 | - | 0.05 | 0.07 | 0.08 | 0.01 | 0.02 | 0.02 | 0.04 | 0.02 | 0.02 | 0.05 |
| 1210 | 0.59 | 0.51 | 0.01 | 0.09 | 0.01 | 0.07 | 1.16 | 0.59 | 0.15 | - | - | 0.01 | 0.01 | 0.03 | 0.08 | 0.01 | 0.02 | 0.01 | - | - |
| 1211 | 0.53 | 0.44 | 2.31 | 1.99 | 1.11 | 0.58 | 0.72 | 0.64 | 0.78 | - | 0.96 | 0.39 | 0.34 | 0.13 | 0.55 | 0.17 | 0.09 | 0.08 | 0.07 | 0.18 |
| 1212 | 0.08 | 0.20 | 0.60 | 0.94 | 1.63 | 3.36 | 2.64 | 5.27 | 1.94 | - | 0.63 | 0.48 | 0.95 | 1.65 | 1.03 | 0.31 | 0.49 | 0.82 | 1.25 | 1.71 |
| 1213 | - | - | - | - | - | - | - | - | - | - | - | - | - | - | - | - | - | - | - | - |
| 1214 | - | - | 0.08 | - | - | 0.01 | - | - | - | - | - | - | - | - | - | - | - | - | - | - |
| 1501 | - | - | - | - | - | - | - | - | - | - | - | - | - | - | - | - | - | - | - | - |
| 1502 | - | - | - | - | - | - | - | - | - | - | - | - | - | - | - | - | - | - | - | - |
| 1503 | - | - | - | - | - | - | - | - | - | - | - | - | - | - | - | - | - | - | - | - |
| 1504 | - | - | - | - | - | - | - | - | - | - | - | - | - | - | - | - | - | - | - | - |
| 1505 | - | - | - | - | - | - | - | - | - | - | - | - | - | - | - | - | - | - | - | - |
| 1506 | - | - | - | - | - | - | - | - | - | - | - | - | - | - | - | - | - | - | - | - |
| 1507 | - | - | - | - | - | - | - | - | - | - | - | - | 0.11 | - | - | - | - | - | - | - |
| 1508 | - | - | - | - | - | - | - | - | - | - | - | - | - | - | - | - | - | - | - | - |
| 1509 | - | - | - | - | - | - | - | - | - | - | - | - | - | - | - | - | - | - | - | - |
| 1510 | - | - | - | - | - | - | - | - | - | - | - | - | - | - | - | - | - | - | - | - |
| 1511 | - | - | - | 0.02 | 0.04 | 0.05 | 0.08 | 0.06 | 0.08 | 0.13 | 0.12 | 0.08 | 0.02 | - | - | - | - | - | - | - |
| 1512 | 0.27 | 0.28 | 0.02 | 0.20 | 0.02 | 0.04 | 0.31 | 0.22 | 0.02 | 0.14 | 0.05 | - | - | 0.03 | - | - | - | - | - | - |
| 1513 | - | - | - | 0.01 | 0.01 | - | - | - | - | - | - | - | - | - | - | - | - | - | - | - |
| 1514 | - | - | - | - | - | - | - | - | - | - | - | - | - | - | - | - | - | - | - | - |
| 1515 | - | 0.01 | - | - | - | 0.02 | - | - | - | - | - | - | - | - | - | 0.01 | 0.01 | - | - | 0.01 |
| 1516 | - | - | - | 0.01 | - | 0.02 | 0.03 | - | - | - | - | - | - | - | - | - | - | - | - | - |
| 1517 | - | - | - | - | 0.02 | 0.03 | 0.08 | 0.10 | 0.08 | 0.06 | 0.07 | - | - | - | - | - | - | - | - | - |
| 1518 | - | - | - | - | - | - | - | - | - | - | - | - | - | - | - | - | - | - | - | - |
| 1519 | - | - | - | - | - | - | - | - | - | - | - | - | - | - | - | - | - | - | - | - |
| 1520 | - | - | - | - | - | - | - | - | - | - | - | - | - | - | - | - | - | - | - | - |
| 1521 | - | - | - | - | - | - | - | - | - | - | - | - | - | - | - | 0.01 | - | - | - | - |
| 1522 | - | - | - | - | - | - | - | - | - | - | - | - | - | - | - | - | - | - | - | - |
| 1601 | - | - | - | - | - | - | - | - | - | - | - | - | - | - | - | - | - | - | - | - |
| 1602 | 0.01 | - | - | - | 0.04 | 0.01 | 0.01 | - | - | - | - | - | - | - | - | - | - | - | - | - |
| 1603 | - | - | - | - | - | - | - | - | - | - | - | - | - | - | - | - | - | - | - | - |
| 1604 | - | - | 0.31 | 0.01 | 0.13 | 0.03 | 0.01 | 0.03 | 0.08 | 0.06 | 0.19 | 0.03 | 0.04 | 0.11 | 0.01 | 0.04 | 0.09 | 0.10 | 0.14 | 0.16 |
| 1605 | - | - | - | - | - | - | - | - | - | - | - | - | - | - | - | - | 0.08 | - | - | - |
| 3301 | 0.01 | - | 0.06 | 0.09 | 0.02 | 0.04 | 0.01 | 0.05 | 0.01 | 0.05 | 0.08 | 0.13 | 0.35 | 0.28 | 0.25 | 0.01 | 0.02 | 0.01 | 0.01 | 0.08 |
| 3501 | 0.31 | 0.03 | 0.63 | 0.86 | 0.37 | 1.02 | 0.27 | 0.10 | 0.32 | 0.36 | 0.30 | 0.04 | 0.09 | - | - | - | - | - | - | - |
| 3502 | - | - | - | - | - | - | - | - | - | - | - | - | - | - | - | - | - | - | - | - |
| 3503 | - | - | - | - | - | - | - | - | - | - | 0.01 | - | 0.12 | 0.01 | 0.10 | 0.01 | - | - | - | - |
| 3504 | - | - | - | 0.03 | 0.12 | 0.10 | 0.06 | 0.04 | 0.01 | - | - | - | 0.02 | - | - | - | - | 0.01 | - | 0.02 |
| 3505 | - | - | - | 0.03 | - | 0.01 | 0.03 | - | 0.01 | - | - | - | 0.01 | 0.01 | - | - | 0.01 | 0.01 | 0.04 | 0.10 |
| 4101 | - | - | - | - | - | - | - | - | - | - | - | - | - | - | - | - | - | - | - | - |
| 4102 | - | - | - | - | - | - | - | - | - | - | - | - | - | - | - | - | - | - | - | - |
| 4103 | - | - | - | - | - | - | - | - | - | - | - | - | - | - | - | - | - | - | - | - |
| 4301 | - | - | - | - | - | - | - | - | - | - | - | - | - | - | - | - | - | - | - | - |
| 5001 | - | - | - | - | - | - | - | - | - | - | - | - | - | - | - | - | - | - | - | - |
| 5002 | - | - | - | - | - | - | - | - | - | - | - | - | - | - | - | - | - | - | - | - |
| 5003 | - | - | - | - | - | - | - | - | - | - | - | - | - | - | - | - | - | - | - | - |
| 5101 | - | 0.06 | - | 0.04 | 0.01 | - | - | - | - | - | - | - | - | - | - | - | - | - | - | - |
| 5102 | - | - | - | 0.01 | - | - | - | - | - | - | - | - | - | - | - | - | - | - | - | - |
| 5103 | - | - | - | - | - | - | - | - | - | - | - | - | - | - | - | - | - | - | - | - |
| 5201 | 41.55 | 19.41 | 3.71 | 1.32 | 0.66 | 0.97 | 2.83 | 1.55 | 0.03 | 0.33 | 0.41 | 0.11 | 0.15 | 0.12 | 0.10 | - | - | - | - | - |
| 5203 | 0.01 | 0.01 | - | - | - | - | - | - | - | - | - | - | - | - | - | - | - | - | - | - |
| 5301 | - | - | - | - | - | - | - | - | - | - | - | - | - | - | - | - | - | - | - | - |
| 5302 | - | - | - | - | - | - | - | - | - | - | - | - | - | - | - | - | - | - | - | - |
Note: “-” is not zero except for HS1519 due to data loss resulting from keeping two decimal places. Source: The raw data of calculation results are from Chinese customs data.
References
- Zhang, K.H. What drives export competitiveness? The role of FDI in Chinese manufacturing. Contemp. Econ. Policy 2015, 33, 499–512. [Google Scholar] [CrossRef]
- Zhang, X. Research on the Export Competitiveness of Xinjiang’s Agricultural Products. Master’s Thesis, Shihezi University, Xinjiang, China, 2015. [Google Scholar]
- Long, Y. Export Competitiveness of Agricultural Products and Agricultural Sustainability in China. Reg. Sustain. 2021, 2, 203–210. [Google Scholar] [CrossRef]
- Chinese Regional Economic Database. Available online: http://data.drcnet.com.cn (accessed on 10 July 2022).
- Wang, J.; Zhu, G.; Deng, Y.; Zhang, Q. The Present State and Potential Evaluation of Bilateral Agricultural Trade Between Xinjiang in China and Kazakhstan—An Empirical Study Based on Gravity Model. Chin. J. Agric. Resour. Reg. Plan. 2021, 42, 72–84. [Google Scholar]
- Wang, J.; Zhang, D.; Lv, J. Analysis on the Situation and Countermeasures of Xinjiang Agricultural Products Trade in 2021. Pract. Foreign Econ. Relat. Trade 2022, 3, 78–82. [Google Scholar]
- Zhu, X.; Li, Y. Analysis on the Export Competitiveness of Xinjiang’s Agricultural Products. Xinjiang State Farms Econ. 2009, 12, 27–31+46. [Google Scholar] [CrossRef]
- Chinese Macroeconomic Database. Available online: http://www.drcnet.com.cn (accessed on 10 July 2022).
- Guanghui, Z.; Chong, C.; Jingjing, W. Analysis on the Problems and Strategies of Agri-Food Export in Xinjiang, China. Pract. Foreign Econ. Relat. Trade 2020, 54–57. [Google Scholar]
- Johnston, B.F.; Mellor, J.W. The Role of Agriculture in Economic Development. Am. Econ. Rev. 1961, 51, 566–593. [Google Scholar]
- Yin, Z.; Tian, T. Changes of China’s Agricultural Products Export Competitiveness and International Comparison: Based on Export Technology Complexity. J. Agrotech. Econ. 2013, 77–85. [Google Scholar]
- Lall, S.; Weiss, J.; Zhang, J. The “Sophistication” of Exports: A New Trade Measure. World Dev. 2006, 34, 222–237. [Google Scholar] [CrossRef]
- Mizik, T.; Szerletics, Á.; Jámbor, A. Agri-Food Export Competitiveness of the ASEAN Countries. Sustainability 2020, 12, 9860. [Google Scholar] [CrossRef]
- Smith, A. An Inquiry into the Nature and Causes of the Wealth of Nations; Methuen & Co. Ltd.: London, UK, 1776. [Google Scholar]
- Ricardo, D. On the Principles of Political Economy and Taxation; John Murray: London, UK, 1817. [Google Scholar]
- Heckscher, E.F. The Effect of Foreign Trade on the Distribution of Income. Ekon. Tidskr. 1919, 21, 497–512. [Google Scholar]
- Ohlin, B. Interregional and International Trade; Harvard University Press: Cambridge, MA, USA, 1993. [Google Scholar]
- Rybczynski, T.M. Factor Endowment and Relative Commodity Prices. Economica 1955, 22, 336. [Google Scholar] [CrossRef]
- Porter, M.E. The Competitive Advantage of Nations; Free Press: New York, NY, USA, 1990. [Google Scholar]
- Hausmann, R.; Hwang, J.; Rodrik, D. What You Export Matters. J. Econ. Growth 2007, 12, 1–25. [Google Scholar] [CrossRef]
- Hausmann, R.; Rodrik, D. Economic Development as Self-Discovery. J. Dev. Econ. 2003, 72, 603–633. [Google Scholar] [CrossRef]
- Zhang, Y. Analysis of Chinese Agricultural Product Trade. Proc. Bus. Econ. Stud. 2021, 4, 61–65. [Google Scholar] [CrossRef]
- Li, Y.; Wu, Y.; Zhao, M. Review of China’s Agricultural Products Trade and Study on the Change of International Competitiveness of China’s Agricultural Products after Entering WTO. J. Int. Trade 2007, 8, 67–72. [Google Scholar]
- Qu, X.; Huo, X. The Analysis of Agro- Products’Export Structure and Competitive Capacity in China. J. Int. Trade 2007, 3, 9–15. [Google Scholar]
- Liu, C.; Gao, Y. Positive study on the international competitiveness of China’s cotton products. In Proceedings of the 2019 3rd International Conference on Education, Economics and Management Research (ICEEMR 2019), Singapore, 29–30 November 2019; Atlantis Press: Paris, France, 2019. [Google Scholar]
- Zhang, X. Comprehensive comparative analysis on export competitiveness of vegetable industry among provinces in China. In Proceedings of the 2nd International Conference on Culture, Education and Economic Development of Modern Society (ICCESE 2018), Moscow, Russia, 1–3 March 2018; Atlantis Press: Paris, France, 2018. [Google Scholar]
- Azam, A.; Shafique, M. An Overview of Fruits and Vegetables Trade of China. Int. J. u- e- Serv. Sci. Technol. 2018, 11, 33–44. [Google Scholar] [CrossRef]
- Bao, J. New Trade Protectionism and Strategic Trade Policy of China: An Analysis on Infant Industry and Protection Effectiveness. J. Int. Trade 2007, 5, 10–15. [Google Scholar]
- Kang, H.; Yang, Z.; Zhang, Z. The Competitiveness of China’s Seaweed Products in the International Market from 2002 to 2017. Aquac. Fish. 2021. [Google Scholar] [CrossRef]
- Tan, L.; Wu, C.; Qu, Y. Measuring the International Trade Competitiveness of China’s Aquatic Products from 2008–18. J. Coast. Res. 2020, 106, 157. [Google Scholar] [CrossRef]
- Zhang, Z.; Qiao, J. An Empirical Analysis on International Competitivenessof China’s Pork Products. J. Int. Trade 2011, 7, 39–48. [Google Scholar]
- Yang, Y.; Wang, Q.; Gao, Y.; Zhao, L. Does Environmental Regulation Promote the Upgrade of the Export Technology Structure: Evidence from China. Sustainability 2022, 14, 10283. [Google Scholar] [CrossRef]
- Fan, P. Export Technological Sophistication of China: Measurement and Impact Factor. Discret. Dyn. Nat. Soc. 2021, 2021, 3561495. [Google Scholar] [CrossRef]
- Su, H.; Hou, F.; Yang, Y.; Han, Z.; Liu, C. An Assessment of the International Competitiveness of China’s Forest Products Industry. For. Policy Econ. 2020, 119, 102256. [Google Scholar] [CrossRef]
- Hu, Y. Does Economic Policy Uncertainty Affect the Export Technological Sophistication of Manufacturing Industries? Leibniz Information Centre for Economics: Kiel, Germany, 2020. [Google Scholar]
- Mishra, S.; Lundström, S.; Anand, R. Service Export Sophistication and Economic Growth; World Bank Policy Research Working Paper; World Bank: Washington, DC, USA, 2011; Volume 5606. [Google Scholar]
- Antimiani, A.; Carbone, A.; Costantini, V.; Henke, R. Agri-Food Exports in the Enlarged European Union. Agric. Econ. Zemědělská Ekon. 2012, 58, 354–366. [Google Scholar] [CrossRef]
- Yang, F.; Tian, Y. Comparative Analysis of the Competitiveness of China, Japan and South Korea’s Agricultural Products Exports: Based on the Perspective of Export Technology Complexity. J. Tech. Econ. Manag. 2022, 1, 88–93. [Google Scholar]
- Yu, H.; Qi, Y.; Yan, Y.; Cui, P. Research on the International Export Competitiveness of Honey—Taking Anhui Province as an Example. SHS Web Conf. 2015, 14, 02015. [Google Scholar] [CrossRef]
- Sun, F.; Cao, S. Research on the Export Competitiveness of Agricultural Products in Anhui Province of China from the Low-Carbon Perspective. E3S Web Conf. 2021, 275, 02031. [Google Scholar] [CrossRef]
- Zhen, Z.; Qin, L. A study on honey export competitiveness of Hubei province. In Proceedings of the 2012 International Conference on Information Management, Innovation Management and Industrial Engineering, Sanya, China, 20–21 October 2012; pp. 203–206. [Google Scholar]
- Dawut, A.; Tian, Y. Competitiveness of Xinjiang’s Mutton Industry Based on Diamond Model. PLoS ONE 2021, 16, e0257669. [Google Scholar] [CrossRef] [PubMed]
- Juhász, A.; Wagner, H. An Analysis of Hungarian Agri-Food Export Competitiveness. Stud. Agric. Econ. 2013, 115, 150–156. [Google Scholar] [CrossRef]
- Matkovski, B.; Kalaš, B.; Zekić, S.; Jeremić, M. Agri-Food Competitiveness in South East Europe. Outlook Agric. 2019, 48, 326–335. [Google Scholar] [CrossRef]
- Bojnec, Š.; Fertő, I. Agro-Food Trade Competitiveness of Central European and Balkan Countries. Food Policy 2009, 34, 417–425. [Google Scholar] [CrossRef]
- Lu, F.; Mei, X. Estimation of the Impact of China’s WTO Accession on the Agricultural Distribution among Provinces. Econ. Res. J. 2001, 67–73. [Google Scholar]
- WTO Technical Notes. Available online: https://www.wto.org/ (accessed on 23 July 2022).
- Lu, F.; Mei, X. Study on the Provincial Distribution of the Impact of China’s WTO Accession on the Agriculture; China Center for Economic Research: Beijing, China, 2000. [Google Scholar]
- The World Bank Database. Available online: https://data.worldbank.org.cn (accessed on 10 July 2022).
- The United Nations Comtrade Database. Available online: https://comtrade.un.org (accessed on 10 July 2022).
- Jarreau, J.; Poncet, S. Export Sophistication and Economic Growth: Evidence from China. J. Dev. Econ. 2012, 97, 281–292. [Google Scholar] [CrossRef]
- Cao, X.; Hanson-Rasmussen, N. Dynamic Change in the Export Technology Structure of China’s Environmental Goods and Its International Comparison. Sustainability 2018, 10, 3508. [Google Scholar] [CrossRef]
- Bai, Y. Research on the measurement and its influencing factors of the technical complexity of agricultural products export in China. In Recent Trends in Decision Science and Management; Springer: Singapore, 2020; pp. 185–195. [Google Scholar]
- Chen, C.; Huo, X. Study on the Countermeasures to Improve the Export Competitiveness of Agricultural Products in Western China. Product. Res. 2005, 11, 156–157, 167. [Google Scholar] [CrossRef]
- Zhu, J.; Li, T.X.; Zhang, S. Factor content and trade-induced farm employment change in China’s agricultural trade. In Proceedings of the 2012 International Conference on Management Science & Engineering 19th Annual Conference Proceedings (ICMSE 2012), Dallas, TX, USA, 20–22 September 2012; pp. 928–935. [Google Scholar] [CrossRef]
- Ma, H.; Liu, Y. Analysis on the Characteristics and Competitiveness of Vegetable Trade between Xinjiang and Central Asian Countries. Issues Agric. Econ. 2011, 32, 77–80. [Google Scholar] [CrossRef]
- Banterle, A.; Carraresi, L. Competitive Performance Analysis and European Union Trade: The Case of the Prepared Swine Meat Sector. Food Econ. Acta Agric. Scand. Sect. C 2007, 4, 159–172. [Google Scholar] [CrossRef]
- Mizik, T. Agri-Food Trade Competitiveness: A Review of the Literature. Sustainability 2021, 13, 11235. [Google Scholar] [CrossRef]
- Mizik, T.; Gál, P.; Török, Á. Does Agricultural Trade Competitiveness Matter? The Case of the CIS Countries. AGRIS On-Line Pap. Econ. Inform. 2020, 12, 61–72. [Google Scholar] [CrossRef][Green Version]
- Hoang, V. Van Investigating the Agricultural Competitiveness of ASEAN Countries. J. Econ. Stud. 2020, 47, 307–332. [Google Scholar] [CrossRef]
- Yao, S. Why Are Chinese Exports Not So Special? China World Econ. 2009, 17, 47–65. [Google Scholar] [CrossRef]
Publisher’s Note: MDPI stays neutral with regard to jurisdictional claims in published maps and institutional affiliations. |
© 2022 by the authors. Licensee MDPI, Basel, Switzerland. This article is an open access article distributed under the terms and conditions of the Creative Commons Attribution (CC BY) license (https://creativecommons.org/licenses/by/4.0/).