Abstract
At present, scientific and technical activities (STA) play a fundamental role in the creation of new knowledge necessary for the realisation of the goals of sustainable economic growth. The purpose of the research is to assess STA in countries of the world and Ukraine as well as to analyse the impact of STA on their sustainable economic growth. For the assessment of STA of world countries, we have developed a composite indicator (Index of STA–ISTA) based on two sub-indices (Potential of STA and Results of STA) and a set of partial indicators. The study is carried out using a theoretical and methodological approach that includes five research stages: calculating the ISTA of world countries with their subsequent ranking; assessing the impact of the ISTA on the economic growth of world countries; evaluating the correlations between the ISTA, the Global Innovation Index (GII), and the Human Development Index (HDI); breaking down world countries into groups with the help of cluster analysis, using data on the ISTA, GII, HDI; assessing and analysing the importance of environment-related technologies and innovations in ensuring the economic growth of countries of the world. According to the results of the study, the importance of STA in ensuring sustainable economic growth of countries of the world was confirmed. The use of cluster analysis to group countries of the world in terms of the level of STA made it possible to identify three clusters of countries: leaders, potential leaders, and catching-up countries. It has been proven that in order for a country to achieve leadership in terms of STA, it is important to harmoniously combine efforts to support and develop its scientific potential as well as to create principles for the implementation of scientific achievements in innovation activities to ensure its economic growth and improve the living standards of its population. Besides, the analysis allowed proving the existence of a moderately positive impact of the development of environment-related technologies and innovations on the acceleration of innovative development, improvement of the quality of life of the population, and the growth of GDP per capita.
Keywords:
scientific and technical activities; economic growth; sustainable development; potential of scientific and technical activities; R & D; results of scientific and technical activities; composite indicator; innovation activities; environment-related technologies and innovations; green growth 1. Introduction
Today, countries of the world must increasingly carefully adapt to the rapid economic, technological, and social changes taking place in a globalised world in order to ensure their economic growth. Many of these changes are caused by science and technology advancement, which in turn is due to scientific and technical activities (STA). As a result of STA, new ideas, products, services, and skills that contribute to improving the quality of life of individuals and society as a whole are created. The Agenda for Sustainable Development (UN, 2015), which considers the main trends to 2030, states that, in the modern world, STA are becoming a key tool for overcoming a wide range of socioeconomic and environmental problems. The document especially emphasises the fundamental role that science should play in the creation of new knowledge necessary for the implementation of the Sustainable Development Goals [1]. The 2030 Agenda (UN, 2015) assigns to science a new role, which is to generate scientific knowledge that helps humanity achieve the vision of sustainable development set out in the 17 Sustainable Development Goals [1]. Schneider et al. (2019), analysing the impact of research and development on sustainable economic growth, pointed out the need to intensify scientific activities in the face of global challenges and create conditions for economic growth in all countries of the world [2].
According to the Sustainable Development Goals (SDGs) defined by the UN, Target 9.5 is “Enhance research and upgrade industrial technologies”. Its implementation involves strengthening R & D, modernising the technological capabilities of industrial sectors in all countries, in particular developing ones, including, by 2030, taking measures to encourage innovation and significantly increase the number of researchers as well as research and development spending [3]. Thus, the SDGs emphasise the need to increase the potential of STA and improve their results.
In this context, technologies and innovations that ensure green growth are of particular importance. According to the OECD, green growth provides a practical and flexible approach for achieving tangible progress across its economic and environmental pillars, while taking full account of the social implications of greening the growth of economies. STA in the field of green growth ensures the conservation of natural assets and their ability to realise their full economic potential on a sustainable basis, including the provision of critical life support services (clean air and water) and resilient biodiversity required to support food production and human health [4]. Thus, the development of STA is an important source of economic growth as well as green growth, which together form the basis for the sustainable development of countries of the world.
The importance of STA, as a key factor affecting the economic and social growth of the world’s countries, was proved by many empirical and theoretical studies. For example, even in the neoclassical growth model proposed by Solow (1956), capital accumulation, population growth, and technological change were considered the main determinants of economic growth [5]. Griliches (1979) proved that growth in the productivity of labour was a consequence of an increase in spending on research and development [6]. The importance of the impact of R & D expenditures on economic growth and innovation was also noted by many other scholars (Romer (1990) [7], Lucas (1988) [8]). Grossman et al. (1994) considered the improvement of technologies through introducing industrial innovation and increasing investments in the development of scientific ideas to be the driving force behind the growth of living standards in the long run in advanced economies of the world [9]. Besides, it is worth mentioning empirical studies at the industry level (Mansfield (1972) [10], Griliches (1980) [11], Griliches (1998) [12]); the regional level (Bronzini et al. (2006) [13]); and the level of individual countries of the world (Griliches (1973) [14], Bozkurt (2015) [15]), Nadiri (1980) [16], Guellec et al. (2001) [17], which analysed the impact of R & D on economic growth, paying attention to positive changes due to an increase in R & D expenditures. The importance of STA for ensuring the development of man and society was proved by the existence of strong correlations between the level of development of scientific research and the standard of living [18]. The investigation carried out by Kenton (2019) demonstrated that STA contributed to technological advancement, allowing more efficient production of goods and services required to ensure the prosperity of countries of the world [19]. A significant impact of scientific research on the improvement of a country’s competitiveness and socioeconomic and political situation was justified using the practices of certain countries of the world, in particular, China [20], Ukraine [21], South Korea, and Israel [22].
Thus, numerous studies by scholars confirmed the influence of individual factors characterising STA on the economic growth of countries of the world. Consequently, under modern conditions, the competitiveness, national security, and economic power of a country are determined not only by the volume of the Gross National Product per capita and the availability of resources, capital, and labour force but also by the scientific and technical potential of the country as well as the efficiency of its use.
It should be emphasised that the separation of the concepts “scientific and technical potential of a country” and “results of scientific and technical activities of a country” allows much deeper consideration of the problem of assessing and analysing STA and opens up a wide field for the research and justification of key areas of support for the development of STA in the world’s countries. The same recommendations are offered by the Frascati Manuals (OECD, 2015), which underline the importance of assessing the potential of STA (inputs) and the results of STA (outputs) when measuring science, technology, and innovation [23].
The scientific and technical potential of a country is the total resource of its STA, which is determined not only by the amount of available scientific and technical resources but also by their quality, the ability to manage these resources and evaluate prospects for their use, the intrinsic interest of scientists, and their ability to make discoveries. Effective use of scientific and technical potential creates the basis for the development of STA results, on which a country’s sustainable economic growth depends. On the other hand, it can be assumed that countries with a high level of economic development pay considerable attention to building their scientific potential to ensure high scientific results. If in the last century it was STA that served as a driver of economic growth, as evidenced by numerous studies [3,4,5,6,7,8,9,10,11,12,13,14], now it is becoming increasingly clear that without the commercialisation of STA results through their implementation in production and innovations, scientific activities (especially at the stage of basic research) do not always have a direct positive impact on the economic growth of a country. The effectiveness of using scientific and technical potential is largely determined by the national innovation system as well as science and technology policies pursued by the country, the creation of conditions when both government and business are interested in the commercialisation of scientific achievements, able and ready to implement it.
Thus, scientific and technical activities are inextricably linked with innovation activities, which are precisely aimed at the use and commercialisation of scientific achievements and lead to the launch of new competitive goods and services. However, innovation activities of countries of the world may be not facilitated by their own STA potential and results, i.e., they can use R & D outcomes of other countries, as early as the implementation stage. Thus, it is necessary to clarify the possibility of economic growth of countries that do not have a strong STA potential and their own R & D outcomes to ensure the country’s innovativeness. It can also be assumed that it is the innovativeness of the country that ensures its economic growth, and improvement of the quality of life of its population, whereas the development of STA, especially as concerns emerging countries, increases their budget costs.
It should be noted that modern scientific publications widely discuss the issues of the impact of various indicators of scientific and technological development—expenditures on R & D, number of researchers, and innovations created as a result of scientific and technical activities—on economic growth. However, insufficient attention has been paid to assessing and studying the overall impact of STA on the socioeconomic development of countries.
In addition, the issues of dependence of the results of STA on the potential of STA remain important and still not fully clarified. Do high results of a country’s STA really lead to its economic growth? The impact of the development of environment-related technologies and innovations on the economic growth of countries of the world has not been sufficiently studied either.
Thus, there are still many problems that have not been fully resolved, but their study is important for determining the role of STA in ensuring the economic growth of countries of the world. These issues concern:
- Assessing the overall level of STA development of world countries, including the determination of their STA potential and results; identifying STA leaders and outsiders as well as identifying and analysing the problems of STA development in outsider countries.
- Assessing the impact of the STA potential of world countries on the STA results.
- Evaluating the interdependence between the level of STA development and economic growth, in particular, determining the impact of STA on the level of GDP per capita, innovativeness and standard of living of the population of countries of the world, which will allow identifying the gaps and factors that cause them across groups of countries on their way to sustainable economic development.
- Estimating the correlation between the overall level of STA development of world countries and environment-related technologies and innovations that serve as the basis for sustainable economic growth.
Thus, our investigation deals with the development of this research area as well as the clarification of the impact of STA on the economic growth of countries of the world under modern conditions.
The general structure of the article is as follows:
- Analysing the opinions of scientists on the problem of assessing STA and their impact on the economic growth of countries, revealing the existing contradictions and trends.
- Formulating the research goal.
- Justifying the choice and defining the essence of the key indicators that will form the basis of the study (i.e., those according to which the STA, innovative development, and economic growth of countries of the world will be assessed).
- Developing the structure of the index of STA and its sub-indices that will characterise the potential and results of STA.
- Providing a rationale for the proposed theoretical and methodological approach for assessing STA of countries of the world and determining their impact on countries’ economic growth as well as for the choice of the research tools and statistical base used.
- Presenting the results of the calculations carried out according to this theoretical and methodological approach with their consequent analysis.
- Defining the controversial issues revealed as a result of the study.
- Formulating conclusions of the study and outlining directions for further research.
2. Materials and Methods
2.1. Literature Review
Sustainable economic development of a country implies, first of all, its economic growth with consideration for the sustainable development goals, interests of the country’s population, and satisfaction of the population’s needs. The importance of studying factors that affect economic growth has been confirmed by numerous studies by academics and practitioners. For example, Gonzalez-Garcia et al. (2018) identified as decisive factors of a country’s economic growth such indicators as net income, number of companies, number of people with higher education, housing prices and unemployment rate in the country [24]. Pietrzak et al. (2016) revealed that economic growth was affected by such indicators as GDP per capita, labour productivity, unemployment among the population aged 55–65 years, and life expectancy [25]. Ssebunya et al. (2019) defined social well-being, economic stability, and efficiency of public administration as the key indicators of sustainable economic growth [26]. Song et al. (2018) singled out land ownership, food insecurity, living conditions, personal wealth, and subjective change in wealth as the main indicators of economic growth [27].
At the same time, most scholars noted the decisive influence of a country’s STA on its sustainable economic growth. For example, Cadil et al. (2018) determined the importance of public research and development to ensure the economic growth of countries of the world. The scientists considered an increase in the amount of funding for STA the key driver for the intensification of innovation activities in the country, the enhancement of its competitiveness, and sustainable economic growth [28]. Roztocki et al. (2019) also defined STA as a decisive factor in the development of innovations and economic growth [29]. Okokpujie et al. (2018) proved the influence of an improvement in the level of education and an increase in the scope of research and development on economic growth [30]. The research by Gulmez et al. (2012) also made it possible to determine the existence of a positive impact of STA on the socioeconomic development of 21 OECD member countries for the period 1990–2010. It was found that a 1% increase in research and development spending led to economic growth of 0.77% [31]. The study carried out by Maman et al. (2020), using the data from OECD countries for 2000–2016 and based on the construction of a multiple regression model, gave reason to conclude that an increase in research and development spending by 1% would lead to an increase in the growth rate of real GDP of countries up to 2.83% [32]. The conclusion about a significant positive impact of research and development on sustainable economic growth was made in the research by Pinto et al. (2016), based on the analysis of STA of 65 countries of the world for 36 years (1980–2016) [33], and Leogrande et al. (2020), based on the analysis of 36 countries for the period 2010–2019 [34]. The authors also proved that the impact of research results on economic growth was mainly due to the structural shifts, including the reallocation of resources to the industrial sector. Falk (2007) determined that higher expenditures on STA had a positive effect on the GDP growth rate [35]. A similar conclusion was made by other scientists (Blackburn et al. (2000) [36], Schofer et al. (2000) [37], Kwack et al. (2006) [38], Kuo et al. (2008) [39], Gumus et al. (2015) [40], Das et al. (2019) [41], Dinçer et al. (2019) [42], Skvarciany et al. (2020) [43], Kyzym et al. (2020), (2021) [44,45], Hece et al. (2020) [46], Škrinjarić (2020) [47], Hussain et al. (2020) [48]). Sustainable socioeconomic development, as a result of implementing research achievements, using skilled workers and increasing labour productivity, was studied in the publications of Blackburn et al. (2000) [36], Lee (2005) [49], Grossmann (2007) [50], and Khan et al. (2013) [51], based on the classical models of economic growth proposed by Grossman et al. (1991) [52], Barro (1991) [53], Aghion et al. (1992) [54]. The developed by Zeng (2001) [55] multi-sector dynamic general equilibrium growth model also proved a significant role of R & D and innovation in ensuring sustainable socioeconomic development.
Along with this, it is worth mentioning a group of researchers who believe that an increase in research and development spending does not necessarily lead to a growth in the real income of certain countries and their socioeconomic development (Levin et al. (1997) [56], Heller et al. (1998) [57], Boldrin et al. (2013) [58], Bozkurt (2015) [15], Williams (2017) [59]). In the research by Samimi et al. (2009), dealing with the impact of R & D expenditures on the economic growth of 30 developing countries over the period 2000–2006, the authors also concluded that, despite an insufficient level of spending on STA, a gradual economic growth was observed in most of the analysed countries, which proved the absence of influence of STA on their economic growth [60].
It should be noted that there are also a lot of publications that explore and prove the important role of STA in ensuring economic growth in the context of individual countries of the world. For example, Chou (2002), having studied the contribution of R & D and human capital to the development of the Australian economy, based on the analysis of data for the period 1960–2000, determined that the country’s sustainable economic growth depended both on the results of national and global research and the generation of new knowledge [61]. Ballot et al. (2001), having investigated the impact of STA and human resources on labour productivity in France and Sweden, based on data for the period 1987–1993, confirmed a significant role of these indicators in economic development [62]. Raychev et al. (2020), using the example of the development of STA in Bulgaria, proved the influence of R & D on the economic condition of the country [63]. Khan et al. (2013), using the practice of Pakistan, justified the need to increase investment in STA to ensure economic growth [51,64]. The same opinion was expressed by Blanco et al. (2013) as to the economic growth of the USA [65], Bayarçelik et al. (2012) as to the economic development of Pakistan [66], Rajapova (2020) as to STA of Uzbekistan [67], Yu et al. (2021) as to the economic growth of China [68], and Dobrzanski et al. (2020) regarding the economic development of individual member states of the Association of Southeast Asian Nations [69]. At the same time, Hu et al. (2007) believed that there was insufficient proof of the relationship between growth in intellectual property and the level of development of a country. They stated that an increase in spending on STA could not be effective for all countries of the world [70].
There is also a group of studies dealing with the analysis of the influence of individual factors on STA and sustainable economic growth and the mutual interaction of these factors. For example, Jones (2002), using the model of economic growth he proposed, proved that long-run economic growth depends on the discovery of new ideas. He also justified that, in the long run, the stock of ideas was proportional to worldwide research efforts, which in turn was proportional to the total population of innovating countries [71]. Almeida et al. (2007) investigated the influence of patent activity on STA in the context of the level of economic development of countries of the world. Based on the study of 88 countries for the period 1996–2003, they revealed a negative impact of patenting on the level of investment in research and development in general. At the same time, it was determined that an increase in the number of patents had a positive effect on the intensity of expenditures on STA in less developed countries of the world, whereas in countries with a higher level of economic development such dependence was not confirmed [72]. Das (2020) demonstrated that an increase in expenditures on STA and the number of patents had a significant positive impact on economic growth only in the long run, whereas such dependence was not observed in the short run [73]. The opposite conclusion was made by Sierotowicz (2015), who, based on an assessment of patent activity in 28 countries of the European Union for the period 1999–2013, determined that an increase in the total domestic expenditures on STA entailed an increase in patent activity in the long run only in countries with a high level of socioeconomic development [74]. Altuzarra (2019) in turn revealed the existence of a relationship between STA expenditures, the number of patents, and economic development, using the practice of Spain [75]. At the same time, Danguy et al. (2009), based on the study of 18 industries in 19 countries, determined the absence of a significant impact of the number of patents on indicators characterising socioeconomic development, namely: research productivity and strategic propensity [76]. The same conclusions were made by Boldrin et al. (2013) [58], Otomo (2017) [77], Das (2020) [78], who found that there was no dependence on an increase in the level of innovation and productivity on the number of patents. Boldrin et al. (2013) admitted that a patent, as a document characterising the result of STA, had only a partial equilibrium effect on improving incentives for the implementation of an invention, whereas its impact on innovation activities could be negative [58].
Finally, there are isolated studies that deal with assessing and analysing STA and their impact on sustainable economic growth in terms of STA potential and results. For example, Inhaber et al. (1978) determined the quantitative relationship between the output in the gross national product (GNP) created by STA and the resources used to achieve these results. The model proposed in the study implied the distribution of production based on the share of R & D input and the separation of expenditures on science and technology from all other resources for producing GNP [79]. Yingnan (2008) also suggested that, in assessing the impact of STA on GNP, it was necessary to separate the input of science and technology from all the inputs for producing GNP [80]. The Frascati Manuals (OECD, 2015) point out the expediency of assessing the potential of STA (inputs) and results of STA (outputs) in measuring science, technology, and innovation. At the same time, according to the OECD Guidelines (2015), scientific and technical potential includes resources related to scientific activities (personnel, equipment, expenditures on scientific activities, etc.), types of scientific activities and scientific services, and scientific products [23]. Although scientific results (outputs) are defined as products and services related to research, science or technologies produced during STA [81].
Thus, based on the analysis of publications on the issues under study, we can state the following: almost unanimously, the scientists proved an important role of STA in ensuring sustainable economic growth; when studying the impact of STA on economic growth of countries, they used various indicators characterising both STA and socioeconomic development; the assessment of STA in the studies was carried out either using comparable indicators and indices (composite indicators) for samples of countries or using partial indicators for individual countries of the world; most studies proved the existence of relationships between R & D expenditures, the number of researchers, patent activity, innovation, emergence, and accumulation of new ideas in the country and its economic growth, whereas some studies questioned such relationships or specified that they concerned only certain groups of countries (developed or developing ones); the influence of STA on the economic growth of countries of the world was considered by the scientists from different aspects—as the influence of individual or composite indicators characterising STA on indicators of economic growth of countries (GDP and others) as well as the impact of individual or composite indicators characterising STA on innovative and human development in countries of the world; there were few studies where the assessment of STA and the analysis of their impact on economic growth was carried out with consideration for their potential and results.
The most important issue in analysing the impact of STA on the economic growth of countries of the world is choosing the assessment framework (indicators and indices to be used) that would characterise STA comprehensively, be correctly constructed (avoid overlapping indicators and correlated indicators), use statistical information that is reliable, comparable, accessible, and allowing comparisons to be made across countries.
The analysis of scientific publications has made it possible to determine that, today, various composite indicators (indices) are widely used to assess the level of development of countries’ STA. However, these indicators either cover mainly developed countries of the world or are not always based on a reasonable composition of partial indicators. For example, COSTII (2020) Composite Science and Technology Innovation Index includes only 35 countries belonging to the Organization of Economic Cooperation and Development (OECD) [82]. The proposed by Cozzens et al. (2007) composite indicator, characterising scientific, technological, and innovation activities of developed countries of the world, also includes only OECD countries [83]. This does not allow for assessing and comparing STA across developing countries and analysing peculiarities of STA development by groups of countries. The methodology used to calculate the Technology Achievement Index (Shahab (2015) [84]) is based on indicators that do not fully reflect modern technologies and their application (e.g., it contains such an indicator as telephones per capita (mainline and cellular), etc.), which also does not allow to obtain a correct assessment of STA for countries of the world.
In our study, we propose to carry out the assessment and analysis based on the composite index of STA, which is to characterise both STA potential and results, contain such a set of partial indicators that will allow the analysed sample of countries to include not only developed but also developing countries of the world. This in turn will provide a more thorough approach for measuring the impact of STA on the economic growth of countries of the world and identifying trends that exist in this area.
Moreover, we propose to conduct a comprehensive analysis of the impact of STA on the economic growth of countries of the world, considering both the direct impact of the results of STA on economic growth and the impact of STA on the innovative development of world countries and their standard of living.
2.2. Purpose and Structure of the Study
The main purpose of the research is to assess scientific and technical activities in countries of the world and Ukraine as well as to analyse the impact of STA on their economic growth.
Economic growth is one of the key goals of the macroeconomic policies of any country, the achievement of which ensures an outstripping growth of the real GDP compared to the population growth, to improve the living standards without going beyond the capacity of the economic ecosystem.
The measures that are most commonly used to assess the economic growth of a country are GDP per capita, production and consumption of main types of products per capita, economic performance indicators (calculated based on GDP), national income per capita, and indicators of standard of living and quality of life.
As justified above, it is reasonable to assess STA and analyse their impact on the economic growth of countries based on the composite index of STA, which is to characterise their potential and results, contain such a set of partial indicators that will allow considering the key features of potential and results of STA as well as including in the analysed sample of countries not only developed countries of the world but also developing ones. Thus, in order to assess the STA of countries of the world, we have developed a composite indicator (Index of STA) that is based on two sub-indices (Potential of STA and Results of STA) and a set of partial indicators (Figure 1).
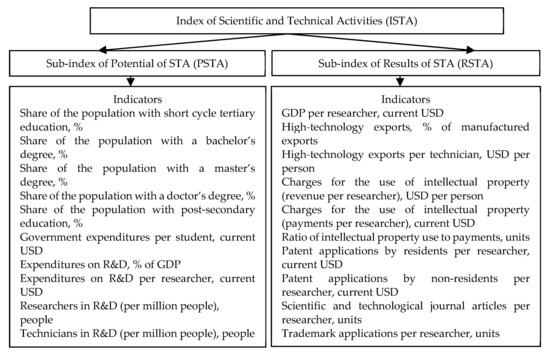
Figure 1.
Structure of the Index of STA. Source: developed by the authors.
The list of partial indicators for assessing the potential and results of STA is formed based on our previous research [85,86,87,88,89,90].
As shown by the analysis of scientific publications, STA can exert both direct influence on the economic growth of a country and indirect influence through innovative development and improvement of the standard of living. In our study, the impact of STA on economic growth is proposed to be determined through the relationship with GDP per capita, as one of the common indicators used in the modern economic literature to assess the economic condition and development of countries [26,33].
The indirect influence is supposed to be measured by determining the relationship between the Index of STA and the Global Innovation Index (GII), which is the most common index to assess the innovative development of countries of the world, as well as between the Global Innovation Index and the Human Development Index (HDI), which is also the most common tool for comparing living standards across countries and regions [27,28] (Figure 2).
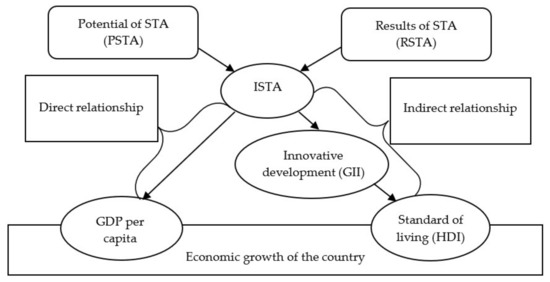
Figure 2.
Logic of assessing the Index of STA of countries of the world and analysing its relationship with their economic growth. Source: developed by the authors.
The study was carried out using the theoretical and methodological approach shown in Figure 3.
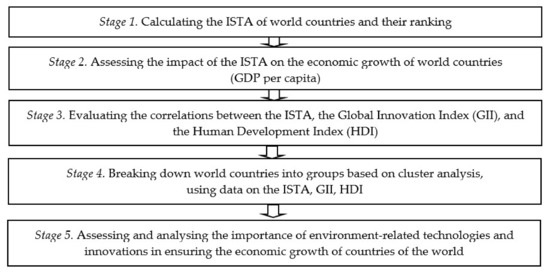
Figure 3.
Theoretical and methodological approach for assessing the ISTA of world countries and determining its impact on their economic growth. Source: developed by the authors.
The first stage of the proposed approach implied calculating the Index of STA, which was constructed as a composite indicator and made it possible to compare the results of STA by countries of the world.
Composite indicators are widely used in economic research. They help provide simple comparisons of countries that can be used to illustrate complex processes [91]. The construction of composite indicators implies the following: justification of the choice of indicators and selection of variables; normalisation and aggregation of data; presentation and visualisation [92].
The most important and reliable information for comparing the degree of development of individual countries of the world, including in the aspect of STA, is provided by the databases of the World Bank, OECD, and UNESCO. The comparison of international statistical databases, carried out by us in our previous studies to consider the possibility and expediency of using the information they presented to investigate the state of and trends in the development of STA in countries of the world by individual criteria [89], proved that the World Bank database, including 20 variables that characterise potential and results of STA in 260 countries of the world (both developed and developing ones), most fitted the objectives set. Thus, it was the information from this database that constituted the statistical basis of the study. The calculations were made for all countries, the data of which were available in the World Bank database for 2018. Newer data could not be used due to the fact that the information important for the analysis (e.g., expenditures on research and development, number of researchers, etc.) for most of the countries studied was presented in the World Bank database only until 2018. Therefore, in order to correctly compare all indicators, the study was conducted for the mentioned period.
To adjust differences in the measurement units across the indicators comprising the index and in the ranges of variation, all 20 variables were normalised to the range [0, 100], with higher scores representing better outcomes. The process of data normalisation and scaling was carried out with consideration for the minimum and maximum values of each indicator included in the index by the formula [92]:
where is the indicator index, which is calculated for partial indicators comprising the Index of STA or sub-indexes of RSTA and PSTA; xa is the actual value of the partial indicator; is the minimum value of the indicator observed in the countries under study; is the maximum value of the partial indicator observed in the countries under study.
The PSTA and RSTA sub-indices were calculated as the arithmetic mean of the obtained values of the characterising them partial indicators. If it was impossible to calculate the partial indicators for certain countries, then, provided that there were more than 3 such indicators out of 10 for each of the sub-indices, the countries were removed from the ranking. The calculation was adjusted depending on the number of indicators comprising the sub-index for a particular country.
The ISTA was calculated as the geometric mean of the two sub-indices:
For the purpose of presenting and visualising the obtained results, countries of the world were ranked in terms of the ISTA with its graphical display.
Further, groups (clusters) of countries were formed depending on their potential and results of STA (the PSTA and RSTA sub-indices). To carry out calculations according to the methodology, StatSoft Statistica 8.0 (software developer—StatSoft Inc., Tulsa, OK, USA) was used.
Procedures of cluster analysis are currently among the classification methods that are most widely used in practice. Cluster analysis refers to multivariate statistical methods of classifying objects by their characteristic features. A cluster is a group of objects selected as a result of such analysis carried out based on the degree of similarity or difference between the objects.
Cluster analysis has a number of advantages over other methods of data classification, which makes it appropriate for use in our study:
- It allows the breakdown of objects both by one feature and by a whole set of features, and the influence of each of the parameters can be quite simply strengthened or weakened by introducing appropriate coefficients into mathematical formulas.
- Cluster analysis does not impose restrictions as to the type of grouping objects and allows considering a variety of source data of an almost arbitrary nature.
- One of the peculiarities of clustering is that most of its algorithms are able to independently qualitatively determine the number of clusters into which the data should be divided as well as to highlight characteristics of these clusters without human intervention, only with the help of the algorithm used, which improves the quality of such a breakdown and eliminates the influence of subjectivity.
In order to determine the number of clusters and the proximity of countries in terms of potential and results of STA, a hierarchical classification was carried out based on the merge rule of the full link method. Euclidean distance was used as the degree of closeness. The full link method defines the distance between clusters as the largest distance between any two objects in different clusters (i.e., “most distant neighbours”). The measure of proximity, defined by the Euclidean distance, is a geometric distance in n-dimensional space.
Further, a vertical dendrogram of the hierarchical classification of countries of the world in terms of the PSTA and RSTA sub-indices was built. Based on the visual representation of the results, an assumption about the number of natural clusters was made. This assumption was verified using the k-means method. The k-means method is as follows: the calculations start with k randomly selected observations that become the group centres, after which the object composition of clusters is changed to minimise the variability within the clusters and maximise the variability between the clusters. Each subsequent observation (k + 1) belongs to the group the centre of gravity of which has the minimum similarity with it, i.e., the variance will be minimised within the final clusters and maximised between the clusters. The results of the k-means method are evaluated based on the analysis of variance, to determine the significance of the difference between the resulting clusters. If p < 0.05, the difference between clusters is considered significant [93,94].
The second stage of the approach involved estimating the dependence of GDP per capita (as the most widely used indicator of a country’s economic growth) on the ISTA of countries of the world, based on a correlation regression analysis.
Correlation analysis is one of the most commonly used methods for assessing relationships between individual indicators, which implies processing statistical data to measure the significance of the relationship between two or more variables [93]. The level of correlation between indicators is determined using correlation coefficients [92]. The choice of the method for calculating the correlation coefficient depends on the type of variable measurement scale. Thus, to measure variables with an interval and quantitative scale, we used the Pearson correlation coefficient, which was calculated according to the formula [92]:
where are the indicators the correlation between which is studied; are the average values of the studied indicators.
Correlation analysis is closely related to regression analysis. The simplest and most common type of regression analysis (corresponding to the objectives of our study) is the construction of a linear regression, which involves finding a linear function that, according to certain mathematical criteria, best fits the data. For example, in the least squares method, the sum of the squared deviations of a function from the actual variables is minimised [92]:
where a, b are the coefficients of linear dependence; i is the data on a particular country; n is the number of countries under study.
The third stage of the proposed approach implied evaluating the correlations between the ISTA, the Global Innovation Index (GII), and the Human Development Index (HDI), which made it possible to study the indirect impact of STA on the economic growth of countries of the world.
The Global Innovation Index (GII) is a composite indicator intended for evaluating innovative development. It is compiled annually in collaboration with Cornell University, the French graduate business school INSEAD, and the World Intellectual Property Organization. The total number of scores in the GII ranking that can be obtained by a country is determined by calculating the ratio of two sub-indices:
- Innovation Input Sub-Index, which is used to gauge elements of the national economy that enable and facilitate activities in the field of innovation. It comprises five pillars (Institutions, Human capital and research, Infrastructure, Market sophistication, and Business sophistication).
- Innovation Output Sub-Index, which reflects the results of innovation activities within the economy. It is based on two pillars (Knowledge and Technology outputs and Creative outputs).
As a composite indicator characterising the standard of living in countries of the world, the study used the Human Development Index (HDI)—a summary measure calculated annually to compare the standard of living, education, and life expectancy as the key characteristics of the human potential of world countries [95]. It is a quite common tool for a general comparison of the standard of living in different countries and regions. The index was developed in 1990 [31] and has been published by the United Nations Development Program in annual Human Development Reports since 1990. It includes the following dimensions and indicators: long and healthy life (life expectancy at birth); knowledge (mean years of schooling and the expected years of schooling); a decent standard of living (GNI per capita (PPP $)).
The analysis of relationships between the ISTA, GII, and HDI was carried out by calculating the Pearson correlation coefficient using the Formula (3).
The fourth stage (Figure 3) implied conducting a cluster analysis in the context of countries of the world, based on data on the ISTA, GII, and HDI, with the use of an application package Statistica 8.0 (software developer—StatSoft Inc., Tulsa, OK, USA). The breaking down of countries of the world into clusters that characterise their level of STA, innovation activities, and human development was intended to measure the existing inequality between world countries in terms of standard of living and level of generation and implementation of new knowledge.
The fifth stage (Figure 3) involved studying the significance of environment-related technologies and innovations in ensuring the economic growth of countries of the world by the defined groups of countries. For this purpose, based on OECD data [96], the key indicators characterizing environment-related technologies and innovations were selected and the composite indicator was calculated as the arithmetic mean of the normalised indicators. Further, based on the calculation of coefficients of correlation between this indicator and the ISTA, GII, HDI, and GDP per capita for all countries under study, the degree and nature of the impact of environment-related technologies and innovations on the economic growth of countries was determined.
3. Results
In accordance with the proposed theoretical and methodological approach (Figure 3), at the first stage of the study, PSTA, RSTA, and ISTA of countries of the world were calculated (Figure 1).
Initially, 217 countries of the world presented in the World Bank database were considered. As a result of collecting data on the determined indicators and their analysis, 72 countries, the information of which 2018 was most complete, were selected. Other countries were excluded from the calculation due to the lack of data required for the application of the proposed methodology for calculating the sub-indices and the general index of STA.
The calculation of the PSTA sub-index made it possible to rank 72 countries of the world in terms of the potential of STA, which was assessed using data on the level of educational attainment of the population, spending on education and science, and the number of researchers in the countries under study (Figure 1).
The ranking of countries of the world based on the calculated PSTA is given in Table 1.

Table 1.
Ranking of countries of the world based on the sub-index of PSTA.
The division of countries of the world into groups in terms of PSTA level was performed by means of statistical grouping, a method based on two categories—a grouping feature (the PSTA values of individual countries) and the interval. The PSTA grouping was carried out using equal intervals. The size of the interval was determined as the difference between the highest and lowest values of the PSTA feature divided by the number of groups. That is, the interval was equal to (0.741702 − 0.042747)/3 = 0.233. Therefore, according to the ranking based on the PSTA score (Table 1), countries of the world were broken down into three groups: countries with a high potential of STA (from 0.467), countries with a sufficient potential of STA development (from 0.234 to 0.466) and countries with a low potential of STA (to 0.233).
Top ratings were given to such countries as Switzerland, the United States of America, Denmark, Sweden, Singapore, the Republic of Korea, Israel, etc., which were included in the group of countries with a high level of STA potential.
According to the above ranking and grouping of countries of the world, in 2018, Ukraine took 47th place out of 72 countries. It was assigned to the group of countries with a sufficient potential for STA development. The governments of these countries pay attention to the training of highly qualified personnel but provide limited funding for educational and scientific activities. Moreover, there are a number of other country-specific issues hindering STA development.
The calculation of the RSTA sub-index made it possible to rank 72 countries of the world based on STA results (Figure 2). The sub-index was estimated using data on the number of patent applications by residents and non-residents of the country, trademark applications, level of scientific publication activity, revenue and payments for the use of intellectual property per researcher, as well as data on the share of high-tech exports in the total manufactured exports. The ranking of the countries of the world based on the calculated RSTA is given in Table 2.
Table 2.
Ranking of countries of the world based on the RSTA sub-index.
According to the ranking of countries of the world in terms of the RSTA, presented in Table 2, three groups of countries were distinguished by the equal interval method: countries with high results of STA (from 0.184), countries with average results of STA (from 0.092 to 0.183), and countries with low results of STA (to 0.091).
As can be seen, a high level of results of STA is characteristic of the following countries of the world: the United States of America, Singapore, Luxembourg, Ireland, Switzerland, China, and Malta. Based on the given ranking and grouping of countries of the world, in 2018, Ukraine took 64th place out of 72 countries, i.e., it was classified as one of the countries with low results of STA; in particular, a low share of exports of high-tech products and insignificant STA results per researcher, which are reflected in insufficient patent and scientific publication activity and high payments for intellectual property.
Furthermore, using the proposed approach (Figure 2), the general index of STA was calculated based on the previously presented sub-indices. The results of ranking countries of the world in terms of the ISTA are shown in Figure 4. As can be seen from Figure 4, in 2018, the United States ranked 1st in terms of the ISTA among the studied countries of the world, Singapore took 2nd place, and Switzerland occupied 3rd place. According to the general index of STA, Ukraine ranked 59th out of 72 countries in the world.
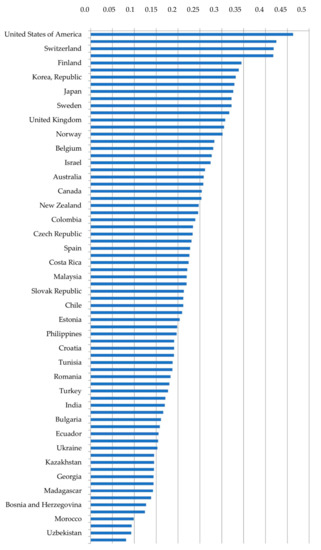
Figure 4.
Ranking of countries of the world based on the ISTA. Source: calculated by the authors.
The calculation of the coefficient of correlation between the PSTA and RSTA sub-indices showed that it was equal to 0.26, which indicated that: firstly, the autocollinearity between the sub-indices was absent, and there was a possibility of their simultaneous use in the assessment of STA; secondly, if a country had a high potential of STA, it would not necessarily have high STA results.
For a more thorough study of the relationship between the PSTA and RSTA, it was proposed to group the countries of the world by these two sub-indices using cluster analysis.
Further, the use of cluster analysis and a Statistica 8.0 software application package made it possible to break down countries of the world into groups, based on the data on the PSTA and RSTA sub-indices. The nature of the clusters was determined by checking the means for each cluster and each measure to assess how much they differ from each other (Figure 5).
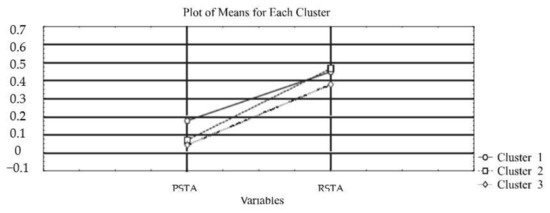
Figure 5.
Plot of the means of the sub-indices for the clusters formed based on the ISTA of world countries. Source: calculated by the authors.
The results of the k-means method were considered based on the analysis of variance (Table 3).
Table 3.
Results of the analysis of variance to determine the significance of the difference between the obtained clusters of countries of the world in terms of the level of STA.
Thus, since the value p < 0.05, indicating a significant difference between the clusters, the results obtained made it possible to conclude that the grouping of countries in terms of the level of STA was correct. The elements of the obtained clusters and the Euclidean distances of the objects from the centres (mean values) of the corresponding clusters are given in Table 4.
Table 4.
Cluster elements and the Euclidean distances of the objects from the centres (mean values) of the correspondent clusters.
According to the conducted analysis, three clusters of the world’s countries in terms of STA level were obtained. Cluster 1 was made up of countries–leaders in the context of STA level, i.e., countries that were at the forefront of independent scientific and technological research and implementation of STA results, demonstrating high achievements in the development of their research sphere.
Cluster 2 was formed by countries that were potential leaders in terms of STA, i.e., countries that had either an underdeveloped potential of STA or certain problems in the system of science commercialisation, which resulted in insufficient effectiveness of their STA. However, they managed to achieve significant scientific and technical results through the use of borrowed technologies. The results obtained for this cluster, as well as the large number of countries that were assigned to it, require further investigation of the reasons why these countries provided high STA results at a relatively low level of STA potential.
Cluster 3 was made up of catching-up countries in terms of the STA level, i.e., countries that did not adequately finance the development of their STA potential, had a number of problems hindering the development of STA, and demonstrated insignificant results in this sphere. Ukraine, in accordance with the classification, was included in this cluster.
Therefore, the research conducted with regard to the practice of Ukraine demonstrates that a sufficient potential of STA at low effectiveness of such activities can lead to an overall low level of STA in a country. This has allowed us to state that, in order to achieve leadership in terms of STA, it is important to harmoniously combine efforts to support and develop the country’s scientific potential as well as create appropriate conditions for the commercialisation of innovations, their implementation in the production of new or improved types of goods, services, or technologies to meet the needs of the country and its population and to promote such products on the market.
According to the second stage of the theoretical and methodological approach (Figure 3), we carried out an assessment of the dependence of the GDP per capita of countries of the world on their STA, using a correlation regression analysis. Based on the calculation results, the coefficient of correlation between the GDP per capita of countries of the world and their ISTA was 0.8401, which proved the existence of a significant relationship between these indicators. Thus, this result may indicate that countries with a high level of GDP per capita ensure more intensive development of STA, and vice versa a higher level of STA makes it possible to increase the level of GDP per capita.
The obtained results were confirmed by the correlation regression model and graphically (Figure 6).
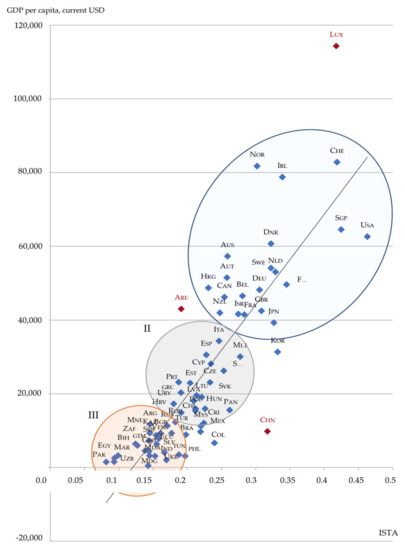
Figure 6.
Correlation regression model of dependence of the GDP per capita of countries of the world on their ISTA. Source: built by the authors.
Figure 6 shows the regression graph and equation, the distribution of countries, and—for visual analysis of the correctness of including countries in the previously defined clusters—the spheres that embrace the groups of countries in accordance with the clusters obtained. The model data of the linear regression model coincided with the actual data with the approximation accuracy R2 − 0.7058, which indicated a high level of correlation between the indicators. The numerical data for calculations are given in Appendix A.
Consequently, the analysis confirmed, with a high degree of accuracy, the groups of countries obtained as a result of the preliminary cluster analysis—(i) the leading countries in terms of the level of STA; (ii) potential leaders in terms of STA; (III) catching-up countries in terms of STA. It should be noted that, as can be seen from Figure 6, not all countries were distributed in accordance with the previously defined clusters.
For example, the United Arab Emirates (ARE), which had a higher GDP per capita compared to other countries, was included, according to the preliminary analysis, in the cluster of catching-up countries in terms of STA. China (CHN), which had a lower level of GDP per capita compared to other countries in this cluster, on the contrary, was assigned to the cluster of leading countries in terms of STA. Luxembourg (LUX) was also placed separately from other countries.
In general, the analysis results made it possible to determine that there was a significant dependence of the level of economic development of countries of the world, measured using the indicator of GDP per capita, on the level of countries’ STA. Therefore, to ensure economic growth at the present stage of development of society, a mandatory requirement is a country’s ability to generate new knowledge and create and implement innovations. The results also confirm the statement that highly developed countries of the world can ensure further STA development.
According to the third stage of the proposed approach (Figure 3), the correlations between the ISTA, GII, and HDI were evaluated. For the analysis, we used the data on the GII and HDI for 2019, in order to compare them with the determined ISTA, for the calculation of which, we used the latest available data for 2018. The number of studied countries in the world was reduced to 61. This was due to the fact that not all countries considered in the calculation of the ISTA were also considered in the calculation of the GII and the HDI, first of all, because of the absence of information on some countries, including Venezuela, Uzbekistan, Salvador, Ecuador, Madagascar, Guatemala, South Africa, Morocco, and others.
The analysis of the correlations between these indices showed a significant relationship between the ISTA and the GII (the Pearson correlation coefficient was 0.84) and between the GII and the HDI (0.83). The values of the correlation coefficients are given in Table 5.
Table 5.
Correlations between the ISTA, GII, and HDI.
Therefore, the conducted analysis allowed us to prove the existence of an indirect influence of STA on the level of economic development of countries. Moreover, if the Pearson correlation coefficient for the ISTA and HDI showed a significant relationship between these two indices (0.69), the correlation between the ISTA and GII as well as between the GII and HDI was quite high (0.84 and 0.83, respectively). Such results indicate that, in order to achieve an increase in the standard of living in a country, it is imperative to ensure the implementation of the results of STA in the country’s economy through innovation activities.
According to the fourth stage of the theoretical and methodological approach (Figure 3), a cluster analysis was carried out in the context of countries of the world, based on the data on the ISTA, GII, and HDI with the use of a Statistica 8.0 software application package.
In order to determine the number of clusters and the proximity of countries in terms of the ISTA, GII, and HDI, a hierarchical classification was carried out based on the merge rule of the full link method. The vertical dendrogram of the hierarchical classification is shown in Figure 7.
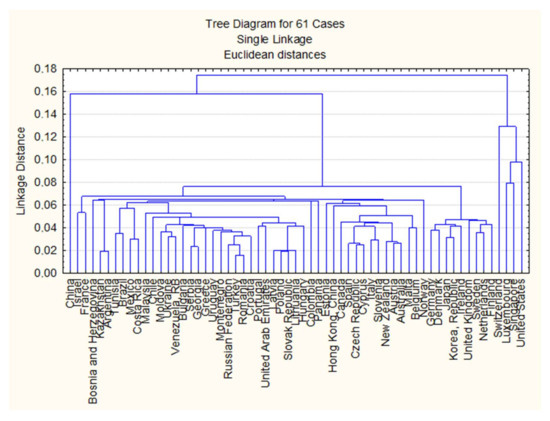
Figure 7.
Vertical dendrogram of the hierarchical classification of countries of the world according to the ISTA, GII, HDI. Source: built by the authors.
Based on the visual presentation of the results, we assumed that three natural clusters could be formed regarding the level of proximity of countries in terms of STA, innovation activities, and quality of life of the population. This assumption was tested by breaking down the initial data with the help of the k-means method into three clusters and assessing the significance of differences between the groups obtained. Checking the means for each cluster and for each measure, to assess how much they differ from each other, is shown in Figure 8.
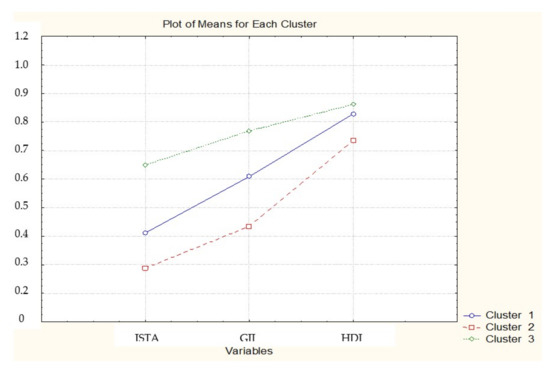
Figure 8.
Plot of the means for the clusters formed based on the ISTA, GII, and HDI of world countries. Source: developed by the authors.
Thus, countries of the world were divided into three groups. The elements of clusters and the Euclidean distances of the objects from the centres (mean values) of the corresponding clusters are given in Table 6.
Table 6.
Elements of clusters and the Euclidean distances of the objects from the centres (mean values) of the corresponding clusters.
As can be seen, the breaking down of countries of the world into three clusters, describing the level of STA, innovation and human development, confirmed the existence of inequality between them concerning the level of generation and commercialisation of new knowledge and quality of life of the population.
Thus, Cluster 1 was formed by countries with an average level of potential and results of STA, ensuring a gradual revival of innovation activities in the country. The quality of life of the population of these countries was lower compared with the countries that were assigned to Cluster 3 but was still quite high. This cluster was made up of 21 countries of the world, including France, Belgium, Malta, Australia, Austria, Canada, Spain, and others.
The countries assigned to Cluster 2 were characterised by a low level of potential and results of STA, innovation activities, and human development. This cluster was formed by 24 countries of the world, including Ukraine. The results obtained once again prove that the reduced attention to the development of STA leads to the impossibility of building a country’s economy according to an innovation model and, thereby, improving the quality of life of the population.
The countries included in Cluster 3 were characterised by a high level of potential and results of STA and high innovation activities, due to favourable conditions for the introduction of new products and technologies in these countries. This allowed the countries in this group to provide a high standard of living for their population. In total, Cluster 3 comprised 13 countries of the world, in particular, the United States of America, Singapore, Switzerland, Luxembourg, Finland, Ireland, the Republic of Korea, and others.
Accordingly, the conducted study confirms that today the development of STA in a country has a significant impact on its economic growth and standard of living. Moreover, considering the development of STA, it is necessary to pay attention to both their potential and results, since problems in one of the components can destroy positive achievements in the other one (as in the case of Ukraine). Under modern conditions, of particular importance is the introduction of STA results in innovation activities of a country. On the other hand, in the course of the study, we identified a group of countries that, having an average level of potential and results of their own STA and a high level of investment activity, could provide a fairly high level and quality of life for the population, using technologies and results of STA obtained by other countries. For example, France had a relatively low degree of participation in research programs funded by the European Union, but the country was actively involved in organizing and financing innovation processes (the so-called competitiveness poles) that contributed to innovative development, which allowed small-scale enterprises, universities, researchers, and developers to work together (this approach ensured a fairly high standard of living in the country). Thus, the proposed approach to a comprehensive assessment of STA of world countries made it possible to identify the problems existing in this area and, consequently, determine the directions for their solution and effective measures of a country’s scientific and technological policies.
At the same time, at present, the importance of the development of environment-related technologies and innovations in ensuring the economic growth of countries of the world, aimed at achieving the goals of sustainable development, is steadily increasing. In this regard, it is advisable to analyse the impact of such technologies and innovations on countries’ economic growth.
According to the OECD data [97], the key indicators that characterise environment-related technologies and innovations include the following: development of environment-related technologies, % all technologies; relative advantage in environment-related technologies; development of environment-related technologies, % inventions worldwide; development of environment-related technologies, inventions per capita. For all studied countries of the world, we calculated the composite indicator, as the arithmetic mean of the normalised indicators, using the Formula (1) (Appendix B). The results of calculating the coefficients of correlation between this indicator and the ISTA, GII, HDI, and GDP per capita for all studied countries are shown in Table 7.
Table 7.
Coefficients of correlation between the composite indicator of development of environment-related technologies and innovations and the ISTA, GII, HDI, and GDP per capita of the studied countries.
Based on the calculation results presented in Table 7, it can be concluded that there was a moderate relationship between the composite indicator of the development of environment-related technologies and innovations and the indicators ISTA, GII, HDI, and GDP per capita. Thus, the development of environment-related technologies and innovations moderately varied depending on the overall level of STA development (with a correlation coefficient of 0.450861); moderately influenced the acceleration of innovation development (with a correlation coefficient of 0.447292), improvement of the quality of life of the population (with a correlation coefficient of 0.352814), and growth of GDP per capita (with the correlation coefficient of 0.303898).
We found the confirmation of these results in a number of studies. Thus, Fernandes et al. [98] experimentally proved the existence of a positive impact of the introduction of green growth technologies on the economic development of OECD countries. In a number of studies dealing with developing countries (Walz et al. [97], Mealy et al. [99], Fang et al. [100]), it was determined that they were also increasing their role in the global export of green technologies and innovations, and this was due to the understanding of the benefits of green technologies and innovations for the economy and environment. These trends were explained by the fact that developing countries could catch up with economically developed countries through the implementation of green growth strategies and green industrial policies [101,102] as well as through an increased inflow of investments in environment-related technologies, which, in turn, would lead to environmental and technological benefits [103]. At the same time, Söderholm [104] noted that in addition to research and development of green technologies and innovations, in order to achieve sustainable technological changes, it was necessary to ensure the political, economic, and social adaptation of the country. Thus, achieving economic growth and sustainable development of countries of the world involves solving a number of organisational and institutional problems associated with relevant technological changes and innovations in the economy (e.g., high risks, lack of incentives and government support, the significant payback period of investments in green technologies and innovations, unfair competition with existing technologies that reduces business confidence in such technological changes), which make it impossible to quickly implement green technologies and innovations and obtain positive results.
4. Discussion
In general, the research confirmed a number of conclusions made by scientists in previous studies: Roztocki et al. (2019), on the decisive influence of STA on the innovative development of countries of the world [29]; Falk (2007), on the influence of STA on the level of GDP of countries of the world [35]; Gulmez et al. (2012), on the positive impact of STA on the socioeconomic situation in OECD member countries [31]. Our investigation has led to the same conclusions, and also showed that OECD countries mainly belonged to the group of countries with significant potential and results of STA as well as with a high level of socioeconomic development. Furthermore, we found that this influence was also characteristic of developing countries, which contradicted the conclusions obtained in the research by Samimi et al. (2009) [60]. We also determined that countries with a low level of potential and results of STA had a lower socioeconomic position compared with developed countries of the world, in particular, as concerns the level of innovative development and quality of life of the population. Moreover, the results of our study partly contradicted the conclusions made by Hu et al. (2007) about the lack of evidence of the impact of increased spending on STA on the economic growth of all countries of the world—our study of 72 countries confirmed the existence of such a relationship [70].
Therefore, the obtained results have allowed us to conclude that the current stage of development of STA creates new opportunities for countries of the world to ensure their sustainable economic growth. Moreover, the creation and improvement of the principles of STA development in a country open up great capabilities for it to enhance its competitiveness and national security. These findings correlate with studies of a number of scientists (Gumus et al. (2015) [40]; Das et al. (2019) [41]; Dinçer et al. (2019) [42]; Skvarciany et al. (2020) [43]; Hece et al. (2020) [46] and others).
At the same time, some of the results obtained in our study are debatable. For example, Panama, Colombia, and some other countries, based on the results of calculating the sub-index of RSTA, were given a high rating and fell into the group of countries with high results of STA. However, the further grouping of countries of the world in terms of the ISTA, GII, and HDI showed that these countries were included in the group of countries characterised by a low level of STA, innovation activities, and standard of living. This, in our opinion, indicates that in some cases, when a country has a small number of researchers, using relative indicators, the results of assessing STA do not reflect the real situation, which should be considered when interpreting the results of STA assessment based on comparable indicators.
5. Conclusions
Today, the development of STA is the most important factor affecting the sustainable economic growth of a country and the social well-being of its population. Scientific and technological achievements are the basis for meeting the social, economic, cultural, and other needs of mankind. A key role in this domain is played by effective innovation activities of countries, which is determined by the use and commercialisation of STA results for launching new competitive goods and services and, thereby, ensuring their sustainable economic growth. The identification of trends and problems in the development of STA in countries of the world requires comprehensive monitoring of the state of STA and analysis of their impact on countries’ economies. For this purpose, in our study, a composite index was constructed using two sub-indices: PSTA and RSTA, which made it possible to carry out a comparative analysis of countries of the world and their ranking based on these metrics. The advantage of this index is that: only hard (objective and quantitative) data from a single source—the World Bank database—were used in the calculation, which made it possible to avoid contradictions associated with different methods of collecting and aggregating information from different databases; relative indicators were chosen with regard to the size of countries; different groups of countries (a total of 72), both developed and developing ones, were covered. The performed calculations and ranking of countries of the world showed that the leaders in terms of the level of STA development were the United States, Singapore, and Switzerland. These countries demonstrated the highest positions both in terms of the development of their STA potential and the results obtained. According to the ranking, Egypt, Uzbekistan, and Pakistan were outsiders as concerns STA development—they had a low level of potential development and, in comparison with other countries of the world, the lowest ratings in terms of STA results. However, the analysis revealed that high indicators of STA potential development did not always ensure a high level of STA results for the country. Thus, as the calculation showed, the coefficient of correlation between the PSTA and RSTA was equal to 0.26, i.e., the correlation between these sub-indices was weak.
For a more thorough study of the correlation between the PSTA and RSTA of countries of the world, cluster analysis was used to group countries of the world in terms of their STA level, with consideration for the data of both sub-indices. This made it possible to identify three clusters of countries: leaders, potential leaders, and catching-up countries.
The cluster of countries–leaders in terms of the level of STA (characterised by a high level of potential and results) was formed by: the USA, Singapore, Switzerland, Luxembourg, Finland, Japan, Sweden, and others. These were countries that paid great attention to developing the processes of new knowledge generation and implementation and highly developed countries that occupied an important place in the global research space.
The cluster of countries–potential leaders in terms of STA was made up of Denmark, Norway, France, Belgium, Austria, Canada, and others. These countries paid attention to the development of STA, and, although they needed to enhance them, provided significant scientific and technical results through both their own inventions and the use of borrowed technologies. This was the largest group of countries in the world, which, by paying more attention to promoting STA development, could become leaders.
The third cluster was formed by catching-up countries in terms of STA, including Estonia, the United Arab Emirates, Croatia, Greece, Venezuela, Ecuador, and others. These countries demonstrated insignificant results of STA due to a number of problems (low level of educational and scientific training, lack of talented personnel, insufficient government support of STA, limited funding, underdevelopment of the national innovation system, lack of interest and unwillingness of business to commercialise new scientific achievements). However, a high level of STA results at a relatively low level of STA potential development requires further study.
The study showed that countries with a high and average potential of STA not always had high STA results. For example, Ukraine, which, according to the classification, was included in the third cluster (catching up countries, ranking 59th among 72 countries studied), based on the calculations, ranked 47th in terms of STA potential, and 64th in terms of their results. Thus, according to the PSTA sub-index, Ukraine was among the countries with a sufficient STA potential, whereas according to the RSTA, it was included in the group of countries with low STA results, which led to it taking a lower place in the ranking and falling into the third cluster. This allowed us to conclude that the existing scientific potential of the country was underutilised, and there was a need to create appropriate conditions and mechanisms for the commercialisation of scientific knowledge and technological innovations and identify and solve problems in the functioning of the national innovation system. The effectiveness of such commercialisation depends on many factors: government innovation policies, aimed at developing the export of science-intensive products and services; appropriate institutional conditions and legislative support; economic opportunities; systems of incentives and support for close collaboration between science, education, and business; demand for innovations and availability of scientific potential to create competitive knowledge and practically valuable innovations. The commercialisation of STA results in such countries should become a matter of national concern since it is directly related to the national security of the country and the practical implementation of the model of innovative economic development.
Thus, the results obtained in the study made it possible to determine that, for a country to achieve leadership in terms of STA, it is important to harmoniously combine efforts to support and develop its scientific potential as well as to create principles for the implementation of scientific achievements in innovation activities to ensure its economic growth and improve the living standards of its population.
The importance of STA in ensuring the economic growth of countries of the world was also confirmed by a significant relationship between the ISTA and GDP per capita (R − 0.84). However, this result requires further research on the fact that countries with high GDP per capita have more opportunities to ensure the development of STA in their countries, whereas countries with low GDP per capita do not have sufficient resources to ensure the development of STA.
The analysis of the relationship between the STA and the standard of living of countries of the world also made it possible to determine the presence of a significant correlation (R − 0.69). Furthermore, it was found that STA exerted a significant impact on a country’s innovation activities (R − 0.84), which in turn had a significant influence on the level and quality of life of the population (R − 0.83). This meant that the existence of an indirect influence of STA through innovation activities on the level and quality of life of the population was also confirmed. Moreover, this proved that only bringing scientific achievements to implementation through innovation activities could improve the standard of living in a country.
A significant impact of STA on the socioeconomic development of countries of the world was also proved by their grouping with the help of cluster analysis, based on the Index of STA, the Global Innovation Index, and the Human Development Index. This made it possible to identify clusters of countries with high, medium, and low levels of STA and socioeconomic development.
The cluster with high levels of STA, innovative development, and standard of living was formed by the USA, Singapore, Switzerland, Luxembourg, Finland, Ireland, and others. It should be noted that these were almost the same countries that formed the cluster with a high level of potential and results of STA. The cluster with low levels of the ISTA, GII, and HDI was made up of Greece, Romania, Turkey, Bulgaria, Ukraine, Brazil, Serbia, Croatia, Montenegro, Georgia, and others.
Given the importance of the development of environment-related technologies and innovations in ensuring the economic growth of countries of the world, aimed at achieving the goals of sustainable development, it was the impact of these technologies and innovations on countries’ economic growth that was analysed in the study. This allowed proving the existence of a moderately positive impact of the development of environment-related technologies and innovations on the acceleration of innovative development, improvement of the quality of life of the population, and growth of GDP per capita.
It should be noted that the sustainable development of society, with consideration for modern global challenges and transformations, is possible only upon the condition of reducing inequalities among countries across the world (including the issues of enhancing scientific and innovation activities, creating conditions for green growth). Inequality is a multifaceted phenomenon that manifests itself in many areas of society. The UNESCO report (2016) states that problems of inequality are perceived as a challenge to modern society since their aggravation leads to the deepening of economic and political instability and the spread of the processes of uncontrolled international migration of the population [105]. The prevention of the exacerbation of inequalities is based on the identification of factors that determine these processes. This was also proved in the research by Leogrande, Massaro, and Galiano (2020) who showed that the problems of inequality in countries of the world became especially acute with technological progress [34].
The ability to generate scientific and technological knowledge, to turn it into new products or processes, has been a key tool for modern economic growth and development, as well as an additional source of deepening inequality. Moreover, under the current conditions, characterised by the spread of globalisation, the impact of the COVID-19 pandemic, as well as destructive processes of the military confrontation, this cannot but affect the socioeconomic development of countries across the world and the standard of living of their populations (of course, to varying degrees and in different areas).
Thus, the main directions of our further research are related to two main sets of problems:
- Problems associated with the analysis of the uneven development of STA in countries of the world and the role of STA in ensuring the economic growth of countries (analysis of the features and problems of development of STA potential in individual countries and its effective use to achieve appropriate results; analysis of the priorities for the development of STA, technologies, and innovations under the influence of modern challenges and factors (such as pandemics, military conflicts, environmental and other problems of mankind); research of models and justification of the principles of post-war economic growth recovery (primarily for Ukraine) on the basis of scientific and technological development).
- Problems associated with green growth for ensuring the principles of sustainable development of countries (investigation of the impact of green technologies and innovations on the processes of sustainable economic growth in different countries of the world; determination of differences in the impact of green technologies and innovations on sustainable economic development by groups of countries (developed and catching up one); examination of the conditions of green growth in different countries of the world as well as organisational and institutional problems associated with the introduction of technological changes and innovations in their economies).
Author Contributions
Conceptualisation, I.G., X.M. and V.K.; methodology, V.K. and O.R.; validation, O.R., M.K. and D.B.; formal analysis, O.R. and M.K.; project administration, I.G. and V.K.; investigation, V.K., O.R. and M.K.; data curation, M.S. and O.R.; writing—original draft preparation, V.K. and O.R.; writing—review and editing, I.G. and V.K.; visualisation, O.R., M.S. and D.B.; supervision, I.G., X.M. and V.K. All authors have read and agreed to the published version of the manuscript.
Funding
Supported by General Project of Philosophy and Social Science Planning of Zhejiang Province (20NDQN287YB); supported by the Fundamental Research Funds for the Provincial Universities of Zhejiang (GK209907299001-224); supported by Hangzhou Dianzi University ITMO Joint Institute (SGJ2021JG011).
Institutional Review Board Statement
Not applicable.
Informed Consent Statement
Not applicable.
Data Availability Statement
Publicly available datasets were analysed in this study.
Conflicts of Interest
The authors declare no conflict of interest.
Appendix A
Table A1.
GDP per capita and ISTA of countries of the world.
Table A1.
GDP per capita and ISTA of countries of the world.
| Country | Country Code | ISTA | GDP per Capita, USD per Person |
|---|---|---|---|
| Argentina | ARG | 0.146 | 11,652.57 |
| Australia | AUS | 0.259 | 57,305.30 |
| Austria | AUT | 0.258 | 51,512.91 |
| Belgium | BEL | 0.281 | 46,556.10 |
| Bosnia and Herzegovina | BIH | 0.127 | 5951.32 |
| Brazil | BRA | 0.198 | 8920.76 |
| Bulgaria | BGR | 0.161 | 9272.63 |
| Canada | CAN | 0.254 | 46,210.55 |
| Chile | CHL | 0.212 | 15,923.36 |
| China | CHN | 0.317 | 9770.85 |
| Colombia | COL | 0.240 | 6651.29 |
| Costa Rica | CRI | 0.224 | 12,026.55 |
| Croatia | HRV | 0.191 | 14,869.09 |
| Cyprus | CYP | 0.234 | 28,159.30 |
| Czech Republic | CZE | 0.233 | 23,078.57 |
| Denmark | DNK | 0.322 | 60,726.47 |
| Ecuador | ECU | 0.155 | 6344.87 |
| Egypt, Arab Republic | EGY | 0.094 | 2549.14 |
| Estonia | EST | 0.204 | 22,927.74 |
| Finland | FIN | 0.345 | 49,648.15 |
| France | FRA | 0.283 | 41,463.64 |
| Georgia | GEO | 0.144 | 4344.63 |
| Germany | DEU | 0.305 | 48,195.58 |
| Greece | GRC | 0.191 | 20,324.25 |
| Guatemala | GTM | 0.138 | 4549.01 |
| Hong Kong, China | HKG | 0.231 | 48,717.29 |
| Hungary | HUN | 0.226 | 15,938.84 |
| India | IND | 0.170 | 2015.59 |
| Ireland | IRL | 0.339 | 78,806.43 |
| Israel | ISR | 0.275 | 41,614.00 |
| Italy | ITA | 0.246 | 34,318.35 |
| Japan | JPN | 0.327 | 39,286.74 |
| Kazakhstan | KAZ | 0.145 | 9331.05 |
| Korea, Republic | KOR | 0.332 | 31,362.75 |
| Latvia | LVA | 0.210 | 18,088.93 |
| Lithuania | LTU | 0.221 | 19,089.71 |
| Luxembourg | LUX | 0.418 | 114,340.50 |
| Madagascar | MDG | 0.143 | 460.75 |
| Malaysia | MYS | 0.220 | 11,238.96 |
| Malta | MLT | 0.277 | 30,074.74 |
| Mexico | MEX | 0.219 | 9698.08 |
| Moldova | MDA | 0.145 | 3189.36 |
| Montenegro | MNE | 0.154 | 8760.69 |
| Morocco | MAR | 0.099 | 3237.88 |
| Netherlands | NLD | 0.329 | 53,024.06 |
| New Zealand | NZL | 0.248 | 41,966.01 |
| Norway | NOR | 0.302 | 81,807.20 |
| Pakistan | PAK | 0.081 | 1472.89 |
| Panama | PAN | 0.262 | 15,575.07 |
| Philippines | PHL | 0.197 | 3102.71 |
| Poland | POL | 0.212 | 15,424.05 |
| Portugal | PRT | 0.187 | 23,145.73 |
| Romania | ROU | 0.183 | 12,301.19 |
| Russian Federation | RUS | 0.171 | 11,288.87 |
| Salvador | SLV | 0.166 | 4058.24 |
| Serbia | SRB | 0.144 | 7234.00 |
| Singapore | SGP | 0.425 | 64,581.94 |
| Slovak Republic | SVK | 0.214 | 19,546.90 |
| Slovenia | SVN | 0.253 | 26,234.02 |
| South Africa | ZAF | 0.124 | 6374.02 |
| Spain | ESP | 0.228 | 30,523.86 |
| Sweden | SWE | 0.322 | 54,111.97 |
| Switzerland | CHE | 0.419 | 82,838.93 |
| Tunisia | TUN | 0.188 | 3446.61 |
| Turkey | TUR | 0.177 | 9311.37 |
| Ukraine | UKR | 0.153 | 3095.17 |
| United Arab Emirates | ARE | 0.191 | 43,004.95 |
| United Kingdom | GBR | 0.308 | 42,491.36 |
| United States | USA | 0.463 | 62,641.01 |
| Uruguay | URY | 0.180 | 17,277.97 |
| Uzbekistan | UZB | 0.093 | 1532.37 |
| Venezuela, RB | VEN | 0.158 | 7852.00 |
Source: developed by the authors.
Appendix B
Table A2.
Results of calculating the composite indicator of development of environment-related technologies and innovations by countries of the world.
Table A2.
Results of calculating the composite indicator of development of environment-related technologies and innovations by countries of the world.
| Country | Green Growth Indicators. Technology and Innovation: Patents (2018 p.) | Normalised Indicators | Composite Indicator of Development of Environment-Related Technologies and Innovations | ||||||
|---|---|---|---|---|---|---|---|---|---|
| Development of Environment-Related Technologies. % All Technologies | Relative Advantage in Environment-Related Technologies | Development of Environment-Related Technologies. % Inventions Worldwide | Development of Environment-Related Technologies. Inventions per Capita | Development of Environment-Related Technologies. % All Technologies | Relative Advantage in Environment-Related Technologies | Development of Environment-Related Technologies. % Inventions Worldwide | Development of Environment-Related Technologies. Inventions per Capita | ||
| Australia | 9.17 | 0.31 | 0.56 | 9.43 | 0.3590446 | 0.244094 | 0.026341 | 0.105023 | 0.183626 |
| Argentina | 8.62 | 0.3 | 0.02 | 0.24 | 0.3375098 | 0.23622 | 0.000941 | 0.002673 | 0.144336 |
| Austria | 13.95 | 0.48 | 0.86 | 40.85 | 0.546202 | 0.377953 | 0.040452 | 0.45495 | 0.354889 |
| Belgium | 11.67 | 0.4 | 0.58 | 21.31 | 0.4569303 | 0.314961 | 0.027281 | 0.237332 | 0.259126 |
| Bosnia and Herzegovina | 25.54 | 0.88 | 0 | 0.6 | 1 | 0.692913 | 0 | 0.006682 | 0.424899 |
| Brazil | 11.84 | 0.41 | 0.23 | 0.46 | 0.4635865 | 0.322835 | 0.010818 | 0.005123 | 0.200591 |
| Bulgaria | 13.26 | 0.45 | 0.02 | 1.47 | 0.5191856 | 0.354331 | 0.000941 | 0.016372 | 0.222707 |
| Canada | 10.95 | 0.38 | 1.66 | 18.88 | 0.4287392 | 0.299213 | 0.078081 | 0.210268 | 0.254075 |
| Chile | 18.86 | 0.65 | 0.07 | 1.68 | 0.7384495 | 0.511811 | 0.003293 | 0.01871 | 0.318066 |
| China | 8.96 | 0.31 | 12.86 | 3.8 | 0.3508222 | 0.244094 | 0.604892 | 0.042321 | 0.310532 |
| Colombia | 12.65 | 0.43 | 0.04 | 0.36 | 0.4953015 | 0.338583 | 0.001881 | 0.004009 | 0.209944 |
| Costa Rica | 8.41 | 0.29 | 0 | 0.4 | 0.3292874 | 0.228346 | 0 | 0.004455 | 0.140522 |
| Croatia | 7.32 | 0.25 | 0.01 | 0.89 | 0.2866092 | 0.19685 | 0.00047 | 0.009912 | 0.123461 |
| Cyprus | 1.5 | 0.05 | 0 | 0.29 | 0.0587314 | 0.03937 | 0 | 0.00323 | 0.025333 |
| Czech Republic | 13 | 0.45 | 0.14 | 5.57 | 0.5090055 | 0.354331 | 0.006585 | 0.062034 | 0.232989 |
| Denmark | 24.28 | 0.83 | 1.02 | 74.68 | 0.9506656 | 0.653543 | 0.047977 | 0.831718 | 0.620976 |
| Estonia | 12.21 | 0.42 | 0.02 | 4.79 | 0.4780736 | 0.330709 | 0.000941 | 0.053347 | 0.215767 |
| Finland | 13.06 | 0.45 | 0.51 | 38.87 | 0.5113547 | 0.354331 | 0.023989 | 0.432899 | 0.330643 |
| France | 13.31 | 0.46 | 3.75 | 23.57 | 0.5211433 | 0.362205 | 0.176388 | 0.262501 | 0.330559 |
| Georgia | 13.11 | 0.47 | 0 | 0.21 | 0.5133125 | 0.370079 | 0 | 0.002339 | 0.221432 |
| Germany | 14.91 | 0.51 | 11.04 | 56.18 | 0.5837901 | 0.401575 | 0.519285 | 0.625682 | 0.532583 |
| Greece | 9.93 | 0.34 | 0.06 | 2.17 | 0.3888019 | 0.267717 | 0.002822 | 0.024168 | 0.170877 |
| Hungary | 8.43 | 0.29 | 0.07 | 2.95 | 0.3300705 | 0.228346 | 0.003293 | 0.032854 | 0.148641 |
| Ireland | 7.18 | 0.25 | 0.11 | 9.96 | 0.2811276 | 0.19685 | 0.005174 | 0.110925 | 0.148519 |
| Israel | 6.39 | 0.22 | 0.5 | 23.63 | 0.2501958 | 0.173228 | 0.023518 | 0.26317 | 0.177528 |
| Italy | 9.75 | 0.33 | 1.38 | 9.75 | 0.3817541 | 0.259843 | 0.064911 | 0.108587 | 0.203773 |
| Japan | 11.37 | 0.39 | 21.26 | 70.95 | 0.445184 | 0.307087 | 1 | 0.790177 | 0.635612 |
| Kazakhstan | 6.73 | 0.23 | 0.01 | 0.15 | 0.2635082 | 0.181102 | 0.00047 | 0.001671 | 0.111688 |
| Korea. Republic | 13.57 | 0.47 | 10.98 | 89.79 | 0.5313234 | 0.370079 | 0.516463 | 1 | 0.604466 |
| Latvia | 3.31 | 0.11 | 0 | 0.52 | 0.1296006 | 0.086614 | 0 | 0.005791 | 0.055502 |
| Lithuania | 12.91 | 0.44 | 0.01 | 2.14 | 0.5054816 | 0.346457 | 0.00047 | 0.023833 | 0.219061 |
| Luxembourg | 12.49 | 0.43 | 0.03 | 24.18 | 0.4890368 | 0.338583 | 0.001411 | 0.269295 | 0.274581 |
| Malaysia | 5.87 | 0.2 | 0.06 | 0.79 | 0.2298356 | 0.15748 | 0.002822 | 0.008798 | 0.099734 |
| Malta | 12 | 0.41 | 0.01 | 4.81 | 0.4698512 | 0.322835 | 0.00047 | 0.053569 | 0.211681 |
| Mexico | 12.92 | 0.44 | 0.11 | 0.38 | 0.5058731 | 0.346457 | 0.005174 | 0.004232 | 0.215434 |
| Moldova | 2.75 | 0.09 | 0 | 0.08 | 0.1076742 | 0.070866 | 0 | 0.000891 | 0.044858 |
| Montenegro | 9.38 | 0.34 | 0 | 0.8 | 0.367267 | 0.267717 | 0 | 0.00891 | 0.160973 |
| Netherlands | 10.77 | 0.37 | 1.08 | 26.34 | 0.4216915 | 0.291339 | 0.0508 | 0.293351 | 0.264295 |
| New Zealand | 6.45 | 0.22 | 0.05 | 4.51 | 0.252545 | 0.173228 | 0.002352 | 0.050228 | 0.119588 |
| Norway | 12.97 | 0.44 | 0.28 | 22.61 | 0.5078309 | 0.346457 | 0.01317 | 0.25181 | 0.279817 |
| Panama | 7.27 | 0.25 | 0.02 | 2.27 | 0.2846515 | 0.19685 | 0.000941 | 0.025281 | 0.126931 |
| Poland | 14.06 | 1.27 | 0.25 | 2.72 | 0.550509 | 1 | 0.011759 | 0.030293 | 0.39814 |
| Portugal | 8.73 | 0.3 | 0.07 | 2.91 | 0.3418168 | 0.23622 | 0.003293 | 0.032409 | 0.153435 |
| Romania | 10.06 | 0.34 | 0.04 | 0.96 | 0.3938919 | 0.267717 | 0.001881 | 0.010692 | 0.168545 |
| Russian Federation | 9.18 | 0.31 | 0.31 | 0.9 | 0.3594362 | 0.244094 | 0.014581 | 0.010023 | 0.157034 |
| Serbia | 16.3 | 0.56 | 0.02 | 1.02 | 0.6382146 | 0.440945 | 0.000941 | 0.01136 | 0.272865 |
| Singapore | 8.01 | 0.27 | 0.24 | 25.12 | 0.3136257 | 0.212598 | 0.011289 | 0.279764 | 0.204319 |
| Slovak Republic | 13.6 | 0.47 | 0.04 | 3.23 | 0.532498 | 0.370079 | 0.001881 | 0.035973 | 0.235108 |
| Slovenia | 8.91 | 0.31 | 0.03 | 6.6 | 0.3488645 | 0.244094 | 0.001411 | 0.073505 | 0.166969 |
| Spain | 11.65 | 0.4 | 0.62 | 5.58 | 0.4561472 | 0.314961 | 0.029163 | 0.062145 | 0.215604 |
| Sweden | 12.5 | 0.43 | 0.96 | 39.73 | 0.4894283 | 0.338583 | 0.045155 | 0.442477 | 0.328911 |
| Switzerland | 7.67 | 0.26 | 0.69 | 34.4 | 0.3003132 | 0.204724 | 0.032455 | 0.383116 | 0.230152 |
| Tunisia | 20.34 | 0.7 | 0.01 | 0.35 | 0.7963978 | 0.551181 | 0.00047 | 0.003898 | 0.337987 |
| Turkey | 7.14 | 0.24 | 0.26 | 1.35 | 0.2795615 | 0.188976 | 0.01223 | 0.015035 | 0.123951 |
| Ukraine | 13.77 | 0.59 | 0.08 | 0.69 | 0.5391543 | 0.464567 | 0.003763 | 0.007685 | 0.253792 |
| United Arab Emirates | 9.36 | 0.32 | 0.02 | 0.96 | 0.3664839 | 0.251969 | 0.000941 | 0.010692 | 0.157521 |
| United Kingdom | 11.72 | 0.4 | 2.69 | 17.06 | 0.458888 | 0.314961 | 0.126529 | 0.189999 | 0.272594 |
| United States | 10.14 | 0.35 | 20.4 | 26.34 | 0.3970243 | 0.275591 | 0.959548 | 0.293351 | 0.481379 |
| Uruguay | 3.37 | 0.12 | 0 | 0.14 | 0.1319499 | 0.094488 | 0 | 0.001559 | 0.056999 |
| Venezuela. RB | 4.62 | 0.17 | 0 | 0.02 | 0.1808927 | 0.133858 | 0 | 0.000223 | 0.078743 |
Source: calculated by the authors.
References
- Transforming Our World: The 2030 Agenda for Sustainable Development, United Nations 2015, A/RES/70/1. Available online: https://sustainabledevelopment.un.org/post2015/transformingourworld (accessed on 7 June 2022).
- Schneider, F.; Kläy, A.; Zimmermann, A.B.; Buser, T.; Ingalls, M.; Messerli, P. How can science support the 2030 Agenda for Sustainable Development? Four tasks to tackle the normative dimension of sustainability. Sustain. Sci. 2019, 14, 1593–1604. [Google Scholar] [CrossRef]
- Sustainable Development Goal 9. Build Resilient Infrastructure, Promote Sustainable Industrialization and Foster Innovation/Sustainable Development Goals. SDG Tracker. Available online: https://sdg-tracker.org/infrastructure-industrialization (accessed on 29 September 2022).
- OECD. What Is Green Growth and How Can It Help Deliver Sustainable Development? Green Growth and Sustainable Development. Available online: https://www.oecd.org/greengrowth/whatisgreengrowthandhowcanithelpdeliversustainabledevelopment.ht (accessed on 25 September 2022).
- Solow, R.M. A Contribution to the Theory of Economic Growth. Q. J. Econ. 1956, 70, 65–94. [Google Scholar] [CrossRef]
- Griliches, Z. Issues in Assessing the Contribution of R&D to Productivity Growth. Bell J. Econ. 1979, 10, 92–116. [Google Scholar]
- Romer, P.M. Endogenous Technological Change. J. Political Econ. 1990, 98, 71–102. [Google Scholar] [CrossRef]
- Lucas, R., Jr. On the Mechanics of Economic Development. J. Monet. Econ. 1988, 22, 3–42. [Google Scholar] [CrossRef]
- Grossman, G.; Elhanan, H. Endogenous Innovation in the Theory of Growth. J. Econ. Perspect. 1994, 8, 23–44. [Google Scholar] [CrossRef]
- Mansfield, E. R&D’s Contribution to the Economic Growth of the Nation. Res. Manag. 1972, 15, 31–46. Available online: http://www.jstor.org/stable/24116258 (accessed on 30 June 2022).
- Griliches, Z. R & D and the Productivity Slowdown. Am. Econ. Rev. 1980, 70, 343–348. Available online: http://www.jstor.org/stable/1815495 (accessed on 1 June 2022).
- Griliches, Z. R&D and Productivity Growth at the Industry Level: Is There Still a Relationship? In R&D and Productivity: The Econometric Evidence; NBER Chapters; National Bureau of Economic Research, Inc.: Cambridge, MA, USA, 1998; pp. 213–240. [Google Scholar]
- Bronzini, R.; Piselli, P. Determinants of Long-Run Regional Productivity: The Role of R&D, Human Capital and Public Infrastructure; Temi di Discussione (Economic Working Papers); Economic Research and International Relations Area: Rome, Italy, 2006; 597p. [Google Scholar]
- Griliches, Z. Research expenditures and growth accounting. In Science and Technology in Economic Growth; Macmillan: London, UK, 1973; pp. 59–95. [Google Scholar]
- Bozkurt, C. R&D Expenditures and Economic Growth Relationship in Turkey. Int. J. Econ. Financ. Issues 2015, 5, 188–198. [Google Scholar]
- Nadiri, M.I. Contributions and Determinants of Research and Development Expenditures in the U.S. Manufacturing Industries. In Capital, Efficiency, and Growth; Ballinger: Cambridge, MA, USA, 1980; pp. 361–392. [Google Scholar]
- Guellec, D.; Pottelsberghe, B. R&D And Productivity Growth: Panel Data Analysis Of 16 OECD Countries. OECD Econ. Stud. 2001, 2, 103–126. Available online: https://www.oecd.org/economy/growth/1958639.pdf (accessed on 11 June 2022).
- Badr, M.Z. Challenges facing scientific research in developing countries: Environment and resources. Egypt J. Basic Clin. Pharm. 2018, 8, 1–2. [Google Scholar] [CrossRef] [PubMed]
- Kenton, W. Research and Development (R&D); Investopedia: New York, NY, USA, 2019; Available online: https://www.investopedia.com/terms/r/randd.asp (accessed on 10 June 2022).
- Trivedi, A. China’s Racing to the Top in Income Inequality; Bloomberg: New York, USA, 2018; Available online: https://www.bloomberg.com/opinion/articles/2018-09-23/china-s-racing-to-the-top-in-income-inequality (accessed on 12 June 2022).
- Ma, X.; Gryshova, I.; Koshkalda, I.; Suska, A.; Gryshova, R.; Riasnianska, A.; Tupchii, O. Necessity of Post-War Renewal of University Teachers’ Potential in Terms of Sustainable Development in Ukraine. Sustainability 2022, 14, 12598. [Google Scholar] [CrossRef]
- Reddy, P. Global Innovation in Emerging Economies; Routledge: New York, USA, 2011. [Google Scholar] [CrossRef]
- Frascati Manual 2015: Guidelines for Collecting and Reporting Data on Research and Experimental Development. In The Measurement of Scientific, Technological and Innovation Activities; OECD Publishing: Paris, France, 2015. [CrossRef]
- Gonzalez-Garcia, S.; Manteiga, R.; Moreira, M.T.; Feijoo, G. Assessing the sustainability of Spanish cities considering environmental and socio-economic indicators. J. Clean. Prod. 2018, 178, 599–610. [Google Scholar] [CrossRef]
- Pietrzak, M.B.; Balcerzak, A.P. Assessment of socio-economic sustainability in new European Union members states in the years 2004–2012. In Proceedings of the 10th Professor Aleksander Zelias International Conference on Modelling and Forecasting of Socio-Economic Phenomena, Zakopane, Poland, 10–13 May 2016; pp. 120–129. [Google Scholar]
- Ssebunya, B.R.; Schader, C.; Baumgart, L.; Landert, J.; Altenbuchner, C.; Schmid, E.; Stolze, M. Sustainability Performance of Certified and Non-certified Smallholder Coffee Farms in Uganda. Ecol. Econ. 2019, 156, 35–47. [Google Scholar] [CrossRef]
- Song, Y.; Hou, D.; Zhang, J.; O’Connor, D.; Li, G.; Gu, Q.; Liu, P. Environmental and socio-economic sustainability appraisal of contaminated land remediation strategies: A case study at a mega-site in China. Sci. Total Environ. 2018, 610–611, 391–401. [Google Scholar] [CrossRef]
- Cadil, J.; Mirosnik, K.; Petkovova, L.; Mirvald, M. Public Support of Private R&D–Effects on Economic Sustainability. Sustainability 2018, 10, 4612. [Google Scholar]
- Roztocki, N.; Soja, P.; Weistroffer, R.H. The role of information and communication technologies in socioeconomic development: Towards a multi-dimensional framework. Inf. Technol. Dev. 2019, 25, 171–183. [Google Scholar] [CrossRef]
- Okokpujie, I.P.; Fayomi, O.S.I.; Leramo, R.O. The Role of Research in Economic Development. IOP Conf. Ser. Mater. Sci. Eng. 2018, 413, 012060. [Google Scholar] [CrossRef]
- Gulmez, A.; Yardımcıoglu, F. The relationship between R&D expenditures and economic growth in OECD countries: Panel cointegration and panel causality analyses (1990–2010). Maliye Derg. 2012, 163, 335–353. [Google Scholar]
- Maman, A.M.; Moustapha, Q.Y. Innovation effect through research and development on economic growth in 35 OECD countries. J. Innov. Sustain. 2020, 11, 159–166. [Google Scholar] [CrossRef]
- Pinto, T.; Teixeira, A.A.C. The impact of research output on economic growth by fields of science: A dynamic panel data analysis, 1980–2016. Scientometrics 2020, 123, 945–978. [Google Scholar] [CrossRef]
- Leogrande, A.; Massaro, A.; Angelo, M. The Attractiveness of European Research Systems Galiano. Am. J. Humanit. Soc. Sci. Res. 2020, 4, 72–101. Available online: https://www.researchgate.net/pro-file/Angelo-Leogrande/publication/344547865_The_Attractiveness_of_European_Research_Systems/links/5f7f6c06a6fdccfd7b51cad9/The-Attractiveness-of-European-Research-Systems.pdf (accessed on 20 June 2022).
- Falk, M. R&D spending in the high-tech sector and economic growth. Res. Econ. 2007, 61, 140–147. [Google Scholar]
- Blackburn, K.; Hung, V.T.Y.; Pozzolo, A.F. Research, Development and Human Capital Accumulation. J. Monet. Econ. 2000, 22, 189–206. [Google Scholar] [CrossRef]
- Schofer, E.; Ramirez, F.; Meyer, J. The Effects of Science on National Economic Development, 1970 to 1990. Am. Sociol. Rev. 2000, 65, 866–887. [Google Scholar] [CrossRef]
- Kwack, S.U.; Lee, Y.S. Analyzing the Korea’s growth experience: The application of R&D and human capital based growth models with demography. J. Asian Econ. 2006, 17, 818–831. [Google Scholar]
- Kuo, C.C.; Yang, C.H. Knowledge capital and spillover on regional economic growth: Evidence from China. China Econ. Rev. 2008, 19, 594–604. [Google Scholar] [CrossRef]
- Gumus, E.; Celikay, F. R&D expenditure and economic growth: New empirical evidence. Margin-J. Appl. Econ. Res. 2015, 9, 205–217. [Google Scholar]
- Das, R.C.; Mukherjee, S. Do spending on R&D influence income? An enquiry on world’s leading economies and groups. J. Knowl. Econ. 2020, 11, 1295–1315. [Google Scholar] [CrossRef]
- Dinçer, H.; Yüksel, S.; Adalı, Z.; Aydın, R. Evaluating the Role of Research and Development and Technology Investments on Economic Development of E7 Countries. In Organizational Transformation and Managing Innovation in the Fourth Industrial Revolution; IGI Global: Hershey, PA, USA, 2019; 19p. [Google Scholar] [CrossRef]
- Skvarciany, V.; Jurevičienė, D.; Volskytė, G. Assessment of Sustainable Socioeconomic Development in European Union Countries. Sustainability 2020, 12, 1986. [Google Scholar] [CrossRef]
- Kyzym, M.; Reshetniak, O.; Lelyuk, O. Simulating Development of Science in a Country with the Use of the Cognitive Approach. SHS Web Conf. 2019, 67, 01008. [Google Scholar] [CrossRef]
- Kyzym, M.; Bielousov, D.; Reshetnyak, O. Forecasting scientific support for the advancement of the digital economy. Stud. Appl. Econ. 2021, 38, 3. [Google Scholar] [CrossRef]
- Hece, Y.; Demir, M.; Güner, G. The Impact of R&D on Innovation and Economic Growth in OECD Countries. Uluslararası Toplum. Bilimler Derg. 2020, 4, 83–90. Available online: https://dergipark.org.tr/en/pub/toplumsalbilimler/issue/59324/851253 (accessed on 2 June 2022).
- Škrinjarić, T. R&D in Europe: Sector Decomposition of Sources of (in) Efficiency. Sustainability 2020, 12, 1432. [Google Scholar] [CrossRef]
- Hussain, Y.; Kerbache, L. The Challenges of Measuring Scientific Research Productivity and Impact in Developing Economies. Int. J. Bus. Econ. Res. 2020, 9, 109–116. [Google Scholar] [CrossRef]
- Lee, J.W. Human capital and productivity for Korea’s sustained economic growth. J. Asian Econ. 2005, 16, 663. [Google Scholar] [CrossRef]
- Grossmann, V. How to promote R&D-based growth? Public education expenditure on scientists and engineers versus R&D subsidies. J. Macroecon. 2007, 29, 891–911. [Google Scholar]
- Khan, J.; Khattak, N.U.R. The significance of research and development for economic growth: The case of Pakistan. City Univ. Res. J. 2013, 175–186. Available online: http://www.cityuniversity.edu.pk/curj/Journals/Journal/July%202013/Article%203.pdf (accessed on 11 June 2022).
- Grossman, G.M.; Helpman, E. Trade, knowledge spillovers, and growth. Eur. Econ. Rev. 1991, 35, 517–526. [Google Scholar] [CrossRef]
- Barro, R.J.; Martin, X.S. Economic Growth, 2nd ed.; Massachusetts Institute of Technology Press: London, UK, 2004; Available online: http://down.cenet.org.cn/upfile/8/200751171644184.pdf (accessed on 18 June 2022).
- Aghion, P.; Peter, H. A Model of Growth Through Creative Destruction. Econometrica 1992, 60, 323–351. Available online: http://www.jstor.org/stable/2951599 (accessed on 11 June 2022).
- Zeng, J. Innovative vs. imitative R&D and economic Growth. J. Dev. Econ. 2001, 64, 499–528. [Google Scholar] [CrossRef]
- Levin, R.C.; Klevorick, A.K.; Nelson, R.R.; Winter, S.G. Appropriating the returns from industrial research and development. Brook. Pap. Econ. Act. 1997, 3, 783–831. [Google Scholar] [CrossRef]
- Heller, M.; Eisenberg, R. Can patents deter innovation? The anticommons in biomedical research. Science 1998, 280, 698–701. [Google Scholar] [CrossRef] [PubMed]
- Boldrin, M.; Levine, D.K. The case against patents. J. Econ. Perspect. 2013, 27, 3–22. [Google Scholar] [CrossRef]
- Williams, H.L. How do patents affect research investments? Annu. Rev. Econ. 2017, 9, 441–469. [Google Scholar] [CrossRef]
- Samimi, A.J.; Alerasoul, S.M. R&D and economic growth: New evidence from some developing countries. Aust. J. Basic Appl. Sci. 2009, 3, 3464–3469. [Google Scholar]
- Chou, Y.K. The Australian Growth Experience (1960–2000), R & D based, Human Capital-Based or Just Steady State Growth? Research Paper; Department of Economics, University of Melbourne: Melbourne, Australia, 2002; p. 855. ISSN 0819-2642. Available online: http://econpapers.repec.org/RePEc:mlb:wpaper:855 (accessed on 12 June 2022).
- Ballot, G.; Fakhfakh, F.; Taymaz, E. Who benefits from training and R&D? The firm or the workers? A study on panels of French and Swedish firms. Br. J. Ind. Relat. 2006, 44, 473–495. Available online: https://www.inovasyon.org/images/makaleler/pdf/ET.WhoBenefits.pdf (accessed on 11 June 2022).
- Raychev, S.; Dimitrova, G.; Madzhurova, B.; Stoyanova, D. Innovations as a Factor for Economic Growth and Labor Market Development. Mark. Manag. Innov. 2020, 3, 22–31. [Google Scholar] [CrossRef]
- Jangraiz, K.; Naeem, R. The Significance of Research and Development for Economic Growth: The Case of Pakistan, MPRA, Paper No. 60594. 2014. Available online: https://mpra.ub.uni-muenchen.de/60594/ (accessed on 11 June 2022).
- Blanco, L.; Prieger, J.; Gu, J. The Impact of Research and Development on Economic Growth and Productivity in the US States. Pepperdine University, School of Public Policy Working Papers. Paper No. 48. 2013. Available online: https://digitalcommons.pepperdine.edu/sppworkingpapers/48 (accessed on 15 June 2022).
- Bayarçelik, E.B.; Taşel, F. Research and Development: Source of Economic Growth. Procedia-Soc. Behav. Sci. 2012, 58, 744–753. [Google Scholar] [CrossRef]
- Rajapova, M. The impact of R&D on economic growth of Uzbekistan. J. Crit. Rev. 2020, 7, 742–747. [Google Scholar] [CrossRef]
- Yu, H.; Devece, C.; Martinez, J.M.G.; Xu, B. An analysis of the paradox in R&D. Insight from a new spatial heterogeneity model. Technol. Forecast. Soc. Chang. 2021, 165, 120471. [Google Scholar] [CrossRef]
- Dobrzanski, P.; Bobowski, S. The Efficiency of R&D Expenditures in ASEAN Countries. Sustainability 2020, 12, 2686. [Google Scholar] [CrossRef]
- Hu, A.G.Z.; Jaffe, A.B. IPR, Innovation, Economic Growth and Development; Department of Economics, National University of Singapore: Singapore, 2007; Available online: https://policydialogue.org/files/events/background-materials/Hu_Jaffe_IPR_Innovation_Econ_Growth_and_Dev_Paper.pdf (accessed on 4 June 2022).
- Jones, C.I. Sources of U. S. Economic Growth in a World of Ideas. Am. Econ. Rev. 2002, 92, 220–239. [Google Scholar] [CrossRef]
- Almeida, A.; Teixeira, A.C. Does Patenting Negatively Impact on R&D Investment? An International Panel Data Assessment; FEP Working Papers; Faculdade de Economia do Porto, Universidade do Porto: Porto, Portugal, 2007; 255p. [Google Scholar]
- Das, R.C. Interplays among R&D spending, patent and income growth: New empirical evidence from the panel of countries and groups. J. Innov. Entrep. 2020, 9, 18. [Google Scholar] [CrossRef]
- Sierotowicz, T. Patent activity as an effect of the research and development of the business enterprise sectors in the countries of the European Union. J. Int. Stud. 2015, 8, 101–113. [Google Scholar] [CrossRef] [PubMed]
- Altuzarra, A. R&D and patents: Is it a two way street? Econ. Innov. New Technol. 2019, 28, 180–196. [Google Scholar] [CrossRef]
- Danguy, J.; de Rassenfosse, G.; van Pottelsberghe de la Potterie, B. The R&D-patent relationship: An industry perspective. EIB Papers, European Investment Bank (EIB). Luxembourg 2009, 14, 170–195. [Google Scholar]
- Otomo, P. The Impact of Patents on Research & Development Expenditure as a Percentage of Gross Domestic Products: A Case in the U.S. and EU Economies; Economics Student Theses and Capstone Projects; Skidmore College, New York, USA. 2017, p. 55. Available online: http://creativematter.skidmore.edu/econ_studt_schol/55 (accessed on 7 June 2022).
- Das, R.C. Interplays Between R&D Activity and Net Receipts on the Uses of Intellectual Property Rights: A Study on World’s Major Economic Groups. In Strategic Outlook for Innovative Work Behaviours; Dincer, H., Yüksel, S., Eds.; Contributions to Management Science; Springer: Cham, Switzerland, 2020. [Google Scholar] [CrossRef]
- Inhaber, H.; Alvo, M. World science as an input-output system. Scientometrics 1978, 1, 43–64. [Google Scholar] [CrossRef]
- Yingnan, Z. A Model of Input and Output of Science and Technology. In Proceedings of the Second UKSIM European Symposium on Computer Modeling and Simulation, Liverpool, UK, 8–10 September 2008; pp. 301–304. [Google Scholar] [CrossRef]
- Law Insider, Science Outputs Definition. 2017. Available online: https://www.lawinsider.com/dictionary/science-outputs (accessed on 7 June 2022).
- COSTII. Composite Science and Technology Innovation Index. 2020. Available online: https://www.k2base.re.kr/costii/en/home.do (accessed on 1 June 2022).
- Cozzens, S.; Porter, A.; Walsh, J. Science, Technology and Innovation Composite Indicators for Developing Countries; Georgia Institute of Technology: Atlanta, GA, USA, 2007; Available online: https://smartech.gatech.edu/bitstream/handle/1853/16321/chinaprayoon_chinawut_200708_mast.pdf (accessed on 1 June 2022).
- Mansoor Shahab. Technology Achievement Index 2015: Mapping the Global Patterns of Technological Capacity in the Network Age. Available online: https://www.academia.edu/23906892/Technology_Achievement_Index_2015 (accessed on 1 June 2022).
- Khaustova, V.; Reshetnyak, O. Main Trends and Problems in the Development of Science in Ukraine. Probl. Econ. 2019, 2, 62–72. [Google Scholar] [CrossRef]
- Matyushenko, I.; Khaustova, V.; Kniazev, S. Institutional support of innovative R&D in the formation of single research area in the EU and Ukraine. Sci. Innov. 2017, 13, 5–23. [Google Scholar] [CrossRef]
- Kyzym, M.; Khaustova, V.; Reshetnyak, O.; Danko, N. Significance of Developmental Science under Assimilation of the Digitalization of the Ukrainian Economy. Int. J. Adv. Sci. Technol. 2020, 29, 1037–1042. Available online: http://sersc.org/journals/index.php/IJAST/article/view/9167 (accessed on 1 June 2022).
- Reshetnyak, O. Scientific and Technical Activity in Ukraine: Assessment and Directions of Development; Publisher Liburkina LM: Kharkiv, Ukraine, 2020; 720p, Available online: https://ndc-ipr.org/publications/?filter=pmonografiyip (accessed on 11 June 2022).
- Reshetnyak, O. Modeling rating of scientific and technological development of the countries. Innov. Technol. Sci. Solut. Ind. 2020, 1, 80–89. [Google Scholar] [CrossRef]
- Saltelli, A. Composite indicators between analysis and advocacy. Soc. Indic. Res. 2007, 81, 65–77. [Google Scholar] [CrossRef]
- Handbook on Constructing Composite indicators, Methodology and User Guide; OECD/JRC EC: Paris, France. 2008. Available online: https://www.oecd.org/sdd/42495745.pdf (accessed on 5 June 2022).
- Greenacre, M.J. Theory and Applications of Correspondence Analysis; Academic Press: London, UK, 1984. [Google Scholar]
- Haustova, V.Y.; Omelchenko, O.I. Integral estimation of population living standards in regions of Ukraine by method of entropy. Actual Probl. Econ. 2011, 2, 137–146. [Google Scholar]
- Gryshova, I.; Kyzym, M.; Khaustova, V.; Korneev, V.; Kramarev, H. Assessment of the industrial structure and its influence on sustainable economic development and quality of life of the population of different world countries. Sustainability 2020, 12, 2072. [Google Scholar] [CrossRef]
- Human Development Report 1990: Concept and Measurement of Human Development; UNDP (United Nations Development Programme): New York, NY, USA. 1990. Available online: https://hdr.undp.org/system/files/documents//hdr1990encompletenostatspdf.pdf (accessed on 1 June 2022).
- OECD. Green Growth Indicators. Available online: https://stats.oecd.org (accessed on 14 September 2022).
- Walz, R.; Pfaff, M.; Marscheider-Weidemann, F.; Glöser-Chahoud, S. Innovations for Reaching the Green Sustainable Development Goals–Where Will They Come from? Int. Econ. Econ. Policy 2017, 14, 449–480. [Google Scholar] [CrossRef]
- Fernandes, C.I.; Veiga, P.M.; Ferreira, J.J.; Hughes, M. Green growth versus economic growth: Do sustainable technology transfer and innovations lead to an imperfect choice? Bus Strat Env 2021, 30, 2021–2037. [Google Scholar] [CrossRef]
- Mealy, P.; Teytelboym, A. Economic Complexity and the Green Economy. Res. Policy 2020, 51, 103948. [Google Scholar] [CrossRef]
- Fang, W.; Liu, Z.; Putra, A.R.S. Role of research and development in green economic growth through renewable energy development: Empirical evidence from South Asia. Renew. Energy 2022, 194, 1142–1152. [Google Scholar] [CrossRef]
- Hansen, U.E.; Lema, R. The Co-Evolution of Learning Mechanisms and Technological Capabilities: Lessons from Energy Technologies in Emerging Economies. Technol. Forecast. Soc. Chang. 2019, 140, 241–257. [Google Scholar] [CrossRef]
- Binz, C.; Gosens, J.; Hansen, T.; Hansen, U.E. Toward Technology-Sensitive Catching-up Policies: Insights from Renewable Energy in China. World Dev. 2017, 96, 418–437. [Google Scholar] [CrossRef]
- Saikawa, E.; Urpelainen, J. Environmental Standards as a Strategy of International Technology Transfer. Environ. Sci. Policy 2014, 38, 192–206. [Google Scholar] [CrossRef]
- Söderholm, P. The green economy transition: The challenges of technological change for sustainability. Sustain. Earth 2020, 3, 6. [Google Scholar] [CrossRef]
- World Social Science Report, 2016: Challenging Inequalities: Pathways to a Just World. United Nations Educational, Scientific and Cultural Organization (UNESCO): Paris, France, 2016. Available online: https://unesdoc.unesco.org/images/0024/002458/245825e.pdf (accessed on 1 June 2022).


Publisher’s Note: MDPI stays neutral with regard to jurisdictional claims in published maps and institutional affiliations. |
© 2022 by the authors. Licensee MDPI, Basel, Switzerland. This article is an open access article distributed under the terms and conditions of the Creative Commons Attribution (CC BY) license (https://creativecommons.org/licenses/by/4.0/).