


Identifying the Leverage Points in the Household Solid Waste Management System for Harare, Zimbabwe, Using Network Analysis Techniques


Abstract
:1. Introduction
2. Methodology
3. Results and Discussion
4. Conclusions
5. Future Recommendations
Author Contributions
Funding
Institutional Review Board Statement
Informed Consent Statement
Data Availability Statement
Conflicts of Interest
Appendix A

| Degree Centrality | Betweenness Centrality | Degree Centrality | Betweenness Centrality | ||||||
|---|---|---|---|---|---|---|---|---|---|
| Node | Degree | In-Degree | Out-Degree | Node | Degree | In-Degree | Out-Degree | ||
| 1 “Poverty” | 4 | 1 | 3 | 20 | 49 “Waste data” | 4 | 3 | 1 | 217 |
| 2 “Urban agriculture” | 3 | 2 | 1 | 19.5 | 50 “Planning and monitoring” | 5 | 2 | 3 | 176 |
| 3 “Operation Murambatsvina” | 1 | 0 | 1 | 0 | 51 “Gender” | 1 | 0 | 1 | 0 |
| 4 “Festive season” | 1 | 0 | 1 | 0 | 52 “Land reform program” | 1 | 0 | 1 | 0 |
| 5 “Waste volume” | 9 | 7 | 2 | 210 | 53 “Foreign currency” | 2 | 0 | 2 | 0 |
| 6 “Waste collection pressure” | 3 | 1 | 2 | 170 | 54 “Hyperinflation” | 2 | 0 | 2 | 0 |
| 7 “Consumption” | 5 | 2 | 3 | 58.7 | 55 “Unemployment rate” | 3 | 1 | 2 | 126 |
| 8 “Population” | 6 | 3 | 3 | 90 | 56 “Municipal capacity” | 4 | 4 | 0 | 0 |
| 9 “Natural population increase” | 1 | 0 | 1 | 0 | 57 “Multicurrency” | 1 | 0 | 1 | 0 |
| 10 “Urbanization” | 2 | 1 | 1 | 29 | 58 “Private companies” | 1 | 0 | 1 | 0 |
| 11 “Changes in waste consumption patterns” | 3 | 1 | 2 | 6.7 | 59 “Research” | 3 | 1 | 2 | 67 |
| 12 “Socio-economic class” | 7 | 1 | 6 | 91.5 | 60 “Billed properties” | 2 | 0 | 2 | 0 |
| 13 “Waste collection efficiency” | 5 | 4 | 1 | 316 | 61 “Recyclers” | 1 | 0 | 1 | 0 |
| 14 “Waste collection frequency” | 5 | 4 | 1 | 135.5 | 62 “Loans” | 1 | 0 | 1 | 0 |
| 15 “Harare waste collection policy” | 1 | 0 | 1 | 0 | 63 “Waste collection vehicles” | 3 | 2 | 1 | 117 |
| 16 “Suspension of waste collection services” | 1 | 0 | 1 | 0 | 64 “Workforce capacity” | 6 | 2 | 4 | 253 |
| 17 “Vehicles breakdowns” | 2 | 1 | 1 | 91 | 65 “Fuel” | 3 | 2 | 1 | 28 |
| 18 “Vehicles maintenance” | 3 | 2 | 1 | 102 | 66 “Fuel cost” | 1 | 0 | 1 | 0 |
| 19 “Uncollected waste” | 4 | 2 | 2 | 337.5 | 67 “Distance from disposal site” | 1 | 0 | 1 | 0 |
| 20 “Crude waste dumping” | 3 | 2 | 1 | 72.5 | 68 “Community participation” | 1 | 1 | 0 | 0 |
| 21 “Open waste burning” | 2 | 0 | 2 | 0 | 69 “Colonization” | 3 | 0 | 3 | 0 |
| 22 “Waste burying” | 1 | 0 | 1 | 0 | 70 “Travel regulations” | 2 | 1 | 1 | 8 |
| 23 “Waste law enforcement” | 2 | 1 | 1 | 10 | 71 “Illegal settlements” | 2 | 1 | 1 | 56.5 |
| 24 “Receptacle availability” | 4 | 3 | 1 | 42.5 | 72 “Black access to goods and services” | 3 | 2 | 1 | 4.8 |
| 25 “Waste management knowledge” | 4 | 1 | 3 | 28 | 73 “Processed products” | 2 | 1 | 1 | 1.8 |
| 26 “Home tenureship” | 1 | 0 | 1 | 0 | 74 “Racial segregation” | 2 | 1 | 1 | 43.5 |
| 27 “Mosquito and rodent manifestation” | 2 | 1 | 1 | 0 | 75 “Capital city” | 1 | 0 | 1 | 0 |
| 28 “Sewer blockages” | 3 | 1 | 2 | 0 | 76 “Corruption” | 1 | 0 | 1 | 0 |
| 29 “Perceptions” | 5 | 2 | 3 | 32 | 77 “Waste collection fee” | 2 | 1 | 1 | 67 |
| 30 “Street vendors” | 6 | 3 | 3 | 181 | 78 “Communication” | 1 | 0 | 1 | 0 |
| 31 “Environmental pollution” | 2 | 2 | 0 | 0 | 79 “Worker strikes” | 4 | 3 | 1 | 92 |
| 32 “Health risk” | 3 | 3 | 0 | 0 | 80 “PPE” | 1 | 0 | 1 | 0 |
| 33 “Sanitary landfilling operations” | 3 | 2 | 1 | 17.5 | 81 “Salaries” | 2 | 1 | 1 | 51 |
| 34 “Financial capacity” | 13 | 5 | 8 | 268 | 82 “Fights” | 1 | 1 | 0 | 0 |
| 35 “Technical capacity” | 5 | 3 | 2 | 124 | 83 “Sanitary formal solid waste disposal” | 3 | 2 | 1 | 68 |
| 36 “No engineered landfills” | 4 | 2 | 2 | 173.5 | 84 “Waste transfer to poorer suburbs” | 1 | 1 | 0 | 0 |
| 37 “Landfill equipment” | 2 | 0 | 2 | 0 | 85 “Strategy implementation” | 2 | 2 | 0 | 0 |
| 38 “Donor funding” | 2 | 1 | 1 | 47 | 86 “Changes in waste composition patterns” | 4 | 4 | 0 | 0 |
| 39 “Economy” | 9 | 6 | 3 | 269 | 87 “HIV/AIDS epidemic” | 1 | 0 | 1 | 0 |
| 40 “Political instability” | 3 | 1 | 2 | 44 | 88 “Cost of service provision” | 4 | 4 | 0 | 0 |
| 41 “Municipal expansion” | 2 | 1 | 1 | 0 | 89 “Accidents” | 1 | 1 | 0 | 0 |
| 42 “Waste recovery” | 5 | 4 | 1 | 60.5 | 90 “Illegal waste dumping” | 14 | 10 | 4 | 300 |
| 43 “Waste separation at source” | 1 | 0 | 1 | 0 | 91 “Population density” | 1 | 1 | 0 | 0 |
| 44 “Waste policy” | 2 | 1 | 1 | 17 | 92 “Dumpsite fires” | 2 | 2 | 0 | 0 |
| 45 “Access control” | 4 | 1 | 3 | 84 | 93 “National informal economy” | 2 | 1 | 1 | 73 |
| 46 “Waste generation rate” | 2 | 1 | 1 | 0 | 94 “National formal economy” | 1 | 0 | 1 | 0 |
| 47 “Disposable income” | 4 | 1 | 3 | 18.5 | 95 “Weather” | 1 | 0 | 1 | 0 |
| 48 “Weighbridge at dumpsite” | 1 | 0 | 1 | 0 | |||||
| Term | Description | Example in the Study |
|---|---|---|
| Node | An actor in the network. | HSW issues in Harare e.g., population and waste volume. |
| Edge | The link/connection between nodes. | Examples of linked nodes in the network are: Waste recovery—Recyclers Waste recovery—Private companies. |
| Degree centrality | The number of edges directly linked to a node. | Population is directly linked to 7 other nodes. |
| In-degree | The number of nodes directly affecting a given node/the number of nodes directed towards a node. | Population has 3 nodes directly affecting it (edges directed inwards). |
| Out-degree | The number of nodes directly affected by a given node/the number of nodes directed away from a node. | Population has 4 nodes directly being affected by it (edges directed outwards). |
| Betweenness centrality | It is equal to the number of shortest paths from all vertices to all others that pass through the nodes. | It measures the number of times a node acts as a bridge along the shortest path between two other nodes linking nodes that would otherwise not be linked. |
| Issue | Description | Issue | Description |
|---|---|---|---|
| 1 “Poverty” | The lack of financial resources of the of people to afford a basic standard of living. | 49 “Waste data” | The availability of data that describes waste management in Harare e.g. waste generation rate, waste collection rate etc. |
| 2 “Urban agriculture” | Farming practices in urban areas. | 50 “Planning and monitoring” | The availability of a planning and monitoring services within the waste management department. |
| 3 “Operation Murambatsvina” | Also known as the ‘Operation Restore Order’, is a government initiative conducted in 2005 where slum areas/illegal structures were forcibly removed across the country. | 51 “Gender” | The sex of the city resident i.e., male or female. |
| 4 “Festive season” | The period leading up to the Christmas and New year holidays. | 52 “Land reform program” | The redistribution of land that occurred in Zimbabwe in the year 2000. |
| 5 “Waste volume” | The quantity of waste produced in Harare. | 53 “Foreign currency” | The available of foreign currency. |
| 6 “Waste collection pressure” | The demand for waste collection services from the local authorities by the city residents. | 54 “Hyperinflation” | The excessive general increase in prices in Harare. |
| 7 “Consumption” | The extent of use of resources by the city residents. | 55 “Unemployment rate” | The increase in the fraction of unemployed people in Harare. |
| 8 “Population” | The amount of people who live in Harare city. | 56 “Municipal capacity” | The ability of the local authorities to handle generated waste. |
| 9 “Natural population increase” | The natural positive change in population in Harare which occurs when live births are higher than deaths recorded in a given period. | 57 “Multicurrency” | The simultaneous use of different currencies in the economy. |
| 10 “Urbanization” | Population shift from rural to urban areas. | 58 “Private companies” | Privately owned companies. |
| 11 “Changes in waste consumption patterns” | - | 59 “Research” | Conducted studies. |
| 12 “Socio-economic class” | Social standing which is measured by place of residence and income. | 60 “Billed properties” | The number of properties that are recognised by the local authorities and hence should pay for municipal services offered. |
| 13 “Waste collection efficiency” | The efficiency with which the local authorities collect waste. | 61 “Recyclers” | The number of people who collect waste for reuse or sale. |
| 14 “Waste collection frequency” | The frequency (i.e. number of waste collection days) with which the local authorities collect waste. | 62 “Loans” | Money borrowed by the local authorities inorder to fund waste management operations. |
| 15 “Harare waste collection policy” | The stipulated waste collection frequency by the local authorities. | 63 “Waste collection vehicles” | The number of vehicles available for waste collection. |
| 16 “Suspension of waste collection services” | - | 64 “Workforce capacity” | The number of workers available for waste management as compared to the number of workers needed. |
| 17 “Vehicles breakdowns” | How often waste collection vehicles break down. | 65 “Fuel” | The availability of fuel for waste collection. |
| 18 “Vehicles maintainance” | The efficiency and frequency with which waste collection vehicles are maintained. | 66 “Fuel cost” | The cost of fuel. |
| 19 “Uncollected waste” | The amount of waste that remains uncollected. | 67 “Distance from disposal site” | The distance waste collection vehicles must travel inorder to collect and dispose of waste. |
| 20 “Crude waste dumping” | Waste dumped by unsanitary means at the official Harare dumpsite. | 68 “Community participation” | Involvement of communities in waste management. |
| 21 “Open waste burning” | The waste disposal method where waste is set on fire in open spaces. | 69 “Colonization” | The effect of Zimbabwe’s colonization period of 1988–1980. |
| 22 “Waste burying” | The waste disposal method where pits are dug, waste emptied in them and covered in soil. | 70 “Travel regulations” | The restriction of entry of black people in urban areas that was set during the colonial period. |
| 23 “Waste law enforcement” | The efficiency with which waste laws are enforced. | 71 “Illegal settlements” | Non-registered settlements in Harare. |
| 24 “Receptacle availability” | The availability of waste receptacles. | 72 “Black access to goods and services” | During the colonial period. |
| 25 “Waste management knowledge” | Residents’ knowledge on how to manage waste. | 73 “Processed products” | Packaged goods. |
| 26 “Home tenureship” | The number of people that own the houses they reside in. | 74 “Racial segregation” | During the colonial period. |
| 27 “Mosquito and rodent manifestation” | The extent to which vermin is prevalent. | 75 “Capital city” | Harare is the capital city of Zimbabwe. |
| 28 “Sewer blockages” | Blockage of sewer pipes which can cause sewer overflows. | 76 “Corruption” | Fraudulent conduct by authorities in the city council. |
| 29 “Perceptions” | How the city residence view or awareness on waste management issues. | 77 “Waste collection fee” | The waste management service charges for households. |
| 30 “Street vendors” | The number of people illegally selling products in the city streets. | 78 “Communication” | Communication between waste management stakeholders. |
| 31 “Environmental pollution” | The extent of land, water and air pollution. | 79 “Worker strikes” | Strikes by waste management workers. |
| 32 “Health risk” | Exposure of people to the possibility of health endangerment. | 80 “PPE” | Workers’ personal protective equipment. |
| 33 “Sanitary landfilling operations” | Waste disposal procedures that follows the environmental, social and public health safety guidelines. | 81 “Salaries” | The amounts of salaries workers receive. |
| 34 “Financial capacity” | The ability of the local government to fund operations. | 82 “Fights” | Conflicts between people. |
| 35 “Technical capacity” | The ability of the local government to offer technical resources needed for waste management operations. | 83 “Sanitary formal solid waste disposal” | Waste disposal that follows the environmental, social and public health safety guidelines. |
| 36 “No engineered landfills” | - | 84 “Waste transfer to poorer suburbs” | - |
| 37 “Landfill equipment” | Equipment required to ensure sanitary landfilling operations. | 85 “Strategy implementation” | Implementation of waste management strategies. |
| 38 “Donor funding” | The amount of external funding received by the local authorities towards waste management in Harare. | 86 “Changes in waste composition patterns” | - |
| 39 “Economy” | National output which determines the goods and services received by the residents. | 87 “HIV/AIDS epidemic” | The effects of the HIV/AIDS epidemic. |
| 40 “Political instability” | Conflicts and competitions between political parties. | 88 “Cost of service provision” | The cost of providing waste management services. |
| 41 “Municipal expansion” | Positive change in the capacity of the local authorities to manage waste. | 89 “Accidents” | - |
| 42 “Waste recovery” | Reuse of waste either through composting or recycling. | 90 “Illegal waste dumping” | Waste dumped in unsanitary means. |
| 43 “Waste seperation at source” | Amount of waste is separated at source. | 91 “Population density” | The number of people per unit area. |
| 44 “Waste policy” | The policies that govern waste management in Harare. | 92 “Dumpsite fires” | - |
| 45 “Access control” | The control measures set by the local authorities in accessing the official dumpsite. | 93 “National informal economy” | Economic activities and workers that are not registered with the government. |
| 46 “Waste generation rate” | The amount of waste generated per capita per day. | 94 “National formal economy” | Economic activities and workers that are registered with the government. |
| 47 “Disposable income” | The average amount of money available to spend for a family or individual after deduction of taxes. | 95 “Weather” | Rainfall received. |
| 48 “Weighbridge at dumpsite” | The availability of a weighbridge at the official dumpsite. |
| Outcome | Command |
|---|---|
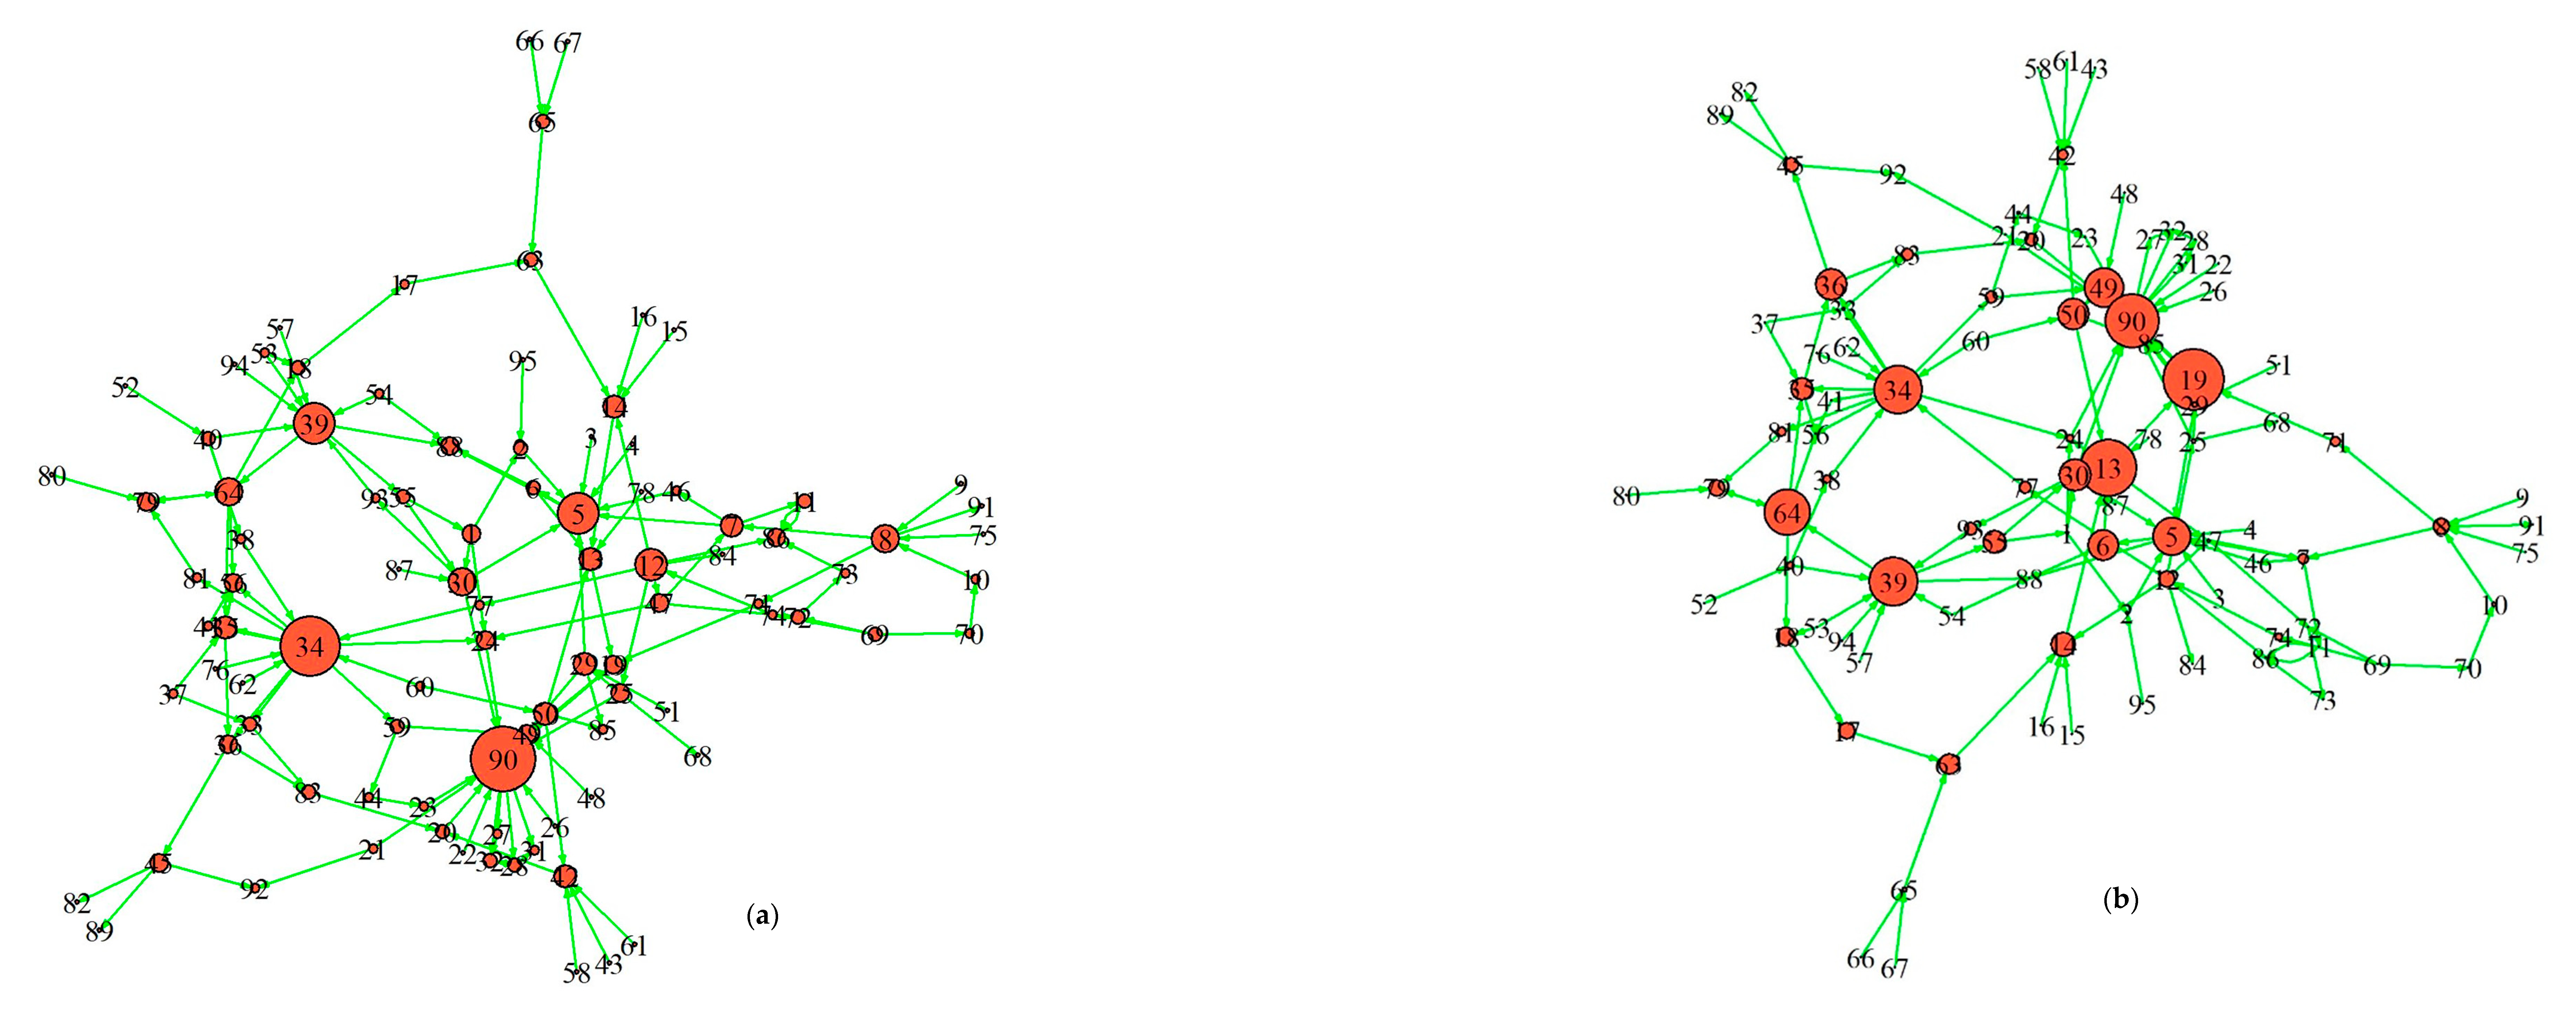
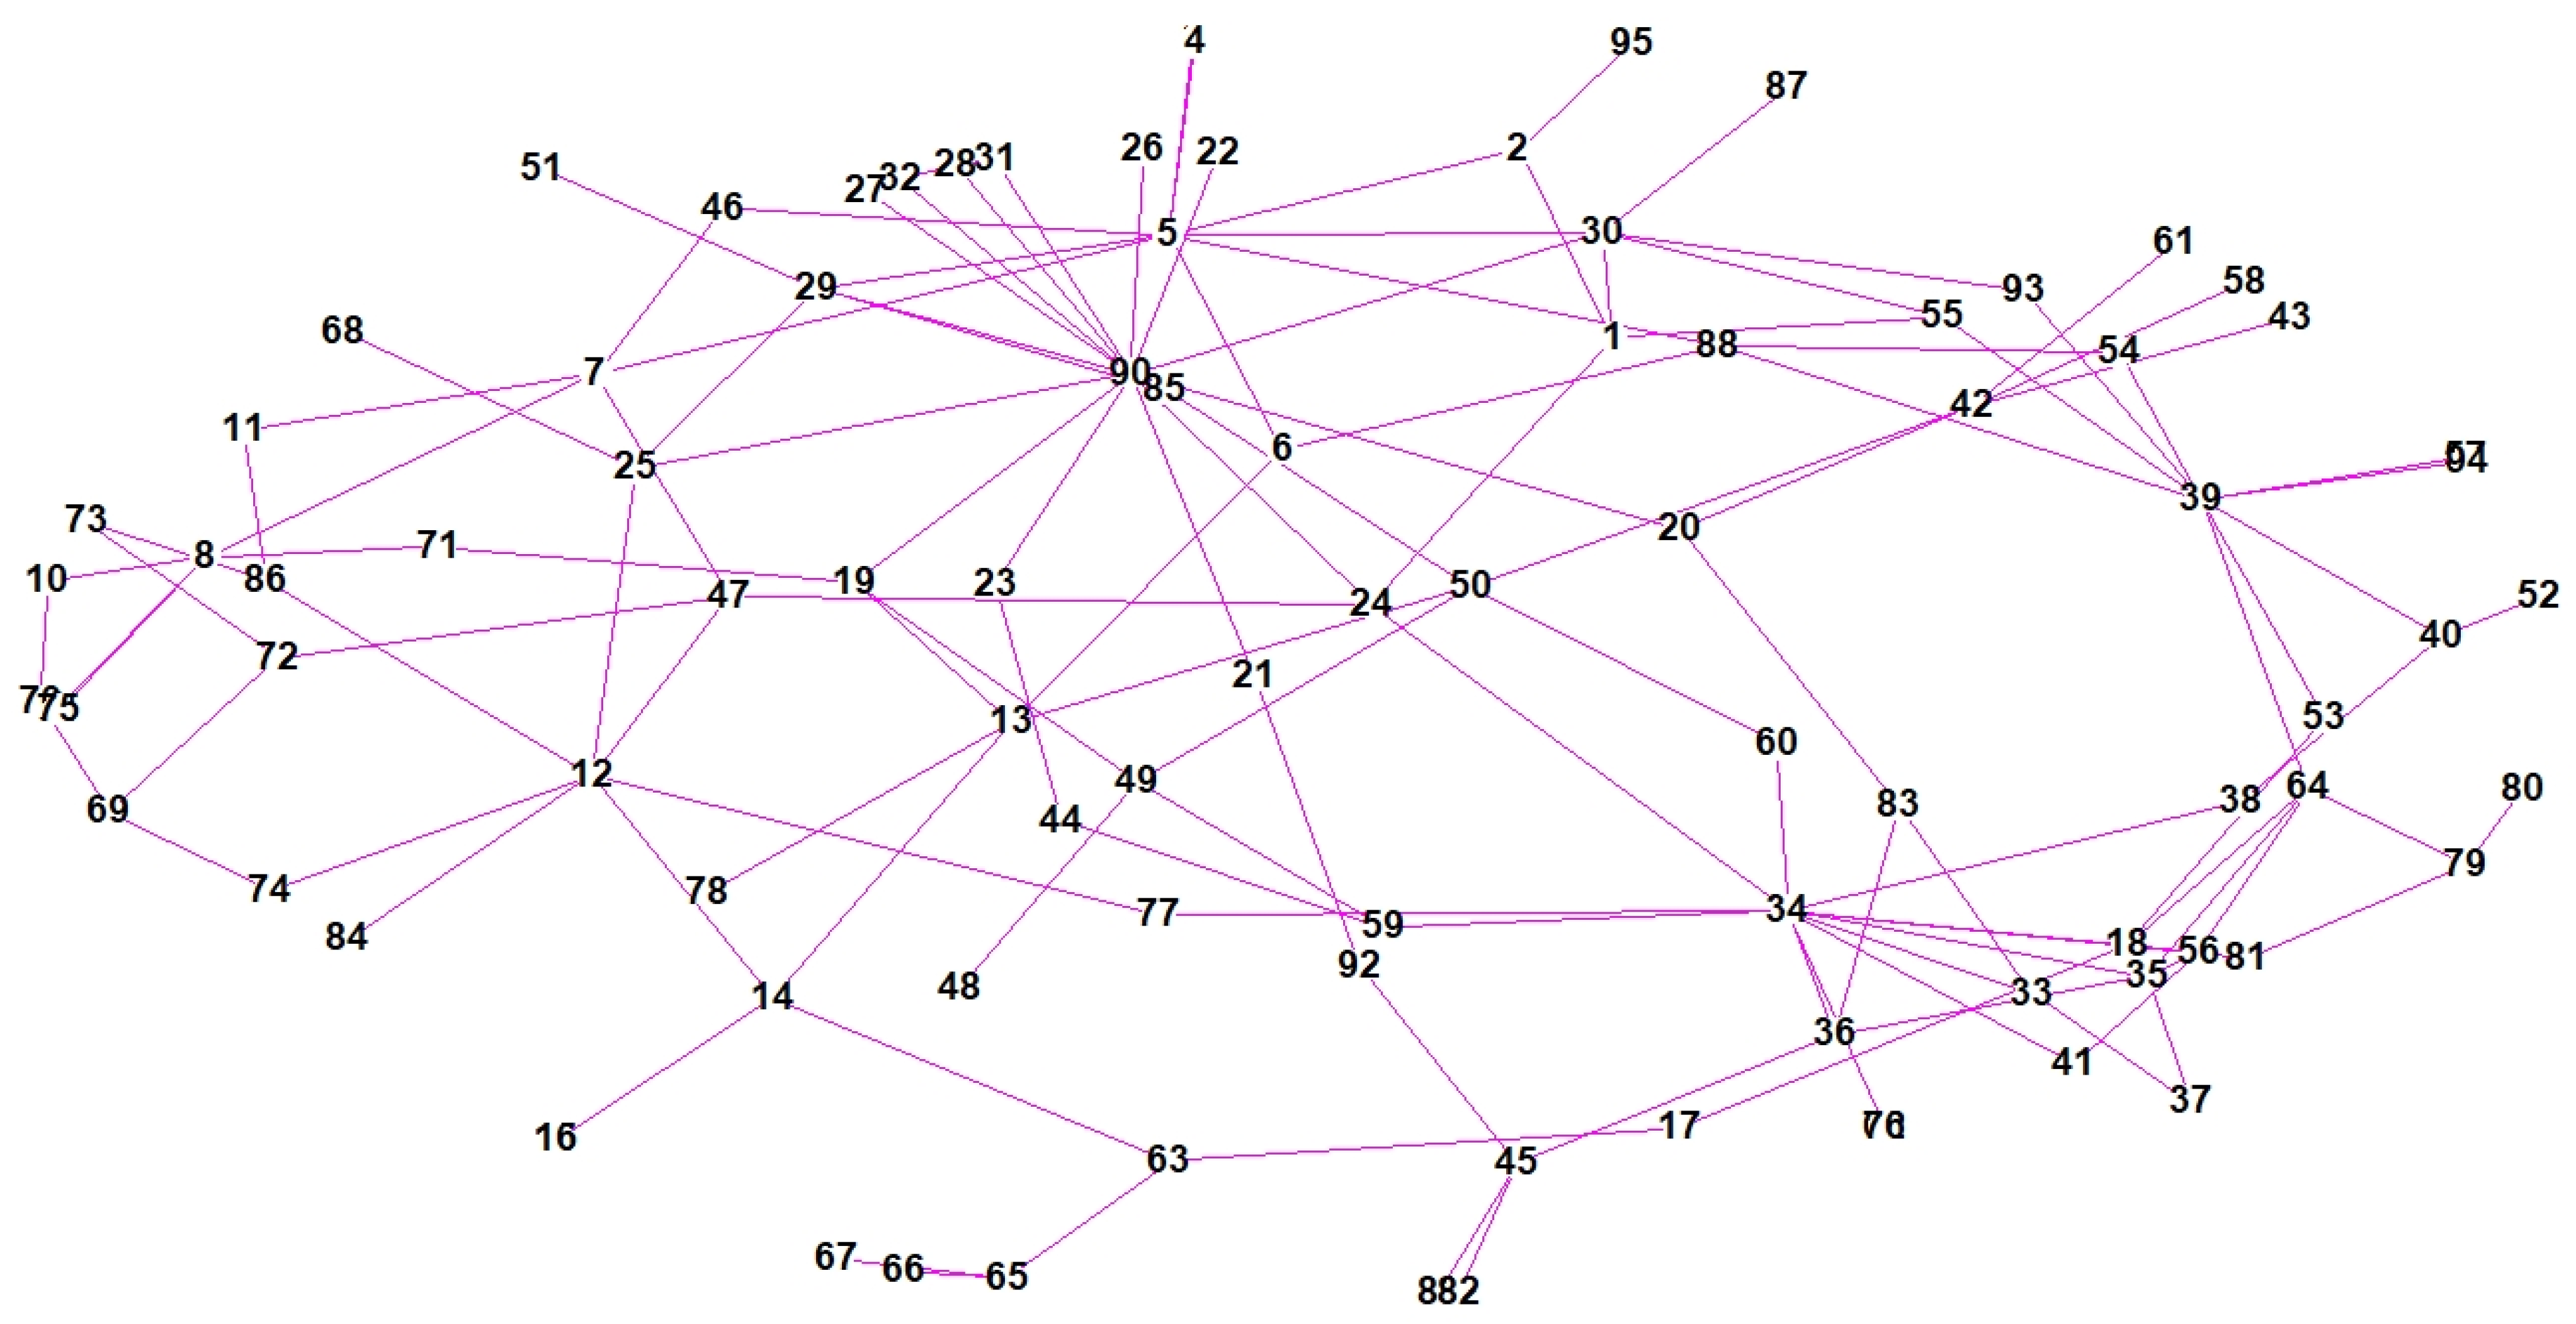
| Generating a Directed Network (kamada kawai layout and circular layout with nodes size at 5) |
|
| Degree centrality |
|
| Betweenness centrality |
|
| Average path length |
|
| Network density |
|
| Network diameter |
|
| Network edges |
|
| Network size |
|
| Generating a directed Network (kamada kawai layout and circular layout with node size according to degree centrality and betweenness) |
|
| Generating 300 ppi Rplots (e.g degree centrality plot) |
|

References
- Kaza, S.; Yao, L.; Bhada-Tata, P.; Van Woerden, F. What a Waste 2.0: A Global Snapshot of Solid Waste Management to 2050; World Bank Publications: Washington, DC, USA, 2018. [Google Scholar]
- Hoornweg, D.; Bhada-Tata, P. What a Waste: A Global Review of Solid Waste Management; World Bank Publications: Washington, DC, USA, 2012. [Google Scholar]
- Vergara, S.E.; Tchobanoglous, G. Municipal solid waste and the environment: A global perspective. Annu. Rev. Environ. Resour. 2012, 37, 277–309. [Google Scholar] [CrossRef]
- Kirkman, R.; Voulvoulis, N. The role of public communication in decision making for waste management infrastructure. J. Environ. Manag. 2017, 203, 640–647. [Google Scholar] [CrossRef] [PubMed]
- Kang, H.-Y.; Schoenung, J.M. Electrsonic waste recycling: A review of US infrastructure and technology options. Resour. Conserv. Recycl. 2005, 45, 368–400. [Google Scholar] [CrossRef]
- Jaunich, M.K.; Levis, J.W.; DeCarolis, J.F.; Barlaz, M.A.; Ranjithan, S.R. Solid waste management policy implications on waste process choices and systemwide cost and greenhouse gas performance. Environ. Sci. Technol. 2019, 53, 1766–1775. [Google Scholar] [CrossRef]
- Caniato, M.; Vaccari, M.; Visvanathan, C.; Zurbrügg, C. Using social network and stakeholder analysis to help evaluate infectious waste management: A step towards a holistic assessment. Waste Manag. 2014, 34, 938–951. [Google Scholar] [CrossRef]
- Xu, W.; Zhou, C.; Cao, A.; Luo, M. Understanding the mechanism of food waste management by using stakeholder analysis and social network model: An industrial ecology perspective. Ecol. Model. 2016, 337, 63–72. [Google Scholar] [CrossRef]
- Xu, J.; Lu, W.; Xue, F.; Chen, K.; Ye, M.; Wang, J.; Chen, X. Cross-boundary collaboration in waste management research: A network analysis. Environ. Impact Assess. Rev. 2018, 73, 128–141. [Google Scholar] [CrossRef]
- Harvey, J.; Smith, A.; Goulding, J.; Illodo, I.B. Food sharing, redistribution, and waste reduction via mobile applications: A social network analysis. Ind. Mark. Manag. 2020, 88, 437–448. [Google Scholar] [CrossRef]
- Bakshan, A.; Srour, I.; Chehab, G.; El-Fadel, M.; Karaziwan, J. Behavioral determinants towards enhancing construction waste management: A Bayesian Network analysis. Resour. Conserv. Recycl. 2017, 117, 274–284. [Google Scholar] [CrossRef]
- Ashton, W. Understanding the organization of industrial ecosystems: A social network approach. J. Ind. Ecol. 2008, 12, 34–51. [Google Scholar] [CrossRef]
- Duygan, M.; Stauffacher, M.; Meylan, G. What constitutes agency? Determinants of actors’ influence on formal institutions in Swiss waste management. Technol. Forecast. Soc. Chang. 2021, 162, 120413. [Google Scholar] [CrossRef]
- Ghinoi, S.; Silvestri, F.; Steiner, B. Toward the creation of novel food waste management systems: A network approach. J. Clean. Prod. 2020, 246, 118987. [Google Scholar] [CrossRef]
- Carrington, P.J.; Scott, J.; Wasserman, S. Models and Methods in Social Network Analysis; Cambridge University Press: Cambridge, UK, 2005; Volume 28. [Google Scholar]
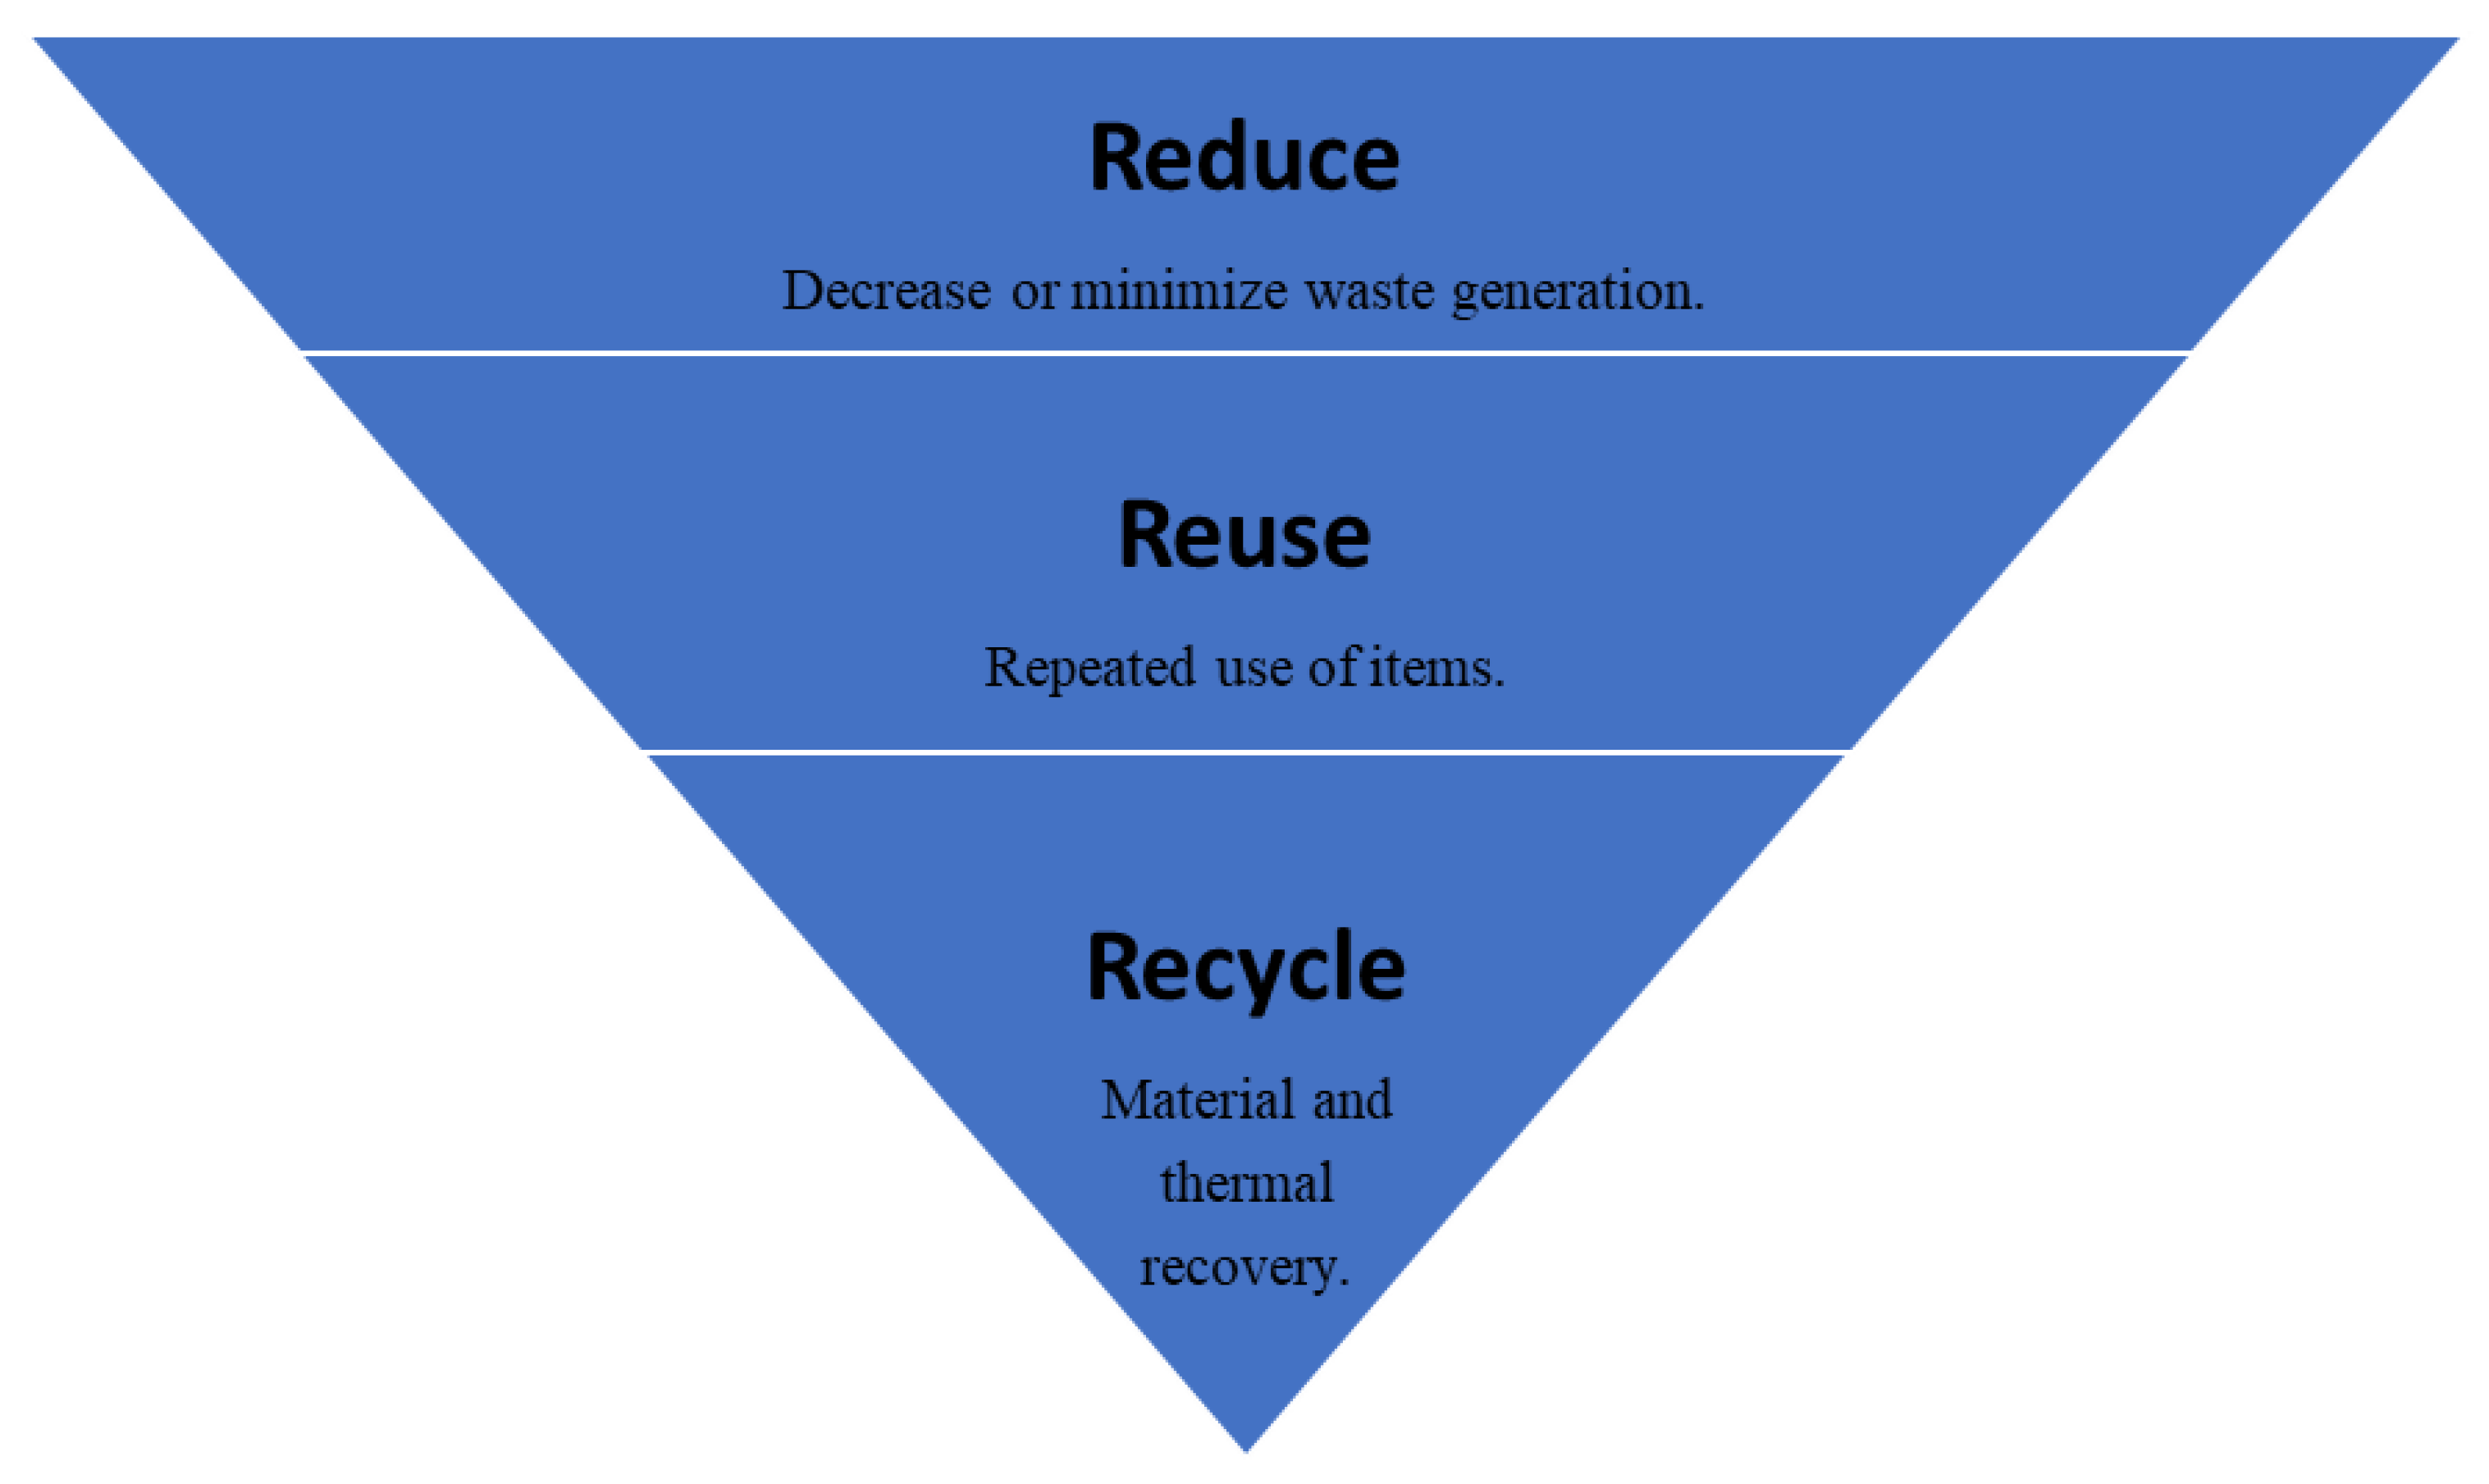
- Ahmadi, M. Evaluating the performance of 3Rs waste practices: Case study-region one municipality of Tehran. Adv. Recycl. Waste Manag. 2017, 2, 2. [Google Scholar] [CrossRef]
- Mohanty, C. Reduce, reuse and recycle (the 3Rs) and resource efficiency as the basis for sustainable waste management. In Proceedings of the Synergizing Resource Efficiency with Informal Sector towards Sustainable Waste Management, New York, NY, USA, 9 May 2011; Volume 9. [Google Scholar]
- Peprah, K.; Amoah, S.T.; Achana, G.T.W. Assessing ‘3rs’model in Relation to Municipal Solid Waste Management in Wa, Ghana. World Environ. 2015, 5, 112–120. [Google Scholar] [CrossRef]
- Chiu, A.S. The 3Rs and Poverty Reduction in Developing Countries; Asia Resource Circulation Policy Research Working Paper Series; Institute for Global Environmental Strategies (IGES): Hayama, Japan, 2010. [Google Scholar]
- Kwenda, P.R.; Lagerwall, G.; Eker, S.; Van Ruijven, B. A mini-review on household solid waste management systems in low-income developing countries: A case study of urban Harare City, Zimbabwe. Waste Manag. Res. 2022, 40, 139–153. [Google Scholar] [CrossRef]
- PAJEK. Analysis and Visualization of Very Large Networks. Available online: http://mrvar.fdv.uni-lj.si/pajek/ (accessed on 9 January 2021).
- Team, R.C. R: A Language and Environment for Statistical Computing; R Foundation for Statistical Computing: Vienna, Austria, 2013; Available online: http://www.R-project.org/ (accessed on 9 January 2022).
- VOSviewer. VOSviewer. Available online: https://www.vosviewer.com/ (accessed on 15 January 2021).
- Bródka, P.; Skibicki, K.; Kazienko, P.; Musiał, K. A degree centrality in multi-layered social network. In Proceedings of the 2011 International Conference on Computational Aspects of Social Networks (CASoN), Salamanca, Spain, 19–21 October 2011; pp. 237–242. [Google Scholar]
- Srinivas, A.; Velusamy, R.L. Identification of influential nodes from social networks based on Enhanced Degree Centrality Measure. In Proceedings of the 2015 IEEE international advance computing conference (IACC), Bangalore, India, 12–13 June 2015; pp. 1179–1184. [Google Scholar]
- Yan, E.; Ding, Y. Applying centrality measures to impact analysis: A coauthorship network analysis. J. Am. Soc. Inf. Sci. Technol. 2009, 60, 2107–2118. [Google Scholar] [CrossRef]
- Maharani, W.; Gozali, A.A. Degree centrality and eigenvector centrality in twitter. In Proceedings of the 2014 8th International Conference on Telecommunication Systems Services and Applications (TSSA), Kuta, Indonesia, 23–24 October 2014; pp. 1–5. [Google Scholar]
- Ergün, E.; Usluel, Y.K. An analysis of density and degree-centrality according to the social networking structure formed in an online learning environment. J. Educ. Technol. Soc. 2016, 19, 34–46. [Google Scholar]
- Brandes, U.; Erlebach, T. Network Analysis. LNCS; Springer: Berlin/Heidelberg, Germany, 2005; Volume 3418. [Google Scholar]
- Hmelo-Silver, C.E.; Azevedo, R. Understanding complex systems: Some core challenges. J. Learn. Sci. 2006, 15, 53–61. [Google Scholar] [CrossRef]
- Liu, Y.-Y.; Slotine, J.-J.; Barabási, A.-L. Observability of complex systems. Proc. Natl. Acad. Sci. USA 2013, 110, 2460–2465. [Google Scholar] [CrossRef]
- Hmelo, C.E.; Holton, D.L.; Kolodner, J.L. Designing to learn about complex systems. J. Learn. Sci. 2000, 9, 247–298. [Google Scholar] [CrossRef]
- Hmelo-Silver, C.E.; Marathe, S.; Liu, L. Fish swim, rocks sit, and lungs breathe: Expert-novice understanding of complex systems. J. Learn. Sci. 2007, 16, 307–331. [Google Scholar] [CrossRef]
- Skaržauskienė, A. Managing complexity: Systems thinking as a catalyst of the organization performance. Meas. Bus. Excell. 2010, 14, 49–64. [Google Scholar] [CrossRef]
- Sanders, R. The Pareto principle its use and abuse. J. Bus. Ind. Mark. 1988, 3, 37. [Google Scholar] [CrossRef]
- Kiremire, A.R. The application of the pareto principle in software engineering. Consult. Jan. 2011, 13, 2016. [Google Scholar]
- Teich, S.T.; Faddoul, F.F. Lean management—The journey from Toyota to healthcare. Rambam Maimonides Med. J. 2013, 4, e0007. [Google Scholar] [CrossRef]
- Vishal, P.; Bhattacharya, S. Application of the pareto principle in rapid application development model. Int. J. Eng. Technol. 2013, 5, 2649–2654. [Google Scholar]
- Ivančić, V. Improving the decision making process trought the Pareto principle application. Ekon. Misao Praksa 2014, 23, 633–656. [Google Scholar]
- Rathi, R.; Khanduja, D.; Sharma, S. Capacity waste management at automotive industry in India: A Six Sigma observation. Acounting 2016, 2, 109–116. [Google Scholar] [CrossRef]
- Izzard, S. Don’t waste your time managing change [Pareto project management process]. Eng. Manag. 2006, 16, 20–21. [Google Scholar] [CrossRef]
- Grosfeld-Nir, A.; Ronen, B.; Kozlovsky, N. The Pareto managerial principle: When does it apply? Int. J. Prod. Res. 2007, 45, 2317–2325. [Google Scholar] [CrossRef]
- Contreras, F.; Hanaki, K.; Aramaki, T.; Connors, S. Application of analytical hierarchy process to analyze stakeholders preferences for municipal solid waste management plans, Boston, USA. Resour. Conserv. Recycl. 2008, 52, 979–991. [Google Scholar] [CrossRef]
- Perera, A.; Navaratne, S. Application of Pareto principle and Fishbone diagram for Waste Management in a Powder Filling Process. Int. J. Sci. Eng. Res. 2016, 7, 181–184. [Google Scholar]
- Van de Klundert, A.; Lardinois, I. Community and private (formal and informal) sector involvement in municipal solid waste management in developing countries. WASTE Consult. Advis. Urban Environ. Dev. Nieuwehaven 1995, 201, 2801. [Google Scholar]

| Degree Centrality | Betweenness Centrality | |
|---|---|---|
| 1 | Illegal waste dumping (14) | Uncollected waste (337.5) |
| 2 | Financial capacity (13) | Waste collection efficiency (316) |
| 3 | Economy (9) | Illegal waste dumping (300) |
| 4 | Waste volume (9) | Economy (269) |
| 5 | Socio-economic class (7) | Financial capacity (268) |
| 6 | Population (6) | Workforce capacity (253) |
| 7 | Street vendors (6) | Waste data (217) |
| 8 | Workforce capacity (6) | Waste volume (210) |
| 9 | Consumption (5) | Street vendors (181) |
| 10 | Waste collection efficiency (5) | Planning and monitoring (176) |
| 11 | Waste collection frequency (5) | No engineered landfills (173.5) |
| 12 | Perceptions (5) | Waste collection pressure (170) |
| 13 | Technical capacity (5) | Waste collection frequency (135.5) |
| 14 | Waste recovery (5) | Unemployment rate (126) |
| 15 | Planning and monitoring (5) | Technical capacity (124) |
| 16 | Uncollected waste (4) | Waste collection vehicles (117) |
| 17 | Waste data (4) | Vehicles maintenance (102) |
| 18 | No engineered landfills (4) | Socio-economic class (91.5) |
| 19 | Worker strikes (4) | Vehicles breakdown (91) |
| 20 | Access control (4) | Population (90) |
| Unemployment | Cluster 2 (9) | Cluster 3 (8) |
| 11 Changes in waste consumption patterns | 34 Financial capacity | 1 Poverty |
| 3 Operation Murambatsvina | 41 Municipal expansion | 2 Urban agriculture |
| 4 Festive season | 56 Municipal capacity | 24 Receptacle availability |
| 46 Waste generation rate | 62 Loans | 30 Street vendors |
| 47 Disposable income | 64 Workforce capacity | 55 Unemployment rate |
| 5 Waste volume | 76 Corruption | 87 HIV/AIDS epidermic |
| 7 Consumption | 79 Worker strikes | 93 National informal economy |
| 72 Black access to goods and services | 80 PPE | 95 Weather |
| 73 Processed products | 81 Salaries | |
| 86 Changes in waste composition patterns | ||
| Cluster 4 (8) | Cluster 5 (7) | Cluster 6 (7) |
| 13 Waste collection efficiency | 17 Vehicles breakdown | 25 Waste management knowledge |
| 39 Economy | 18 Vehicles maintenance | 29 Perceptions |
| 54 Hyperinflation | 53 Foreign currency | 50 Planning and monitoring |
| 57 Multicurrency | 63 Waste collection vehicles | 51 Gender |
| 6 Waste collection pressure | 65 Fuel | 60 Billed properties |
| 78 Communication | 66 Fuel cost | 68 Community participation |
| 88 Cost of service provision | 67 Distance from the disposal site | 85 Strategy implementation |
| 94 National formal economy | ||
| Cluster 7 (7) | Cluster 8 (7) | Cluster 9 (6) |
| 10 Urbanization | 22 Waste burying | 19 Uncollected waste |
| 12 Socio-economic class | 26 Home ownership | 71 Illegal settlements |
| 69 Colonization | 27 Mosquito and rodent manifestation | 75 Capita city |
| 70 Travel regulations | 28 Sewer blockages | 8 Population |
| 74 Racial segregation | 31 Environmental pollution | 9 Natural population increase |
| 77 Waste collection fee | 32 Health risk | 91 Population density |
| 84 Waste transfer to poorer suburbs | 90 Illegal waste dumping | |
| Cluster 10 (6) | Cluster 11 (5) | Cluster 12 (5) |
| 20 Crude waste dumping | 21 Open waste burning | 23 Waste law enforcement |
| 33 Sanitary landfilling operations | 45 Access control | 44 Waste policy |
| 35 Technical capacity | 82 Fights | 48 Weighbridge at the dumpsite |
| 36 No engineered landfills | 89 Accidents | 49 Waste data |
| 37 Landfill equipment | 92 Dumpsite fires | 59 Research |
| 83 Sanitary formal solid waste disposal | ||
| Cluster 13 (4) | Cluster 14 (3) | Cluster 15 (3) |
| 42 Waste recovery | 38 Donor funding | 14 Waste collection frequency |
| 43 Waste separation at source | 40Political instability | 15 Harare waste collection policy |
| 58 Private companies | 52 Land reform program | 16 Suspension of waste collection services |
| 61 Recyclers |
| Key HSW Management Issues | Driver/Outcome | |
|---|---|---|
| 1 | Uncollected waste | Driver/outcome |
| 2 | Waste collection efficiency | Outcome |
| 3 | Illegal waste dumping | Outcome |
| 4 | Economy | Outcome |
| 5 | Financial capacity | Driver |
| 6 | Workforce capacity | Driver |
| 7 | Waste data | Outcome |
| 8 | Waste volume | Outcome |
| 9 | Street vendors | Driver/outcome |
| 10 | Planning and monitoring | Driver |
| 11 | No engineered landfills | Driver/outcome |
| 12 | Waste collection pressure | Driver |
| 13 | Waste collection frequency | Outcome |
| 14 | Unemployment rate | Driver |
| 15 | Technical capacity | Outcome |
| 16 | Waste collection vehicles | Outcome |
| 17 | Vehicles maintenance | Outcome |
| 18 | Socio-economic class | Driver |
| 19 | Vehicles breakdown | Driver/outcome |
| 20 | Population | Driver/outcome |
| Waste Generation | Waste Collection and Transport | Waste Disposal |
|---|---|---|
Reduce waste volume.
|
|
|
| ||
| ||
|
Publisher’s Note: MDPI stays neutral with regard to jurisdictional claims in published maps and institutional affiliations. |
© 2022 by the authors. Licensee MDPI, Basel, Switzerland. This article is an open access article distributed under the terms and conditions of the Creative Commons Attribution (CC BY) license (https://creativecommons.org/licenses/by/4.0/).
Share and Cite
Kwenda, P.R.; Lagerwall, G.; Eker, S.; van Ruijven, B. Identifying the Leverage Points in the Household Solid Waste Management System for Harare, Zimbabwe, Using Network Analysis Techniques. Sustainability 2022, 14, 12405. https://doi.org/10.3390/su141912405
Kwenda PR, Lagerwall G, Eker S, van Ruijven B. Identifying the Leverage Points in the Household Solid Waste Management System for Harare, Zimbabwe, Using Network Analysis Techniques. Sustainability. 2022; 14(19):12405. https://doi.org/10.3390/su141912405
Chicago/Turabian StyleKwenda, Phyllis Rumbidzai, Gareth Lagerwall, Sibel Eker, and Bas van Ruijven. 2022. "Identifying the Leverage Points in the Household Solid Waste Management System for Harare, Zimbabwe, Using Network Analysis Techniques" Sustainability 14, no. 19: 12405. https://doi.org/10.3390/su141912405
APA StyleKwenda, P. R., Lagerwall, G., Eker, S., & van Ruijven, B. (2022). Identifying the Leverage Points in the Household Solid Waste Management System for Harare, Zimbabwe, Using Network Analysis Techniques. Sustainability, 14(19), 12405. https://doi.org/10.3390/su141912405