You are currently viewing a new version of our website. To view the old version click .
Sustainability
  • Article
  • Open Access

26 September 2022

Effects of Food Cooperative Membership on What Consumers Buy and Where They Buy: Evidence from Korean Household Panel Data 2015–2019

Department of Food Processing and Distribution, College of Life Science, Gangneung-Wonju National University, Gangneung 25457, Korea
This article belongs to the Special Issue Recent Advances in Sustainable Food Systems—Local and Alternative Solutions for Global Challenges

Abstract

Alternative food networks (AFNs) have emerged in response to the conventional industrial food system, which distances and detaches food production from food consumption. Food cooperatives are representative of AFNs where relationships between food producers and consumers are reconfigured. This study examines household food cooperative membership and changes in food purchase behavior using household panel data gathered by the Rural Development Administration of Korea. In particular, it aims to provide insight into the effect of AFNs on consumer food purchase behavior, including expenditure per food category and visit frequency ratio per store format. The ordinary least squares regression model was used. The findings show that depending on the ownership of AFNs, expenditure per food category and visit frequency ratio per store format vary. Food cooperative members tend to purchase less processed food and more fresh vegetables and fruits than nonmembers. Moreover, food cooperative membership significantly influences the decrease in visits to small supermarkets and traditional markets when purchasing groceries.

1. Introduction

The demand for alternative food, such as organic or local produce, is increasing worldwide owing to consumers’ high expectations and desires for healthier lifestyles. Following this trend, alternative food networks (AFNs) have attracted interest from diverse countries in both the food industry and academia. AFNs are known to provide an alternative agri-food system to the conventional approach of market-driven food production, distribution, and consumption [1]. In other words, AFNs directly link producers and consumers [2] to ensure access to freshly harvested and local produce. Owing to these characteristics, some researchers have explored the potential of AFNs for food security and resilience since the COVID-19 pandemic outbreak (e.g., [3]).
Consumers join AFNs mainly because of their personal interest in accessing healthy and local food, although some seek environmental and social justice [1,4]. These networks can improve access to fresh produce [5] and may consequently contribute to consumers’ good health. Therefore, many related studies have addressed the effect of AFNs on consumers’ food-related behaviors, such as the amount of vegetables consumed. However, none of these studies examined the effect of AFNs on grocery shopping venue selection. As AFN channels mostly focus on supplying local and organic produce, unlike various goods in brick-and-mortar retailers, grocery shopping at AFNs cannot be done at a single shopping venue. Uribe et al. [6] found that shopping at a food cooperative increases the probability of purchasing organic food. This means that consumers may not purchase various types of processed food from AFNs. Moreover, most previous studies gathered data based on self-administered surveys [6,7,8,9,10,11]. Surveys are known as quick and inexpensive methods of gathering information, but errors may occur in all forms of surveys [12]. For instance, response bias, one type of respondent error, occurs when respondents consciously or unconsciously misrepresent information about themselves [12]. To fill this research gap, this study extends the scope of the study by examining the effect of AFNs not only on grocery purchase behavior but also on shopping venue selection and by using household expenditure data instead of a survey method.
To test the effect of AFNs, the research context of the “food cooperative” was selected. Among the numerous types of AFNs, food cooperatives run membership programs. To join food cooperatives, consumers should invest a certain share in the cooperative that makes them co-owners of the operation [13]. Members of the Community Supported Agriculture (CSA) also pay producers for their shares of produce but at the beginning of the season [7]. That is, CSA activity is mostly limited to a specific season when fresh produce is harvested. However, food cooperatives running without seasonality, which is similar to conventional retail grocery stores, sell not only fresh food but also processed food and nonfood products [14]. After the International Cooperative Alliance [15], cooperatives are defined as “people-centered enterprises jointly owned and democratically controlled by and for their members to realize their common economic, social and cultural needs and aspirations.” In this regard, a food cooperative is an operation in which consumers voluntarily organize themselves to obtain and distribute local and organic produce directly from producers. Therefore, members have the right to participate in major decision making (as cited in [13]).
The study analysis is twofold. I examine the effect of cooperative food membership on consumers’ (1) expenditure per food category and (2) visit frequency ratio per store format. This paper is organized as follows. Section 2 reviews AFNs and their effects on consumers purchase behavior. Section 3 presents the research methodology. Section 4 and Section 5 presents and discusses the key results.

2. Literature Reviews

2.1. Alternative Food Networks

An AFN is known to respond to conventional industrial food systems. Previous AFN research has particularly emphasized the relationship between producers and consumers [1,16]. Neulinger et al. [1] (p. 306), for instance, defined AFN as a “comprehensive concept that aims to capture new and socially innovative networks of consumers and producers in short supply chains”. These novel networks closely tie food producers and consumers spatially, economically, and socially [17].
AFNs cover a broad range of types, such as food cooperatives, farmers’ markets, and CSAs. From the perspective of producer–consumer relationships, Venn et al. [16] categorized four types of AFNs: (1) producers as consumers, (2) producer–consumer partnerships, (3) direct sell initiatives, and (4) specialist retailers. The “producer as consumers” type describes cases in which food is produced and consumed by the same group of people (e.g., a community garden). Many cases in the second type of the “producer–consumer partnership” make mutually beneficial arrangements between farmers and consumers by sharing the risks and rewards of farming. The third and fourth types relatively show weakened linkages between producers and consumers. “Direct sell initiatives” cases are about producers selling produce directly to consumers, where direct contact between the producer and consumer happens at the points of sales. In “specialist retailers” cases, producers sell their produce through online grocers and specialist wholesalers to consumers. All four types of AFNs aim to reconfigure the relationship between food producers and consumers.

2.2. Effects of Alternative Food Networks on Consumers Purchase Behavior

Previous studies have analyzed the effect of AFNs on consumers [1,6,7,8,9,10,11,18,19], but in a limited way. Although a few studies addressing AFN members tend to have psychological benefits, such as subjective well-being [1] or a need for autonomy, competency, and relatedness [20], most studies highlight physical benefits by examining the effect of AFNs on healthier food consumption patterns. Consequently, AFNs often use one of the public dietary and health improvement strategies [21,22].
Table 1 summarizes the results of previous studies on the effects of participating in AFNs on consumers’ food consumption and purchase behaviors. Most studies mentioned in Table 1 show that AFN members tend to consume vegetables more [6,7,8,10,19]. The result about other food categories, such as grain, or meat, showed mixed results [18,19]. Therefore, this study examines the effect of participating in AFNs on not only fresh food but also processed food (M1) (see Figure 1). Moreover, many of previous studies used self-administered surveys or focused group interview (FGI) methods to collect data; however, this study uses the grocery purchase receipt dataset to analyze the effect empirically. Curtis et al. [18] also used receipt data. However, the sample size was too small (only 14 participants).
Table 1. Previous studies on the effect of AFNs on consumers’ food consumption patterns.
Figure 1. Research model.
Consumers may choose a store format based on their needs when buying groceries [23]. That is, consumers may visit different types of stores in different circumstances and for different purposes. Nilssons et al. [23] described the characteristics of different types of stores: convenience stores, which are usually located in city centers, have higher prices and smaller assortments of groceries, while supermarkets offer a full line of groceries with cheaper prices, aiming to appeal to a wide range of customers. In this regard, this study analyzes the types of store formats that are members of a food cooperative substitute with visits to food cooperatives (M2) (see Figure 1).

3. Materials and Methods

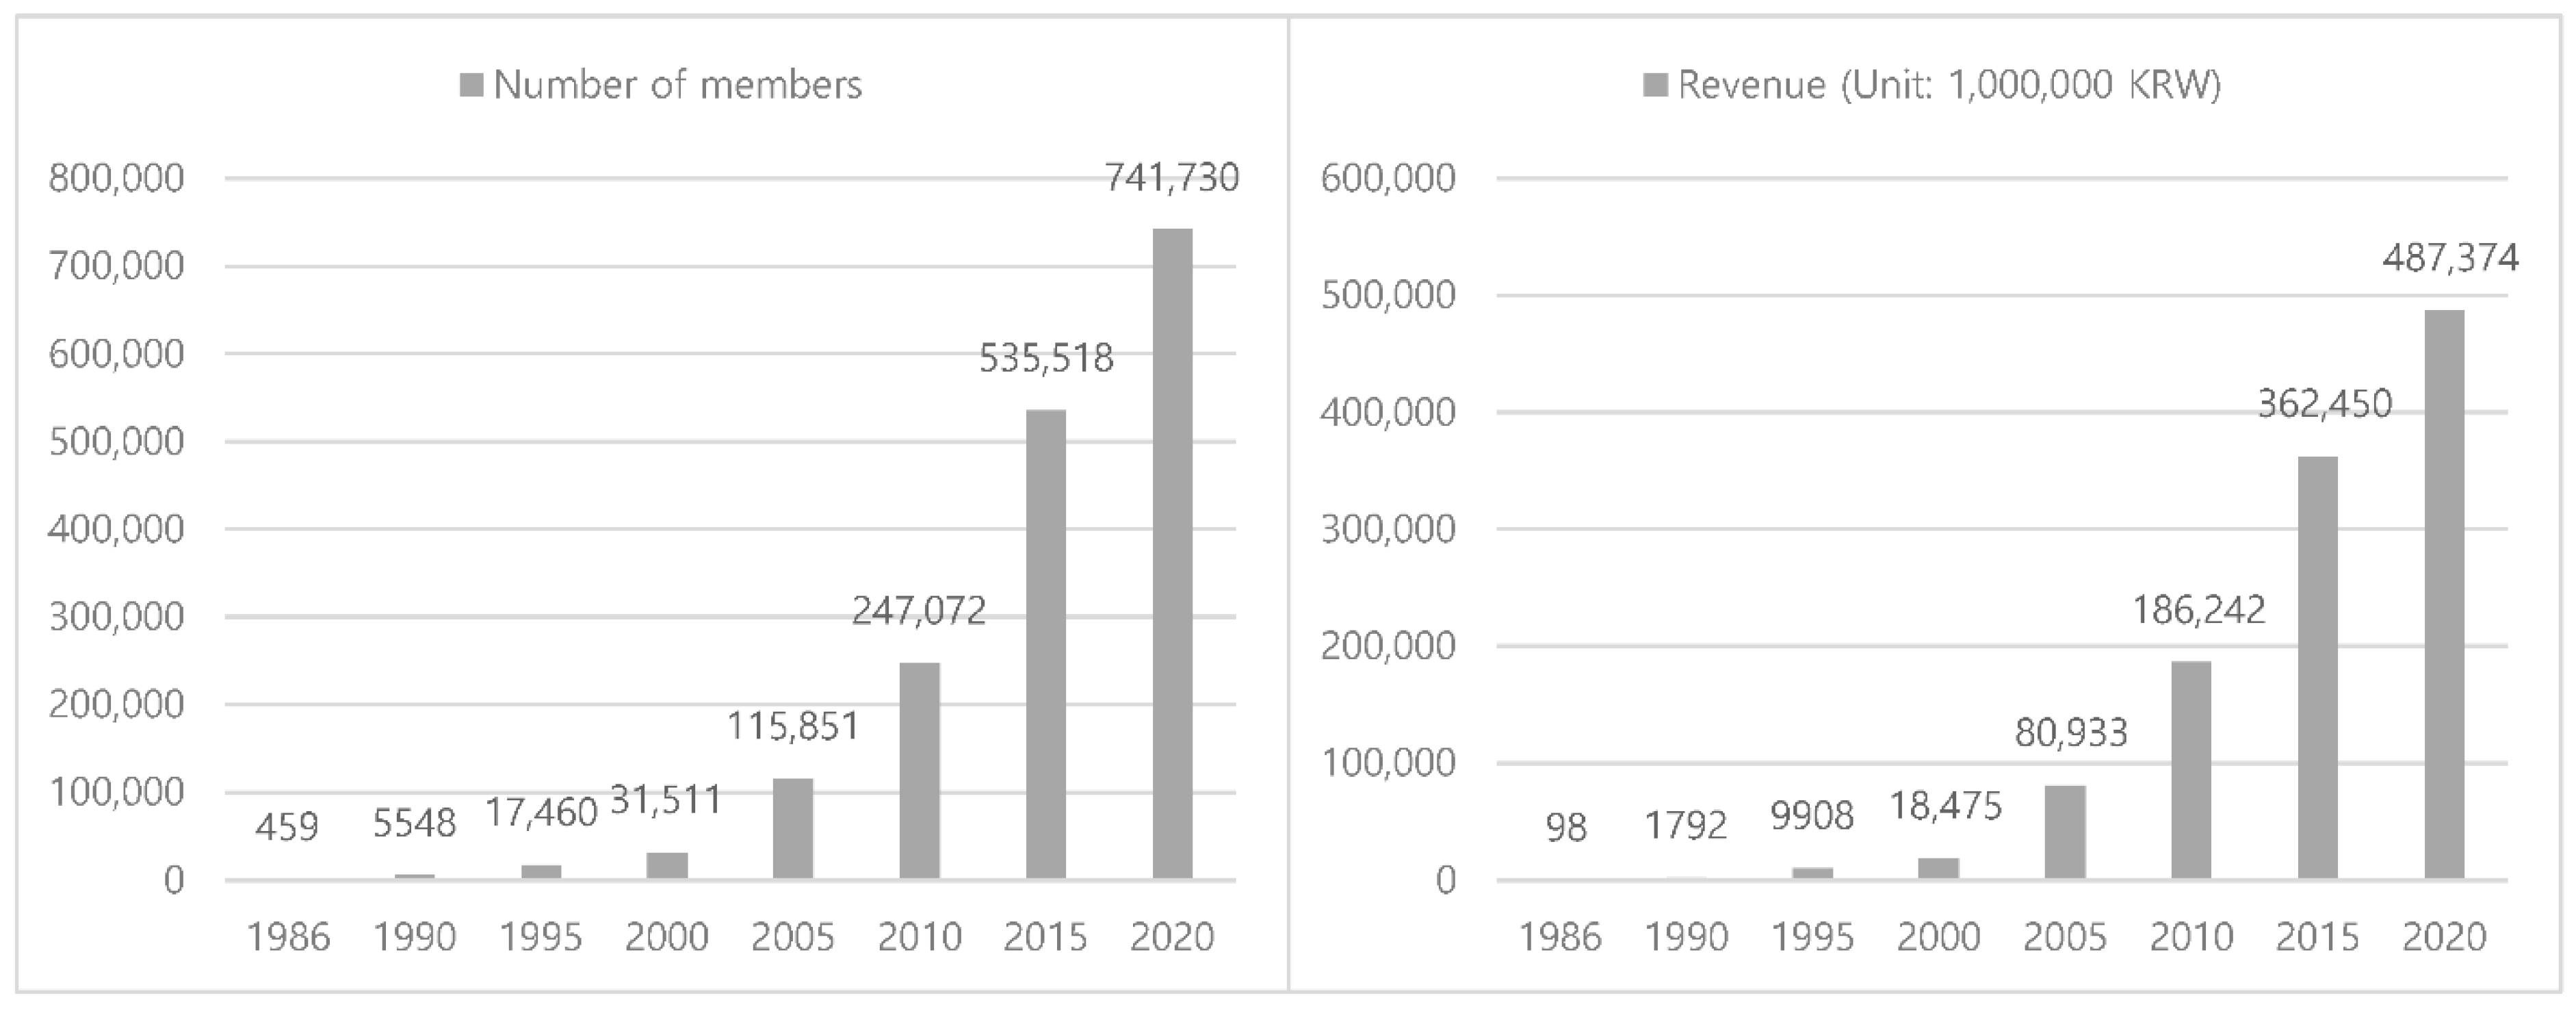
3.1. Food Cooperatives in Korea

There are three major food cooperatives in Korea: Hansalim, iCOOP, and Dure (Table 2). Similar to other food cooperatives worldwide, these Korean food cooperatives mainly sell local or organic food that is perceived as healthier. After the purchase’s initial share to join these food cooperatives, consumers may increase their share by paying 1–2% of a grocery purchase. The amount may differ by cooperative. The number of food cooperative members and revenue in Korea continues to increase. Figure 2 shows an example of Hansalim, the largest in number of members and oldest food cooperative in Korea, which drove a new phase of the Korean consumer cooperative movement in the 1980s [24].
Table 2. Status of three major food cooperatives in Korea.
Figure 2. Number of members and Revenue of Hansalim (1986–2020).

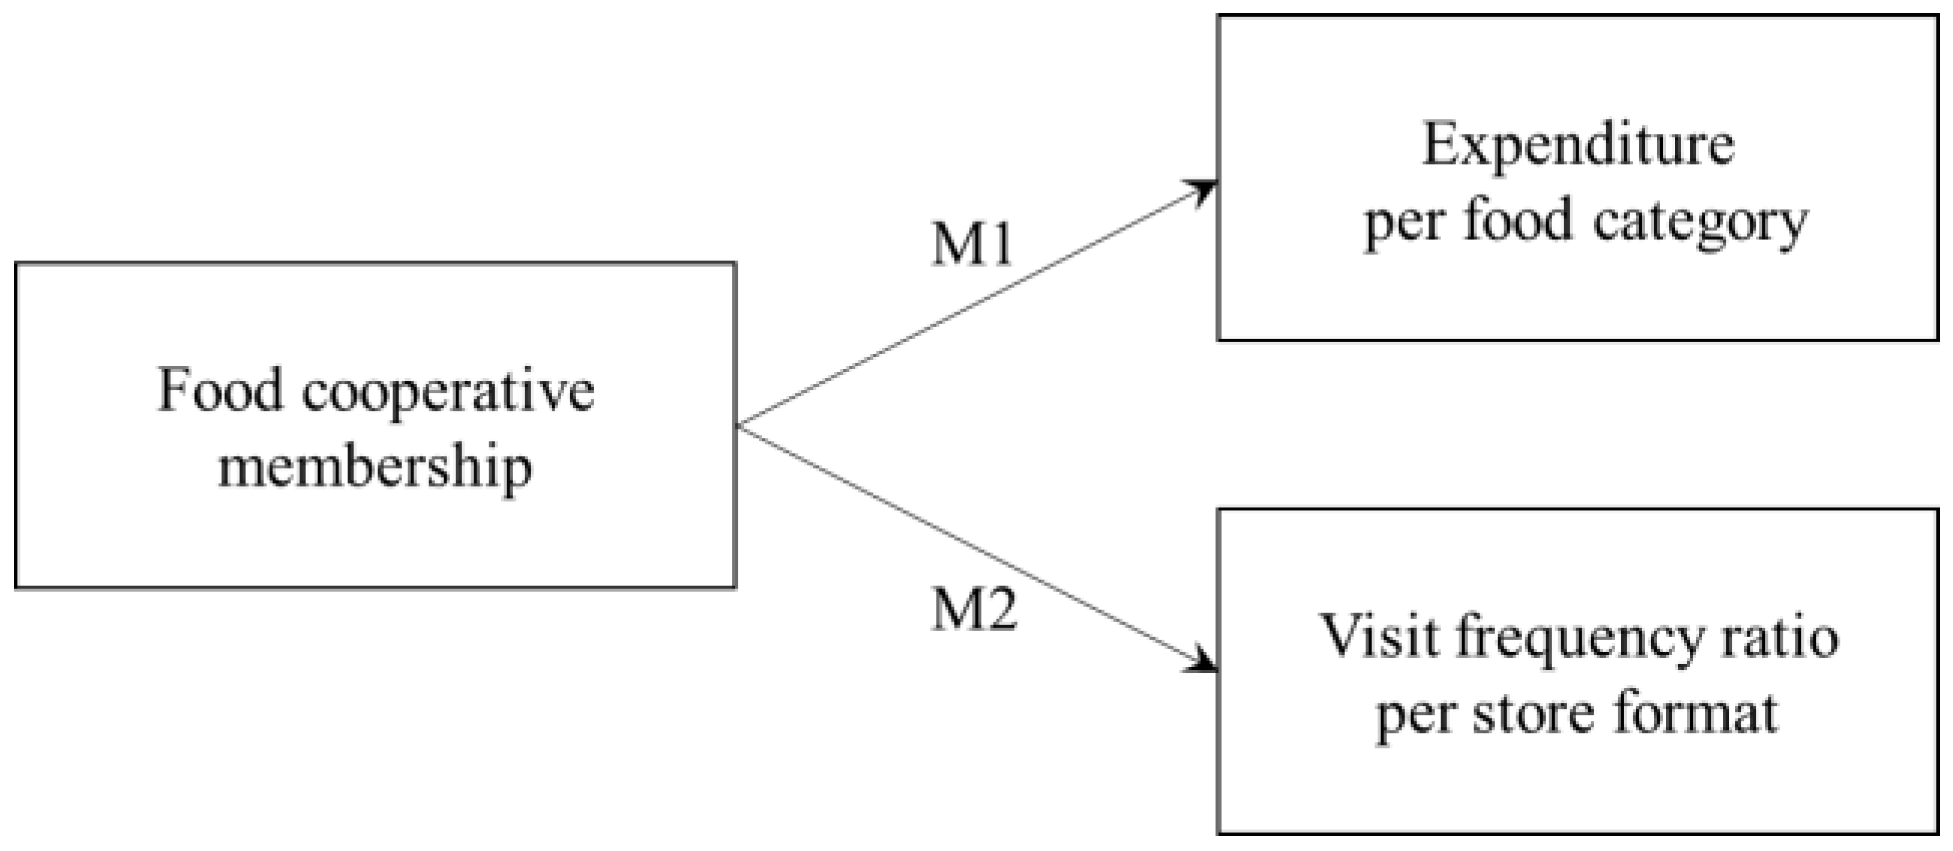
3.2. Regression Models

Two different sets of multivariate ordinary least squares (OLS) regression analyses were used to determine the extent to which food cooperative membership is related to grocery purchase behaviors while controlling for sociodemographic variables. OLS is a technique that guarantees the straight line producing the least possible total error in using independent variables to predict dependent variables [12]. I used R, version 4.0.5. The first regression model set (M1) analyzes the effect of food cooperative membership on expenditure per food category, while the second regression model set (M2) examines the effect on visit frequency per store format.
  • M1: Y i = β 0 + β 1 M E + β 2 A G + β 3 F M + β 4 E X + β 5 I C + ε ;
  • M2: Y j = β 0 + β 1 M E + β 2 A G + β 3 F M + β 4 E X + β 5 I C + ε .
  • Yi: Expenditure on food category i
  • Yj: Visit frequency ratio of grocery store format j
  • ME: Food cooperative membership (Yes or No)
  • AG: Age
  • FM: Family size
  • EX: Annual grocery expenditure
  • IC: Monthly income for household

3.3. Data

This study uses household panel data from 2015 to 2019 collected by the Rural Development Administration (RDA) of Korea. The RDA of Korea randomly selected households using a stratified sampling method. This sampling method is “a probability sampling procedure in which simple random subsamples that are more or less equal on some characteristics are drawn from within each stratum of the population” [12] (p. 397). The RDA of Korea selected households from the Seoul capital area in 2010 and expanded to metro cities in 2015. The primary food purchaser in a household attaches grocery receipts to account books and sends them monthly to the RDA of Korea. From receipt data, we may know the product name, category, price, and date on which it was bought. This dataset covers not only the daily grocery expenditure records of 1040 households, but also their socio-demographic information, such as age, family size, and monthly household income. In conclusion, as we discarded four observations with zero or outliers for monthly income per household, data for 1036 households were used in this study. Table 3 provides the descriptive statistics of the study variables.
Table 3. Descriptive statistics of the study variables.

3.3.1. Dependent Variable: Expenditure Per Food Category (M1)

The dependent variable of the first regression model set (M1), expenditure per food category, was aggregated into one figure per food category to further match with sociodemographic information and membership status. Two food categories, processed food (M1-1) and fresh food (M1-2), were used. I further divided the fresh food category into five sub-categories within the fresh food category: grain (M1-3), vegetables (M1-4), fruits (M1-5), seafood (M1-6), and meat (M1-7). I summed the expenditures for each category from 2015 to 2019. In total, seven linear regressions were conducted, with seven food categories as the dependent variables.

3.3.2. Dependent Variable: Visit Frequency Ratio Per Store Format (M2)

The household panel dataset contains the names of the purchase places. Therefore, all food expenditures in the data can be tracked to the formats in which they were purchased, allowing us to examine the potential relationship between visit frequency and store formats. To evaluate the visit frequency ratio per store format (1), the dependent variable of the second regression model set (M2), grocery stores were classified into five store formats according to previous research [23,28]: large supermarkets, small supermarkets, traditional markets, convenience stores, and online grocery shops. As this study aimed to assess the effect of food cooperative membership on other types of grocery store visits, food cooperative visit frequency was included only in the total grocery store visit frequency. In total, five linear regressions were conducted, with five store types as the dependent variables.
Y j = N u m b e r   o f   v i s i t s   t o   g r o c e r y   s t o r e   f o r m a t   j   f r o m   2015   t o   2019 N u m b e r   o f   v i s i t s   t o   w h o l e   g r o c e r y   s t o r e   f r o m   2015   t o   2019  

3.3.3. Explanatory Variable: Food Cooperative Membership

Food cooperative membership, the main independent variable, was coded as a member (1) if the panel had at least one purchase record and as a nonmember (0) if there was no purchase record between 2015 and 2019 in a food cooperative store format. Three major food cooperatives in Korea—Hansalim, iCOOP, and Dure—were included.

3.3.4. Explanatory Variable: Sociodemographic Variables

Sociodemographic variables, such as age, family size, annual grocery expenditures, and monthly household income were controlled. We did not use consumers’ sex as an independent variable as 95.2% (n = 986) of the samples were women. Women are often considered the primary food purchasers in households (as cited in [6]); therefore, the dataset used in this study represents reality well enough.

4. Results

4.1. Food Cooperative Membership and Expenditure Per Food Category

Cooperative food membership was a significant predictor of both processed and fresh food expenditures (Table 4). Consumers with a food cooperative membership tended to purchase less processed food and more fresh food than nonmembers (p < 0.05). While younger, with bigger family size and less income, primary food purchasers tended to purchase more processed food, older, with smaller family size and more income, consumers tended to purchase fresh food. Consumers with higher expenditures on food tended to spend on both processed and fresh food.
Table 4. Standardized regression coefficients with processed food expenditure and fresh food expenditure as dependent variables (M1).
Among fresh food, food cooperative membership only positively affected vegetable (p < 0.05) and fruit (p < 0.01) expenditure rather than grain, seafood, and meat expenditure. Consumers with smaller family sizes tended to purchase more vegetables, fruits, and seafood (p < 0.001). Consumers with higher incomes tended to purchase more fruits (p < 0.10) and meat (p < 0.001), but fewer vegetables (p < 0.05). These results reflect those of other research on AFNs membership, with an increase in fruits and vegetables and a decrease in processed food. However, no effect on other categories of fresh food, including grain, seafood, and meat, was found. This is due to mixed subcategories within grain and meat: refined grain vs. whole grain and red meat vs. white meat. Following Kim et al. [29], the refined grain and red meat diets increase glucose and insulin responses, which are related to pancreatic stress and type 2 diabetes. Food cooperative membership does not affect seafood expenditure due to Koreans’ preference for seafood. Seafood is considered a heathy food globally. For instance, the seafood menu is included in the Mediterranean diet, which is considered one of the heathy diets in many Western countries [30]. However, in Korea, a preference for fish has developed and endured over time. Korea is one of the few countries where fish provide more than 100 calories per capita per day, while it is only about 35 calories on average in other countries [31].

4.2. Food Cooperative Membership and Grocery Store Format

Table 5 shows the effect of cooperative food membership on the visit frequency ratio per grocery store format. Having cooperative food membership tended to decrease the visit frequency ratio in smaller supermarkets (p < 0.10) and traditional markets (p < 0.05).
Table 5. Standardized regression coefficients with small supermarket, large supermarket, traditional market, convenience store, and online grocery shop visit frequency ratio as dependent variables (M2).
Younger primary food purchasers tended to increase the ratio of visits to large supermarkets, convenience stores, and online grocery shops, while older consumers tended to increase the traditional market visit ratio for grocery shopping. Consumers with large family sizes tended to buy more in small supermarkets and less in large supermarkets, convenience stores, and online grocery shops. Households with higher incomes tended to visit large supermarkets and visit fewer small supermarkets and traditional markets.

5. Discussion

The results show that the AFN participants purchase less processed food and more fresh food. Specifically, among fresh foods, they purchase more vegetables and fruits. This finding is consistent with that of previous studies: an increase in the consumption of vegetables and fruits [6,7,8,10,19] and a decrease in the consumption of processed food [11]. However, we used a household panel’s grocery purchase receipt data whereas most previous studies used surveys or FGIs.
Moreover, this study provides the preliminary results of a study exploring members of AFNs’ grocery shopping channel choices. This study is among the first to examine the effect of AFN membership on the choice of grocery shopping channels. Being a member of a food cooperative means that the member changes their grocery-shopping venue. AFN members buy less in small supermarkets and traditional markets. This result shows the substitution of food cooperatives for small supermarkets and traditional markets. Compared to large supermarkets, small supermarkets are usually situated near consumers’ residences, similar to food cooperatives in Korea. The traditional market has characteristics similar to those of food cooperatives, where linkages between farmers and consumers are more significant in other store formats. However, bigger supermarkets, convenience stores, and online grocery shops offer different benefits compared to food cooperatives.
The limitations of this study provide guidance for future research. First, this study examined only one type of AFN: food cooperatives. To generalize the results regarding the effect of AFNs on consumers, future research should include other types of AFNs, such as direct-sell initiatives or specialist retailers. The strength of the linkage between producers and consumers may differ by type. Therefore, we may compare the effects of AFNs based on the strength of the linkage. Second, the dataset used in this study covers only 2015 to 2019. Future studies should extend the scope of the study to see the role of AFNs in the COVID-19 era, as Atalan-Helicke et al. [3] addressed by comparing before 2019 and after 2020. Third, fresh grain and meat are mixed subcategories in terms of a heathy diet. For instance, the consumption of refined grain and red meat is related to some chronic diseases [29]. To see the effect of food cooperatives on grocery expenditure clearly, refined grain and whole grain, and red meat and white meat should be divided. Lastly, this study is also limited in that it considers only the food industry. Most food cooperatives sell not only food but also nonfood products [14]. Future studies on the effects of food cooperative membership across various industries and from an intercultural perspective would be highly relevant.

Funding

This paper was supported by research funds for newly appointed professors of Gangneung-Wonju National University in 2019.

Data Availability Statement

Data was obtained from Rural Development Administration of Korea and are not publicly available.

Conflicts of Interest

The author declares no conflict of interest.

References

  1. Neulinger, A.; Bársony, F.; Gjorevska, N.; Lazányi, O.; Pataki, G.; Takács, S.; Török, A. Engagement and subjective well-being in alternative food networks: The case of Hungary. Int. J. Consum. Stud. 2020, 44, 306–315. [Google Scholar] [CrossRef]
  2. Dong, H.; Campbell, B.; Rabinowitz, A.N. Factors impacting producer marketing through community supported agriculture. PLoS ONE 2019, 14, e0219498. [Google Scholar] [CrossRef] [PubMed]
  3. Atalan-Helicke, N.; Abiral, B. Alternative food distribution networks, resilience, and urban food security in Turkey during the COVID-19 pandemic. J. Agric. Food Syst. Commun. Dev. 2021, 10, 89–104. [Google Scholar]
  4. Migliore, G.; Romeo, P.; Testa, R.; Schifani, G. Beyond alternative food networks: Understanding motivations to participate in Orti Urbani in Palermo. Cult. Agric. Food Environ. 2019, 41, 129–139. [Google Scholar] [CrossRef]
  5. Zepeda, L.; Leviten-Reid, C. Consumers’ views on local food. J. Food Distrib. Res. 2004, 35, 6. [Google Scholar]
  6. Uribe, A.L.M.; Winham, D.M.; Wharton, C.M. Community supported agriculture membership in Arizona. An exploratory study of food and sustainability behaviours. Appetite 2012, 59, 431–436. [Google Scholar] [CrossRef] [PubMed]
  7. Perez, J.; Allen, P.; Brown, M. Community Supported Agriculture on the Central Coast: The CSA Member Experience; Research Brief; The Center of Agroecology and Sustainable Food System: Santa Cruz, CA, USA, 2003. [Google Scholar]
  8. Allen IV, J.E.; Rossi, J.; Woods, T.A.; Davis, A.F. Do community supported agriculture programmes encourage change to food lifestyle behaviours and health outcomes? New evidence from shareholders. Int. J. Agric. Sustain. 2017, 15, 70–82. [Google Scholar] [CrossRef]
  9. Lee, S.-H.; Song, G.-H. The Preference Analysis on Environmentally Friendly Agricultural Products in Consumers’ Cooperatives. J. Korean Reg. Econ. 2011, 20, 101–115. [Google Scholar]
  10. Mihrshahi, S.; Partridge, S.R.; Zheng, X.; Ramachandran, D.; Chia, D.; Boylan, S.; Chau, J.Y. Food co-operatives: A potential community-based strategy to improve fruit and vegetable intake in Australia. Int. J. Environ. Res. Public Health 2020, 17, 4154. [Google Scholar] [CrossRef] [PubMed]
  11. Wilkins, J.L. Seasonality, food origin, and food preference: A comparison between food cooperative members and nonmembers. J. Nutr. Educ. 1996, 28, 329–337. [Google Scholar] [CrossRef]
  12. Zikmund, W.G.; Babin, B.J.; Carr, J.C.; Griffin, M. Business Research Methods, 9th ed.; South-Western Cengage Learning: Toronto, ON, Canada, 2013. [Google Scholar]
  13. Zoll, F.; Specht, K.; Opitz, I.; Siebert, R.; Piorr, A.; Zasada, I. Individual choice or collective action? Exploring consumer motives for participating in alternative food networks. Int. J. Consum. Stud. 2018, 42, 101–110. [Google Scholar] [CrossRef]
  14. Chang, J. Hansalim Organic Cooperative—A Best Practice Model of Direct Sales Between Farmers and Consumers. In Proceedings of the IFOAM Organic World Congress 2014, Istanbul, Turkey, 13–15 October 2014. [Google Scholar]
  15. International Cooperative Alliance. Available online: https://www.ica.coop/en (accessed on 21 August 2022).
  16. Venn, L.; Kneafsey, M.; Holloway, L.; Cox, R.; Dowler, E.; Tuomainen, H. Researching European ‘alternative’ food networks: Some methodological considerations. Area 2006, 38, 248–258. [Google Scholar] [CrossRef]
  17. Goodman, D.; Goodman, M.K. Food network, Alternative. In International Encyclopedia of Human Geography, 2nd ed.; Kobayashi, A., Ed.; Elsevier: Amsterdam, The Netherlands, 2019; pp. 175–185. [Google Scholar]
  18. Curtis, K.R.; Allen, K.; Ward, R.A. Food consumption, attitude, and behavioral change among CSA members: A northern Utah case study. J. Food Distrib. Res. 2015, 46, 3–16. [Google Scholar]
  19. Russell, W.S.; Zepeda, L. The adaptive consumer: Shifting attitudes, behavior change and CSA membership renewal. Renew. Agric. Food Syst. 2008, 23, 136–148. [Google Scholar] [CrossRef]
  20. Zepeda, L.; Reznickova, A.; Russell, W.S. CSA membership and psychological needs fulfillment: An application of self-determination theory. Agric. Hum. Values 2013, 30, 605–614. [Google Scholar] [CrossRef]
  21. Sharma, S.V.; Markham, C.; Chow, J.; Ranjit, N.; Pomeroy, M.; Raber, M. Evaluating a school-based fruit and vegetable co-op in low-income children: A quasi-experimental study. Prev. Med. 2016, 91, 8–17. [Google Scholar] [CrossRef] [PubMed]
  22. Vasquez, A.; Sherwood, N.E.; Larson, N.; Story, M. Community-supported agriculture as a dietary and health improvement strategy: A narrative review. J. Acad. Nutr. Diet. 2017, 117, 83–94. [Google Scholar] [CrossRef] [PubMed]
  23. Nilsson, E.; Gärling, T.; Marell, A.; Nordvall, A.C. Who shops groceries where and how? The relationship between choice of store format and type of grocery shopping. Int. Rev. Retail Distrib. Consum. Res. 2015, 25, 1–19. [Google Scholar] [CrossRef]
  24. Jang, S. The Management of Consumer Co-Operatives in Korea: Identity, Participation and Sustainability; Routledge: New York, NY, USA, 2020; pp. 1–14. [Google Scholar]
  25. Hansalim 2021 Annual Report. Available online: http://www.hansalim.or.kr/?p=56558 (accessed on 21 August 2022).
  26. iCOOP 2021 Annual Report. Available online: http://sapenet.net/reports_ko (accessed on 21 August 2022).
  27. Dure 2021 Annual Report. Available online: http://dure-coop.or.kr/bbs/board.php?bo_table=B04 (accessed on 21 August 2022).
  28. Black, C.; Ntani, G.; Inskip, H.; Cooper, C.; Cummins, S.; Moon, G.; Baird, J. Measuring the healthfulness of food retail stores: Variations by store type and neighbourhood deprivation. Int. J. Behav. Nutr. Phys. Act. 2014, 11, 69. [Google Scholar] [CrossRef] [PubMed]
  29. Kim, Y.; Keogh, J.B.; Clifton, P.M. Differential Effects of Red Meat/Refined Grain Diet and Dairy/Chicken/Nuts/Whole Grain Diet on Glucose, Insulin and Triglyceride in a Randomized Crossover Study. Nutrients 2016, 8, 687. [Google Scholar] [CrossRef] [PubMed]
  30. Mediterranean Diet for Heart Health. Available online: https://www.mayoclinic.org/healthy-lifestyle/nutrition-and-healthy-eating/in-depth/mediterranean-diet/art-20047801 (accessed on 15 September 2022).
  31. FAO. The State of World Fisheries and Aquaculture 2020; Food and Agriculture Organization of the United Nations: Rome, Italy, 2020; Available online: https://www.fao.org/documents/card/en/c/ca9229en/ (accessed on 16 September 2022).
Publisher’s Note: MDPI stays neutral with regard to jurisdictional claims in published maps and institutional affiliations.

Article Metrics

Citations

Article Access Statistics

Multiple requests from the same IP address are counted as one view.