Article

Durability Assessment Method of Hollow Thin-Walled Bridge Piers under Rockfall Impact Based on Damage Response Surface

1
College of Civil Engineering, Longdong University, Qingyang 745000, China
2
Provincial Key Laboratory of Engineering Properties and Applications of Loess in Colleges and Universities of Gansu Province, Qingyang 745000, China
3
School of Civil Engineering, Central South University, Changsha 410075, China
*
Author to whom correspondence should be addressed.
Sustainability 2022, 14(19), 12196; https://doi.org/10.3390/su141912196
Submission received: 25 August 2022 / Revised: 20 September 2022 / Accepted: 22 September 2022 / Published: 26 September 2022

Abstract

:
Continuous rigid-frame bridges across valleys are often at risk of rockfalls caused by heavy rainfalls, earthquakes, and debris flow in a mountainous environment. Hollow thin-walled bridge piers (HTWBP) in valleys are exposed to the threat of impact from accidental rockfalls. In the current research, ANSYS/LS-DYNA is used to establish a high-precision rockfall-HTWBP model. The rockfall-HTWBP model is verified against a scaled impact test performed in previously published research. A mesh independence test is also performed to obtain an appropriate mesh size. Based on the rockfall-HTWBP model, the impact force, damage, and dynamic response characteristics of HTWBP under a rockfall impact are studied. In addition, a damage assessment criterion is proposed, based on the response surface model, combined with the central composite design method and Box–Behnken design method. The main conclusions are as follows: (1) the impact force of the rockfall has a substantial impulse characteristic, and the duration of the impulse load is approximately 0.01 s. (2) The impacted surface of the pier is dominated by the final elliptic damage, with conical and strip damage areas as the symmetry axis. The cross-sectional damage mode is from compression failure in the impact area and shear failure at the corner. (3) The maximum displacement occurs in the middle height of the pier. The maximum displacement increases with impact height, impact velocity, and rockfall diameter and decreases with the uniaxial compressive strength of the concrete. (4) The initial impact velocity and diameter of the rockfall are the most significant parameters affecting the damage indices. In addition, a damage assessment method, with a damage zoning diagram based on the response surface method, is established for the fast assessment of the damage level of impacted HTWBP.

1. Introduction

China is a mountainous country. With the continuous improvement of transportation infrastructure and the resulting construction, the number of large-span bridges across valleys has gradually increased. Owing to the complex terrain and extreme weather in mountain valleys, bridges across valleys are often at risk of rockfalls caused by heavy rainfall, earthquakes, and debris flows [1,2]. Being impacted by rockfalls is not uncommon for bridges. For example, in Wenchuan County, Sichuan Province, in China, due to seismic action and days of heavy rain, a bridge pier was impacted by rockfalls, causing its collapse. In the accident, the national highway was interrupted, three people were killed, and seven vehicles were damaged. Figure 1 shows the field photo of the bridge pier impacted by rockfalls [1]. A continuous rigid frame bridge is an important transportation infrastructure across the valleys. The pier is generally designed as a hollow thin-walled bridge pier (HTWBP) to save materials and reduce costs. HTWBPs in valleys are exposed to the threat of impact from accidental rockfalls.
Given the high cost of full-scale tests, only a few scholars have conducted full-scale tests on the impact resistance of bridge piers. Consolazio et al. used a combination of full-scale ship impact tests and numerical analysis to quantify the impact load, pier response, and soil response during a barge–pier collision [3]. Buth et al. conducted two collisions between a truck-type tractor-trailer, weighing 80,000 pounds, and a full-length bridge pier at an impact speed of 80 km/h [4]. In the first test, a frontal collision between the vehicle and the bridge pier was performed, and in the second test, an eccentric distance between the vehicle and the bridge pier was observed. Compared with full-scale tests, numerical simulation is more popular in research into the impact resistance of bridge piers under rockfall impacts [2,5,6]. For example, Bertrand et al. analyzed the reliability of reinforced concrete members under rockfall impacts and proposed a simply supported reinforced concrete member model, considering material nonlinearity and contact nonlinearity [7]. Ventura et al. studied the local structural dynamic response of steel members under the impact of rockfalls [8]. A new flexible contact model was proposed for the interaction between the target body and the impact body. Zhang et al. studied impact force, the dynamic response of the bridge, and the deformation of the track structure when a collision happens between a rockfall and a bridge pier [2]. In addition, rockfall and vehicle collision problems have some similarities. Many researchers have tried to understand the impact performance of bridge piers under vehicle impacts [9,10,11,12]. However, the main research object of the above studies is a solid concrete pier; the rockfall impact resistance of the HTWBP has not been reported. Considering the wide engineering applications of HTWBP in China, investigating the impact resistance of HTWBP under rockfall loads is particularly necessary.
When the bridge pier is impacted by rockfalls, the impact’s effects damage the bridge pier. The pier is the main supporting and force transmission component of a bridge. The rockfall’s impact on bridge piers may lead to the collapse of the bridge, resulting in immeasurable serious consequences. Therefore, evaluating the damage to a bridge pier after rockfall impacts has practical importance. Commonly used damage assessment criteria include the maximum displacement criterion, residual bearing capacity criterion, and maximum bearing angle criterion [13,14]. The maximum displacement criterion and the maximum bearing angle criterion usually assume that the pier is mainly affected by bending or shear damage, whereas the residual bearing capacity criterion mainly considers the axial bearing capacity decay of the pier. However, due to the large differences in the height, diameter, strength, and other characteristics of the different impacted piers, the velocity and stiffness of the impactor, and the strong randomness of the impact position, an impacted pier usually presents a mixed damage mode, consisting of bending, shear, and local compression stresses. Therefore, a damage assessment criterion considering the mixed types of damage to the bridge pier, which will be convenient for the accurate, fast assessment of bridge pier damage, needs to be proposed.
In the current paper, ANSYS/LS-DYNA is used to establish a high-precision rockfall-HTWBP model, which is verified by a drop weight test. Then, the impact force, damage, and dynamic response characteristics of HTWBP under a rockfall impact are studied. Finally, a damage assessment method, with a damage zoning diagram based on the response surface method, is established.

2. Rockfall-HTWBP Impact Model

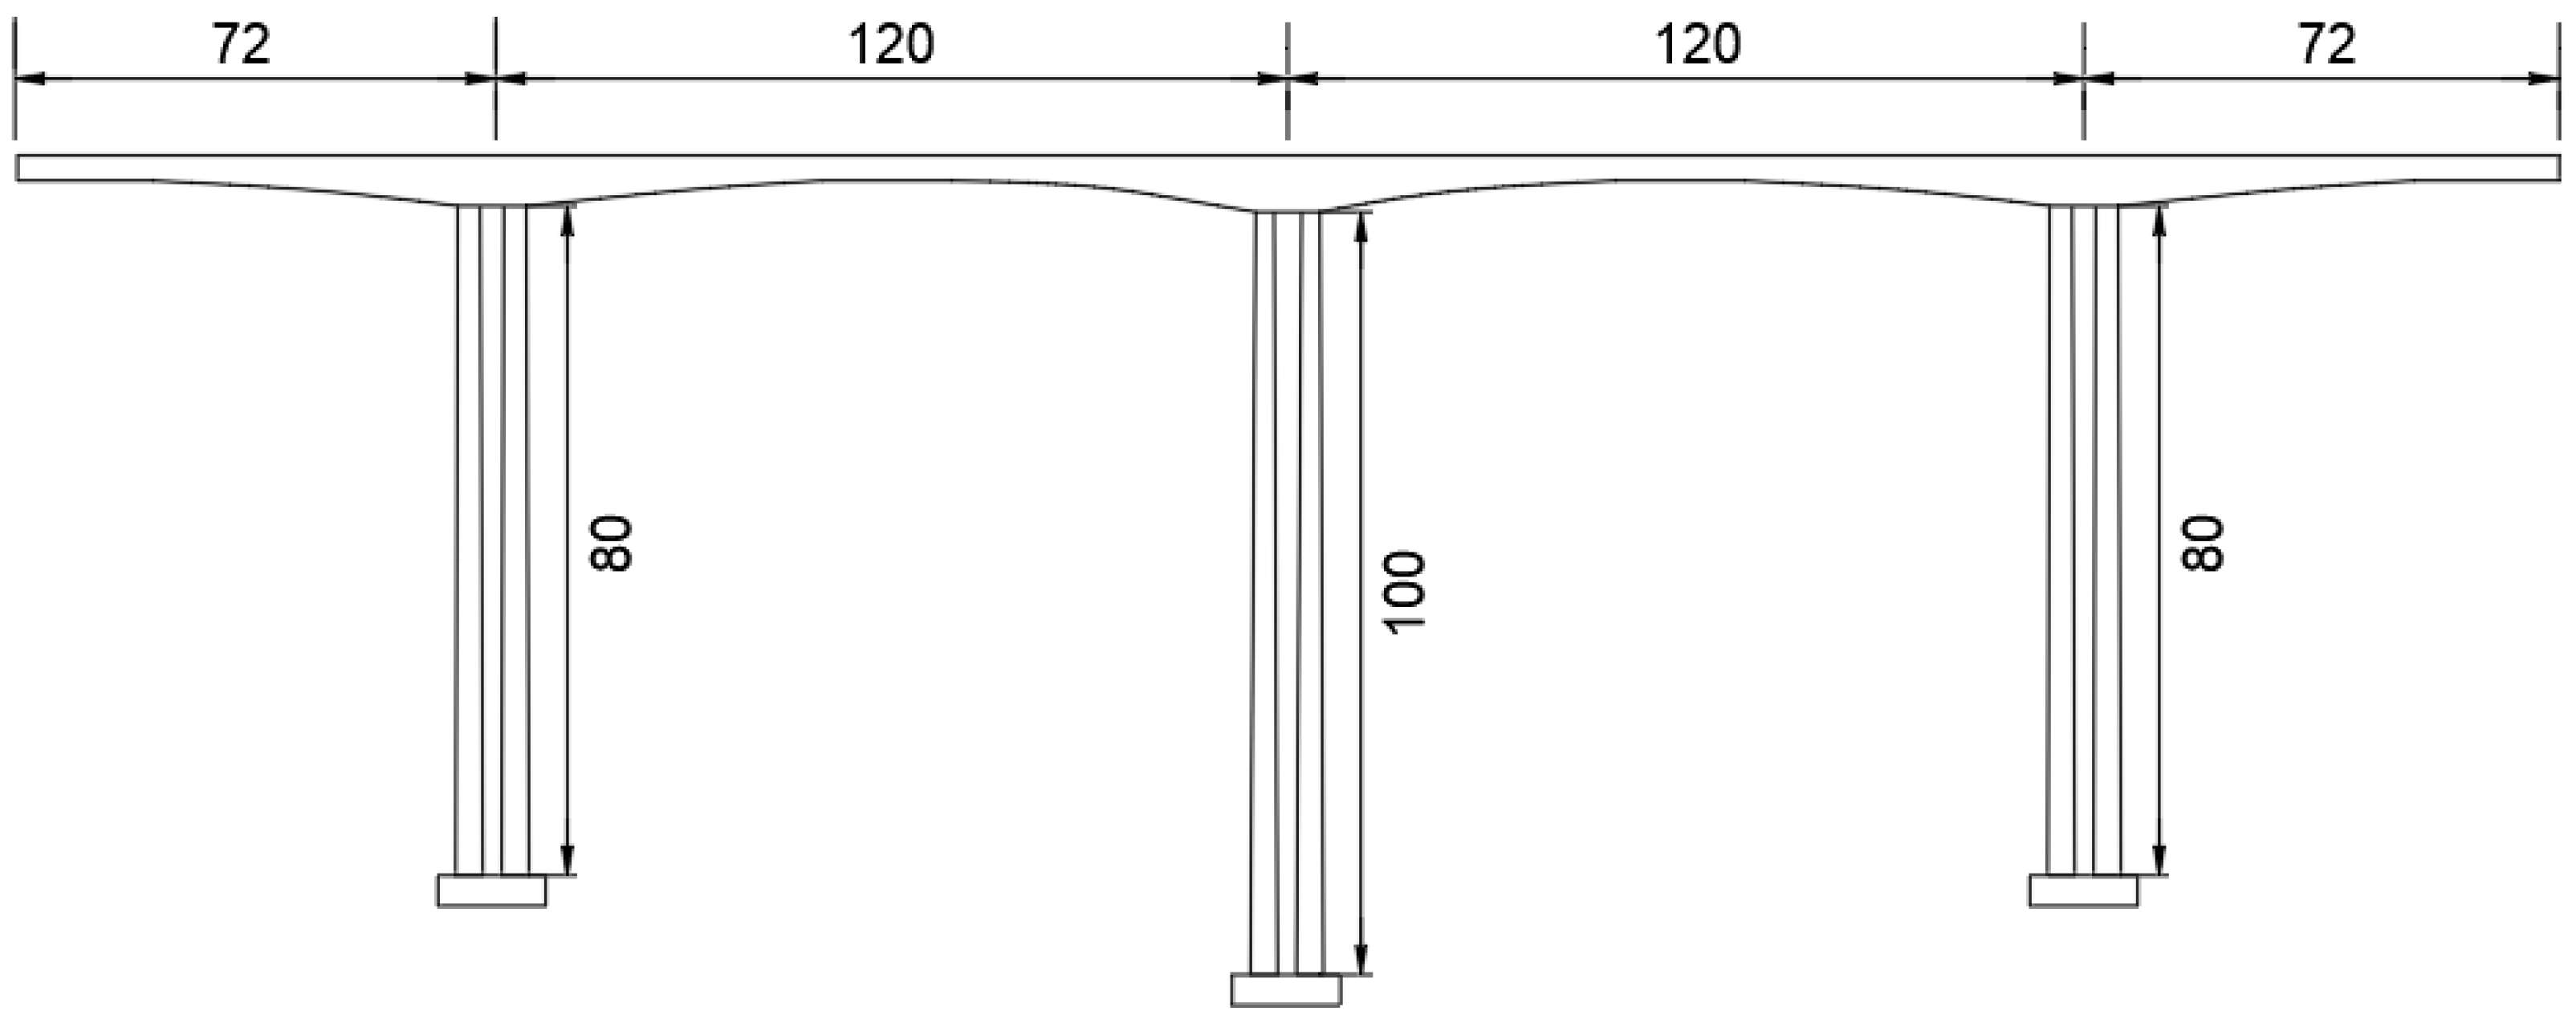
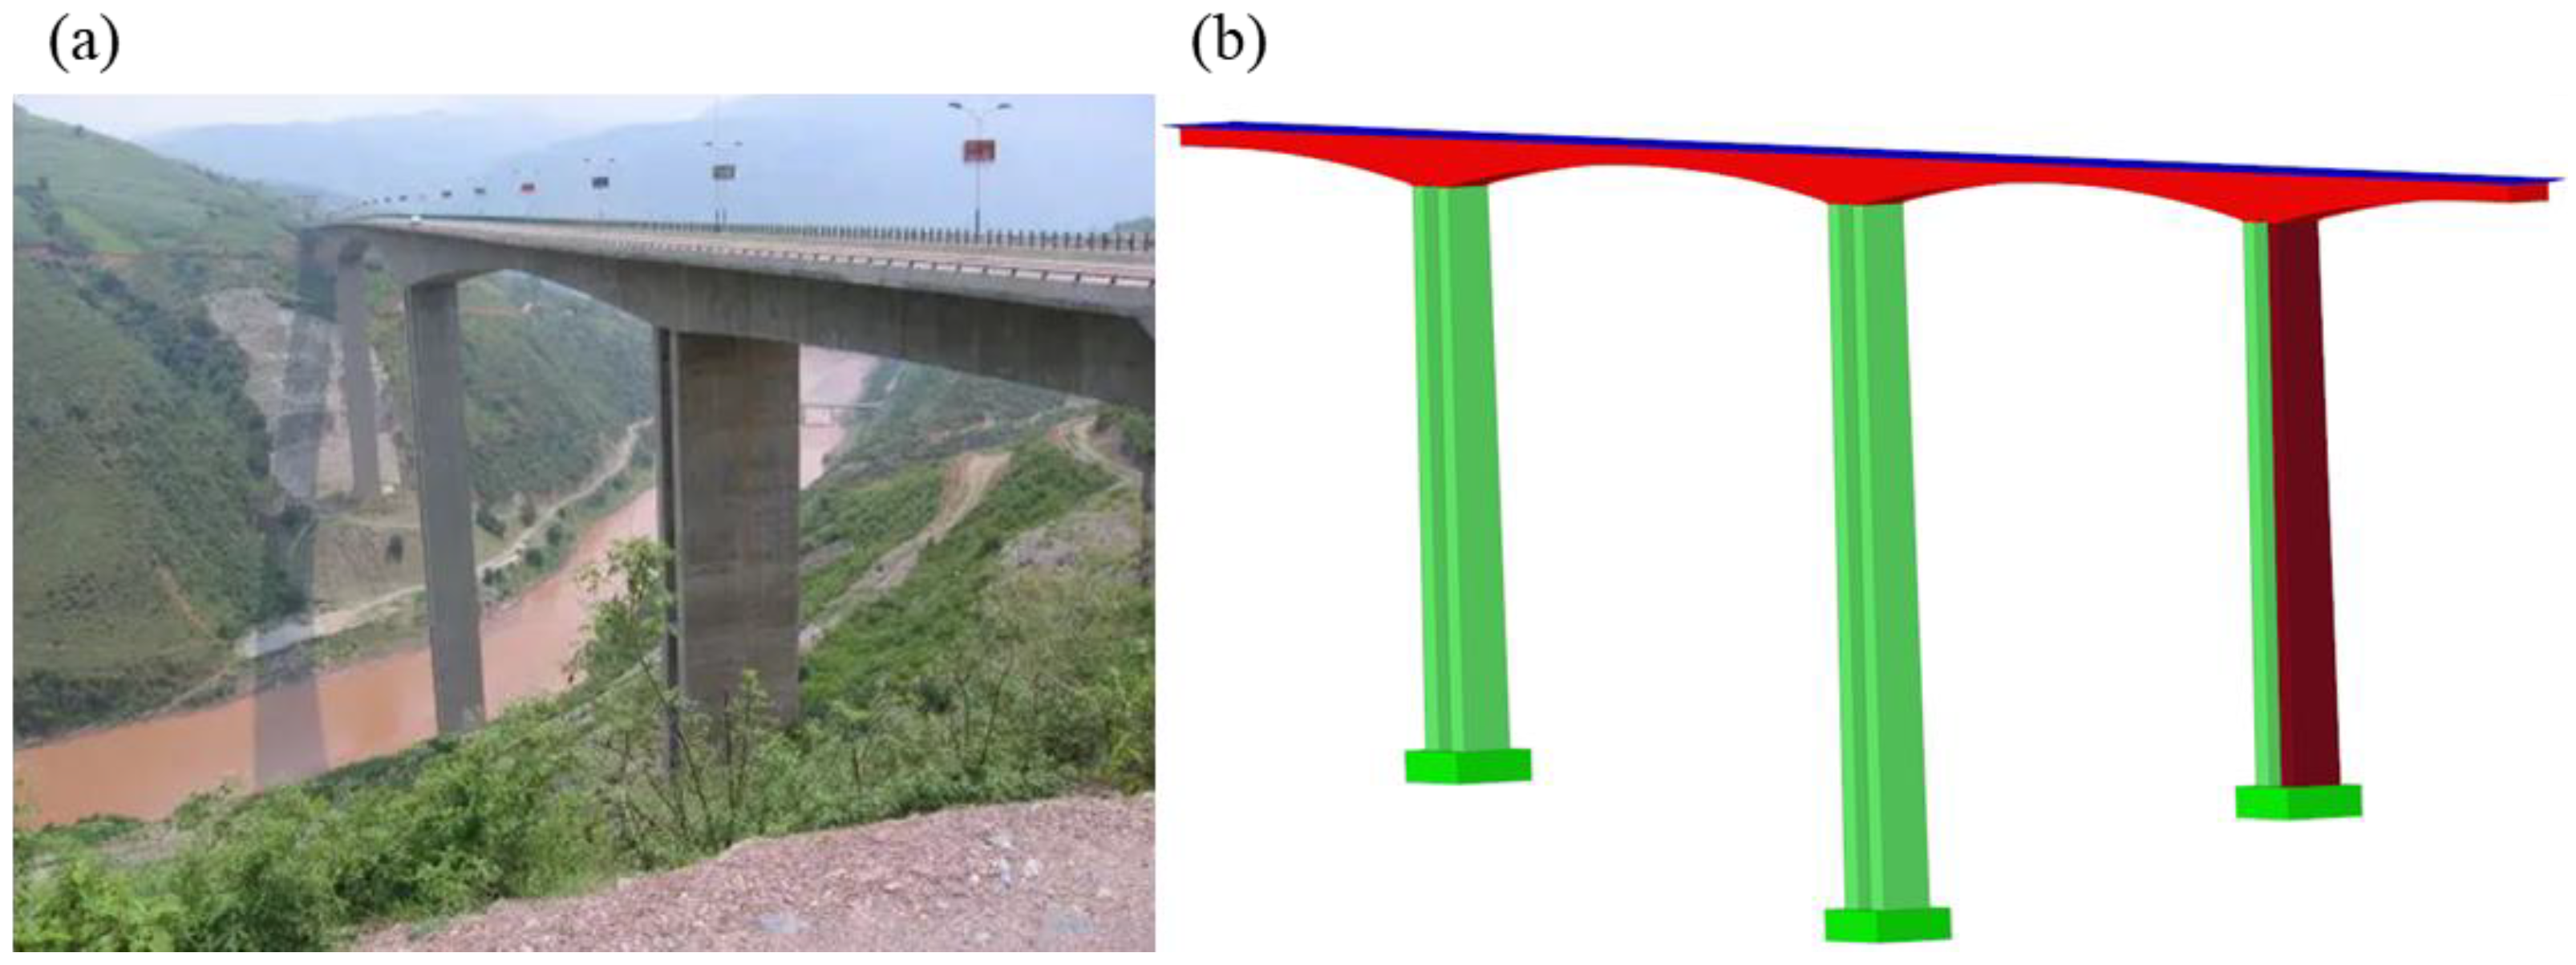
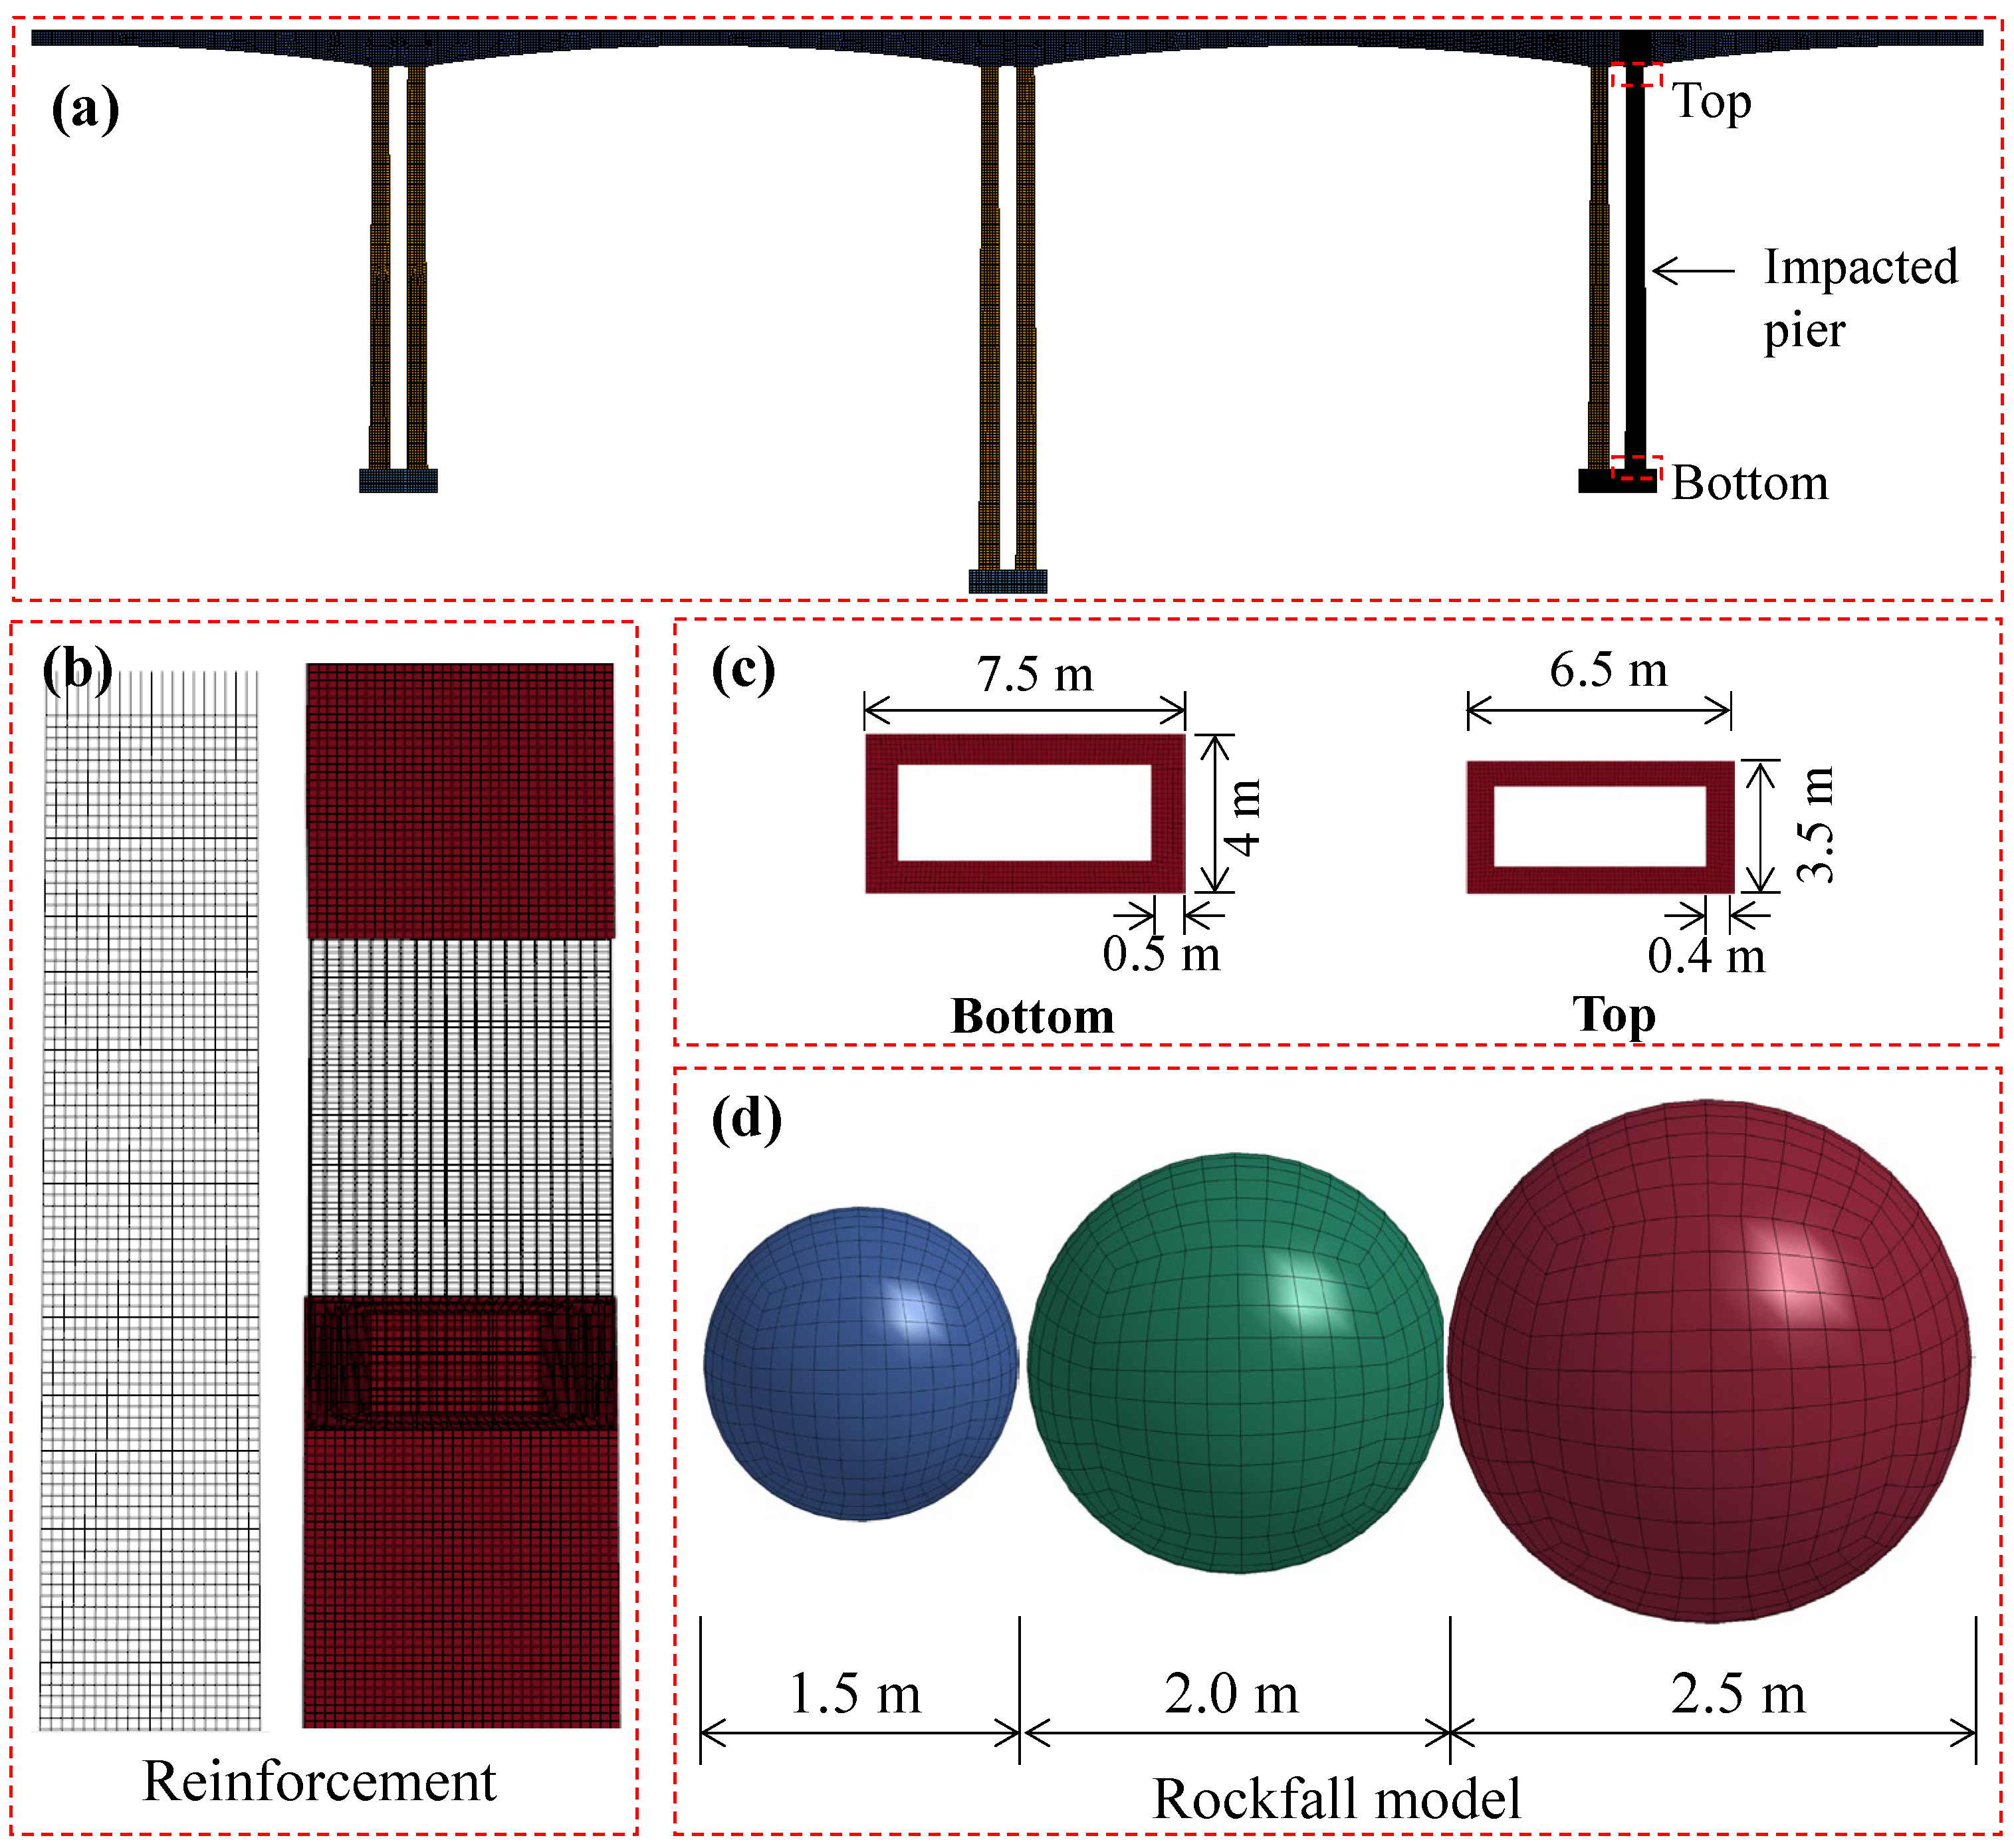
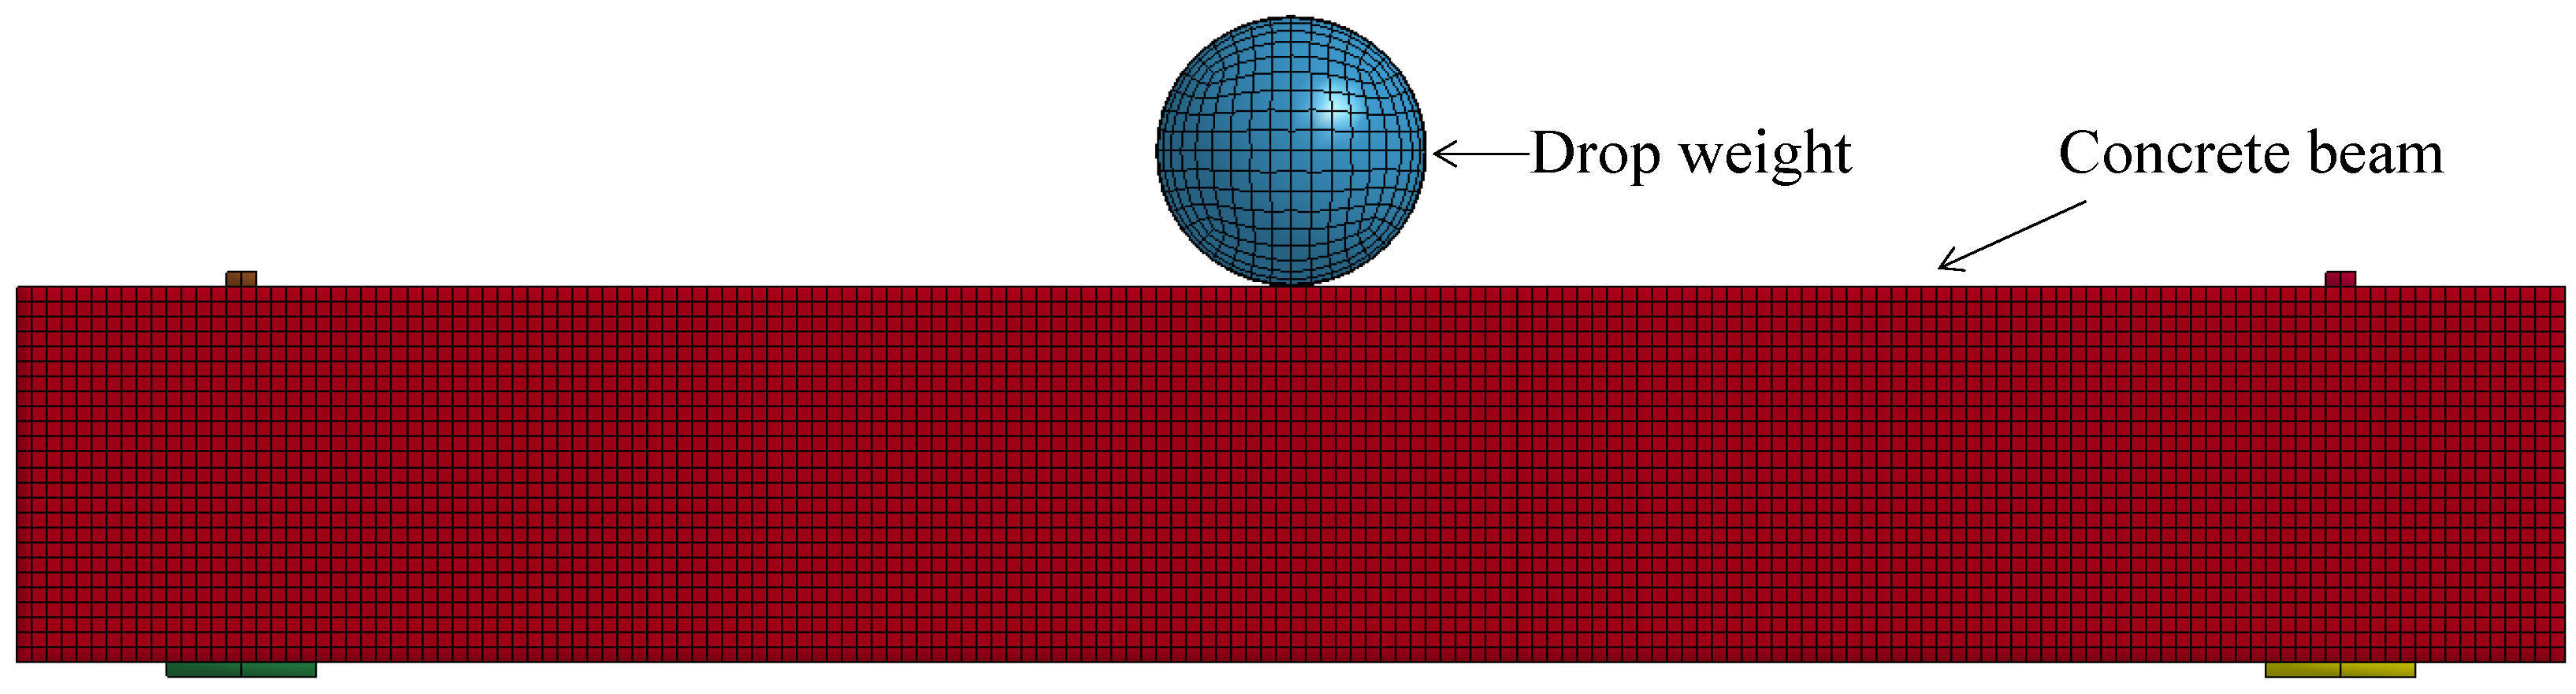
2.1. FE Model of the Bridge and Rockfall

A 72 + 120 + 120 + 72 m continuous rigid frame bridge on the highway from Longshan to Yongshun in Hunan Province, China has been taken as the research object. This bridge was chosen as the object of this study for two reasons: (1) this bridge is located in southern China, i.e., a mountainous region where rockfall disasters happen frequently; (2) continuous rigid frame bridges with a highest pier height of approximately 100 m are normally chosen as the research prototype [15,16]. The bridge layout is shown in Figure 2. The cross-section of the bridge pier comprises a single box and a single chamber section. The superstructure of the bridge is supported by HTWBPs; the middle pier is 100 m high and the side pier is 80 m high. Based on a continuous rigid-frame bridge, a geometric model is established using the HyperMesh program (www.altair.com), as shown in Figure 3. The size of rockfall is widely distributed. As reported by a previous study [1], the diameter of rockfalls is normally 1.5 m to 2.5 m; three rockfall models with different diameters, i.e., 1.5 m, 2.0 m, and 2.5 m, are established in this research.
After the geometric model is established, the HyperMesh program is utilized to mesh the model. The bridge pier, cap, and superstructure are simulated using the Solid element, which is an eight-node element with one integral point. The longitudinal and transverse reinforcements in the pier are simulated using the Hughes–Liu beam element with one integral point. The concrete is assumed to be fully bonded to the reinforcements and is implemented by the keywords *CONSTRAINED_LAGRANGE_IN_SOLID [2,17]. The effect of the superstructure is considered by using the keywords *LOAD_BODY_Z. *CONTROL_DYNAMIC_RELAXATION, with a convergence factor of 0.0001, and is adopted to achieve static equilibrium before impact. To improve the calculation efficiency, the grid of the impacted bridge pier is encrypted with a grid size of 50 mm. The grid size of the other piers is 100 mm, and the grid size of reinforcements in the pier is 100 mm. The grid size of the bridge superstructure and pier cap are 300 and 200 mm, respectively. The reinforcement is composed of 26 longitudinal reinforcement bars with a diameter of 30 mm and transverse reinforcement bars with a diameter of 16 mm and a spacing of 150 mm. The element types used for each component of the bridge and the dimensions of the grid are summarized in Table 1. The detailed finite element (FE) model of the bridge is shown in Figure 4a. The total grid number of the rock-HTWBP model is approximately 8,000,000. Considering that the pile–soil interaction has a limited influence on the impact resistance of the bridge, the bottom of the cap is set as a fixed boundary without considering the effect of the pile and the soil [1]. The impact between the rockfall and HTWBP is achieved by the automatic surface-surface contact variable (*AUTO_CONTACT_SURFACE_TO_SURFACE).

2.2. Material Model

The LS-DYNA software provides a variety of material models for use with concrete materials [18]. The most commonly constitutive models used to simulate concrete materials in engineering applications are as follows: MAT_111 (Johnson Holmquist concrete model), MAT_72R3 (concrete damage REL3 model), MAT_96 (concrete brittle damage model), and MAT_159 (continuous surface cap model, or CSCM). CSCM is normally used in the simulation of concrete components subjected to impact and blast loads [11,19]. The uniaxial compressive strength of concrete is 30, 40, and 50 MPa; the corresponding material parameters are automatically generated by the CSCM in LS-DYNA. The CSCM uses the cap formula to describe the compaction of concrete materials. When the calculated stress is outside the yield surface, the plasticity algorithm is used to restore the stress state to the yield surface. Hardening and strain rate effects are also incorporated into the CSCM material model. Concrete materials are also pressure-related materials. According to the elastic-plastic theory, the general form of the yield failure equation is:
f ( J 1 , J 2 , J 3 ) = 0
where J 1 is the first stress tensor invariant; J 2 is the second stress tensor invariant; J 3 is the third stress tensor invariant.
The yield function of the CSCM is expressed by:
f ( J 1 , J 2 , β , κ ) = J 2 2 ( β ) F f 2 ( J 1 ) F C ( J 1 , κ )
where F f 2 ( J 1 ) represents the shear failure surface; F C ( J 1 , κ ) is the hardening cap; κ is the hardening parameter; J 2 is the second deviatoric stress invariant; ( β ) is the reduction factor.
The reinforcements are simulated using *MAT_PLASTIC_KINEMATIC, i.e., a bilinear elastic–plastic model [20]. This model is an elastic–plastic, strain-hardening, and strain-rate-hardening model. This material model measures the initial yield stress using two factors: the strain factor and the strain rate factor. The yield stress can be written as follows.
σ y = [ 1 + ( ε ˙ C ) ( 1 p ) ] ( σ 0 + β E p ε e f f p )
where σ 0 is the initial yield stress of reinforcement under static load; β is the strain hardening parameter; ε e f f p is the effective plastic strain; ε ˙ is the strain rate; p and C are strain rate parameters; E p is the plastic hardening modulus of reinforcement, which is represented by the elastic modulus E and the tangent elastic modulus E t a n , as shown in Equation (4):
E p = E t a n E E E t a n
According to the failure strain criterion, when the strain of the longitudinal bars and stirrups reaches a certain strain threshold ( ε f ), the longitudinal bars and stirrups represent failure. The failure strain of longitudinal reinforcement and the stirrup is set as 0.25 and 0.20, respectively [1]. The rigid material (*MAT_RIGID) is selected for the rockfalls because the damage caused by rockfalls is not the focus of the analysis [1]. To simplify the calculation, the rockfall is simulated by a sphere, which has been widely used in previous studies [1]. According to extensive on-site investigation in previous studies, granites are most frequently found in rockfall accidents [21,22]. Hence, the rockfall was assumed to be granite with a gravity of 2.5–3.0 g/cm3 [1]. Moreover, previous studies found that the rockfall only appears with slightly less damage compared with the concrete pier [21,22]. Therefore, the rockfall is regarded as a rigid material and the material parameters are listed in Table 2.

2.3. Verification

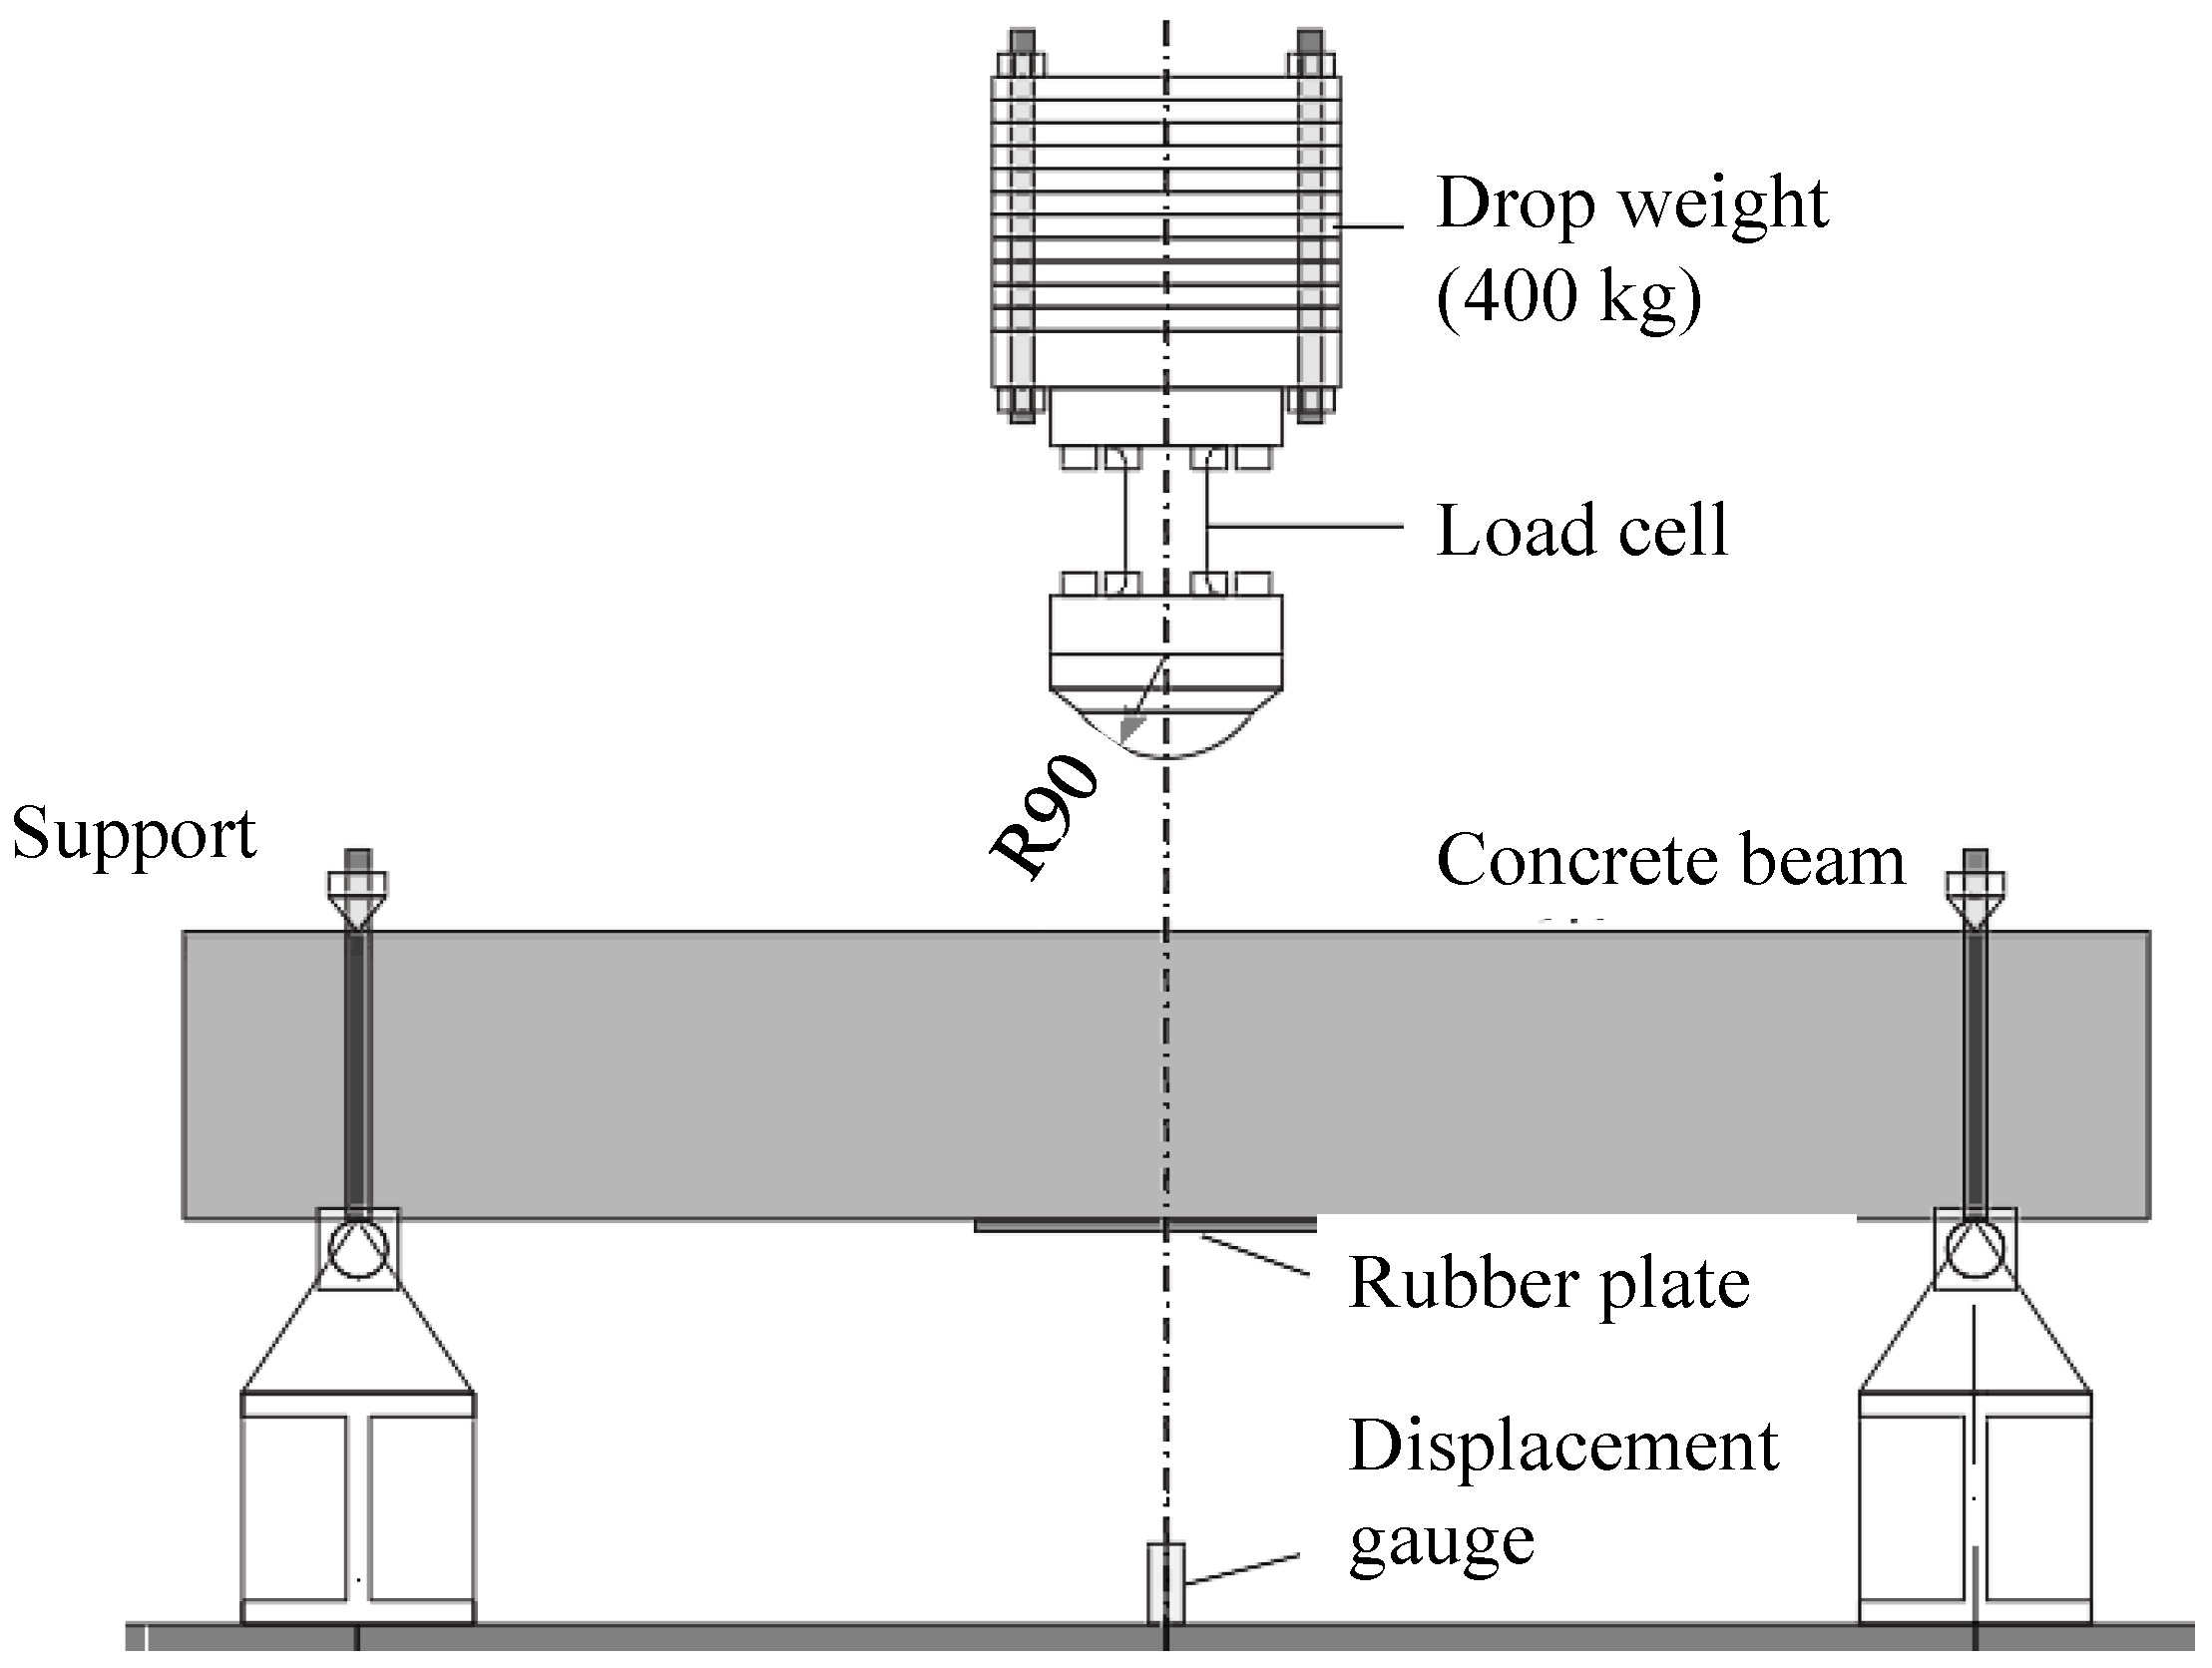
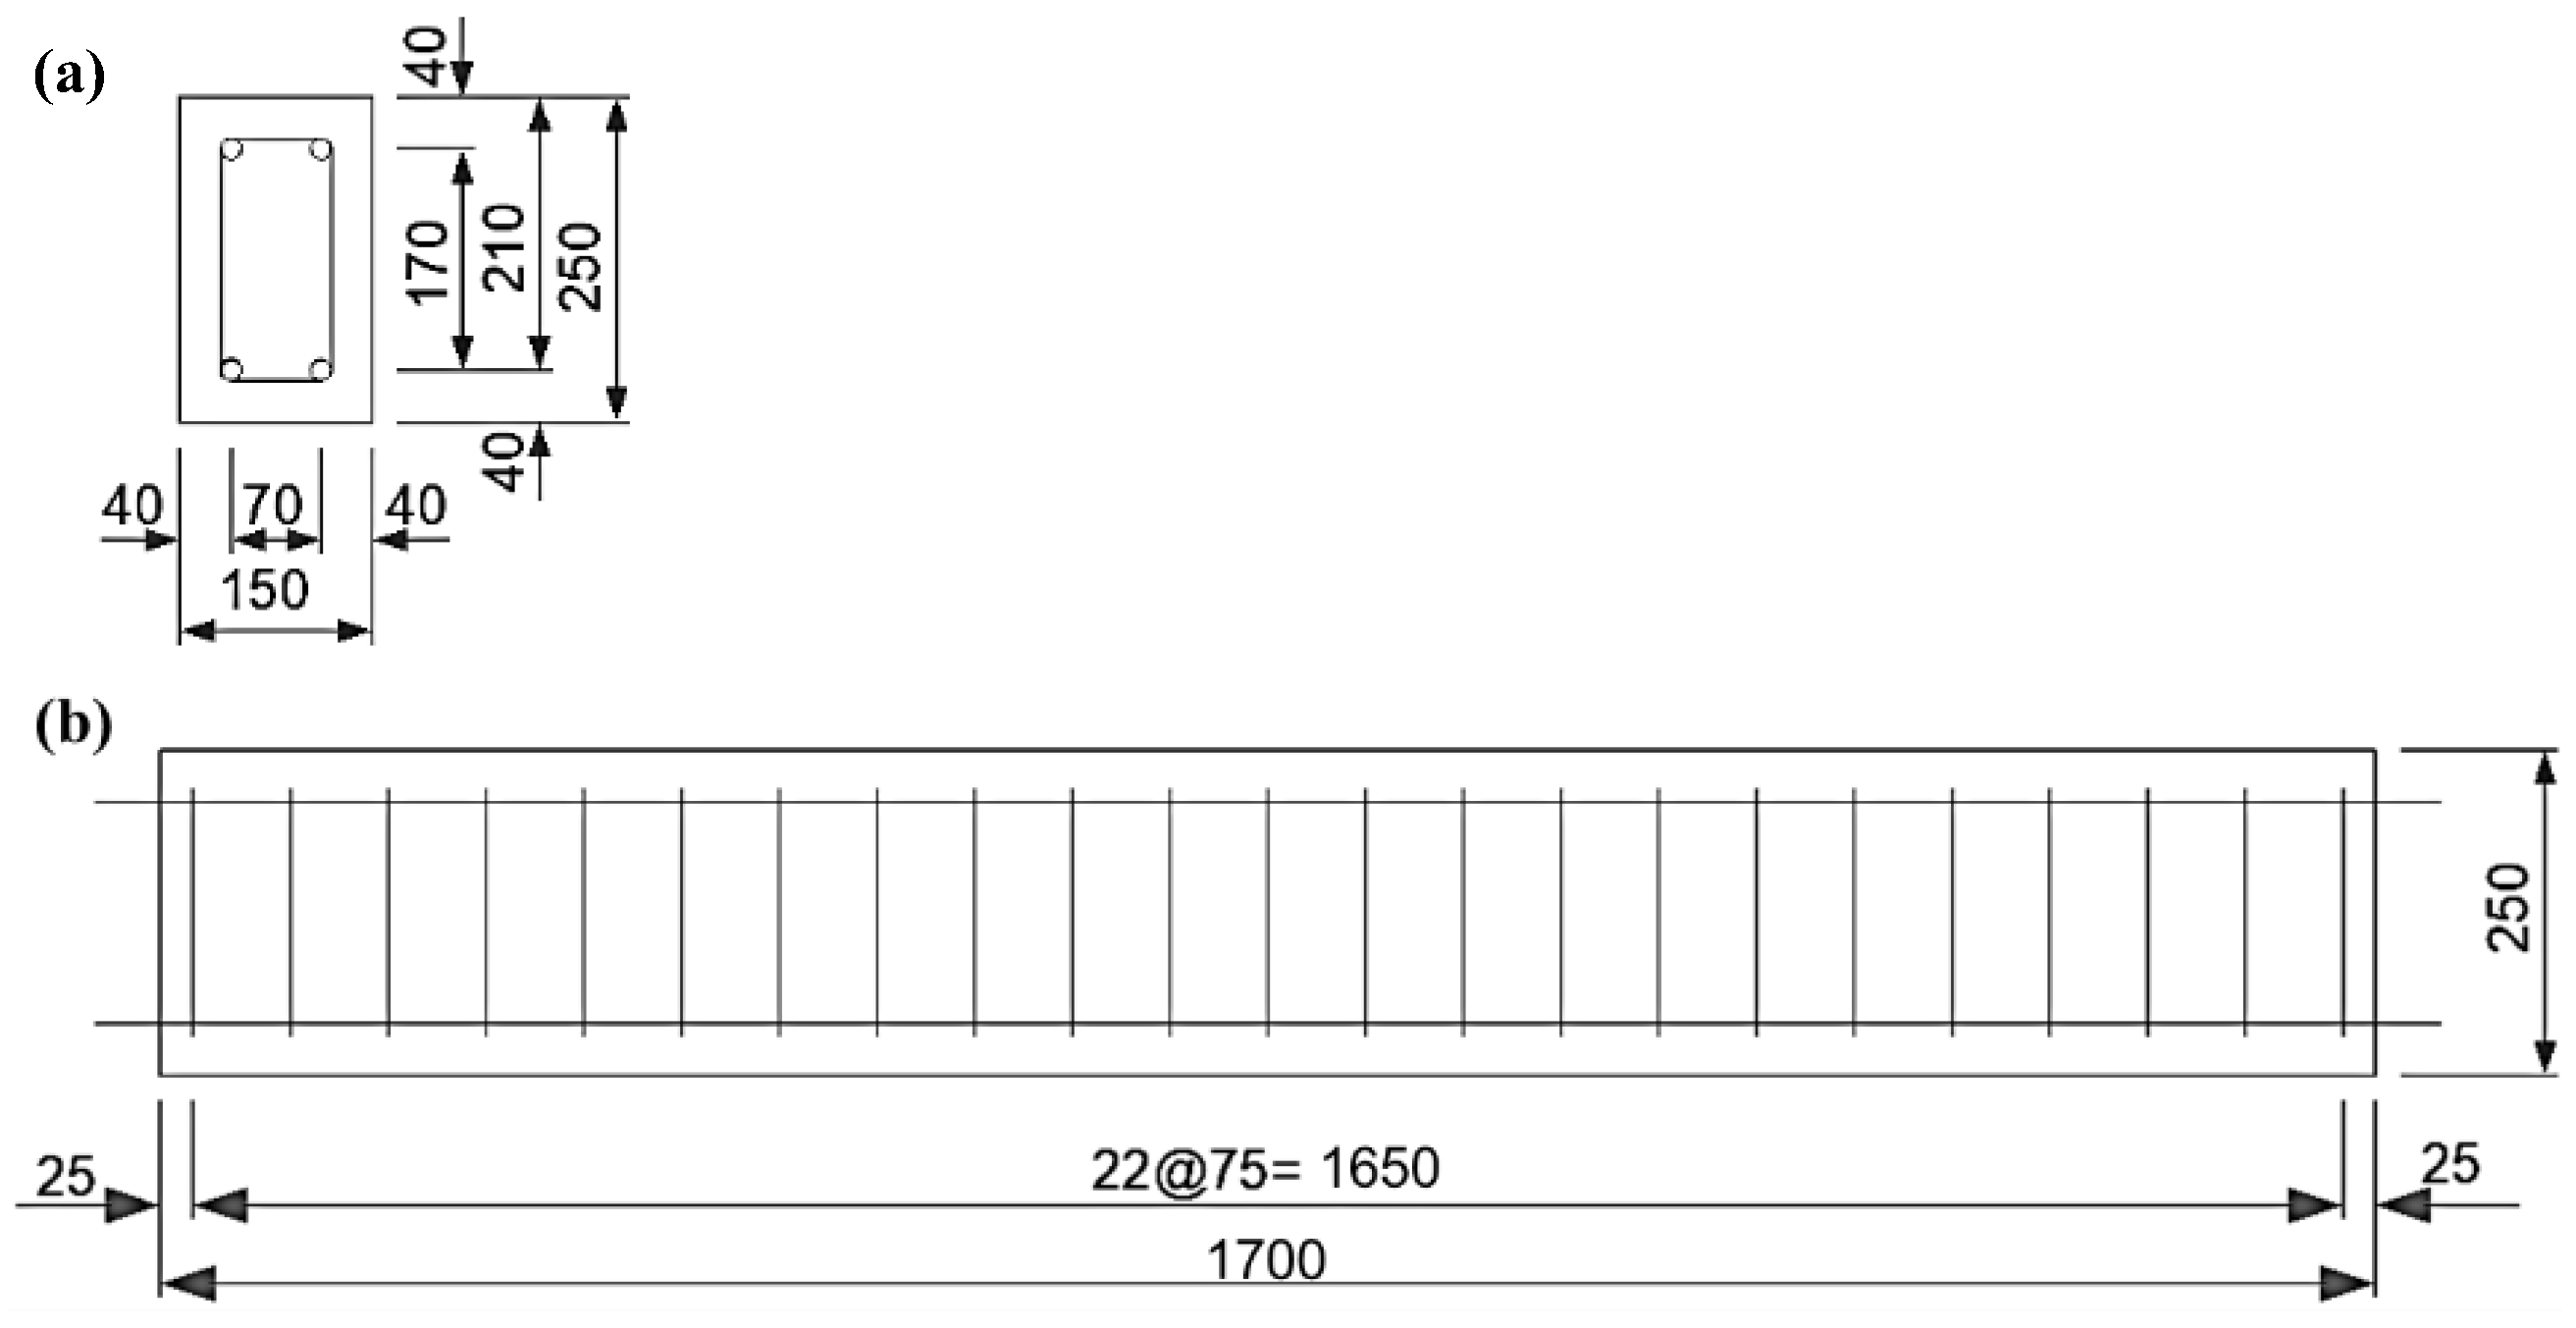
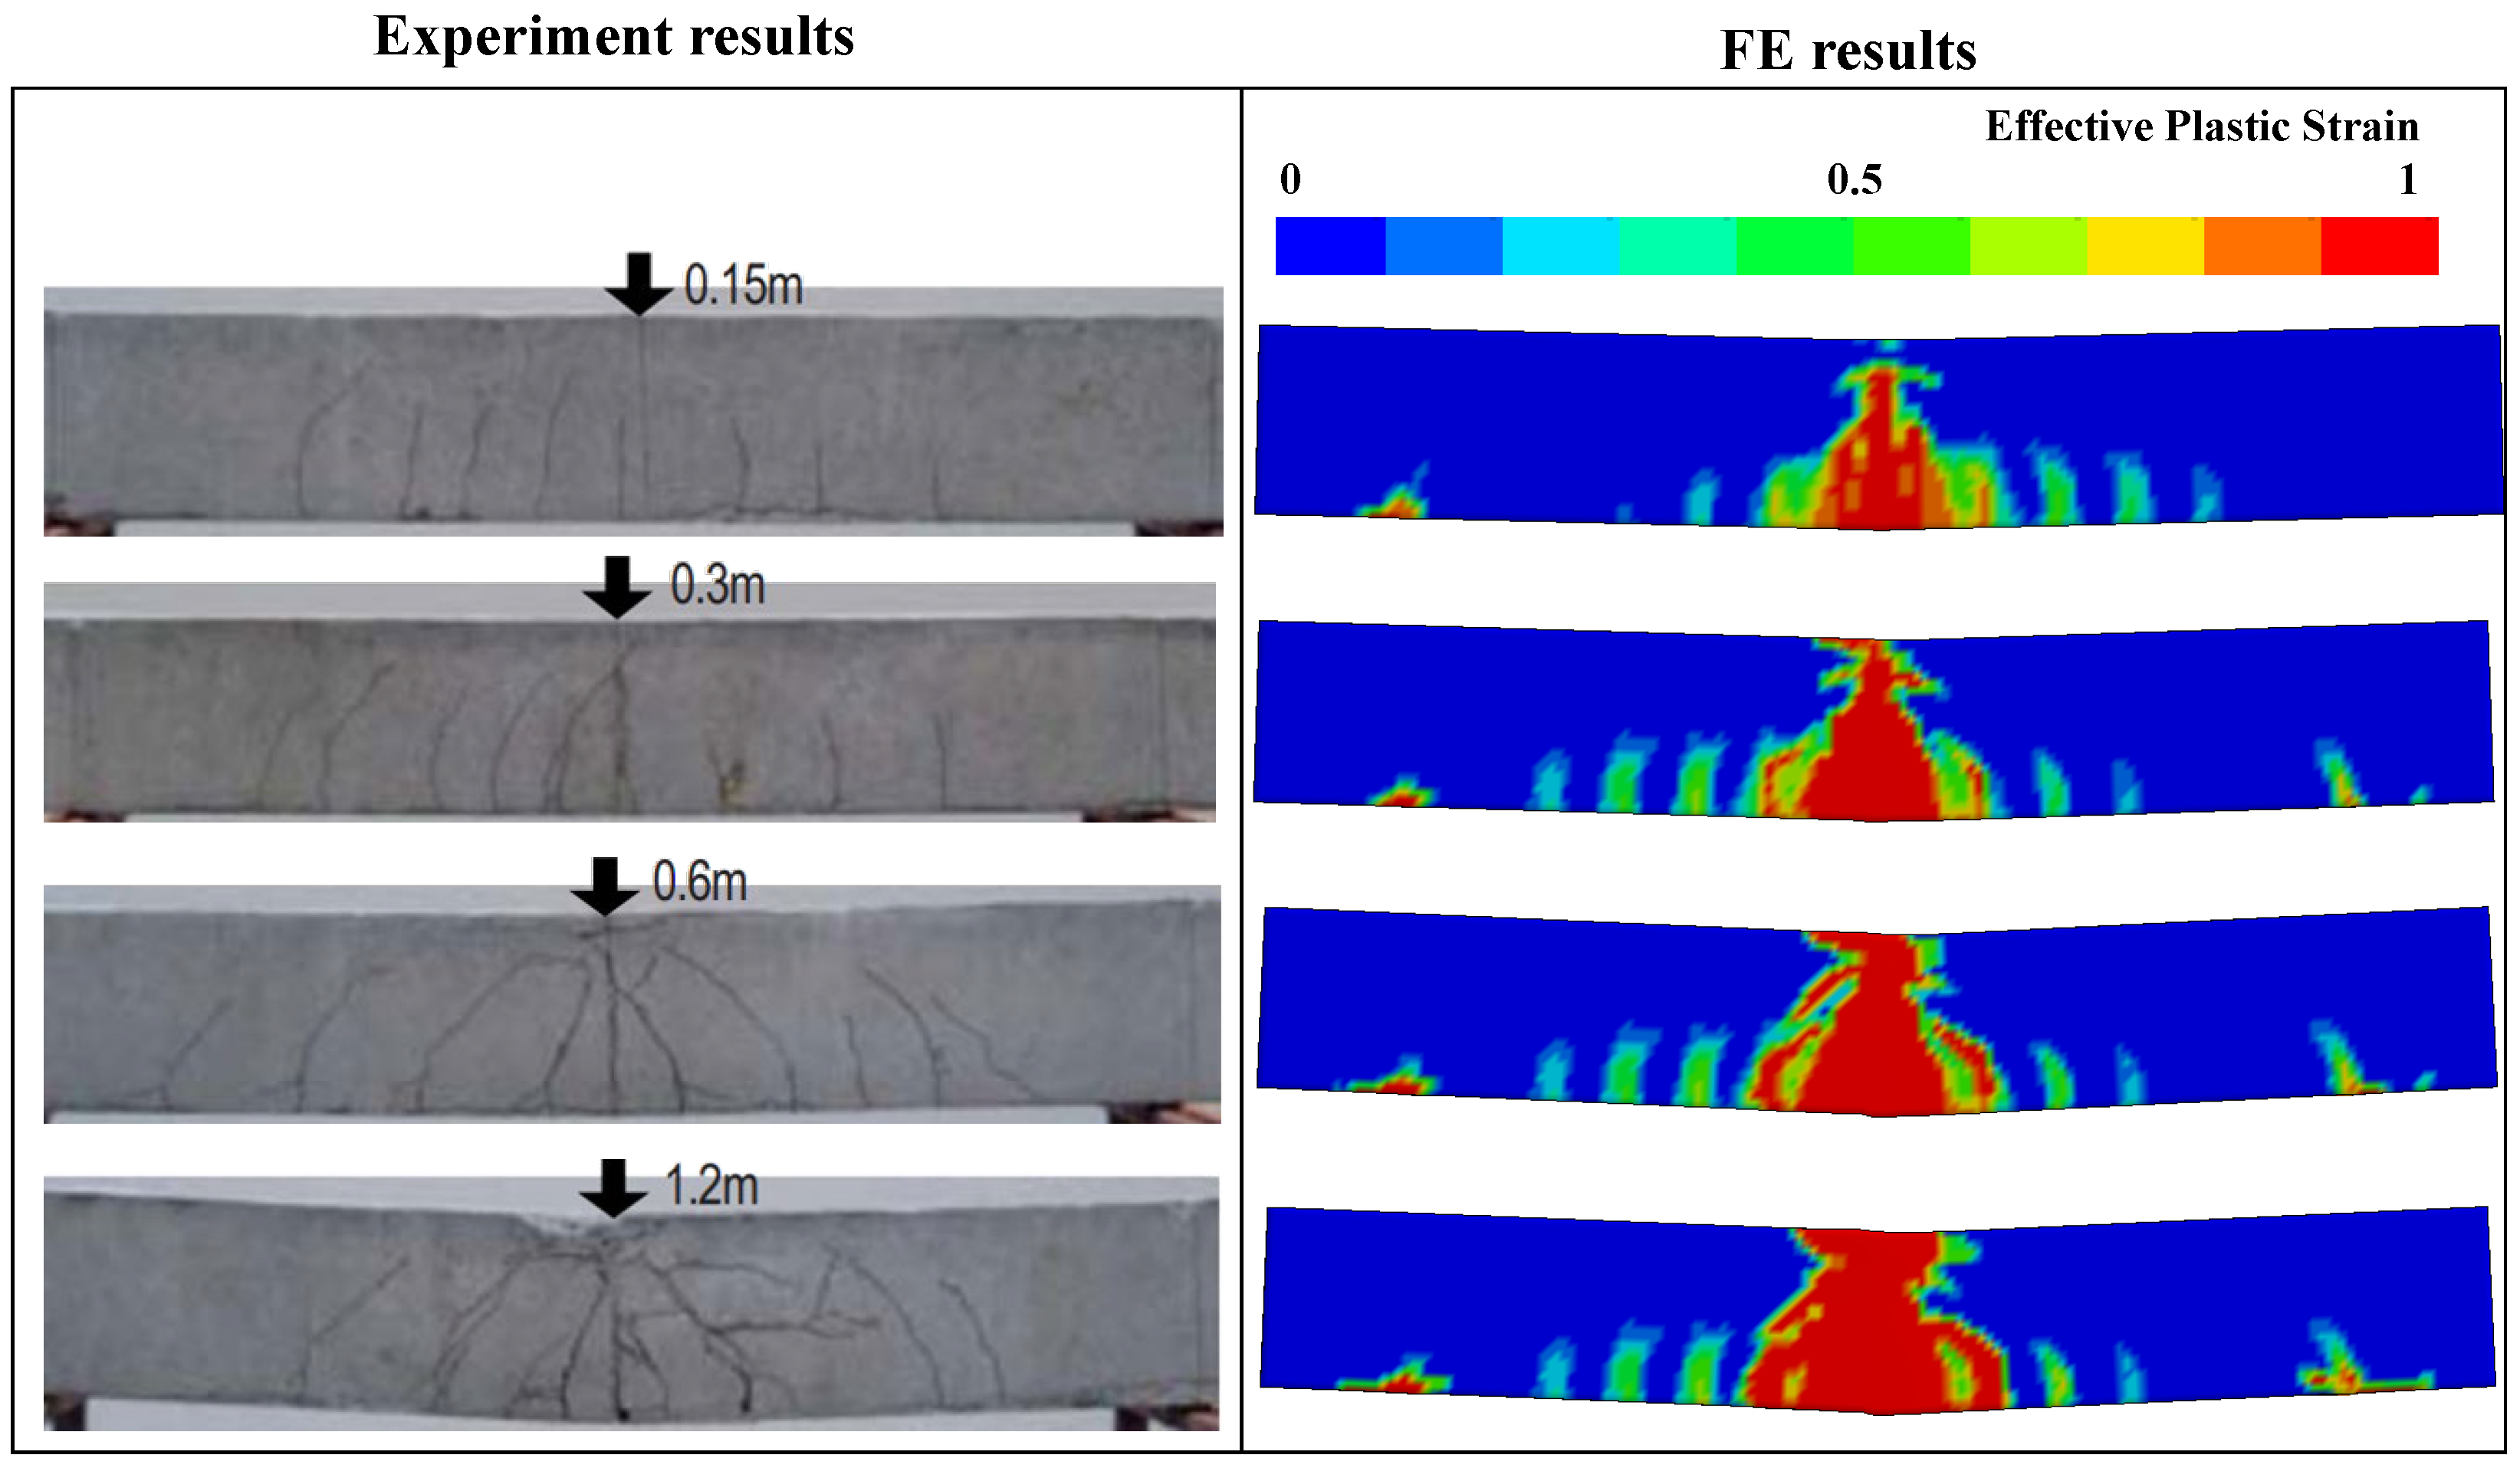
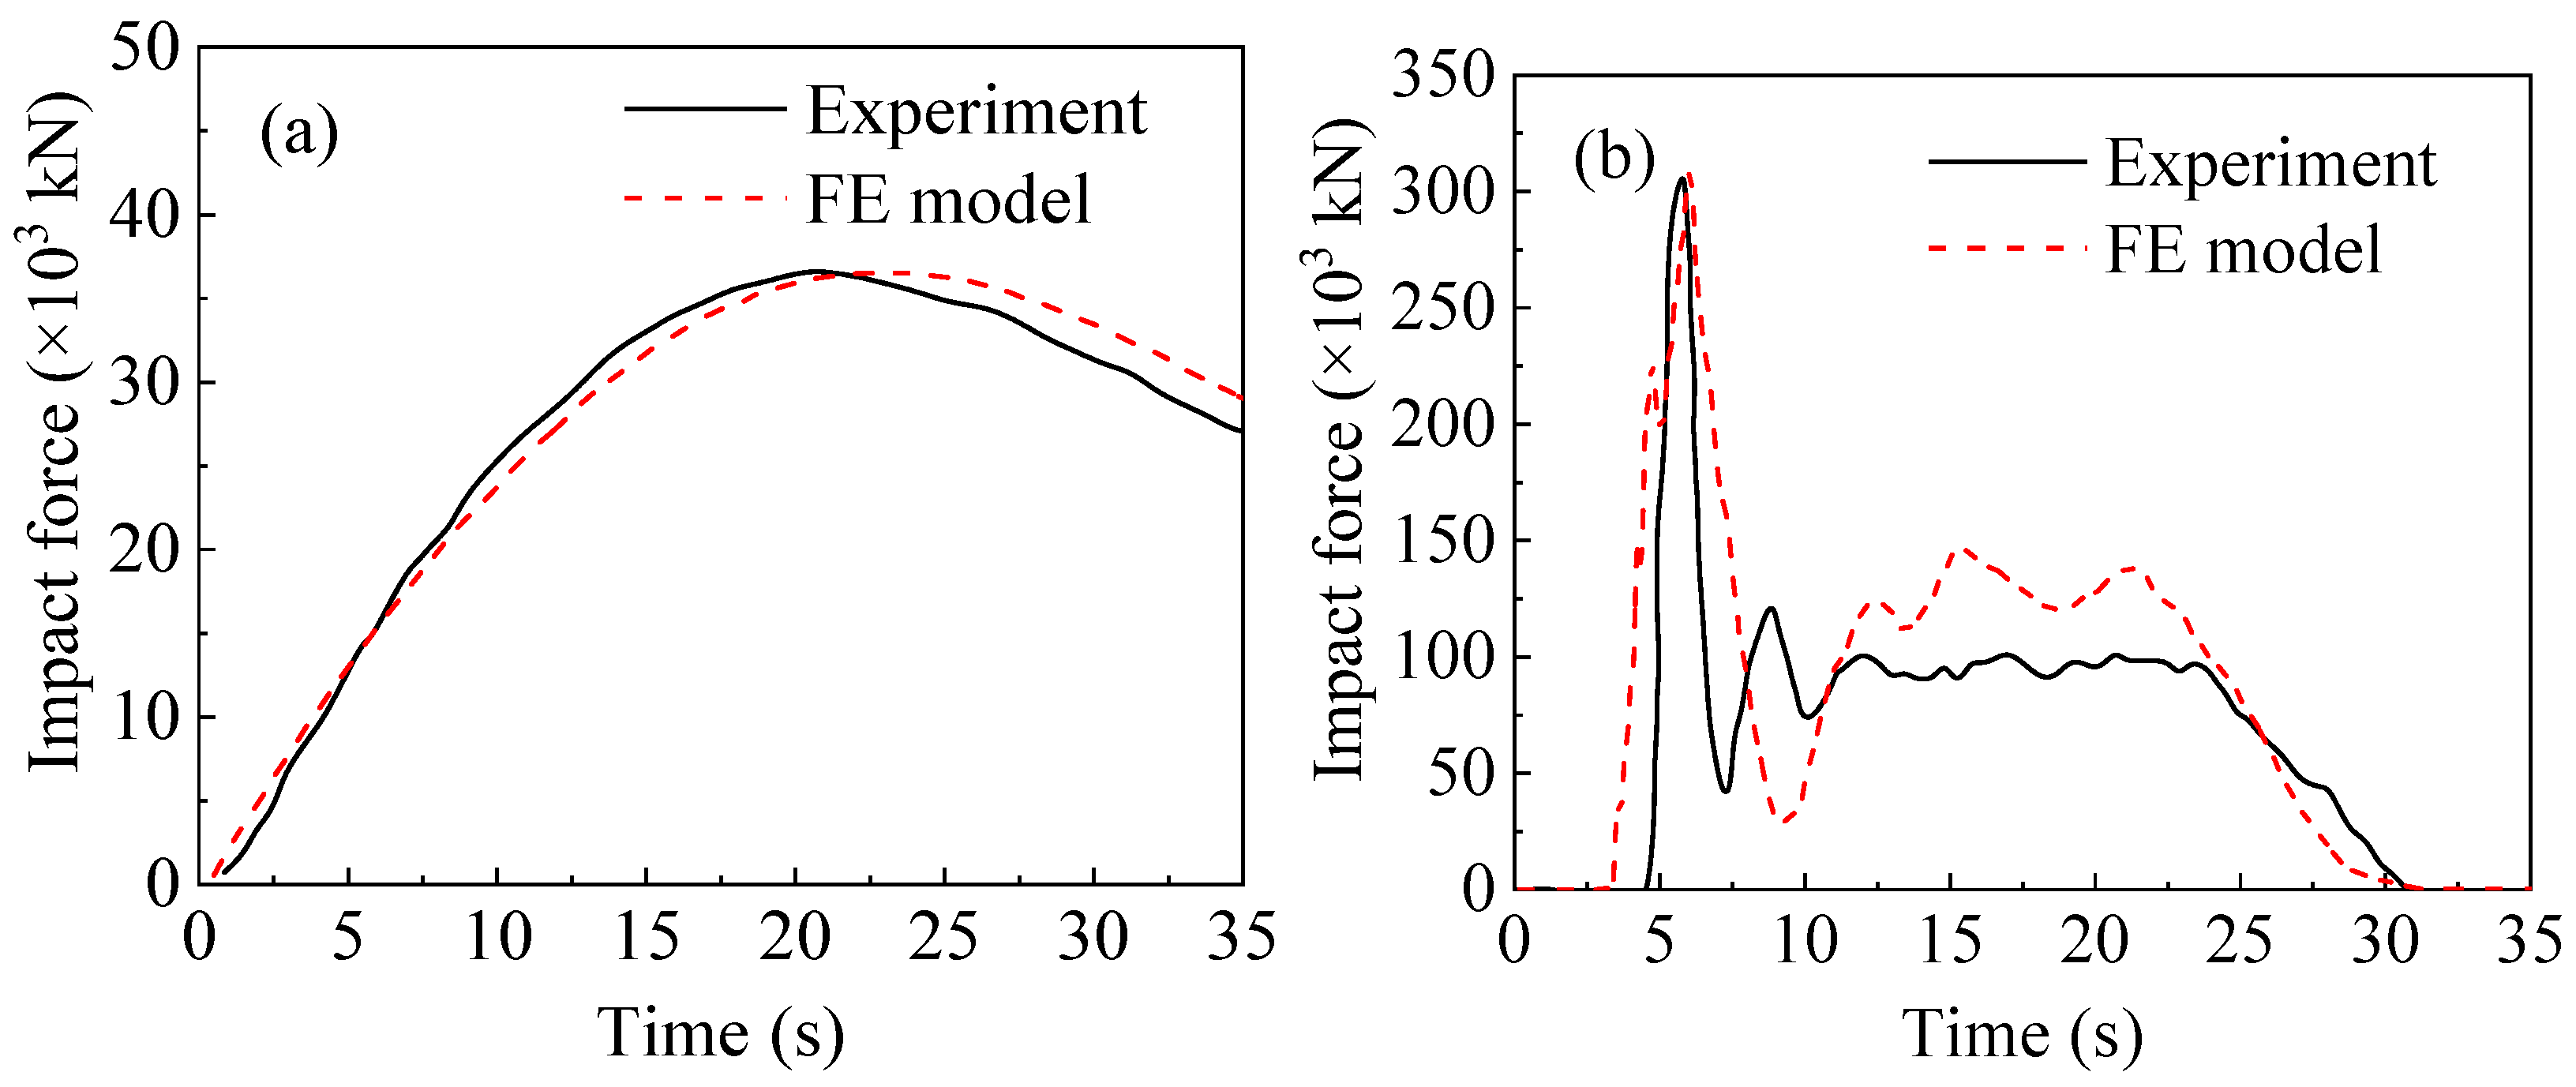
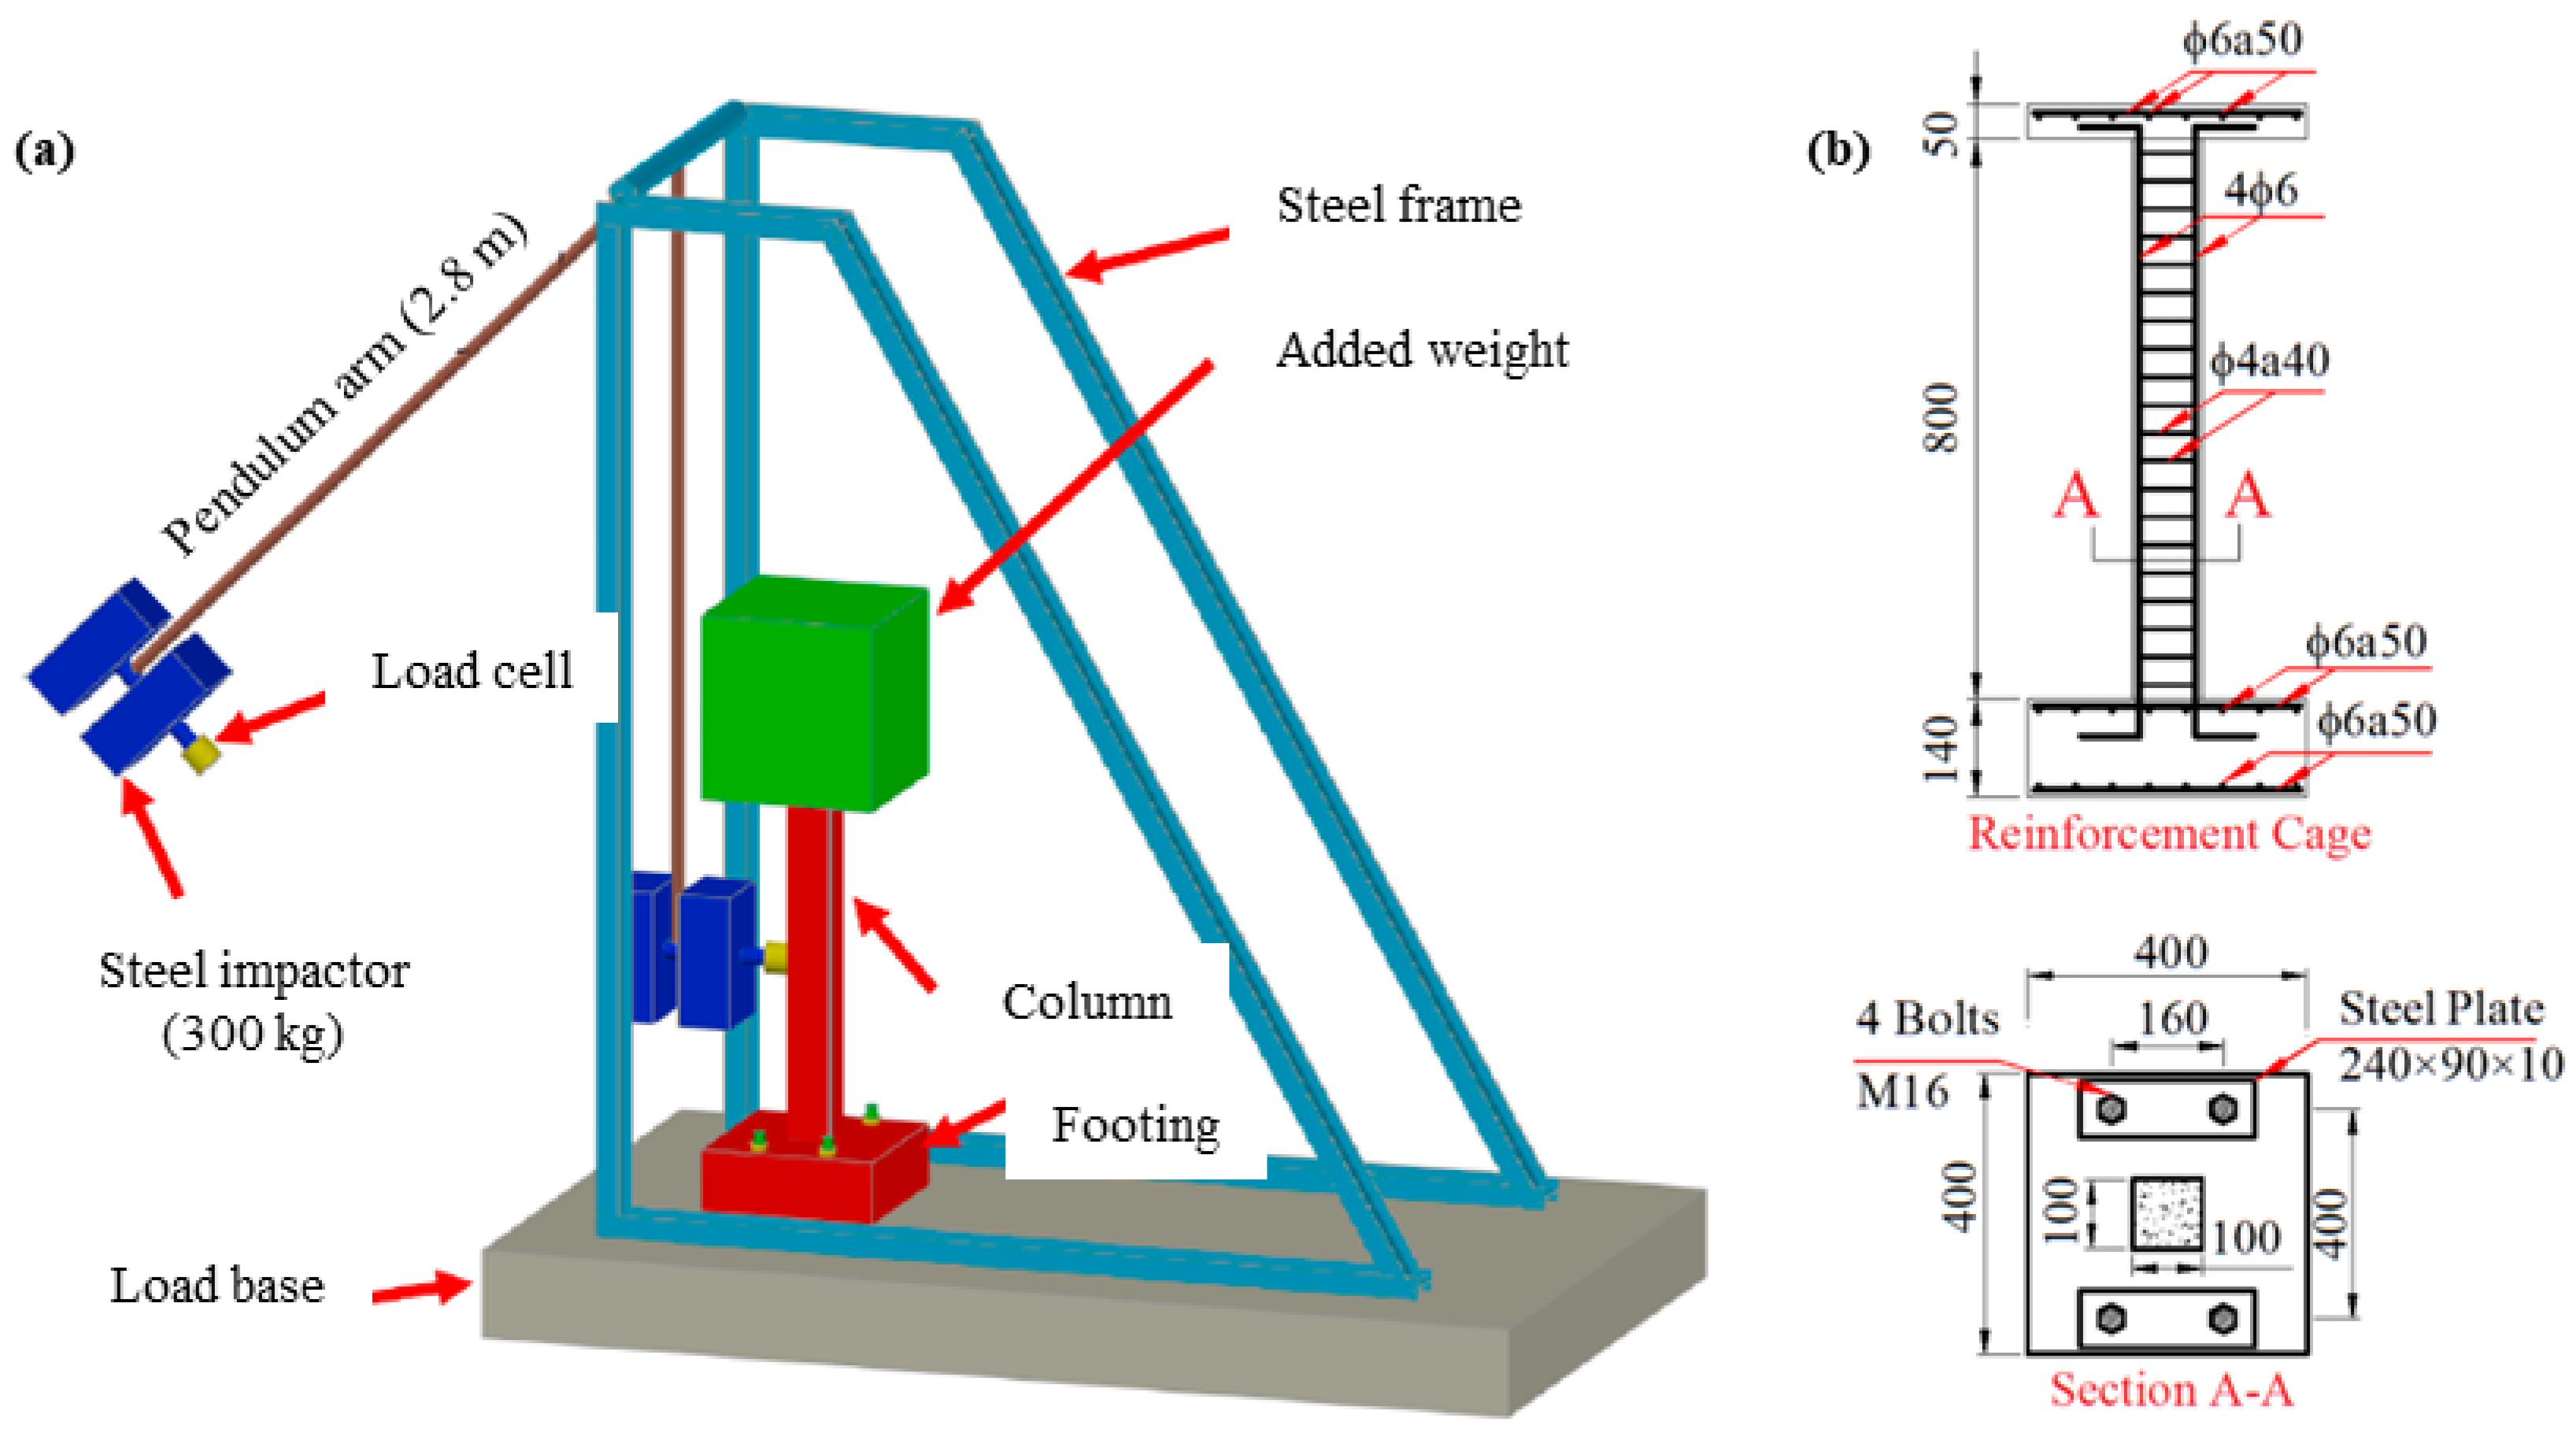
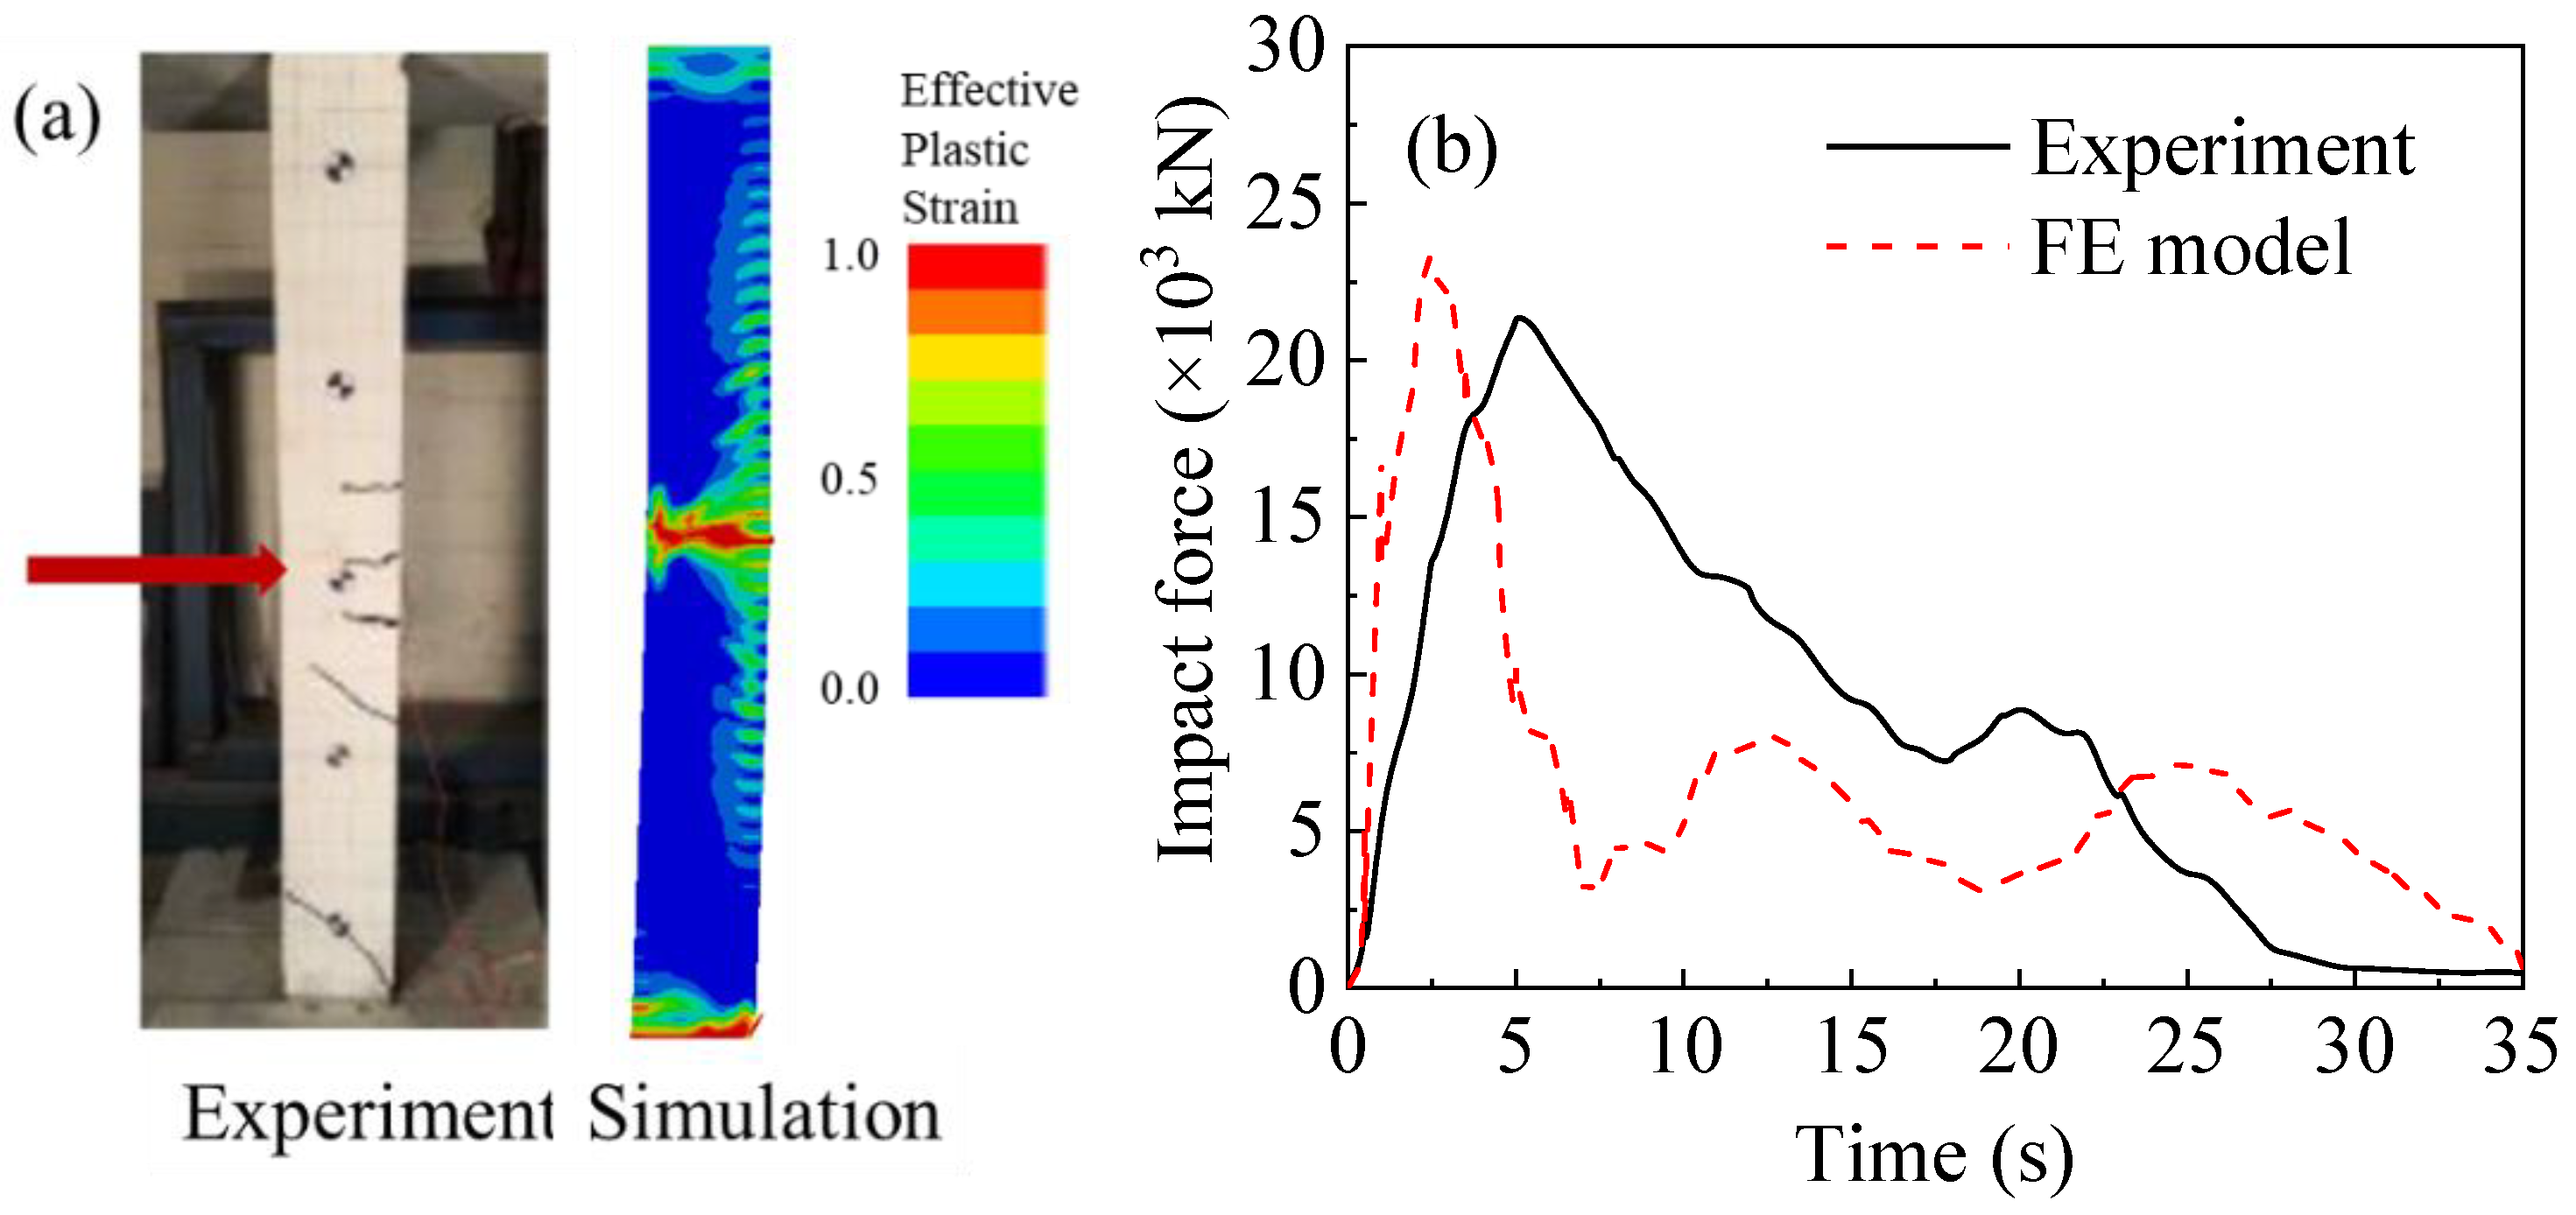
2.3.1. Verification against Two Experiments

This material model and contact algorithm of the rock-HTWBP model are verified, based on the drop-weight test of a reinforced concrete beam performed by Fujikake et al. [23]. As shown in Figure 5, the test drops a weight of 400 kg from four different heights on the middle of the span of concrete reinforced beams. The lower part of the drop hammer has a hemispherical tip with a radius of 90 mm. In the test, the concrete reinforced beam has a rectangular cross-section of 150 × 250 mm, the length of the beam is 1700 mm, and the uniaxial compressive strength of the concrete is 42 MPa. The diameters of the longitudinal reinforcement of the three tests are 16, 22, and 22 mm with yield strengths of 397, 426, and 418 MPa, respectively. The diameter of the transverse reinforcement is 10 mm with a spacing of 75 mm, and the yield strength is 295 MPa. The reinforcement is shown in Figure 6. One of the reinforcement conditions is selected for verification; that is, the longitudinal reinforcement diameter is 16 mm, the longitudinal reinforcement ratio is 1.26%, and the impact height of the drop hammer is 0.15 m, 0.3 m, 0.6 m, and 1.2 m. Figure 7 shows the FE model that was established, based on the above tests. The material models and contact algorithm are consistent with Section 2.1 and Section 2.2.
Figure 8 compares the damage between the experiment and FE analysis at different impact heights. As shown in the figure, at different impact heights, the concrete beam in the experiment and FE analysis exhibits overall flexural failure, and bending cracks appear on the lower side. Moreover, when the height of the drop weight is 1.2 m, it is observed that serious local damage occurs at all loading positions. The damage mode obtained in the FE model is in good agreement with the damage phenomenon observed in the impact experiment, which indicates that the FE model can accurately simulate the damage of the concrete beam under the impact load.
Figure 9 compares the time history curves of mid-span displacement and impact force when the impact height is at 1.2 m. As shown in Figure 9, the variation trend and peak value of the mid-span displacement time-history curve between the experiment and FE analysis are very close, and the difference in peak value is only 0.3%. For the impact force time-history curves, the two curves have some differences, which may be caused by the test conditions or the discreteness of the FE simulation; however, the peak values of the two curves are almost equal, and the difference is only 0.8%. In the field of concrete impact, the peak impact force is usually taken as the focus of research; therefore, the difference in the curve shape can be ignored as a secondary factor. In addition, the peak impact force and mid-span displacement of the experiment and FE analysis under different impact heights are compared in Table 3, and the maximum error is 2.8%. The above analysis shows that the finite element model has high reliability in predicting the dynamic response of reinforced concrete beams under impact load, and the CSCM concrete material model can better simulate and analyze the damage and dynamic response of reinforced concrete beams under impact.
Considering that the end condition for the beams in [23] and the HTWBP are different, a column-pendulum experiment conducted by Zhang et al. is selected here for further verification [24]. In the experiment, the column has a 400 × 400 mm square cross-section and a height of 800 mm. An added weight of 288 kg is exerted on the top of the column to make the end condition similar to a real bridge. The pendulum is made of steel and weighs 300 kg, impacting the column at a speed of 0.64 m/s. More detailed information can be found in Ref. [24]. Figure 10 presents the three-dimensional view of the experiment setup and the reinforcement of the column.
A 1:1 FE model is established according to the details of the experiment. Figure 11 shows the comparison between the experiment in [24] and the FE analysis. As shown in Figure 11a, the damage pattern of the experiment and simulation is similar. Specifically, the simulation well captures the flexural and shear cracks. As shown in Figure 11b, the impact force undergoes a similar up-down process in both the experiment and simulation. Although the two curve shapes show a moderate difference, the peak impact forces are close. The error of the simulation is only 9.3%, which is acceptable when considering an engineering problem. Hence, the verification process further proves that the FE models established in this research are reliable.

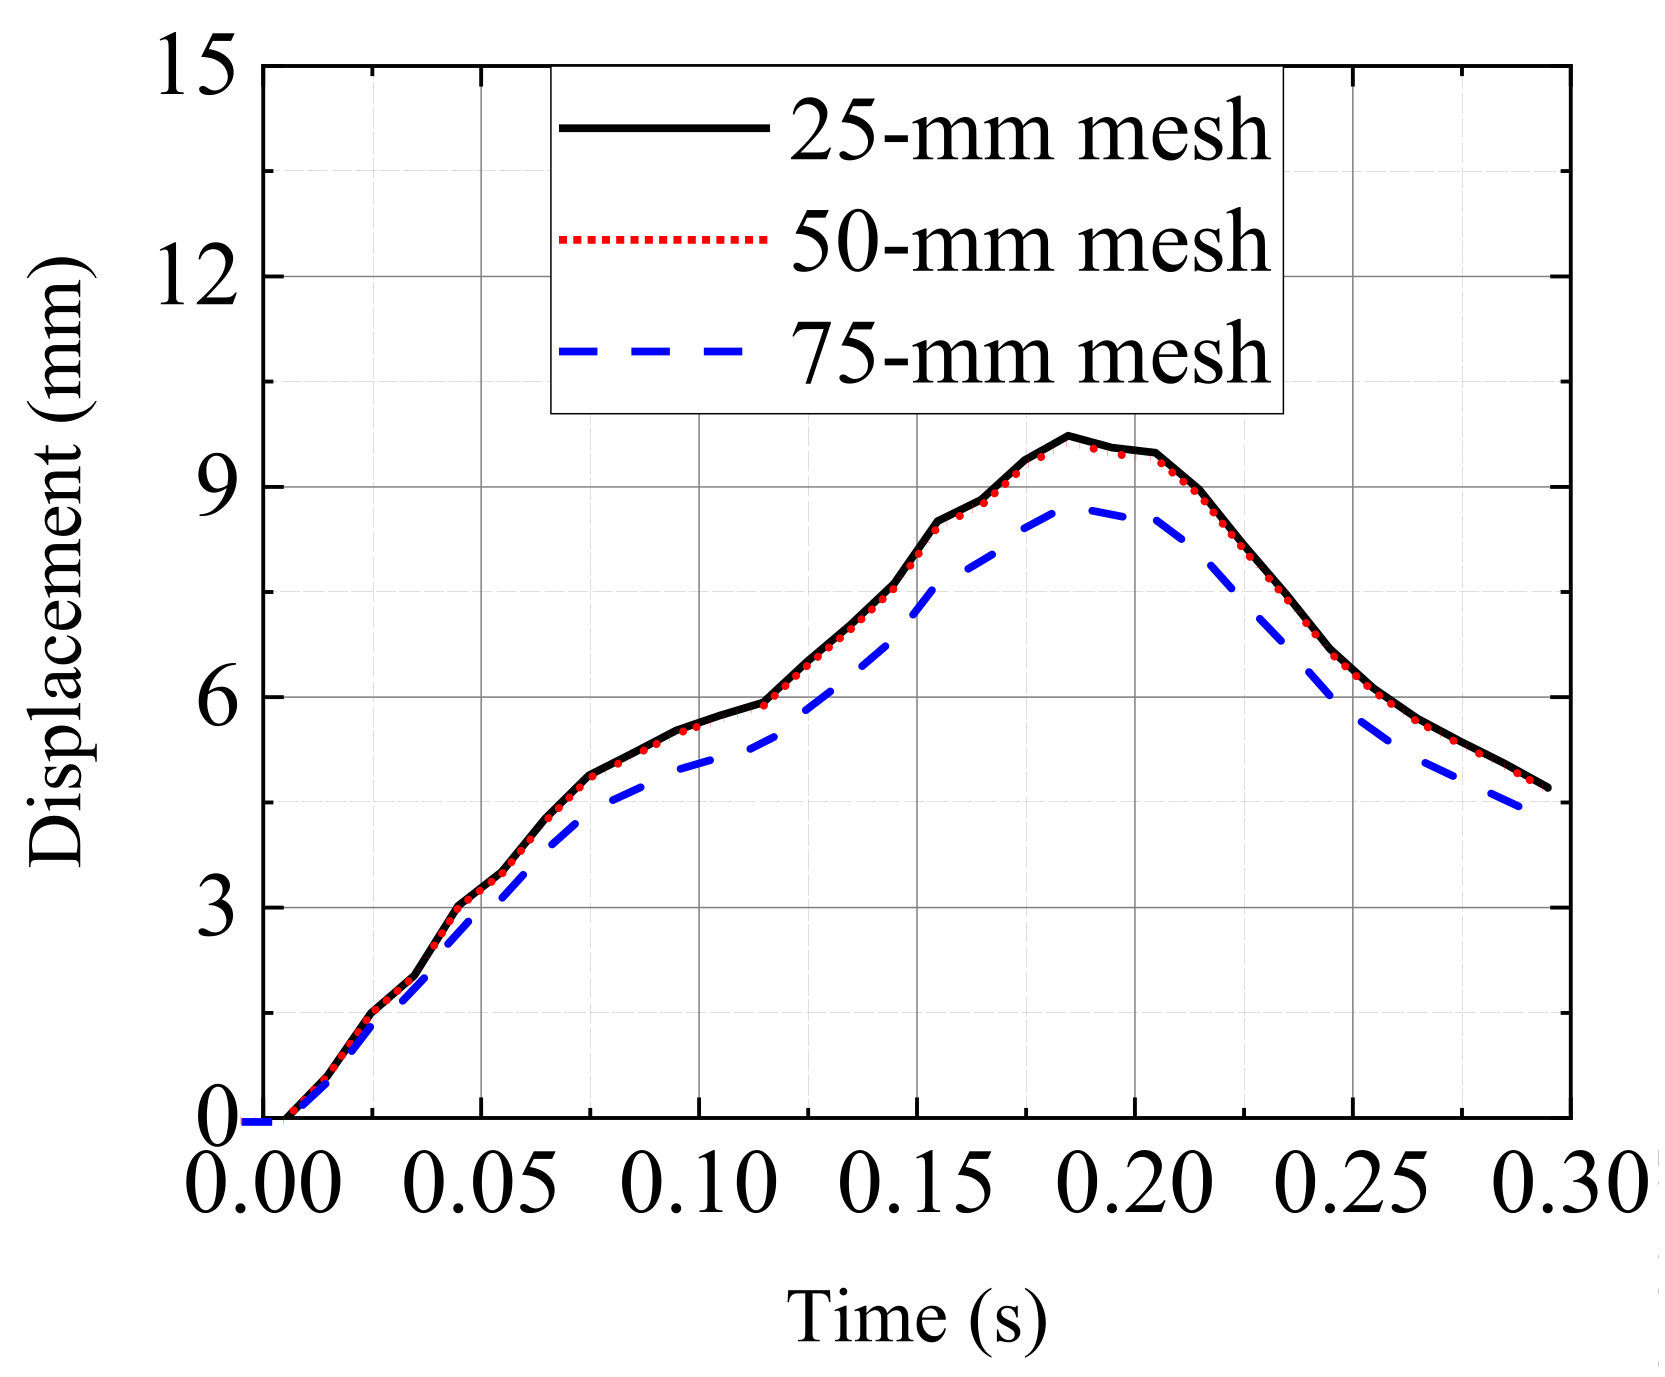
2.3.2. Mesh Independence Verification

To verify the rationality of the mesh size for the impacted pier, a grid independence verification is conducted. Three mesh sizes, i.e., 25, 50, and 75 mm, are adopted to mesh the impacted pier. Figure 12 compares the mid-span displacement of the impacted under three mesh sizes. As shown in Figure 12, the results obtained by the 25-mm mesh and 50-mm mesh are consistent with only a 1% difference observed. However, the displacement calculated by the 75-mm mesh shows a large difference between 25-mm and 50-mm meshes. Hence, it is believed that the 75-mm mesh is too large to simulate the impact behavior of the HTWBP. To balance the accuracy and computational efficiency, adopting the 50-mm mesh for the impacted pier is reasonable.

3. Rockfall Impact Resistance

Based on the rockfall-HTWBP model established in Section 2, the impact resistance of HTWBP under different impact parameters is analyzed in this section. The involved parameters are: impact height h, impact velocity v of the rockfall, rockfall diameter d, and the strength grade s of concrete. Assuming that the rockfall normally impacts the middle and lower parts of the pier, for a bridge pier with a total height of 80 m in this paper, the impact height range is 10–40 m. The impact velocity v is 30, 20, and 10 m/s, respectively. The diameter d of rockfall is 1.5 to 4.0 m, and the concrete strength (uniaxial compressive strength), s, is 30, 40, and 50 MPa, respectively. The rockfall size is determined according to two previous research [1,2]. In the study by Xie et al., 2020, three rock diameters, i.e., 1.2 m, 1.5 m, and 1.8 m, are considered [1]. In another reference [2], the rockfall diameters range from 0.4 m to 4 m. However, the rockfall with a diameter of lower than 1.0 m is considered to have limited influence on the pier. Table 4 summarizes the case studies used in this section.

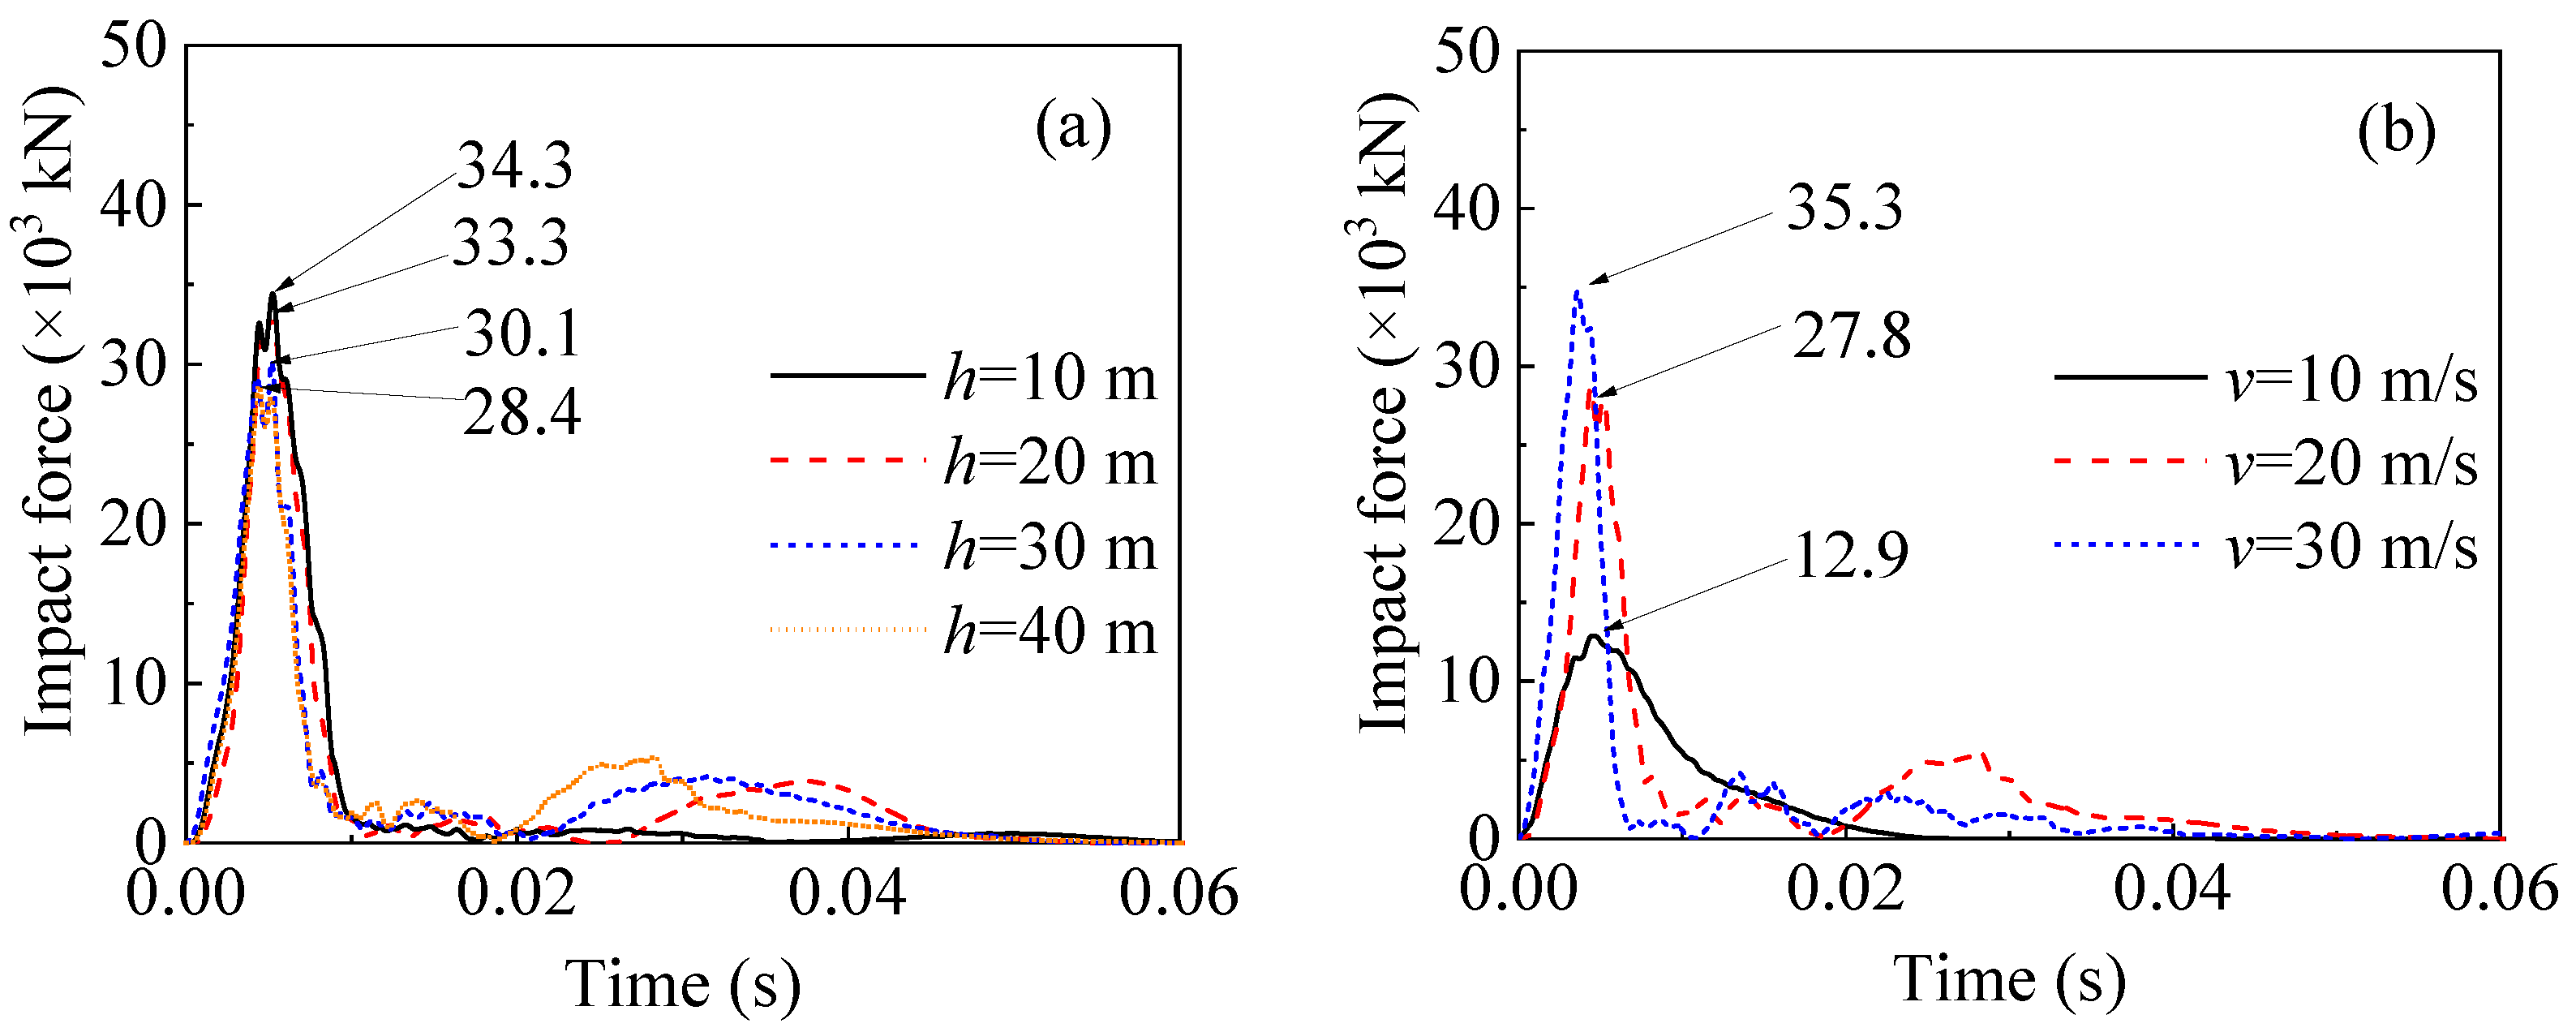
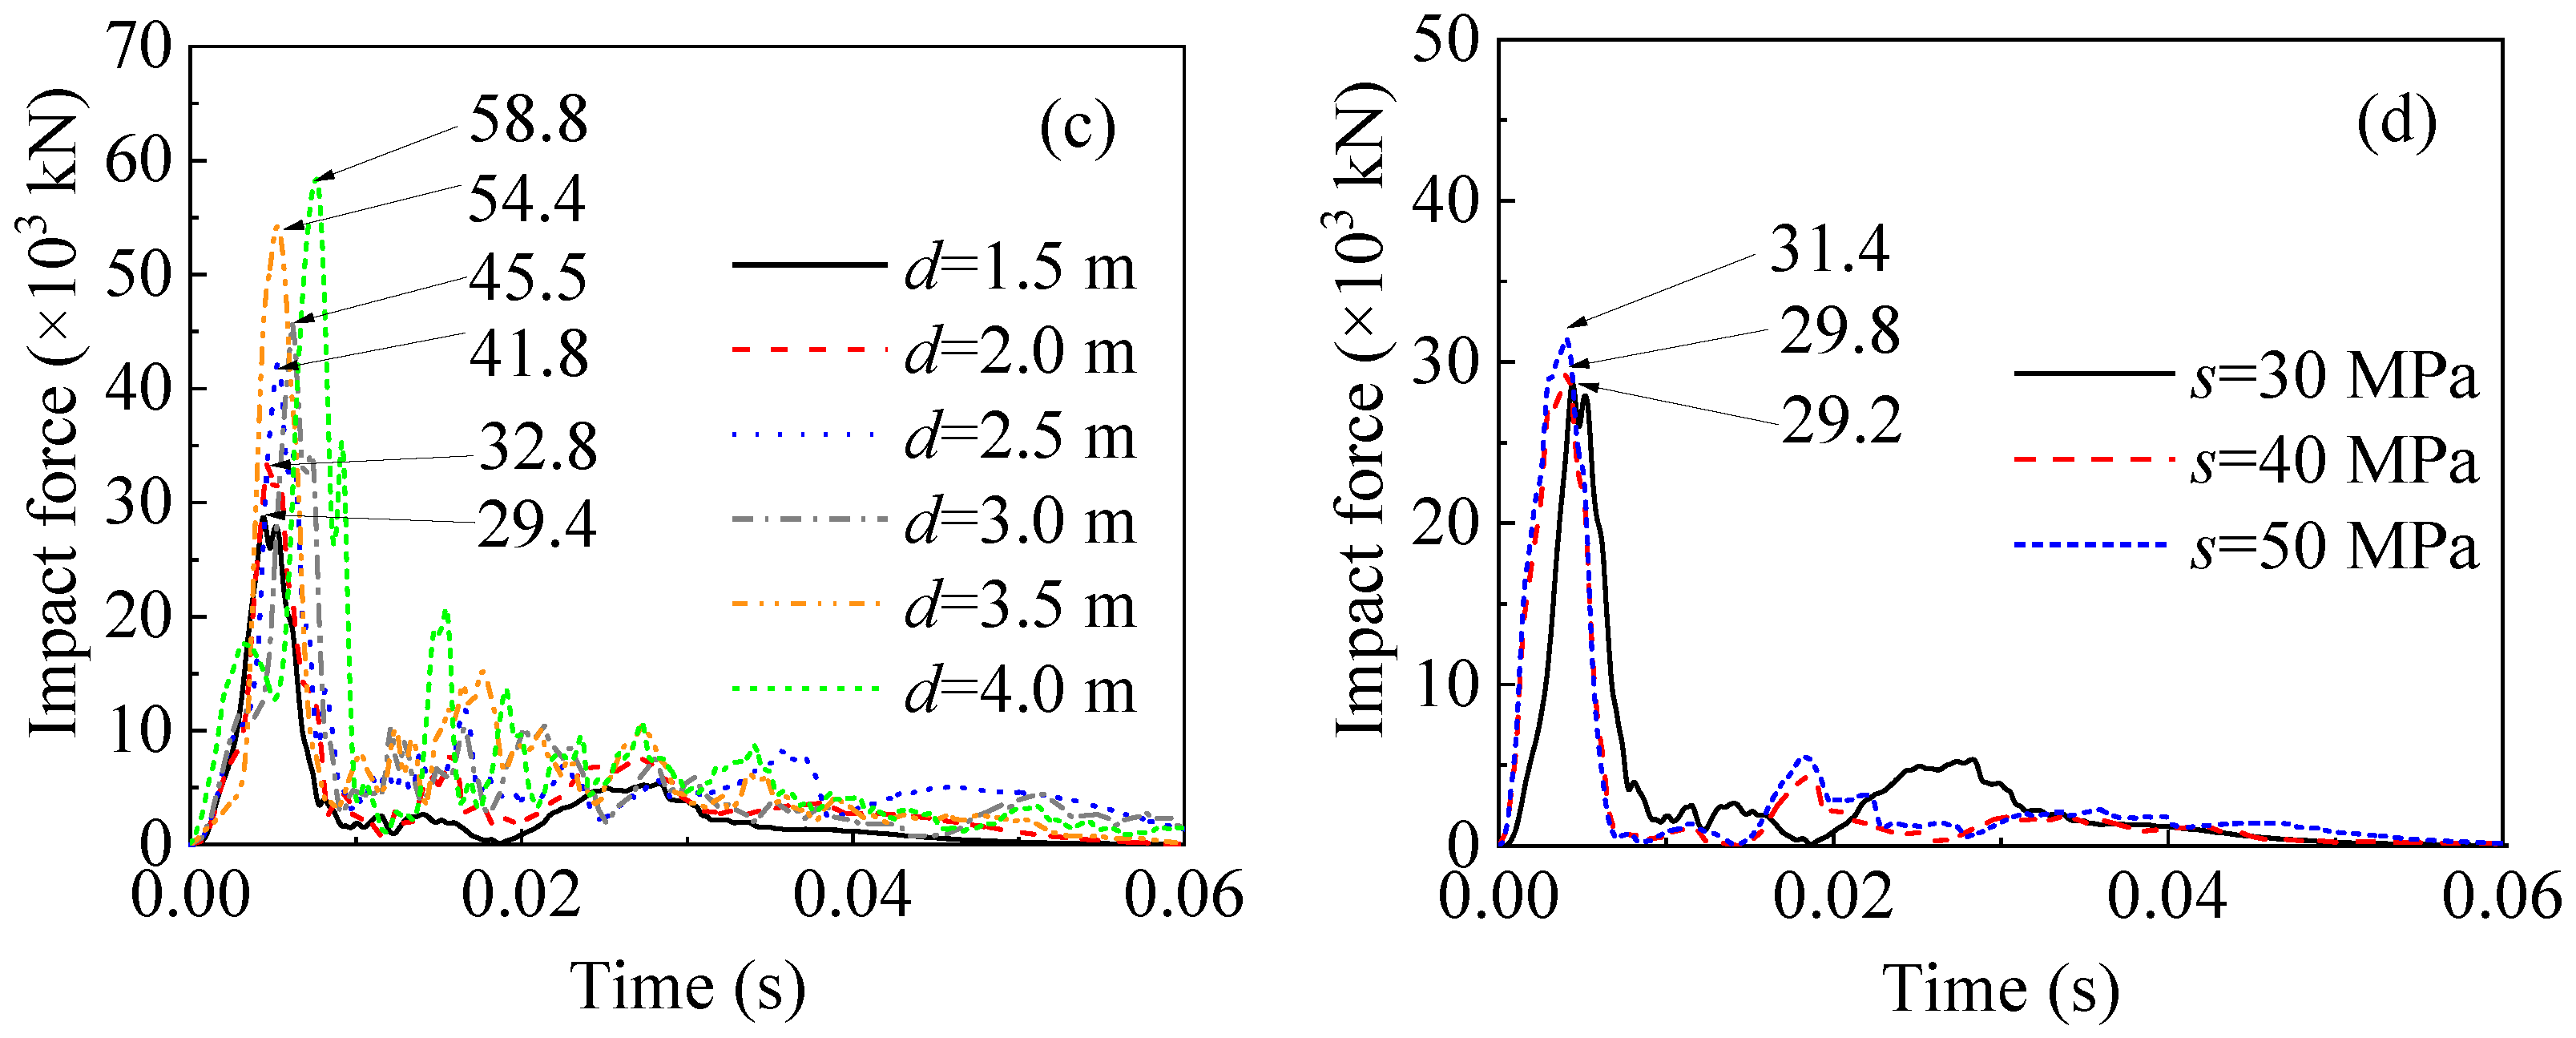
3.1. Impact Force Characteristics

The time history curves of impact force in the different cases are shown in Figure 13. As shown in Figure 13, the impact force of the rockfall has a significant impulse characteristic, and the duration of the impulse load is approximately 0.01 s. In addition, the impact process only lasts less than 0.05 s, indicating that the rockfall impact on the bridge pier is a transient dynamic problem. At t = 0 s, the rockfall starts to come into contact with the bridge pier; the impact force increases rapidly and reaches peak value within a very short time (0.005 s). After the rockfall contacts the pier, the instantaneous impact effect increases the local velocity of the pier and decreases the velocity of the rockfall. Then, the rockfall separates from the pier, so the impact force decreases rapidly after reaching the peak value. Because the bridge pier has a certain elasticity, the concrete is in an elastic vibration state after being impacted by the rockfall, so the time-history curve of subsequent impact force still fluctuates.
As shown in Figure 13a, when the impact height is 10, 20, 30, and 40 m, the peak impact force is 34.8 × 10³ kN, 33.4 × 10³ kN, 31.3 × 10³ kN, and 29.4 × 10³ kN, respectively. When the impact height increases from 10 m to 40 m, the peak impact force decreases by 15.5%. The possible reason for this phenomenon is that when the impact position is closer to the pile cap, the pier is constrained more strongly, and the corresponding peak impact force is larger. As shown in Figure 11b–d, the peak impact force increases with the increase in impact velocity, rockfall diameter, and concrete strength. When the impact velocity increases from 10 m/s to 30 m/s, the peak impact force increases by 170.1%. When the rockfall diameter increases from 1.5 m to 4.0 m, the peak impact force increases by 100.0%. This is because the larger the velocity and diameter of the rockfall, the larger the corresponding kinetic energy, leading to an increase in the impact force. When the concrete strength grade increases from 30 MPa to 50 MPa, the peak impact force only increases by approximately 5%. This indicates that the impact force mainly depends on the stiffness of the rockfall, while the stiffness of the bridge pier plays a secondary role, which is consistent with the research results reported in [1].

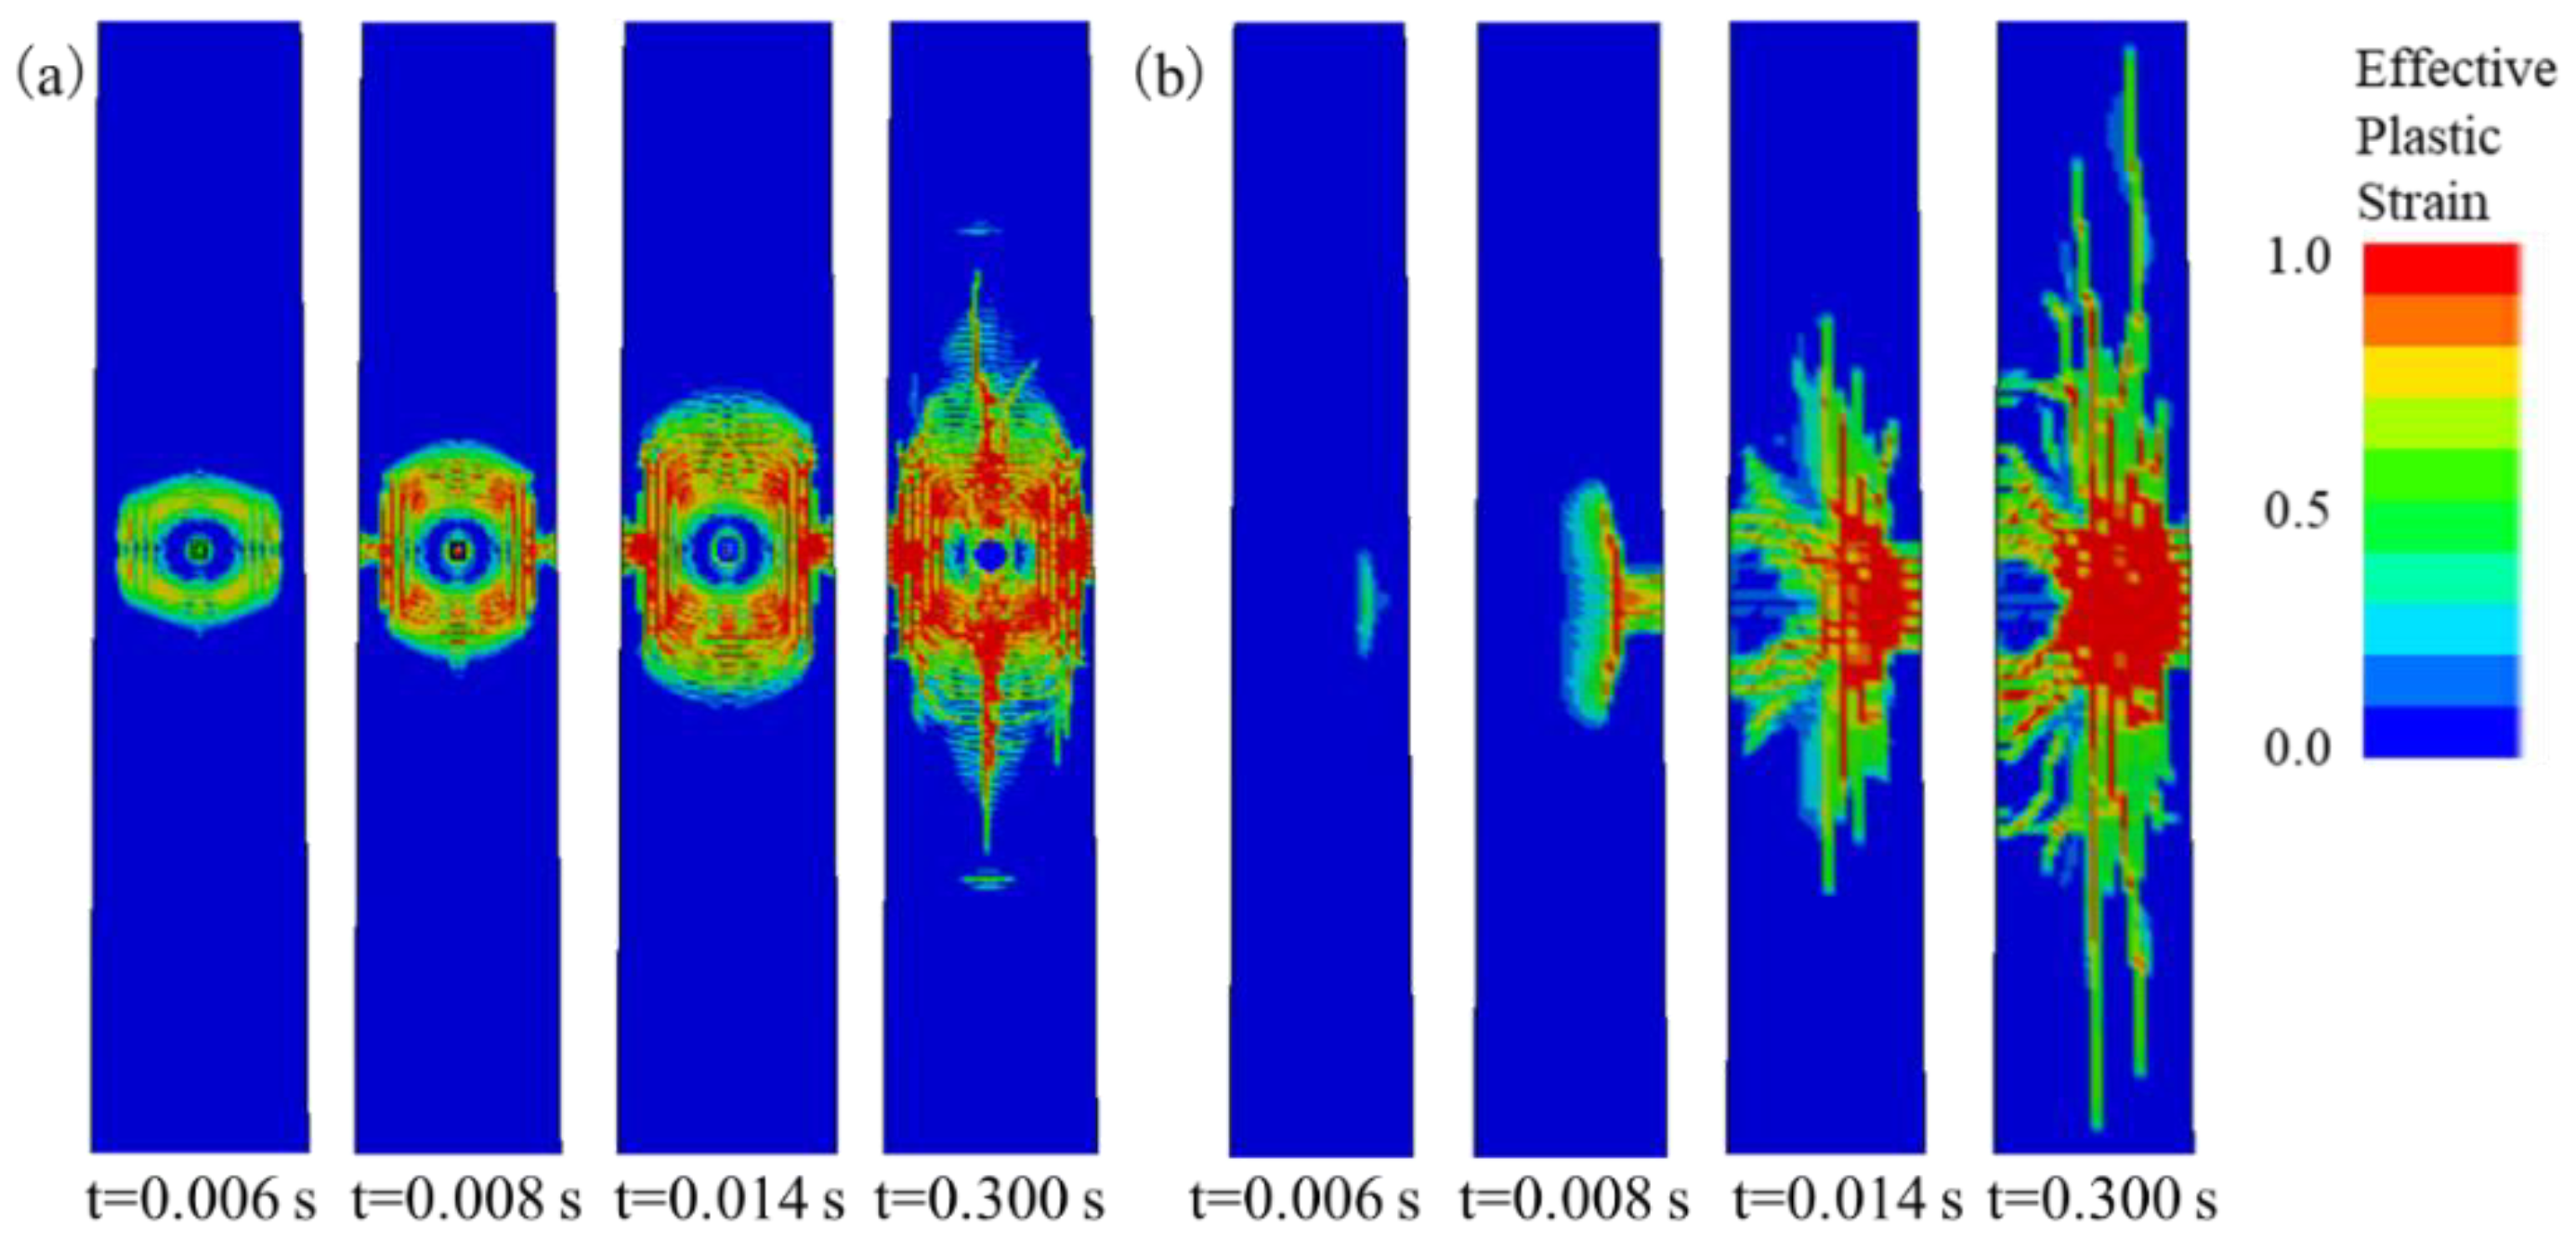
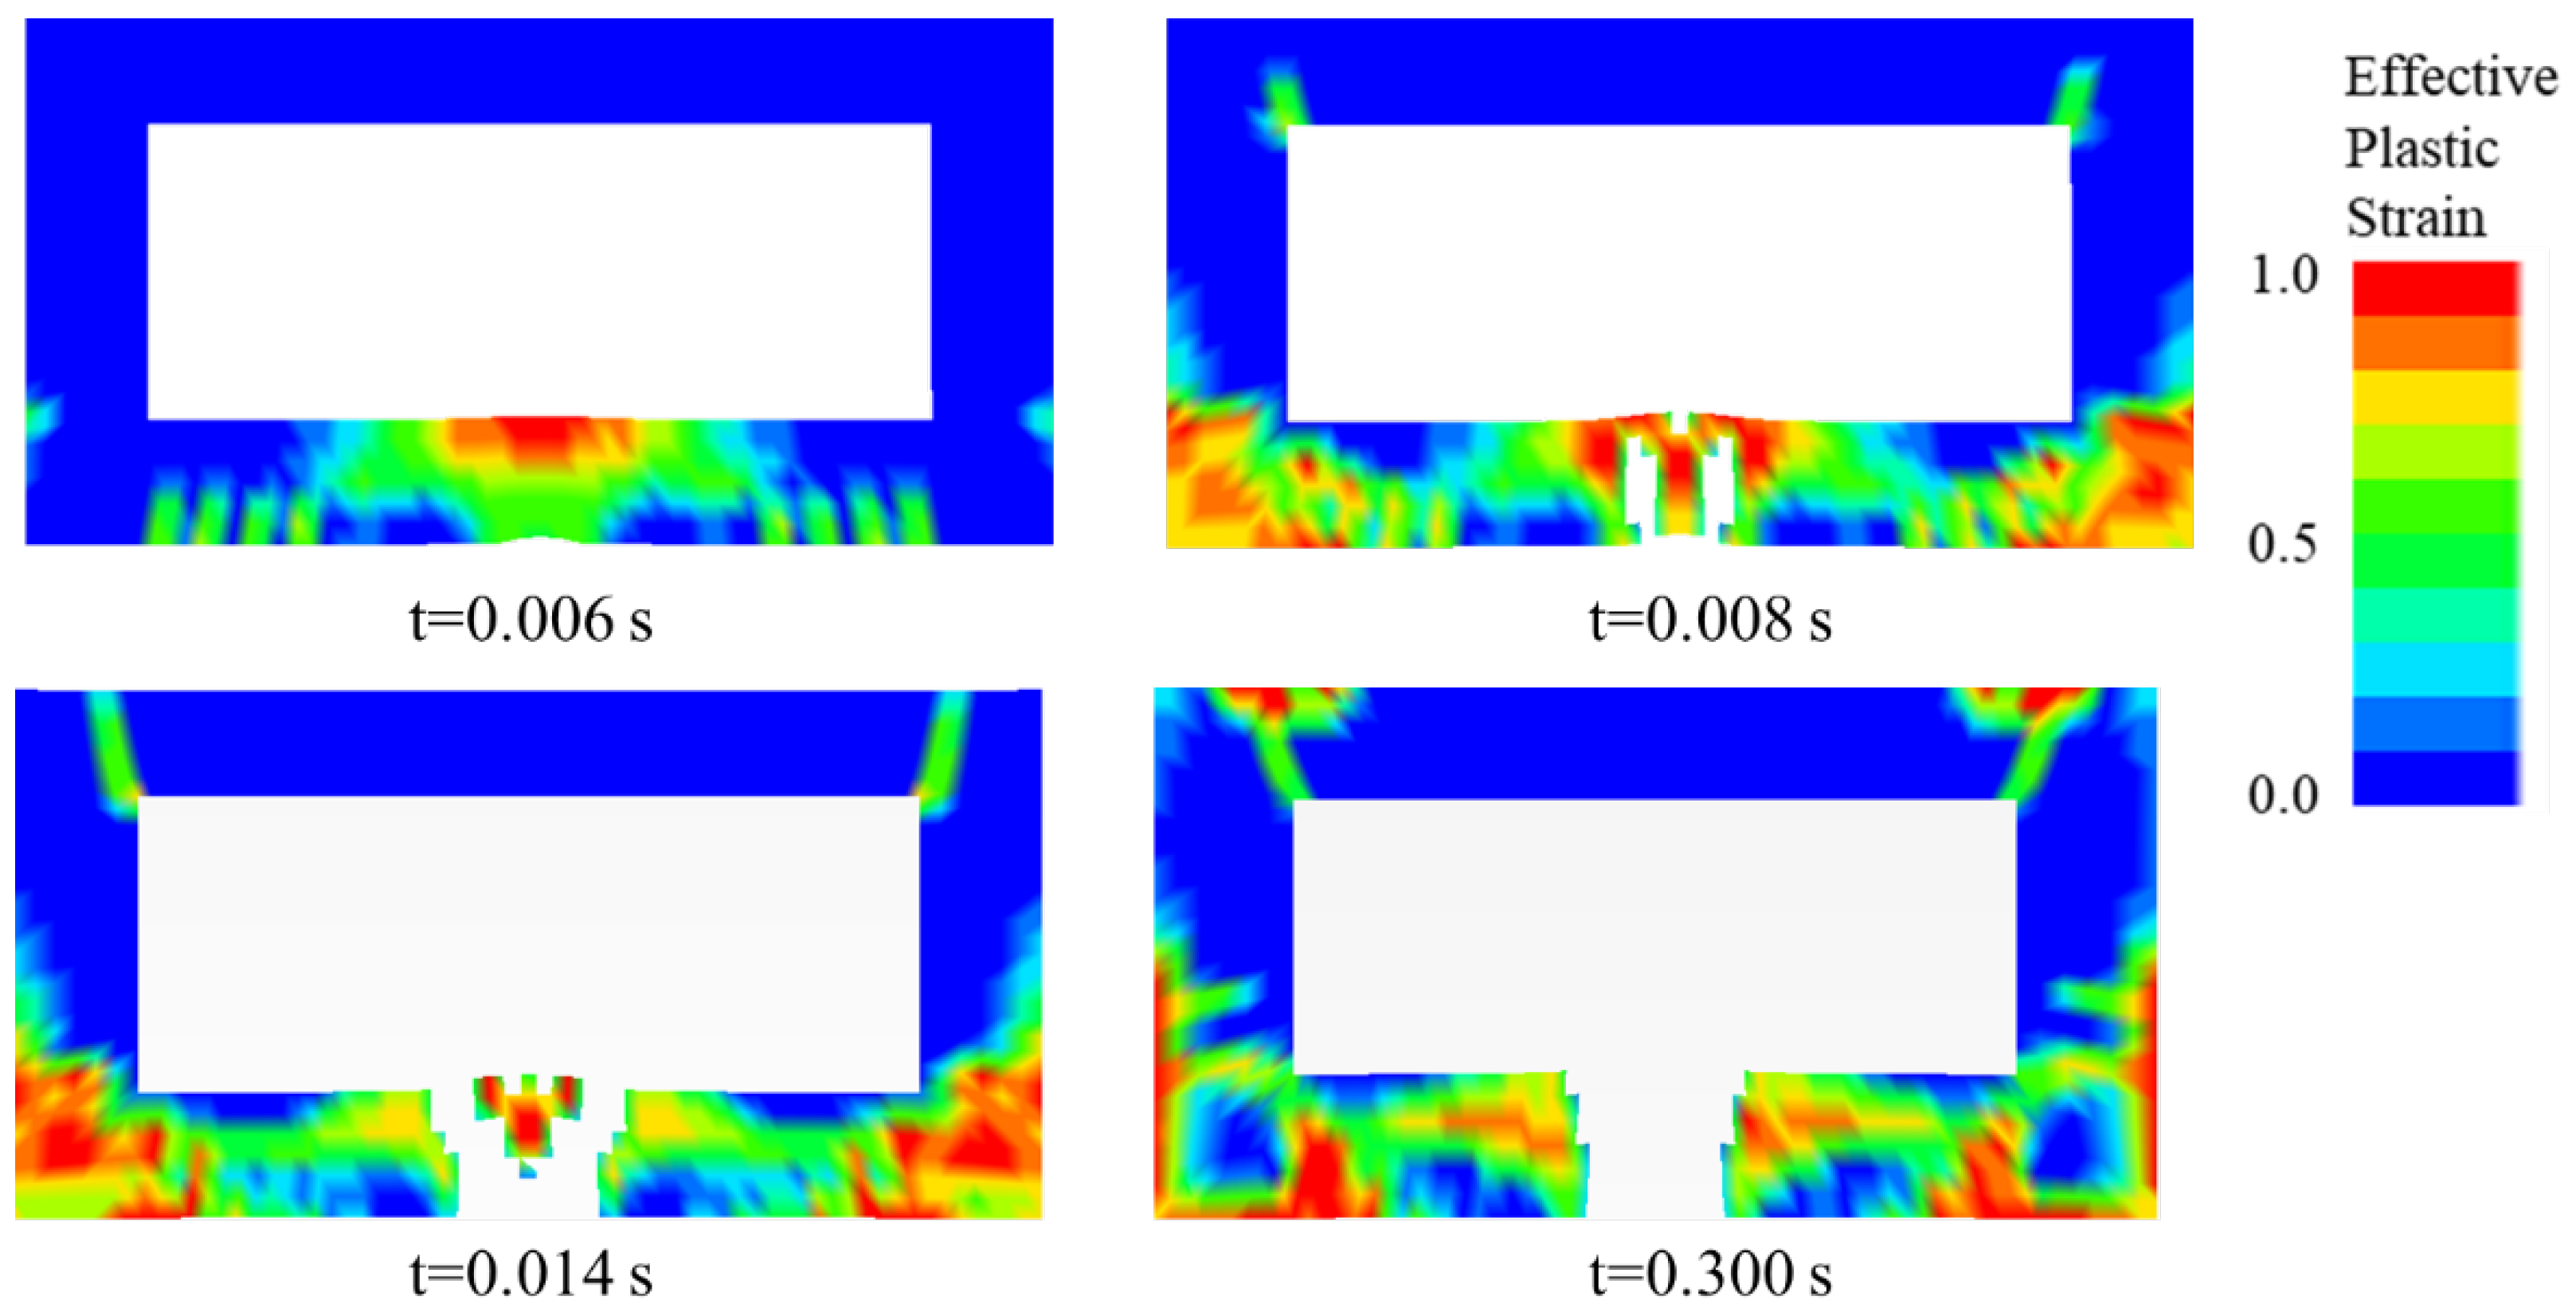
3.2. Damage Characteristics

An element killing algorithm (*MAT_ADD_EROSION) in LS-DYNA is used to simulate the damage of bridge piers impacted by rockfalls [25]. To bring the FE simulation result close to the actual impact result, the maximum principal strain of 0.1 is set as the condition of mesh killing. Figure 14 shows the damage process of the impacted surface and side surface of the pier when h = 40 m (Case C1). Figure 15 shows the damage process of the mid-height cross-section.
As shown in Figure 14a, when the HTWBP is impacted by a rockfall, the elliptical damage centered on the rockfall appears on the impacted surface of the pier, while the damage degree gradually deepens and spreads along the pier vertically and toward the pier edge. When t = 0.006 s, that is, after the impact force reaches the peak, the damage degree is relatively light. When t = 0.008 s, the damage degree gradually deepens, and the damage area spreads both vertically and to the edge of the bridge pier. There are conical and strip damage areas at the edge of the pier and the vertical center line of the pier, respectively, which may be caused by the weak transverse flexural bearing capacity of the impacted surface of the hollow pier. As the impact process continues, the conical and strip damage areas further extend, and the degree of damage gradually enlarges. At the same time, the damage area of the impacted surface gradually develops into the final elliptic damage pattern, with the conical and strip damage areas as the symmetry axis. In addition, the time of impact force is about t = 0.005 s, while the damage process of the bridge pier mainly occurs from t = 0.006 s to t = 0.300 s. This phenomenon shows that the bridge pier has a lag effect on the dissipation of the impact energy, so it takes a certain time for the kinetic energy to be converted into internal energy after the rockfall impact.
As shown in Figure 14b, when t = 0.006 s, no evident damage is observed on the side surface of the bridge pier, because the damage caused by the impact force has not been transmitted to the side surface of the bridge pier. When t = 0.008 s, there is a triangular area of compression damage near the impacted surface on the side surface of the pier, which is consistent with the area of conical damage at the pier edge at t = 0.008 s in Figure 14a. The area of triangular damage continues to expand vertically to the back of the pier; the damage degree continues to intensify, and finally develops into a radial damage area across the side surface of the pier. At the same time, one side of the damage area close to the impact point has serious damage, whereas the other side only shows slight tensile damage.
As shown in Figure 15, when t = 0.006 s, the damage begins to appear on the impacted surface of the bridge pier; because the inner side of the impacted surface of the bridge pier is in a tensile state, the degree of damage to the inner side is greater than that of the outer side. When t = 0.008 s, the damage extends to the whole impacted surface, especially at the corner, and the concrete falls off because of the impact. Two symmetrical slender shear damage areas at the corner of the back side of the pier are observed. When t = 0.014 s, the shear damage area on the back side of the bridge pier extends through the cross-section, and the damage degree of the impacted surface worsens further. When t = 0.300 s, the concrete in the impact area of the impacted surface is deleted. In addition, similar to the impacted surface and side surface of the pier, the damage process of the cross section mainly occurs after the impact force reaches the peak value, namely, after t = 0.006 s. In general, the cross-sectional damage modes of the HTWBP subjected to rockfall impact show compression failure in the impact area and shear failure at the corner.

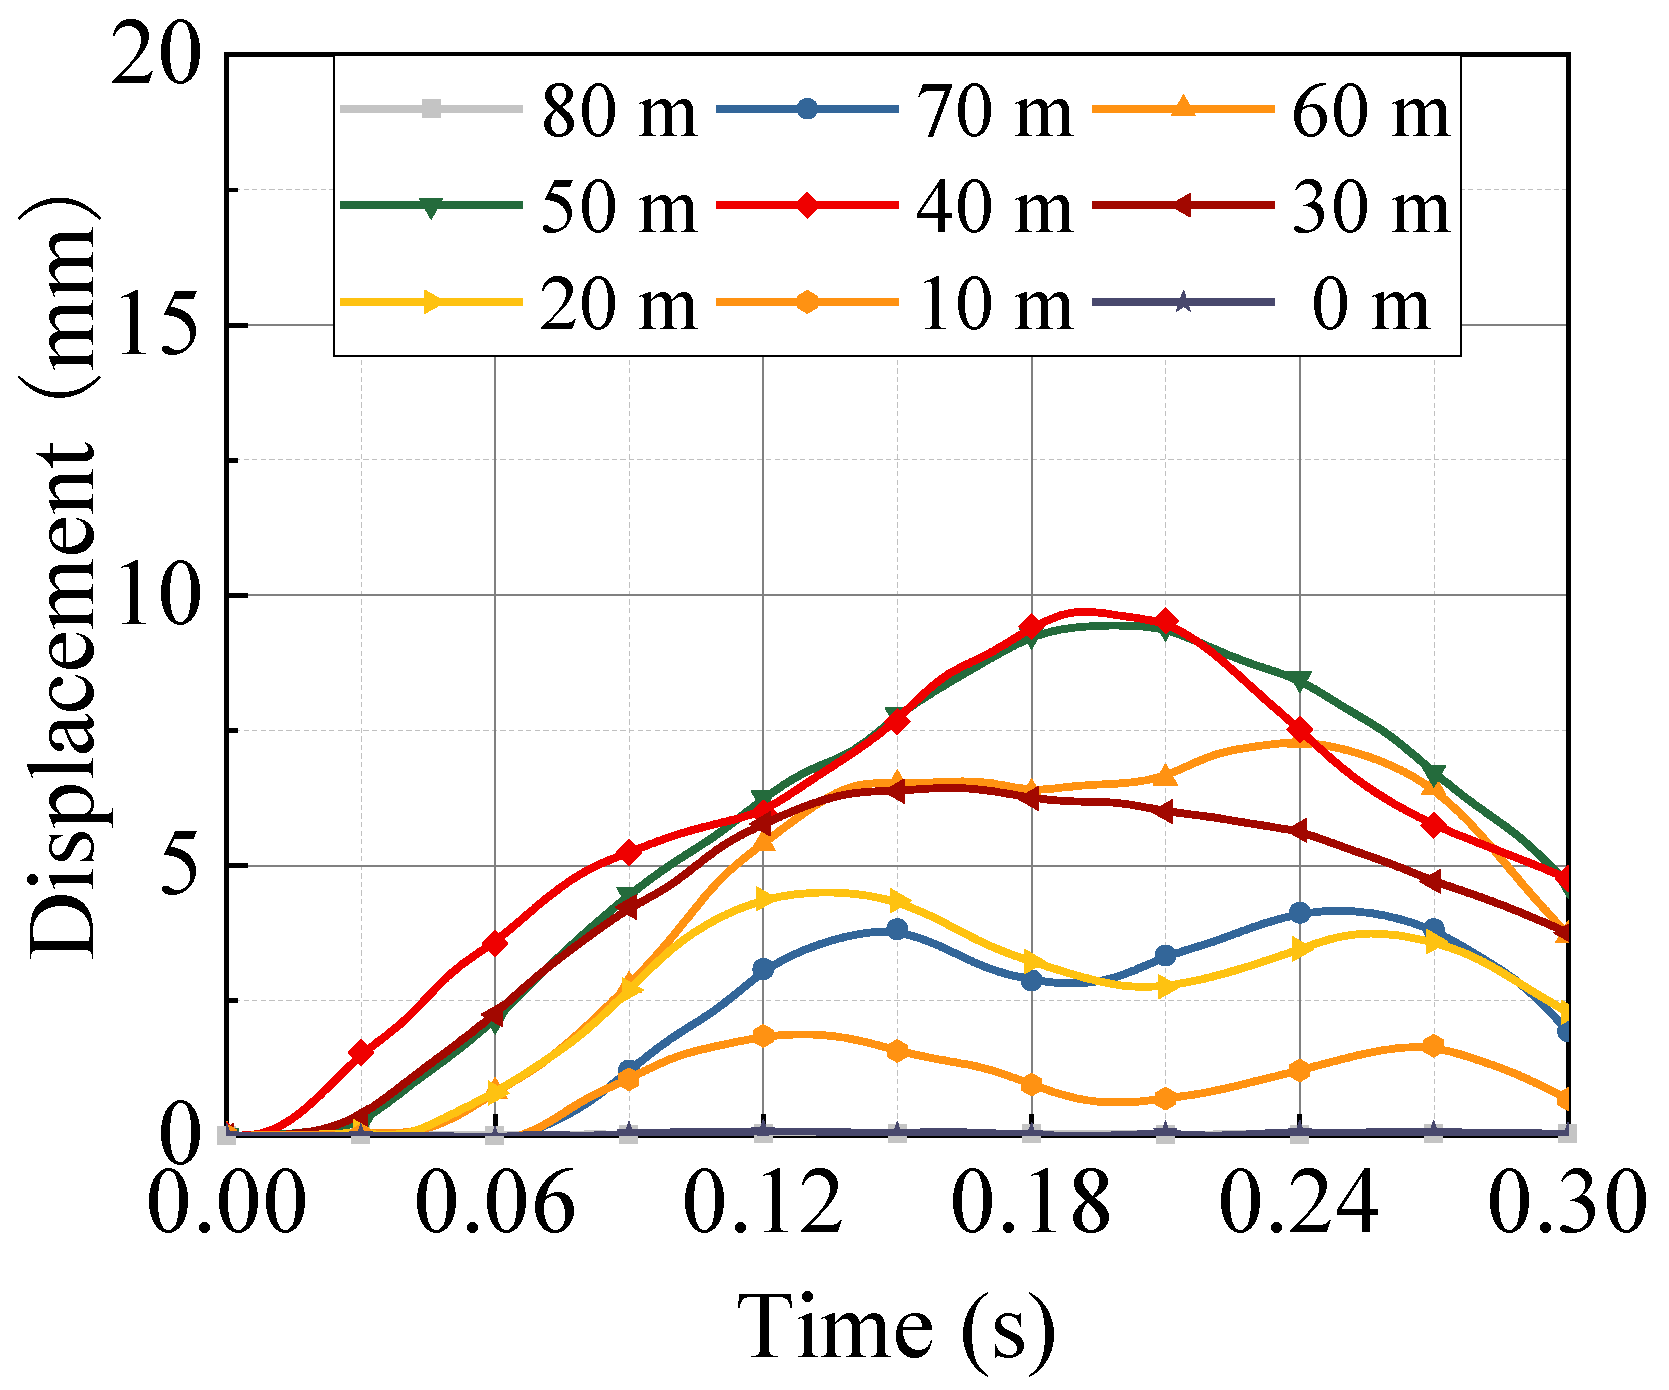
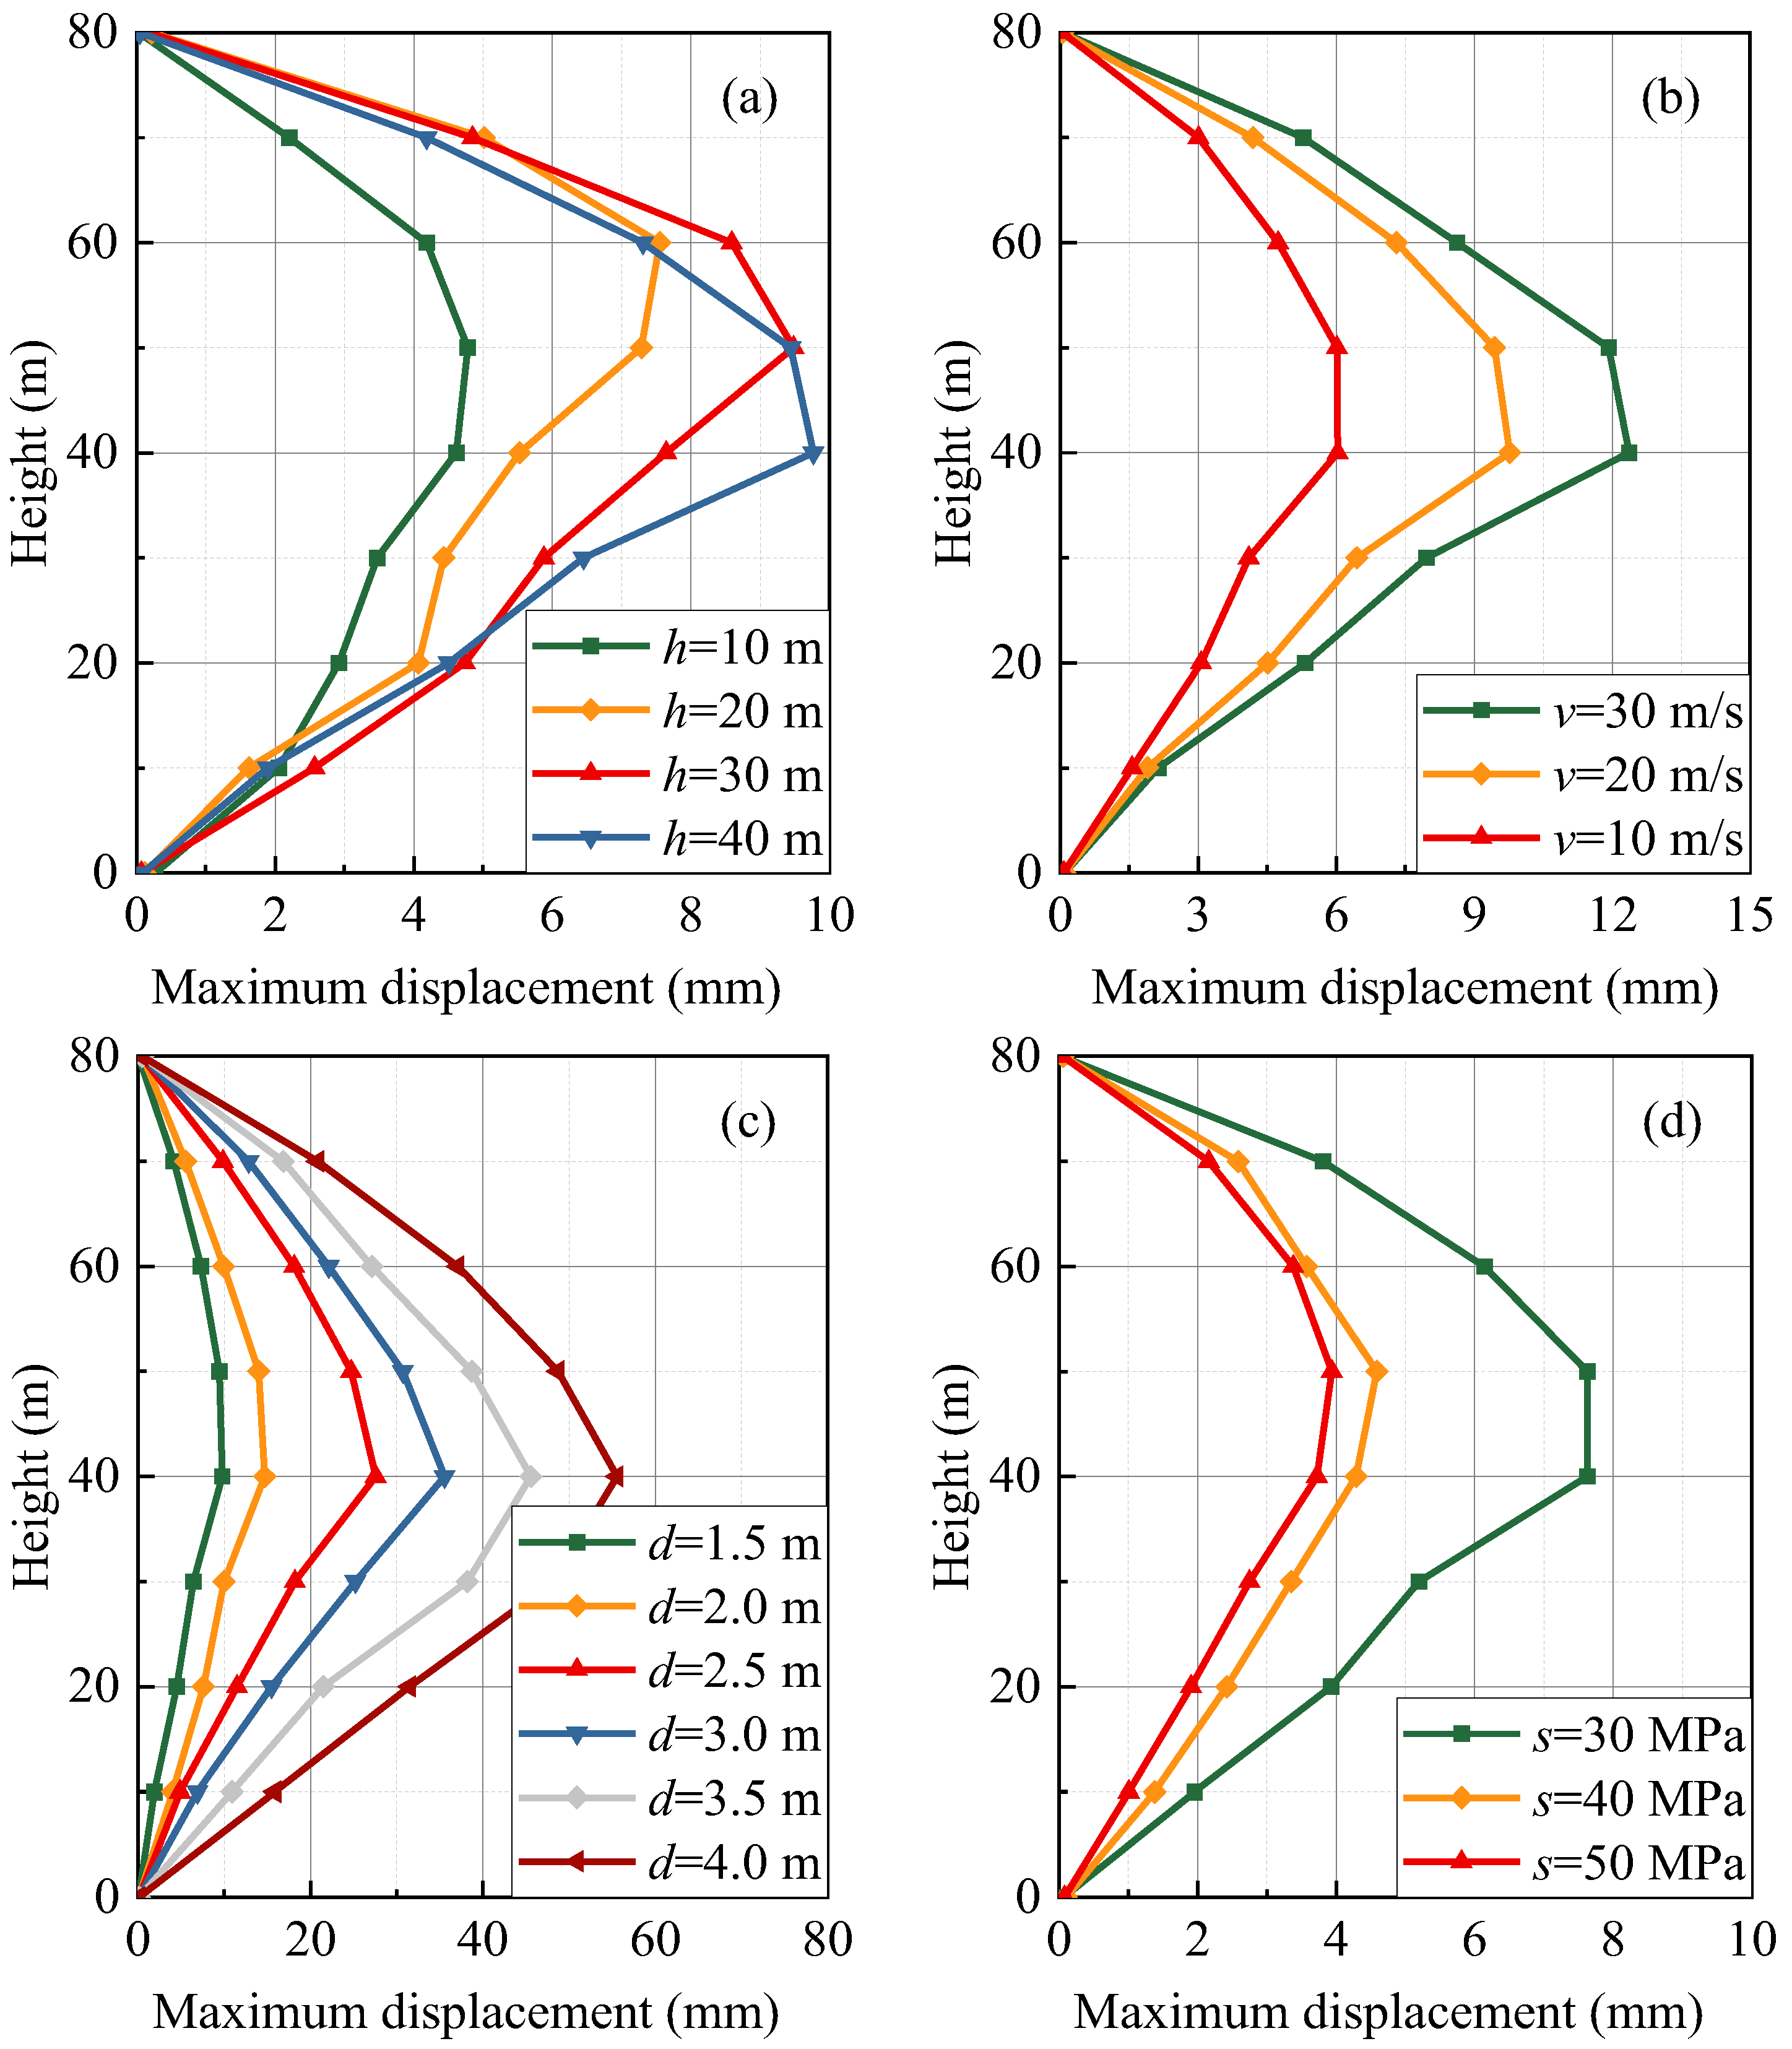
3.3. Deformation Characteristics

Figure 16 shows the displacement time history curves of each cross-section of the pier when the impact height h = 40 m, where 0 m is the pier bottom and 80 m is the pier top. After the impact, the displacement of the impacted cross-section (40 m) first increases, and then the stress wave propagates up and down from the impact position at the same speed, so the displacement of 30 m and 50 m cross-sections almost increased at the same time. It can also be found that the initial growth rate of displacement of 30 m and 50 m cross-sections is basically the same. The same phenomenon is also observed in 20-m and 60-m cross-sections and 10-m and 70-m cross-sections. The maximum displacement of the nine sections is 9.77 mm, which appears at the impacted cross-section. The maximum displacement appears at a 40-m height because the superstructure’s gravity exerts a strong constraint on the pier top. In other words, when the pier top tries to move, it must resist the huge inertial force of the superstructure.
The displacement of the top and bottom of the pier is significantly lower than that of other cross-sections, due to certain constraints. The time when the maximum displacement of the cross-sections below the impact position occurs is earlier than the cross-sections above the impact position because the upper part of the pier has greater flexibility and is more prone to deformation.
Figure 17 shows the maximum displacement of each cross-section of the pier in different cases. As shown in Figure 17, when the impact parameters change, the maximum displacement of each section of the pier appears on the back side. The displacement of the pier top and bottom is zero. due to the constraints of the superstructure and cap. In different scenarios, the maximum displacement occurs at 40 m to 60 m of the pier height. This is because the HTWBP studied in this paper has a smaller cross-section at the top and a larger cross-section at the bottom. The lower part of the pier has greater stiffness and a stronger ability to resist deformation.
As shown in Figure 17, the maximum displacement increases with impact height, impact velocity, and rockfall diameter. The maximum displacement of the bridge pier decreases with the increase in concrete strength. As shown in Figure 17a, the maximum displacement is 4.8, 7.6, 9.5, and 9.8 mm when the impact height is 10, 20, 30, and 40 m, respectively. When the impact height rises from 10 m to 40 m, the maximum displacement increases by 104.2%. This is due to the fact that the closer the impact position is to the pier top, the weaker the cross-section and, therefore, the greater the displacement. As shown in Figure 17b, when the initial impact velocity of the rockfall is 30, 20, and 10 m/s, the maximum displacement is 12.37 mm, 9.77 mm, and 6.03 mm, respectively. When the initial impact velocity of the rockfall increases from 10 to 30 m/s, the maximum displacements increase by 100.3%. As shown in Figure 17c, when the diameter of the rockfall is 1.5, 2.0 m, 2.5 m, 3.0 m, 3.5 m, and 4.0 m, the maximum displacements are 9.77, 14.7, 27.58, 35.5, 44.7, and 56.1 mm, respectively. When the diameter of the rockfall increases from 1.5 m to 4.0 m, the maximum displacement of the bridge piers increases by 474.2%. The rockfall diameter has a significant influence on the displacement of the bridge pier. When the rockfall diameter increases, the deformation of the bridge pier increases. As shown in Figure 17d, when the bridge pier concrete strength grades are 30, 40, and 50 MPa, the maximum displacements are 7.6, 4.2, and 3.9 mm, respectively. When the concrete strength grade increases from 30 to 40 MPa, the maximum displacement decreases by 44.7%. When the concrete strength grade increases from 40 to 50 MPa, the maximum displacement decreases by 7.1%. This indicates that the improvement of concrete strength grade can effectively increase the impact resistance because of the improvement in pier stiffness.

4. Damage Assessment Criterion Based on the Response Surface Model

4.1. Definition of Damage Index

Based on the damage function of the CSCM, which considers the softening and modulus reduction, the brittle damage parameter d ( τ t ) and ductile damage parameter d ( τ c ) can be calculated as follows:
d ( τ t ) = 0.999 D 1 + D 1 + D e C ( τ t τ 0 t )
d ( τ c ) = d 0 B 1 + B 1 + B e A ( τ c τ 0 c ) 1
where A, B, C and D are softening parameters; d 0 is the maximum damage level in simulation; τ t and τ c are brittle and ductile damage levels respectively; τ 0 t and τ 0 c are brittle and ductile damage thresholds respectively.
Therefore, based on the element damage factor de calculated by the CSCM, the volume damage index dv of the HTWBP volume is defined as follows:
d v = 1 n 1 n d e
d e = d ( τ t ) + d ( τ c )
where n is the total element number of the impacted pier.
Because the damage of the bridge pier is generally local and the volume of damaged concrete is small, to facilitate expression and comparison, the volume damage factor dv is normalized, and the corresponding damage index D can be expressed as follows:
D = d v d m a x
where d m a x is the maximum volume damage factor for all cases in this paper.

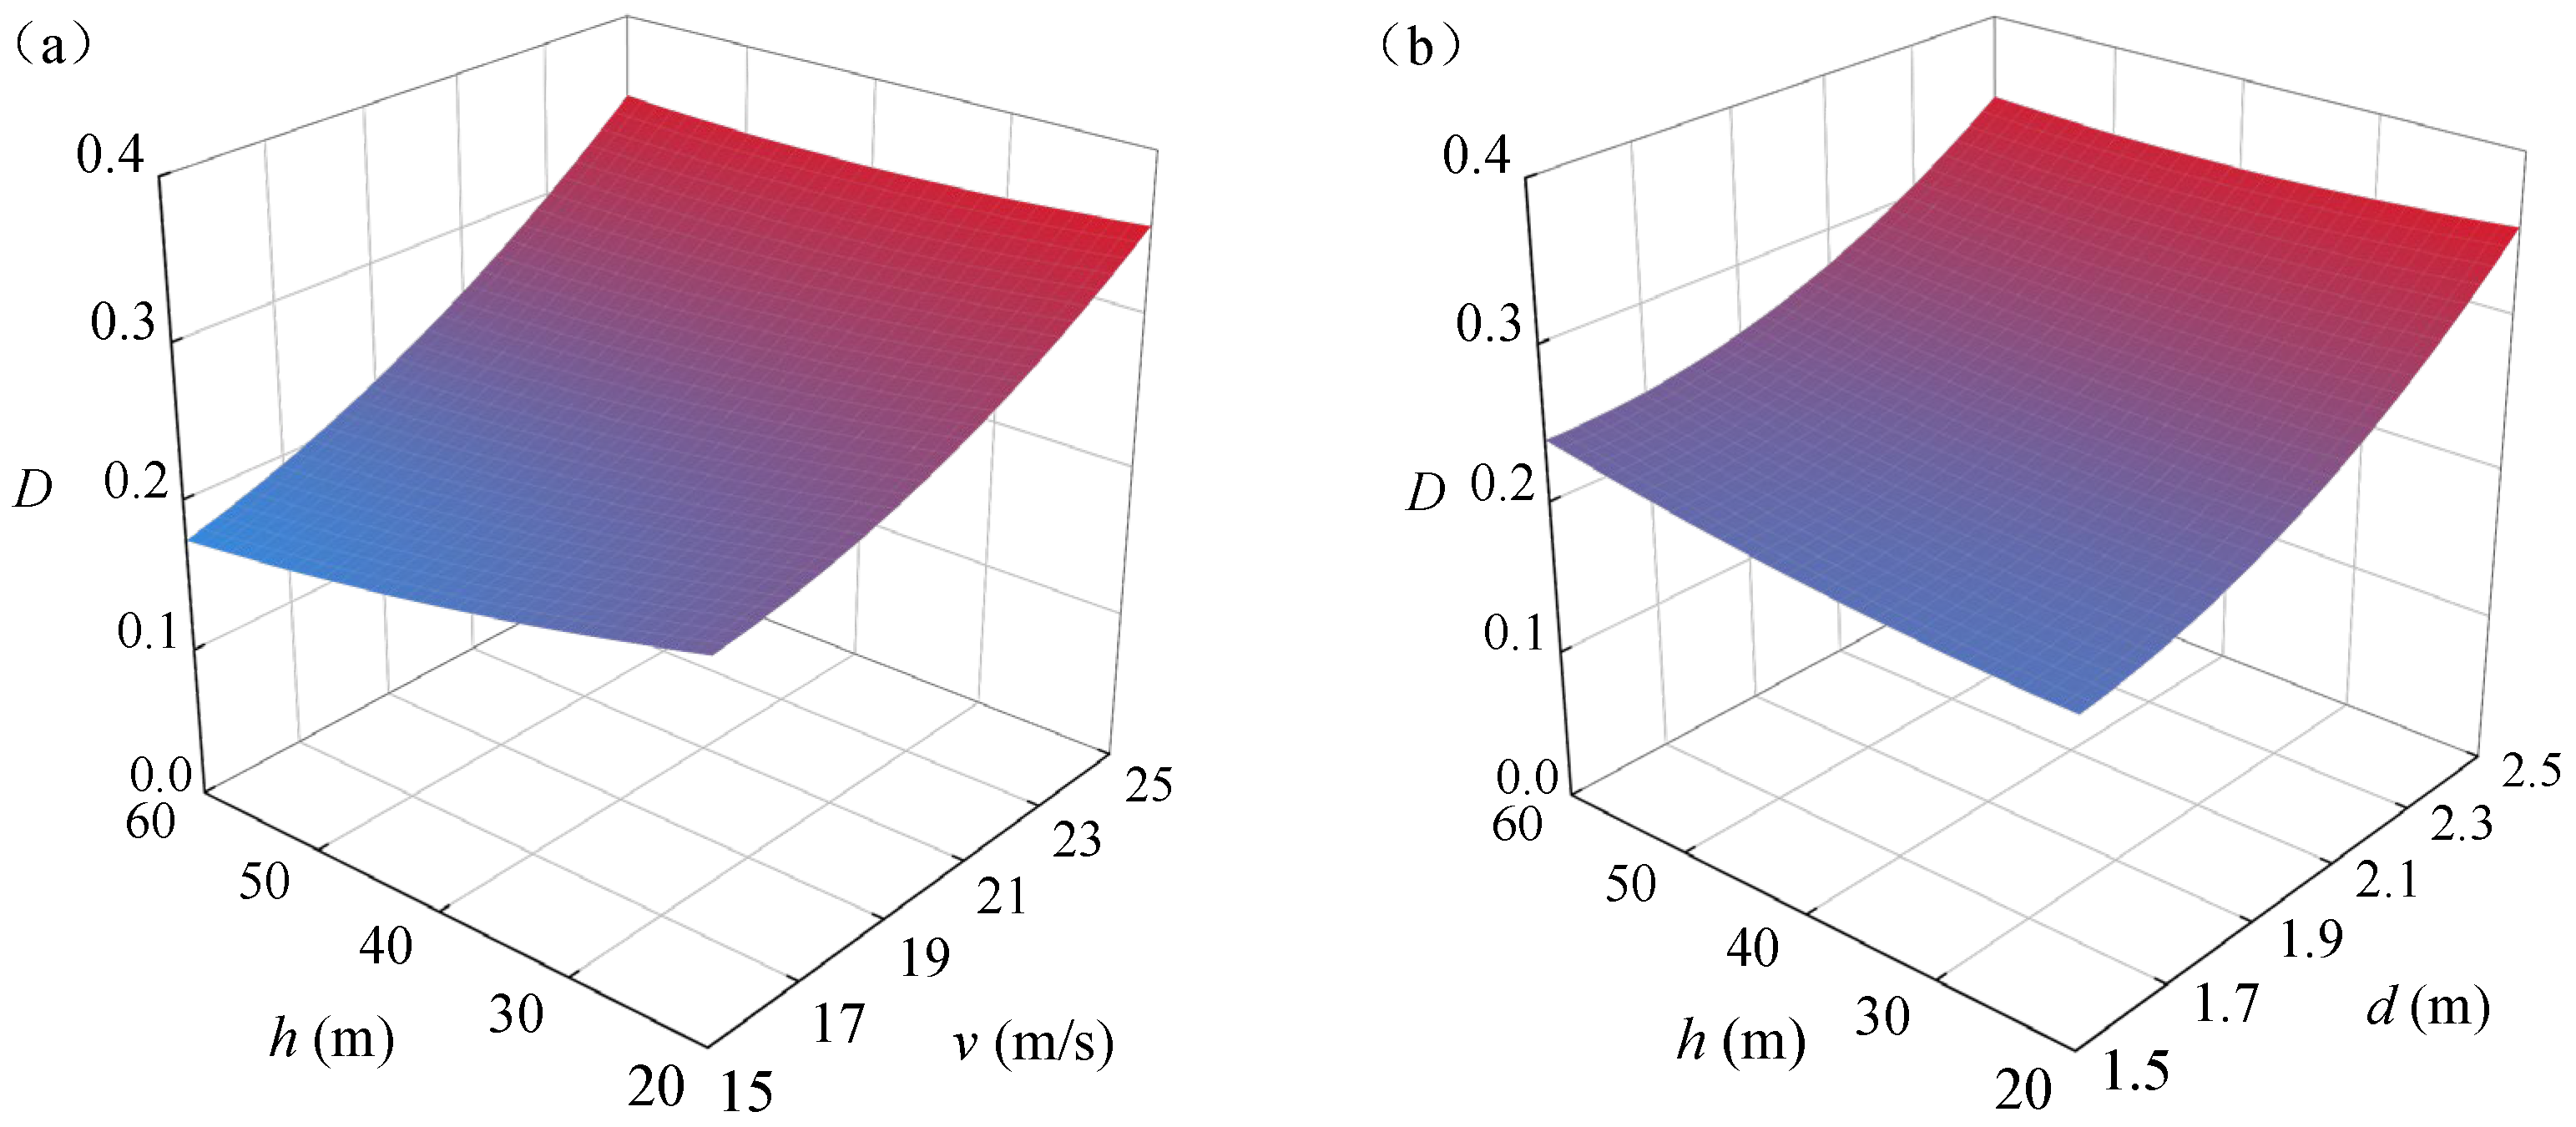
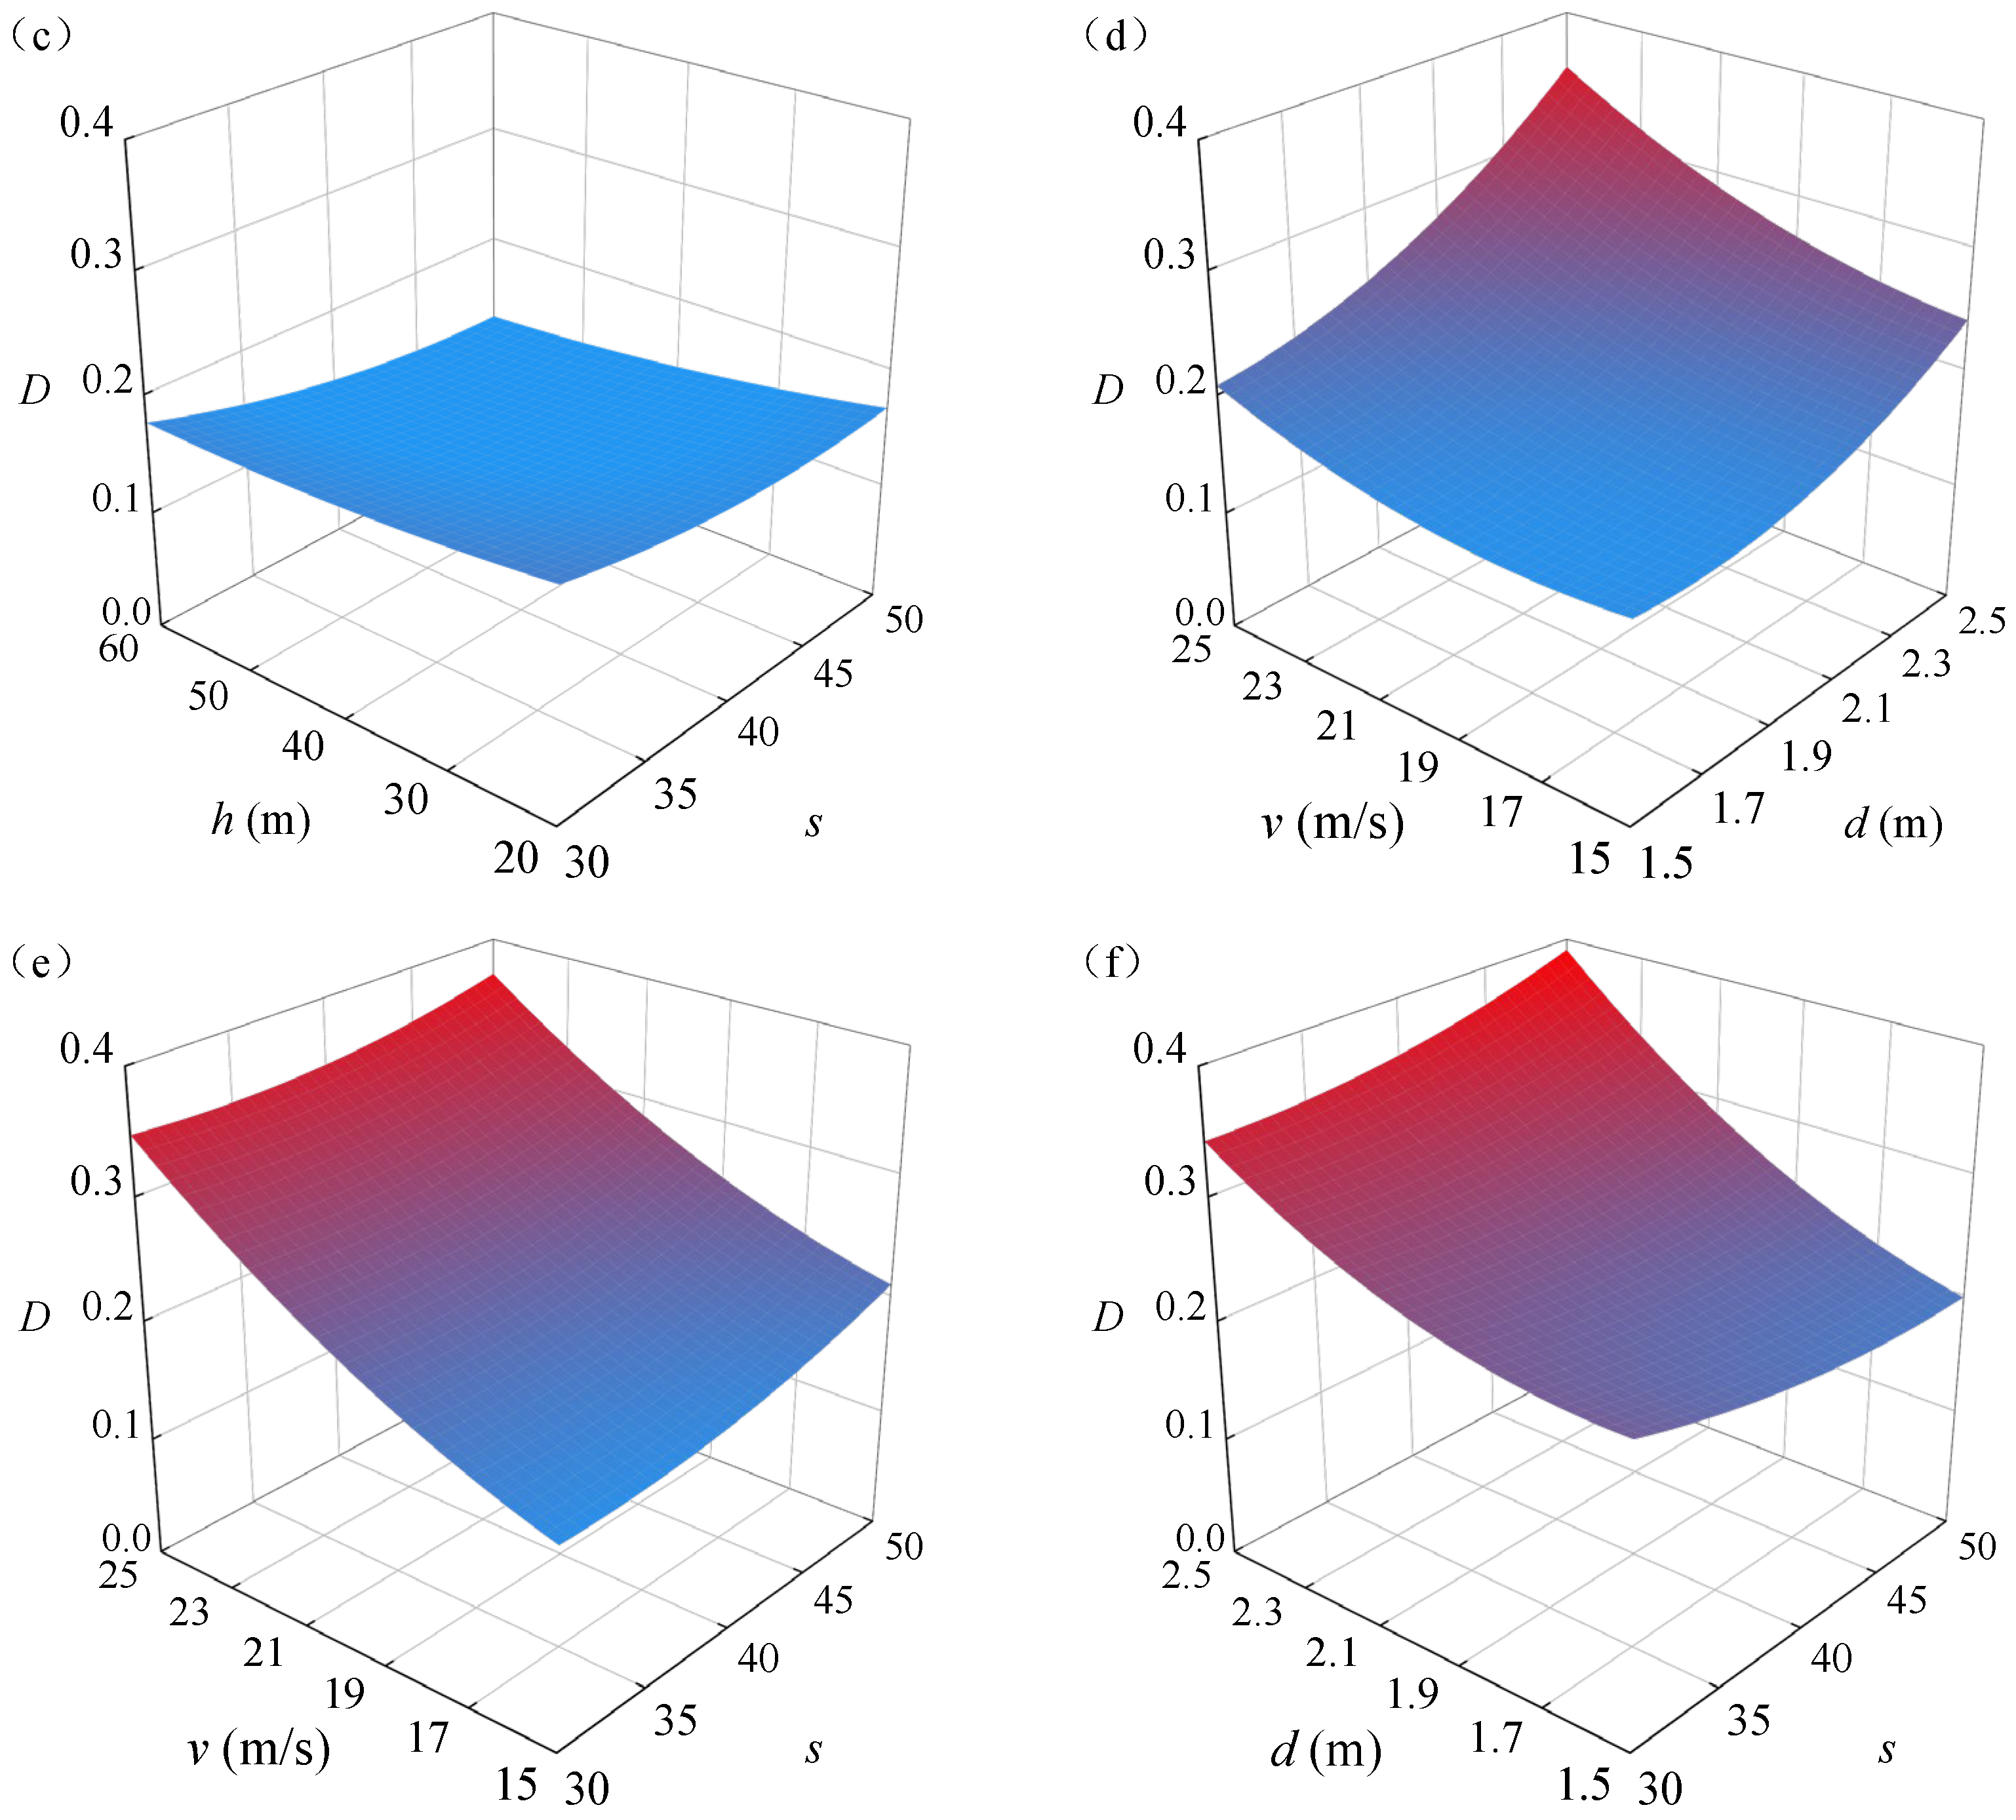
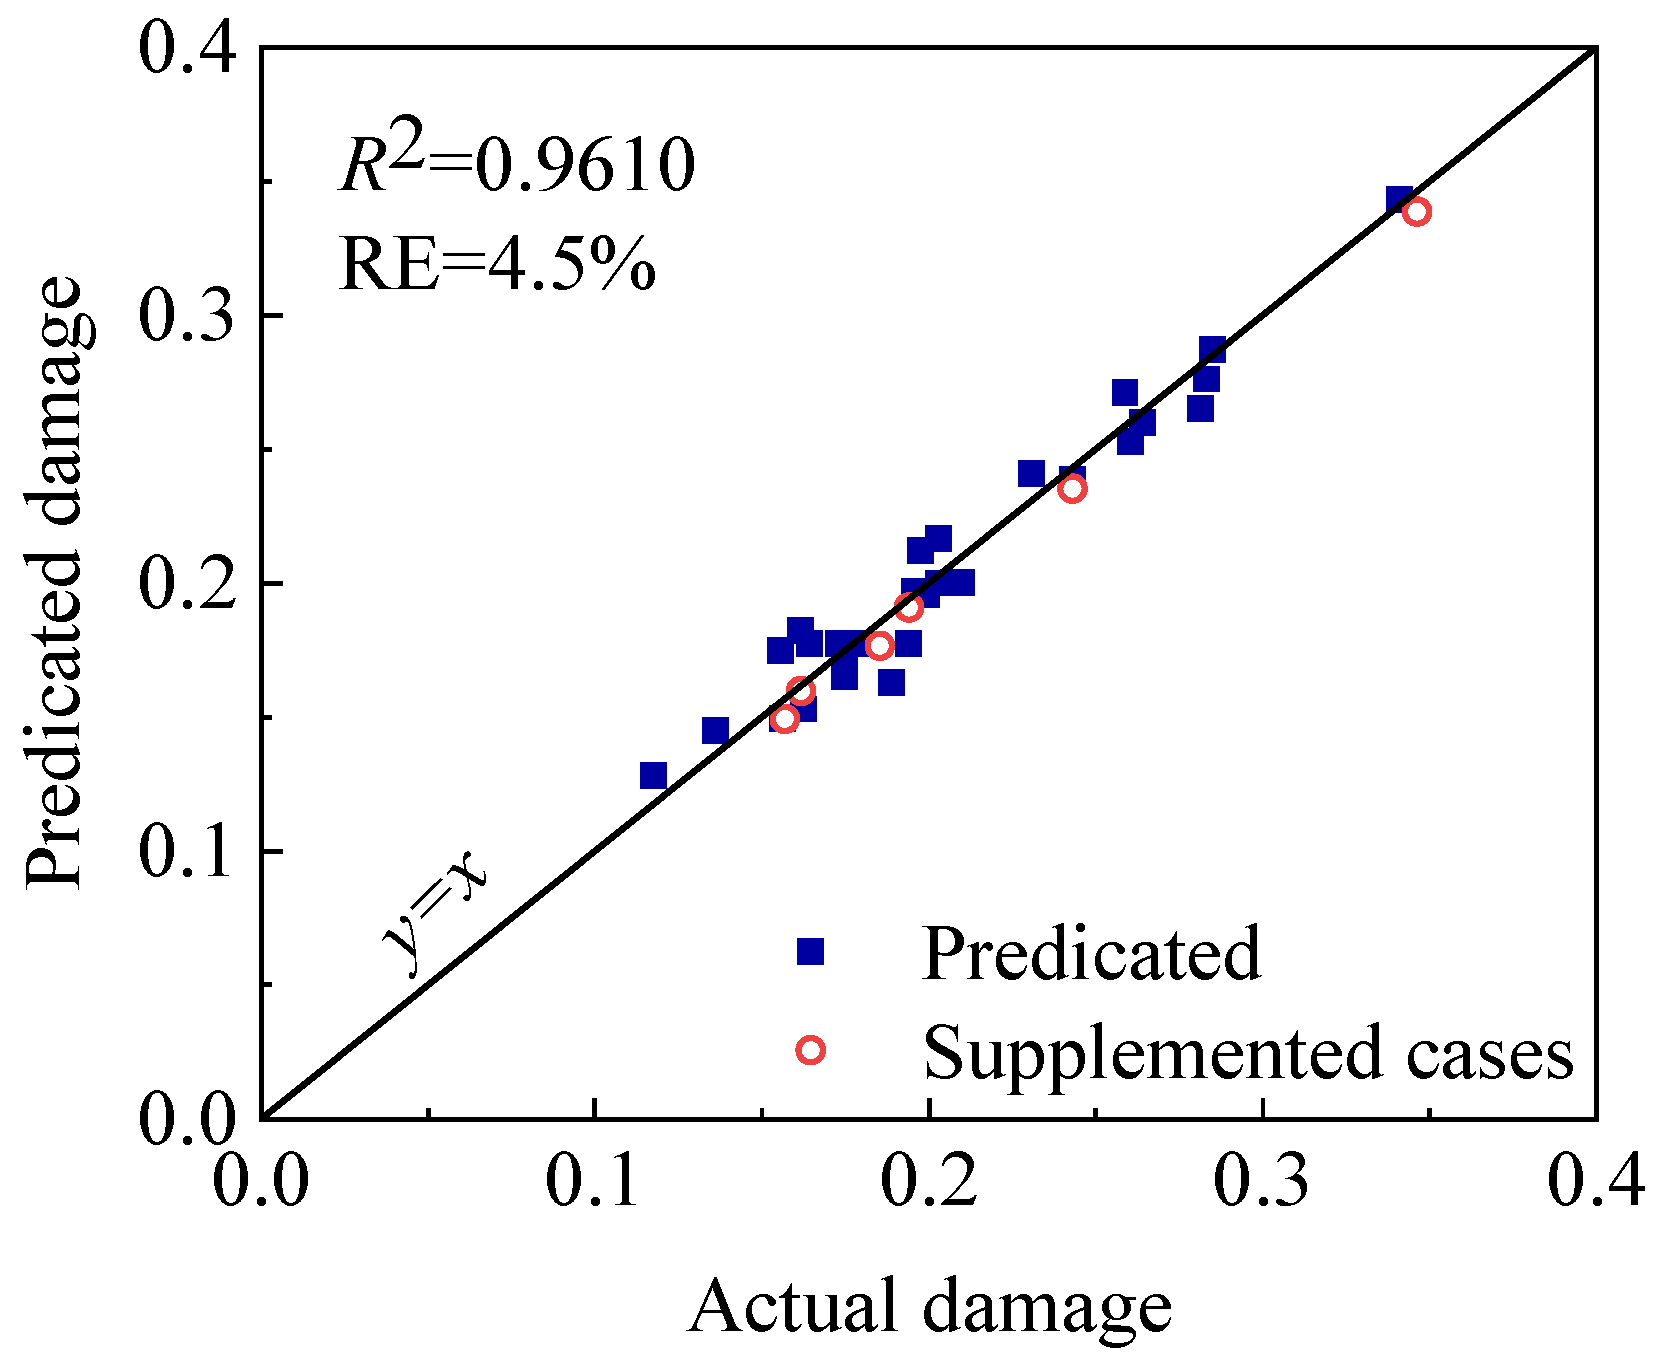
4.2. Establishment of the Response Surface Model

To improve computational efficiency, the response surface method is widely used as an alternative model in parameter sensitivity analysis and design optimization [26]. The response surface method assumes that the response of the structure can be approximated by:
y ˜ ( x ) = i = 1 n a i φ i ( x )
where y ˜ ( x ) is the structure response; φ i ( x ) is the basis function; n is the number of basis functions; a i is the response surface function coefficients.
According to the least-squares method, the response surface function coefficient is determined as:
a = ( Φ T Φ ) 1 ( Φ T y )
where a is the response surface function coefficient matrix and a = a 0 , a 1 , , a n ; Φ is the matrix formed by the sample points and is expressed as follows:
Φ = φ 1 ( x ( 1 ) ) ⋅⋅⋅ φ n ( x ( 1 ) ) φ 1 ( x ( i ) ) ⋅⋅⋅ φ n ( x ( i ) ) φ 1 ( x ( m ) ) ⋅⋅⋅ φ n ( x ( m ) )
By solving the matrix equation of the response surface random variables, the response surface function coefficients can be solved, and the response surface function, y ˜ ( x ) , can be obtained.
The response surface method incorporates many factor design methods, including the orthogonal design method, the central composite design method, and the Box–Behnken design method. To study the rockfall impact resistance of HTWBP, if the complete factorial design is adopted for the four parameters of three levels, then a total of 34 = 81 FE simulations need to be involved. Hence, the Box–Behnken design is adopted to reduce the number of FE simulations and improve the computational efficiency of sensitivity analysis. Table 5 shows the factors and levels of Box–Behnken design in this section. According to the Box–Behnken design in Table 5, the corresponding cases and damage results are listed in Table 6. According to the data in Table 6, the response surface model can be expressed as Equation (13).
d v = 10 6 × 7926 + 8.5625 h 222.45 v 3687.834 d 95.49167 s + 0.845 h v 5.75 h d 0.18125 h s + 40.9 v d 0.6 v s + 26.8 d s + 0.09927084 h 2 + 4.808334 v 2 + 636.8334 d 2 + 0.762083 s 2
Figure 18 shows the damage response surfaces with different parameters, obtained from the response surface model expressed in Equation (13). In each subfigure, the influence of two parameters is presented and other parameters are fixed at level 0, as listed in Table 5. As shown in Figure 18, different parameters have dissimilar effects on the damage indices when they are impacted by rockfalls. As shown in Figure 18a,b, with the increase in the initial impact velocity and rockfall diameter, the damage factor increases significantly, and the influence of the initial impact velocity and rockfall diameter is greater than the impact height. As shown in Figure 18c, with the increase in the impact height and concrete strength, the damage factor of the HTWBP slightly changes. As shown in Figure 18e,f, the damage factor increases significantly with the increase in the initial impact velocity and diameter of rockfall, which is more significant than that of the concrete strength. It can be seen from the six response surfaces in Figure 18 that the initial impact velocity and diameter of the rockfall are the most significant parameters affecting the damage indices, followed by the impact height and concrete strength, i.e., v d > h s .
Six FE models are supplemented to further verify the accuracy of the established response surface model, as listed in Table 7. The damage index, calculated by using the FE model and predicted by the RSM, is also compared in Table 7 and Figure 19. The determination coefficient, R2, and relative error (RE) are used to evaluate the accuracy of the model. As listed in Table 7 and shown in Figure 19, the maximum difference between the FE model and predicated by the RSM is only 4.8%. The determination coefficient R2 value is 0.9610, which is close to 1.0, and the average RE is only 4.5%. Therefore, the response surface model established expressed in Equation (13) shows high competence in predicting the damage of HTWBP after rockfall impact.

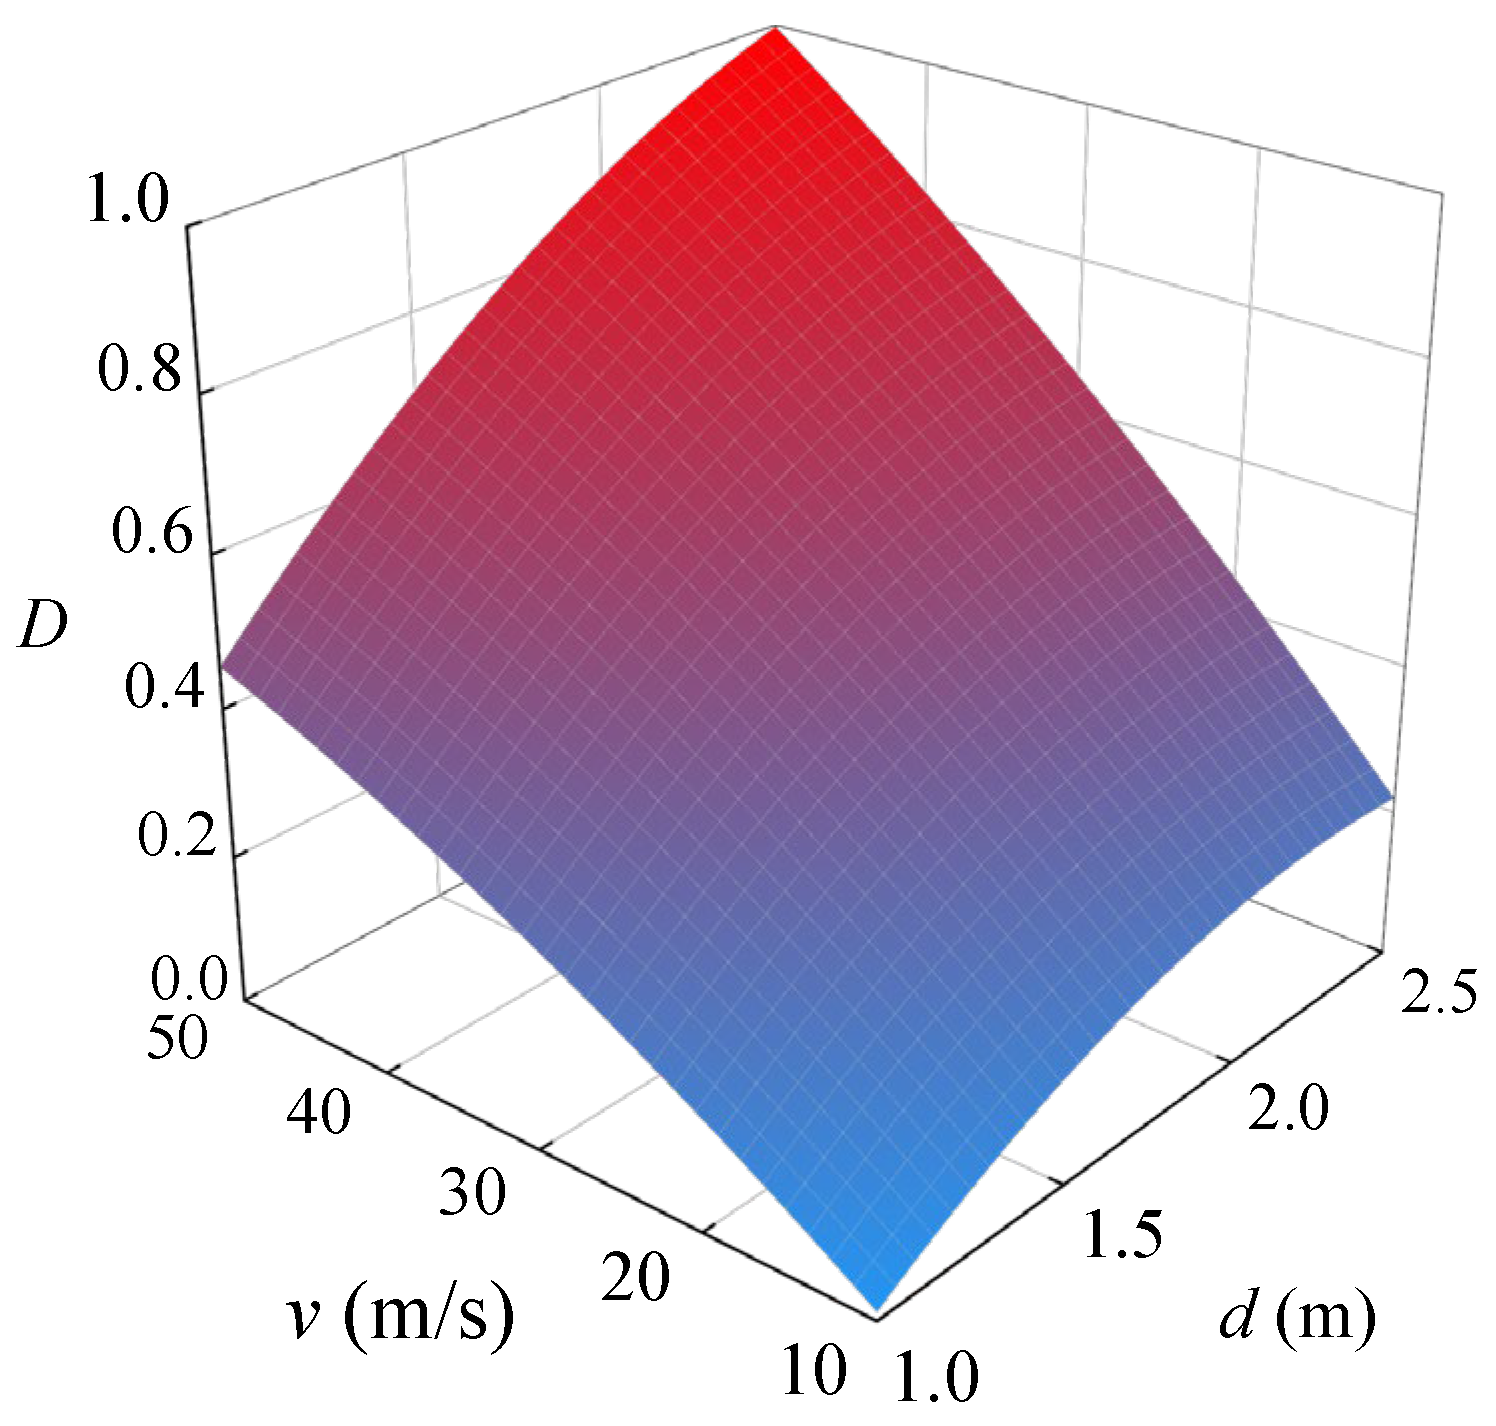
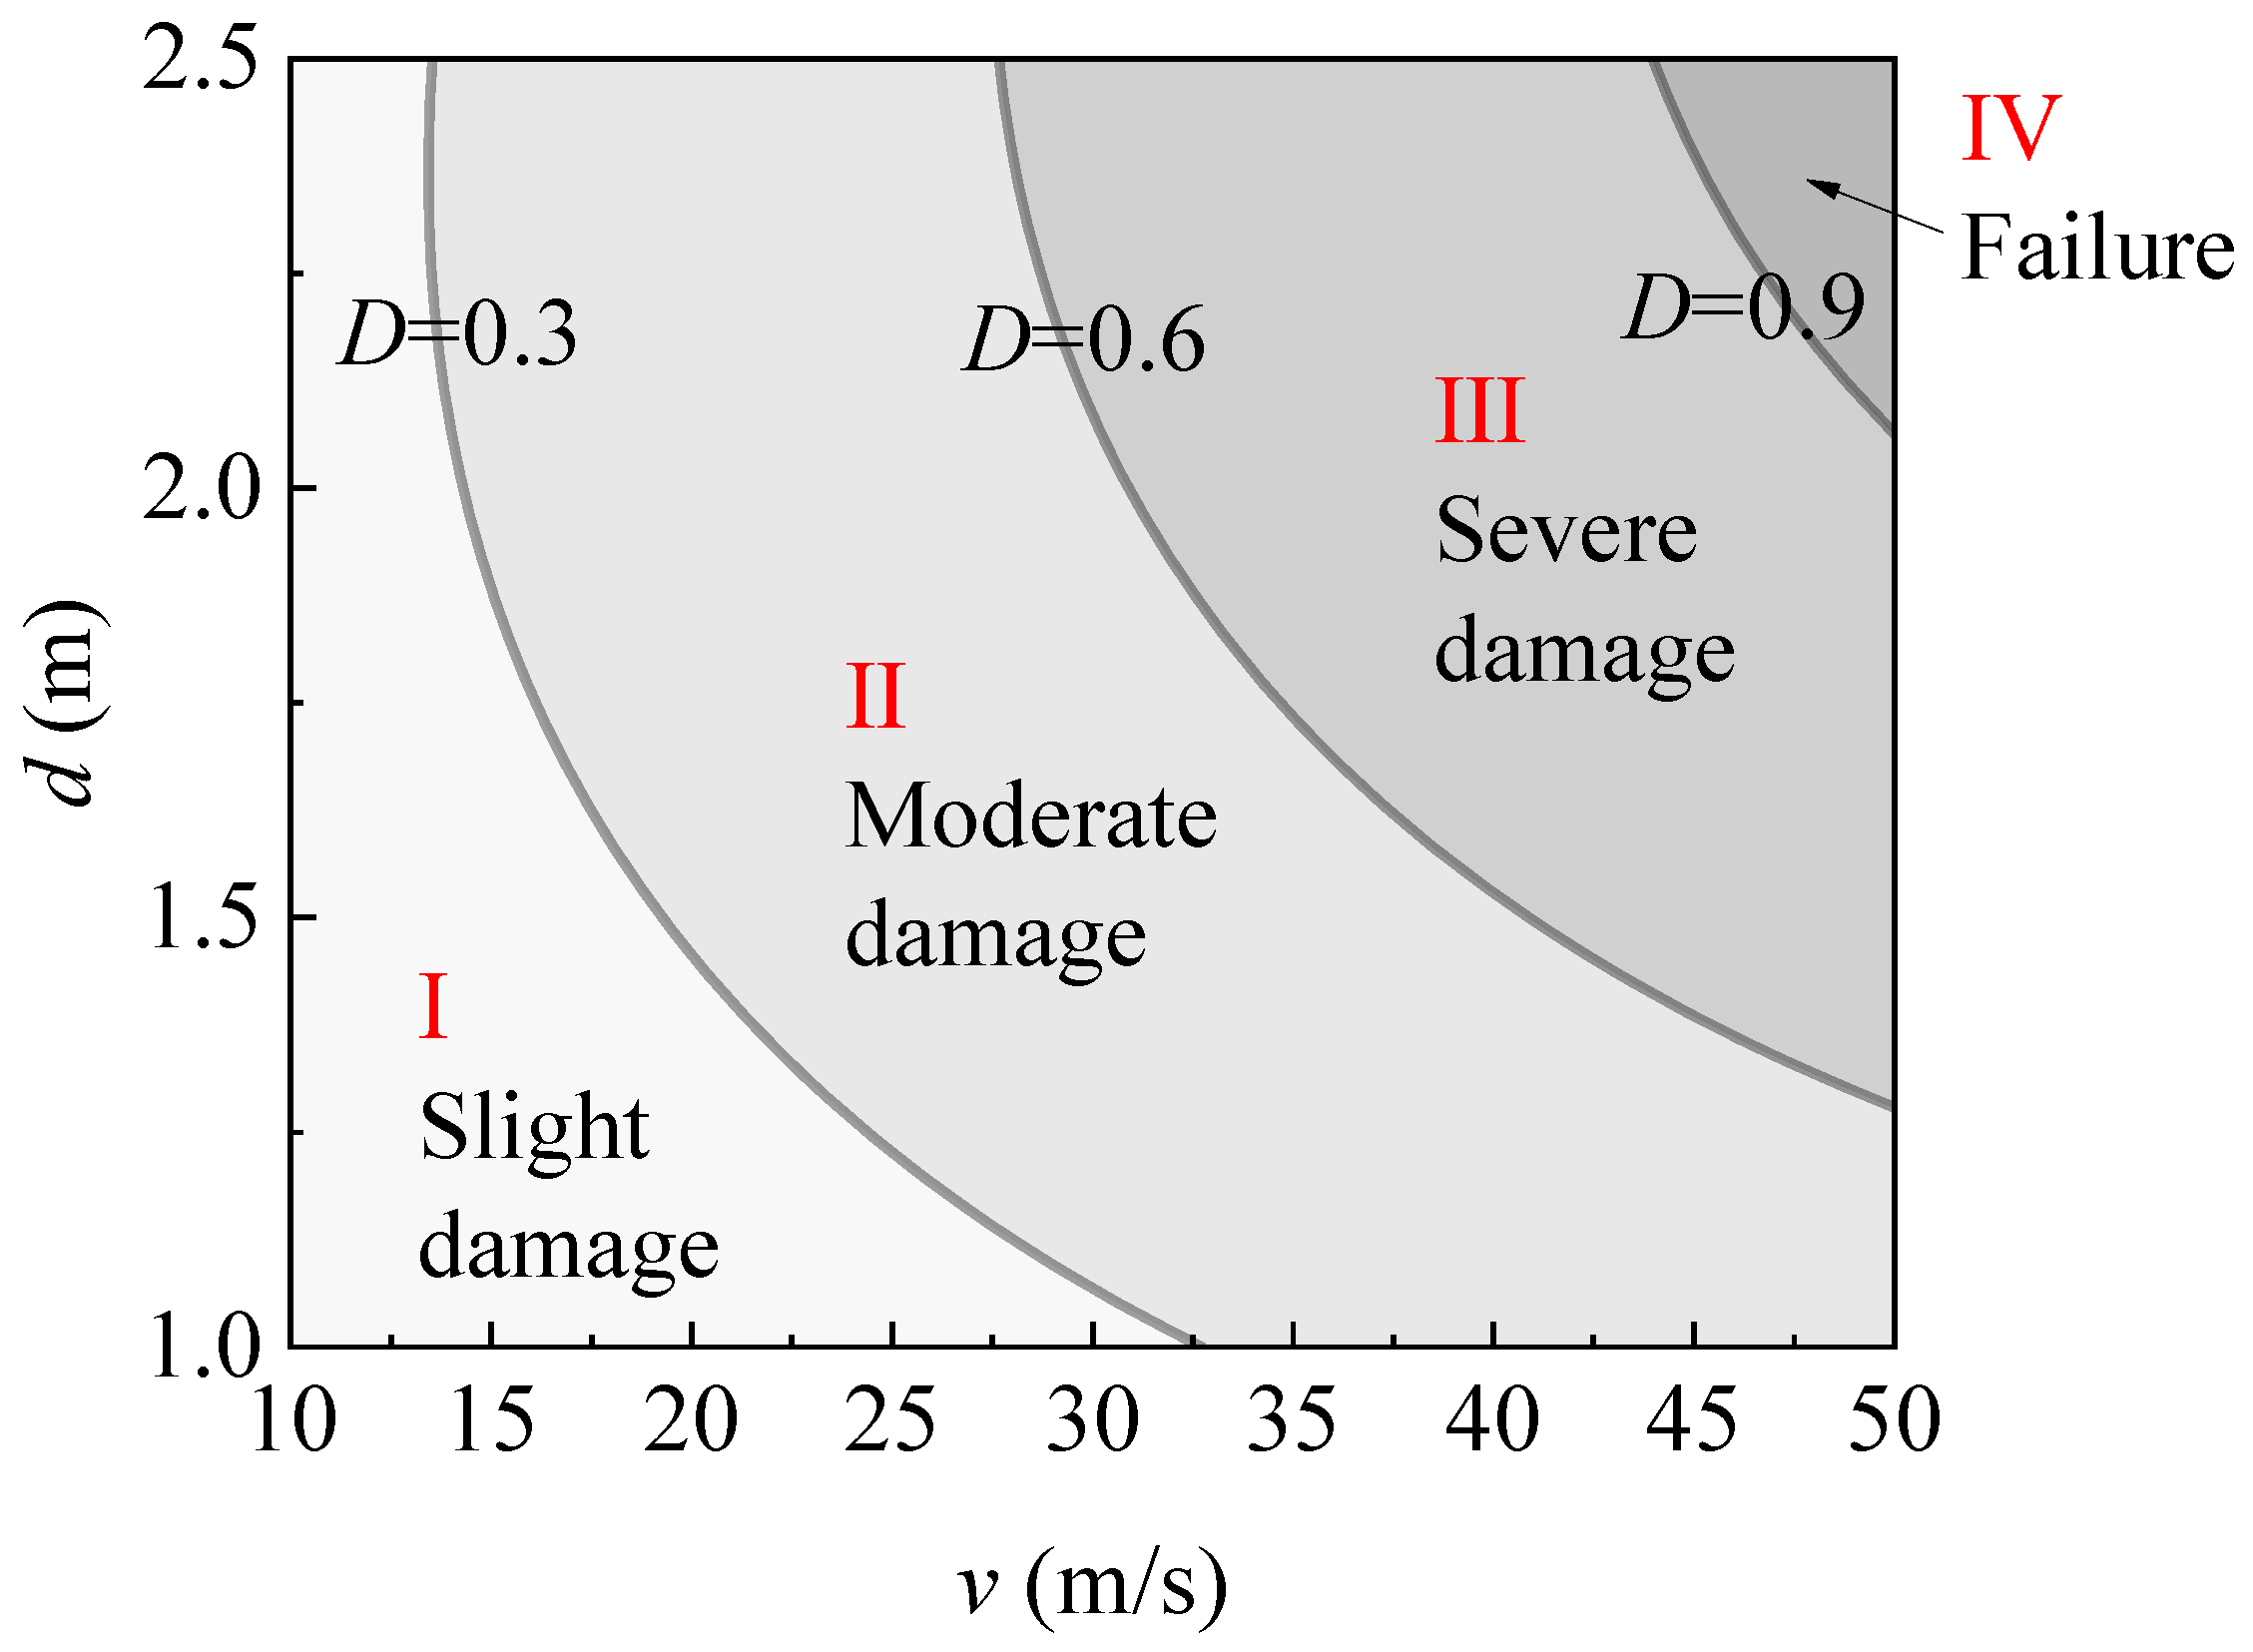
4.3. Damage Assessment Method

Considering the impact velocity and rockfall diameter are the most influential parameters on the damage, the two parameters are used as the controlling parameters of the damage assessment method. In this section, a central composite design is used to expand the parameter range of controlling parameters and establish the damage assessment curve. The central composite design is the most commonly used second-order design method in response surface analysis. On the basis of a two-level factor design, a small number of center points and star points are added to make each factor have five levels for the response surface analysis.
The impact height is set at 40 m, and the strength grade is set at 30 MPa. Table 8 shows the factors and levels of the central composite design in this section. According to the central composite design in Table 8, corresponding cases and damage results are listed in Table 9. According to the damage results in Table 9, the response surface function can be expressed as Equation (14). Figure 20 shows the response surface of the damage index under different impact velocities and rockfall diameters. As shown in Figure 20, the damage index significantly increases with the increase in impact velocity and rockfall diameter. This phenomenon is consistent with the aforementioned results.
D = 0.55 + 0.011 v + 0.532 d + 0.0056 v d 0.001 v 2 0.128 d 2
The damage index of the HTWBP under rockfall impact is divided into four levels, with 0.3, 0.6, and 0.9 as the critical value of damage, respectively. Figure 21 shows the damage zoning diagram obtained according to Equation (14), where the ordinate is the rockfall diameter and the abscissa is the impact velocity of rockfall. As shown in the figure, three damage assessment curves divide the area into four parts: a slight damage area ( D 0.3 ), a moderate damage area ( 0.3 < D 0.6 ), a severe damage area ( 0.6 < D 0.9 ), and a failure area ( D > 0.9 ). With the damage zoning diagram, a fast assessment of the damage level of impacted HTWBP can be realized, according to rockfall diameter and velocity after rockfall impact.

5. Discussion

In this research, the rockfall impact simulation is conducted against the HTWBP, with the rockfall diameter ranging from 1.5 m–4.0 m and the rockfall velocity ranging from 10 m/s–30 m/s. The material parameters are obtained from a previous study, wherein solid piers with circular and square cross-sections are impacted by the rockfall with diameters of 1.2 m, 1.5 m, and 1.8 m, and velocities of 5 m/s, 10 m/s, 15 m/s and 20 m/s [1]. To obtain a deeper insight into the rockfall-pier impact performance, the results of this study and Ref. [1] are compared here for the calculation when the rockfall diameter is 1.5 m and velocity is 10 m/s. The peak impact force of this study and that of Ref. [1] are listed in Table 10.
The qualitative similarity between this study and Ref. [1] is that when the pier is impacted by a rockfall, the impact force shows an impulse characteristic; the duration of the impulse load is approximately 0.01 s. This similarity signals that the cross-section type does not influence the time-history characteristic of the impact force.
The quantitative similarity between this study and Ref. [1] is that, as listed in Table 10, the difference in the peak impact force between this study and Ref. [1] is quite close (less than 10%), indicating that the simulation results of this research are credible. In addition, the similar results between this research and the literature may also imply that the biggest difference between an HTWBP and a solid pier is the damage and deformation characteristic.
When heavy rainfalls, earthquakes, and debris flows happen, a large number of rockfalls may impact the bridge in a short time. Therefore, Figure 22 compares the damage pattern of the HTWBP when impacted by a single rockfall and double rockfalls at the same time. In the single-rockfall case (C9), the rockfall diameter is 3.0 m and the impact height is 40 m. In the double-rockfall case, the impact height is 30 and 40 m. The other parameters of the two cases are the same. As shown in Figure 22, the elliptic damage area of the pier near the two rockfalls connects when impacted by two rockfalls. Compared with the single-rockfall case, the damage extent of the HTWBP in the double-rockfall scenario is more severe at the impact area and the pier bottom because the impact energy is higher.

6. Conclusions

In the current research, ANSYS/LS-DYNA is used to establish a high-precision rockfall-HTWBP model. The impact force, damage, and dynamic response characteristics of HTWBP under the rockfall impact are studied. A damage assessment method with a damage zoning diagram based on the response surface method is established. The main conclusions are as follows:
(1)
The impact force of rockfalls has a considerable impulse characteristic, and the duration of the impulse load is approximately 0.01 s. When the impact position is closer to the pile cap, the pier is constrained more strongly, and the corresponding peak impact force is larger. The peak impact force increases with the increase in impact velocity, rockfall diameter, and concrete strength. When the concrete strength grade increases from 30 MPa to 50 MPa, the peak impact force only increases by approximately 5%.
(2)
The impacted surface is dominated by the final elliptic damage with the conical and strip damage areas as the symmetry axis. At the side surface, the damage develops from a triangular damage area into a radial damage area across the side surface of the pier. The cross-sectional damage mode is compression failure in the impact area and shear failure at the corner.
(3)
The displacement of the top and bottom of the pier is significantly lower than that of other cross-sections due to constraints. The time when the maximum displacement occurs of the cross-sections below the impact position is earlier than the cross-sections upper the impact position because the upper part of the pier has greater flexibility and is more prone to deformation.
(4)
The maximum displacement occurs in the middle height of the pier. This is because the HTWBP has a smaller cross-section at the top and a larger cross-section at the bottom. The lower part of the pier has a larger stiffness and a stronger ability to resist deformation. The maximum displacement increases with impact height, impact velocity, and rockfall diameter and decreases with the uniaxial compressive strength of the concrete.
(5)
The initial impact velocity and diameter of the rockfall are the most remarkable parameters affecting the damage indices. The damage assessment method with a damage zoning diagram based on the response surface method is established. With the proposed damage assessment method with a damage zoning diagram, the fast assessment of the damage level of impacted HTWBP can be realized according to rockfall diameter and velocity after rockfall impact.

7. Limitations

The current simulation only considers four parameters. More relevant parameters should be considered in future research. In addition, when heavy rainfalls, earthquakes, and debris flows happen, a large number of rockfalls may impact the bridge in a short time. Therefore, future research should consider multiple rockfalls impacting the bridge at the same time and in sequence.

Author Contributions

Conceptualization, F.L.; fata curation, F.L.; formal analysis, F.L. and Y.L.; funding acquisition, J.Y.; investigation, Y.L.; methodology, F.L.; writing—original draft, Y.L.; writing—review and editing, F.L. and J.Y. All authors have read and agreed to the published version of the manuscript.

Funding

This research was funded by the Hunan Natural Science Foundation, China (Project Grant No. 2018JJ2526) and the Natural Science Foundation of Science and Technology Planning Project of Gansu Province, China (Grant No. 20JR10RA132).

Conflicts of Interest

The authors declare no conflict of interest.

References

  1. Xie, R.; Fan, W.; Liu, B.; Shen, D. Dynamic behavior and vulnerability analysis of bridge columns with different cross-sectional shapes under rockfall impacts. Structures 2020, 26, 471–486. [Google Scholar] [CrossRef]
  2. Zhang, X.; Wang, X.; Chen, W.; Wen, Z.; Li, X. Numerical study of rockfall impact on bridge piers and its effect on the safe operation of high-speed trains. Struct. Infrastruct. Eng. 2021, 17, 1–19. [Google Scholar] [CrossRef]
  3. Consolazio, G.R.; Cook, R.A.; McVay, M.C.; Cowan, D.; Biggs, A.; Bui, L. Barge Impact Testing of the St. George Island Causeway Bridge, Phase III: Physical Testing and Data Interpretation; The National Academies of Sciences, Engineering, and Medicine: Washington, DC, USA, 2006. [Google Scholar]
  4. Buth, C.E.; Brackin, M.S.; Williams, W.F.; Fry, G.T. Collision Loads on Bridge Piers: Phase 2, Report of Guidelines for Designing Bridge Piers and Abutments for Vehicle Collisions; Texas Transportation Institute: College Station, TX, USA, 2011. [Google Scholar]
  5. He, S.; Yan, S.; Deng, Y.; Liu, W. Impact protection of bridge piers against rockfall. Bull. Eng. Geol. Environ. 2019, 78, 2671–2680. [Google Scholar] [CrossRef]
  6. Sun, X.; Bi, Y.; Zhou, R.; Zhao, H.; Fu, X.-L.; Zhao, P.; Jiang, Z.Y. Experimental Study on the Damage of Bridge Pier under the Impact of Rockfall. Adv. Civ. Eng. 2021, 2021, 6610652. [Google Scholar] [CrossRef]
  7. Bertrand, D.; Kassem, F.; Delhomme, F.; Limam, A. Reliability analysis of an RC member impacted by a rockfall using a nonlinear SDOF model. Eng. Struct. 2015, 89, 93–102. [Google Scholar] [CrossRef]
  8. Ventura, A.; De Biagi, V.; Chiaia, B. Effects of rockfall on an elastic-plastic member: A novel compliance contact model and dynamic response. Eng. Struct. 2017, 148, 126–144. [Google Scholar] [CrossRef]
  9. Deng, L.; Wang, F.; He, W. Dynamic Impact Factors for Simply-Supported Bridges Due to Vehicle Braking. Adv. Struct. Eng. 2015, 18, 791–801. [Google Scholar] [CrossRef]
  10. Deng, L.; Yan, W.; Zhu, Q. Vehicle Impact on the Deck Slab of Concrete Box-Girder Bridges due to Damaged Expansion Joints. J. Bridge Eng. 2016, 21, 06015006. [Google Scholar] [CrossRef]
  11. Yu, Y.; Deng, L.; Wang, W.; Cai, C.S. Local impact analysis for deck slabs of prestressed concrete box-girder bridges subject to vehicle loading. J. Vib. Control. 2017, 23, 31–45. [Google Scholar] [CrossRef]
  12. Do, T.V.; Pham, T.M.; Hao, H. Proposed design procedure for reinforced concrete bridge columns subjected to vehicle collisions. Structures 2019, 22, 213–229. [Google Scholar] [CrossRef]
  13. Shi, Y.; Hao, H.; Li, Z.-X. Numerical derivation of pressure-impulse diagrams for prediction of RC column damage to blast loads. Int. J. Impact Eng. 2008, 35, 1213–1227. [Google Scholar] [CrossRef]
  14. Fan, W.; Liu, B.; Consolazio, G.R. Residual Capacity of Axially Loaded Circular RC Columns after Lateral Low-Velocity Impact. J. Struct. Eng. 2019, 145, 04019039. [Google Scholar] [CrossRef]
  15. Wang, S.; Xu, W.; Huang, X.; Yan, X.; Ma, J.; Sun, H.; Wang, J.; Chen, Y. Research on the Pounding Response and Pounding Effect of a Continuous Rigid-Frame Bridge with Fabricated Super-High Piers Connected by Grouting Sleeves. Sustainability 2022, 14, 11334. [Google Scholar] [CrossRef]
  16. Zeng, X.; Deng, K.; Wang, Y.; Yan, G.; Zhao, C. Field Investigation and Numerical Analysis of Damage to a High-pier Long-span Continuous Rigid Frame Bridge in the 2008 Wenchuan Earthquake. J. Earthqu. Eng. 2021, 26, 5204–5220. [Google Scholar] [CrossRef]
  17. Wang, Y.; Liang, S.; Huang, C.; Wang, R. Foundation Settlement Response of Existing High-Speed Railway Bridge Induced by Construction of Undercrossing Roads. Sustainability 2022, 14, 8700. [Google Scholar] [CrossRef]
  18. Li, F.; Sun, R.; Zhang, Y.; Wang, G.; Xiang, G. Dynamic Response Characteristics and Damage Evolution of Multi-Layer Combined Coal and Rock Mass under Impact Loading. Sustainability 2022, 14, 9175. [Google Scholar] [CrossRef]
  19. Li, P.; Li, T.; Lu, Z.; Li, J. Study on Dynamic Response of Novel Masonry Structures Impacted by Debris Flow. Sustainability 2017, 9, 1122. [Google Scholar] [CrossRef]
  20. Tan, B. Experimental Study on Damage Evolution Characteristics of Concrete under Impact Load Based on EMI Method. Sustainability 2022, 14, 10557. [Google Scholar] [CrossRef]
  21. Liu, Y. The Study of Dynamic Response and Interaction Mechanism of Rock Shed Subject to Rockfall Impacting. M.A. Dissertation, Chengdu University of Technology, Chengdu, China, 2017. (In Chinese). [Google Scholar]
  22. Xiao, L. Research on the Impact of Mountain Rolling Stone on the Pier and Its Reinforcement. M.A. Dissertation, Southwest Jiaotong University, Chengdu, China, 2017. (In Chinese). [Google Scholar]
  23. Fujikake, K.; Li, B.; Soeun, S. Impact Response of Reinforced Concrete Beam and Its Analytical Evaluation. J. Struct. Eng. 2009, 135, 938–950. [Google Scholar] [CrossRef]
  24. Zhang, X.; Hao, H.; Li, C. Experimental investigation of the response of precast segmental columns subjected to impact loading. Int. J. Impact Eng. 2016, 95, 105–124. [Google Scholar] [CrossRef] [Green Version]
  25. Meng, J.; Xu, Z.; Liu, Z.; Chen, S.; Wang, C.; Zhao, B.; Zhou, A. Experimental Study on the Mechanics and Impact Resistance of Multiphase Lightweight Aggregate Concrete. Sustainability 2022, 14, 9606. [Google Scholar] [CrossRef]
  26. Fan, W.; Xu, X.; Zhang, Z.; Shao, X. Performance and sensitivity analysis of UHPFRC-strengthened bridge columns subjected to vehicle collisions. Eng. Struct. 2018, 173, 251–268. [Google Scholar] [CrossRef]
Figure 1. Bridges impacted by rockfalls.
Sustainability 14 12196 g001
Figure 2. Layout of the bridge. (Unit: m).
Sustainability 14 12196 g002
Figure 3. Geometry of the bridge: (a) actual picture; (b) geometry model.
Sustainability 14 12196 g003
Figure 4. FE model of the bridge and rockfall. (a) bridge; (b) reinforcement; (c) cross-section; (d) rockfalls.
Sustainability 14 12196 g004
Figure 5. The drop weight test [23].
Sustainability 14 12196 g005
Figure 6. The reinforcement [23]: (a) cross-sectional view; (b) front view.
Sustainability 14 12196 g006
Figure 7. FE model of the drop weight test.
Sustainability 14 12196 g007
Figure 8. Comparison of damage between the experiment and FE analysis.
Sustainability 14 12196 g008
Figure 9. Comparison between experiment [23] and FE analysis: (a) mid-span displacement; (b) impact force.
Sustainability 14 12196 g009
Figure 10. Three-dimensional view of the experiment setup and reinforcement of the column [24]. (a) experiment setup; (b) reinforcement of the column.
Sustainability 14 12196 g010
Figure 11. Comparison between the experiment in [24] and FE analysis: (a) damage pattern; (b) impact force.
Sustainability 14 12196 g011
Figure 12. Mesh independence verification.
Sustainability 14 12196 g012
Figure 13. Impact force of rockfall-HTWBP impact. (a) impact height; (b) impact velocity; (c) rockfall diameter; (d) strength grade.
Sustainability 14 12196 g013aSustainability 14 12196 g013b
Figure 14. Damage process of the pier (h = 40 m): (a) Impacted surface; (b) Side surface.
Sustainability 14 12196 g014
Figure 15. Damage process of the cross-section (h = 40 m).
Sustainability 14 12196 g015
Figure 16. Displacement time-history curves (Case C1).
Sustainability 14 12196 g016
Figure 17. Maximum displacement of the HTWBP. (a) impact height; (b) impact velocity; (c) rockfall diameter; (d) strength grade.
Sustainability 14 12196 g017
Figure 18. Damage response surfaces with different parameters. (a) impact height and impact velocity; (b) impact height and rockfall diameter; (c) impact height and strength grade; (d) impact velocity and rockfall diameter; (e) impact velocity and strength grade; (f) rockfall diameter and strength grade.
Sustainability 14 12196 g018aSustainability 14 12196 g018b
Figure 19. Verification of the response surface model.
Sustainability 14 12196 g019
Figure 20. Response surface of the damage index under different impact velocities and rockfall diameter.
Sustainability 14 12196 g020
Figure 21. Damage zoning diagram.
Sustainability 14 12196 g021
Figure 22. Comparison between a single rockfall and double-rockfall impact: (a) front view; (b) side view.
Sustainability 14 12196 g022
Table 1. Element types and grid sizes.
ComponentElement TypeGrid Size (mm)
Impacted pierSolid50
Other piersSolid100
Pile capSolid200
Table 2. Material parameters.
Material TypeKeyword in LS-DYNAParameterValue
Transverse reinforcement* MAT_PLASTIC_KINEMATICElastic modulus (GPa)210
Density (g/cm3)7.85
Poisson’s ratio0.3
Failure strain0.25
Yield strain (MPa)300
Longitudinal reinforcement* MAT_PLASTIC_KINEMATICElastic modulus (GPa)210
Density (g/cm3)7.85
Poisson’s ratio0.3
Failure strain0.2
Yield strain (MPa)400
Rockfall* MAT_RIGIDElastic modulus (GPa)26.0
Density (g/cm3)2.6
Poisson’s ratio0.22
* The keyword name in LS-DYNA.
Table 3. Comparison of peak impact force and mid-span displacement.
Impact HeightPeak Impact Force (kN)Mid-Span Displacement (mm)
Experiment [23]FE AnalysisDifferenceExperiment [23]FE AnalysisDifference
0.15 m124.3125.81.2%6.16.21.6%
0.30 m182.7180.91.0%10.910.62.8%
0.60 m243.8250.72.8%2020.21.0%
1.20 m308.4310.90.8%36.636.50.3%
Table 4. Investigated cases.
Case Studyh (m)v (m/s)d (m)s (MPa)
C1 (Reference case study)40201.530
C210201.530
C320201.530
C430201.530
C540101.530
C640301.530
C74020230
C840202.530
C940203.030
C1040203.530
C1140204.030
C1240201.540
C1340201.550
Table 5. Factors and levels of the Box–Behnken design.
FactorLevel
−101
h (m)204060
v (m/s)102030
d (m)1.52.02.5
s (MPa)304050
Table 6. Box–Behnken design cases and damage results.
StdRunh (m)v (m/s)d (m)s (MPa)dv (×10−3)D
12420102400.890.156
22860102400.670.117
31720302401.490.260
4960302401.610.281
51640201.5301.120.196
6740202.5301.320.231
71240201.5500.890.156
82340202.5501.630.285
9420202301.200.210
102260202301.140.199
111820202501.130.198
12560202500.930.162
132140101.5400.780.136
14840301.5401.160.203
152940102.5401.160.203
161540302.5401.950.341
17620201.5401.000.175
18260201.5401.000.175
192720202.5401.620.283
201460202.5401.390.243
21140102300.930.163
221140302301.480.259
231040102501.080.189
242640302501.510.264
25340202401.020.178
262540202400.990.173
272040202401.110.194
281940202401.010.177
291340202400.940.164
Table 7. Supplemented cases for verification of the response surface model.
Runh (m)v (m/s)d (m)s (MPa)DDifference
FE ResultsRSM Results
3040201.5500.160.154.8%
3140201.5400.160.161.2%
3240202300.190.191.6%
3340151.5300.190.184.7%
3440252.5300.350.342.7%
3560202.5300.240.243.2%
Table 8. Factors and levels of the central composite design.
FactorLevel
v (m/s)1020304050
d (m)1.01.3751.752.1252.5
Table 9. The central composite design cases and damage results.
StdRunV (m/s)D (m)dv (×10−3)D
121010.04760.01
285012.610.46
39102.51.240.22
46502.55.721.00
53201.752.180.38
65401.753.840.67
71301.3752.430.42
87302.1253.490.61
94301.752.810.49
104301.753.140.55
118301.752.940.51
1213301.752.920.51
133301.753.260.57
Table 10. Comparison of the peak impact force between this study and reference.
Velocity (m/s)Peak Impact Force (×103 kN)Difference (×103 kN)
Circular Pier in Ref. [1]Square Pier in Ref. [1]This Research
1011.911.812.91.0~1.1
Publisher’s Note: MDPI stays neutral with regard to jurisdictional claims in published maps and institutional affiliations.

