You are currently viewing a new version of our website. To view the old version click .
Sustainability
  • Article
  • Open Access

22 September 2022

A Machine Learning-Based Framework for the Prediction of Cervical Cancer Risk in Women

,
,
,
,
,
and
1
School of Computer Science, University of Petroleum and Energy Studies, Dehradun 248007, Uttarakhand, India
2
Department of Computer Engineering and Technology, Guru Nanak Dev University, Amritsar 143005, Punjab, India
3
College of Computer Science and Engineering, University of Hail, Hail 55476, Saudi Arabia
4
College of Engineering and Information Technology, Amran University, Amran, Yemen
This article belongs to the Special Issue Machine Learning, Data Mining and IoT Applications in Smart and Sustainable Networks

Abstract

One of the most common types of cancer in women is cervical cancer, a disease which is the most prevalent in poor nations, with one woman dying from it every two minutes. It has a major impact on the cancer burden in all cultures and economies. Clinicians have planned to use improvements in digital imaging and machine learning to enhance cervical cancer screening in recent years. Even while most cervical infections, which generate positive tests, do not result in precancer, women who test negative are at low risk for cervical cancer over the next decade. The problem is determining which women with positive HPV test results are more likely to have precancerous alterations in their cervical cells and, as a result, should have a colposcopy to inspect the cervix and collect samples for biopsy, or who requires urgent treatment. Previous research has suggested techniques to automate the dual-stain assessment, which has significant clinical implications. The authors reviewed previous research and proposed the cancer risk prediction model using deep learning. This model initially imports dataset and libraries for data analysis and posts which data standardization and basic visualization was performed. Finally, the model was designed and trained to predict cervical cancer, and the accuracy and performance were evaluated using the Cervical Cancer dataset.

1. Introduction

Cervical cancer kills around 4000 women in the United States and nearly 300,000 women worldwide [1]. Cervical cancer death rates can be substantially lowered with early detection and diagnosis using machine learning and artificial intelligence. Researchers that develop diagnostic equipment that can detect cervical cancer symptoms in women with few resources are using artificial intelligence and transportable video imaging. Cervical cancer cases have decreased significantly in countries that have implemented nationwide screening programs to detect abnormalities in the cells and the papilloma virus in cervical patients. Considering this, and due to a lack of diagnostic facilities and HPV vaccines in low-income countries, global case numbers are expected to grow over the next decade. Innovative analytical methods that consider local constraints and limits are necessary, since there has been an increase in examinations at the gynaecological level for women globally.
This research presents the use of the extreme gradient boosting algorithm, which is also known as XGBoost. This algorithm has become the algorithm of choice for many data scientists and could be used for regression and classifications tasks. The extra boost algorithm has won several Kaggle competitions and has been shown to offer solid robustness and high computational efficiency. When there is an increase in cervical screening, the cancer death rate could be reduced dramatically, which has already reduced by 74% from 1955 to 1992. There are many factors that could essentially affect people’s increased risk of cervical cancer, including an escalation in their sexual activity to a great level and Human papillomavirus (HPV) as two of the most important contributors to the development of cervical cancer. These variables will be investigated. There are also many additional variables that can raise a woman’s chances of developing cervical cancer. For example, the hormones found in certain oral contraceptives. There is also a difference between having a large number of children, as well as a smoking habit. All of these factors increase the cervical cancer risk in women, particularly for those infected with HPV and those with a weakened immune system. HIV and AIDS also raise the chances of cervical cancer.
The authors of this study constructed and trained a model to predict cervical cancer in 858 individuals. The data was gathered at Caracas, Venezuela’s ‘Hospital Universitario de Caracas’. The collection comprises 858 patients’ medical records, habits, and demographic data. Excessive sexual activity and the Human Papilloma Virus (HPV) are two of the major variables that raise the risk of cervical cancer according to the research. Cervical cancer is accelerated by the presence of hormones in oral contraceptives, having a large family, and smoking, especially in women diagnosed with HPV. In addition, people with weak immune systems (HIV/AIDS) have a high risk of HPV. The authors input features such as age, the number of pregnancies, whether the patient is a smoker or not, and packs smoked per year; then, the model looked at the medical history. If the patients had STDs or if they had many other diseases, and assuming these variables, these variables were fed into an eggy boost algorithm so to try to predict for the results of the biopsy, producing a result of zero or one. Whether the patient has cancer or has a high risk of cancer, or not, is the target variable.
In this study, the extreme gradient boost method is used for the prediction of cervical cancer. The deep learning framework model is developed for cervical cancer prediction in women. The critical factors responsible for predicting the risk of cervical cancer are visualized using the dataset. Finally, the performance of the model is calculated, summarized, and visualized. The use of the extreme gradient boost algorithm makes this research novel and better than other existing studies in the same domain. The XGBoost algorithm uses the output of the previous steps to generate better results.
This research paper is divided into five sections: Section One introduces the cervical cancer topic, the global impact on women, as well as lays the basis of the research objectives. Section Two presents the previous research work used as a reference point by the authors, involving a review of over three hundred papers, and the classification and categorization of them so to shortlist the closely matching and relevant papers. Section Three presents the research methodology steps for the dataset selection and the parameters for calculating the results. Section Four presents the actual implementation process used in training the model using the extreme gradient boost algorithm so to train the model. This section also presents the equations and comparisons with other similar studies. Finally, Section Five presents the conclusions, including the summary of the research performed, as well as the results obtained.

3. Research Methodology

The implementation of this paper is done in the Python programming language with feature selection using the Chi-Square Test, as seen in Equation (1), where the data analysis is based on observations of a randomly selected range of parameters. This is generally a comparison between two quantitative sets of data. For a null hypothesis to be true, the sample mean of the test statistic is referred to as the Chi-Squared dissemination. The Chi-Squared test is used to determine any significant difference between the observed and normal frequencies in one or more groups or categories. It expresses the likelihood of independent factors. The formula for the computation of Chi-Square is given below:
X 2 = ( Observed value Expected value ) 2 Expected value
The steps followed as part of the research methodology and implementation are shown in Figure 1.
Figure 1. Proposed research methodology.
Step 1: Importing the dataset, libraries, and performing exploratory data analysis
The model is implemented in the Python programming language. Initially, we imported all the necessary libraries and packages, such as SeaBorn, pandas, and matplotlib, for the implementation. The cervical cancer dataset is imported from Cervical Cancer (2020). The statistics of the dataset that we have used for the implementation are shown in Figure 2. The dataset contains various parameters based on which we will predict the risk of cervical cancer. The various attributes that comprise the dataset include: smoking, STDs, STD, AIDS, first sexual intercourse, cytology, etc. All these factors are part of the dataset which may lead to cervical cancer.
Figure 2. Statistics of dataset.
Before performing further analysis, the missing values are replaced with NaN. After that, the heatmap of the entire dataset is plotted in Figure 3. All these values are linked, have, or play a key role in developing cancer. The intrauterine device (IUD) is primarily used for birth control, and there are also hormonal contraceptives, which again are used as hormones for birth control, and these two features are included if the patient is using hormonal contraceptives, including how many years they have been using these birth control strategies. There are also various types of STDs included. This study explores these features so to forecast the risk of cervical cancer. Depending on the examination, patients should be able to know if there is cancer or not. Another strategy or test that could be used for diagnosis is called the Schiller test, which is where, in Mayadeen, cervical cancer cells are detected. The third type of test is called cytology and psychology, performing an exam of a single cell-type, and which is primarily used for cancer screening. Finally, the most accurate is the biopsy, which is performed by removing a piece of tissue and examining that tissue under a microscope. The mean value of the dataset is calculated using the formula y ¯   in Equation (2), as given below:
y ¯ = 1 z   ( i = 1 z y i   ) = y 1 + y 2 + y 3 + z  
where y ¯ denotes the mean value of the multiple attributes of the dataset.
Figure 3. Heatmap of the dataset.
Before building the model, the authors drop the missing values. There are columns in the dataset, such as STDs and the time since the first and last diagnosis, which contain many missing values, so they are dropped. The statistics of the dataset show that there are 858 entries. The various parameters critically affect the risk of cervical cancer, such as age, the number of sexual partners, smoking status and number of packs per year, or if there is an STD or not. Some columns in the dataset are of the object type; therefore, we have converted them into numeric values for better understanding and computation. Figure 4 shows the graphical representation of the data.
Figure 4. Statistics of the dataset.
After observing the data in the dataset, the minimum age is 13 years old; therefore, there is a need to take the mean values of all the columns and then do the calculations. Thereafter, the mean value of the entire dataset is calculated, and the null values present in the dataset are replaced by the mean values.
Step 2: Performing Data Standardization and basic Data Visualization
In the previous step, we have cleaned up our dataset, we have dropped certain columns, and we have also replaced our neural elements with the average. Now, the data is visualized before training the model and to reach some fruitful conclusions. In this step, the correlation matrix is plotted to see the relationship between all the columns of the dataset. The pseudocode for the plotting of the correlation matrix is given below:
Start
Step 1: Set Correlation_Matrix <- Cervical_Cancer
Step 2: Plot the Correlation_Matrix
Step 3: Set HeatMap <- Cervical_Cancer
Step 4: Plot HeatMap
End
Figure 5 shows the correlation matrix, which shows the correlations between all the features of the dataset. As can be seen in Figure 5, there is some positive and negative correlation. The value between STDs is around 0.9, and on the right-hand side, there is a colour code. As the number becomes larger, it moves closer to one. The colour here is light. By observing the diagonal values, any variable that is directly correlated to itself will show a positive correlation. Therefore, age has a positive correlation, which is one, and so the diagonal should also be visible. The dark colour shows the near-zero correlation.
Figure 5. Correlation matrix.
Broadly said, a correlation matrix is a table that shows the correlation coefficients for various variables. The correlation between all potential pairings of values in a table is shown in the matrix. It is an effective tool for compiling a sizable dataset and for locating and displaying data patterns. After visualizing the correlation matrix, the number of biopsy instances and the total number of instances of the biopsy is visualized, as shown in in Figure 6.
Figure 6. Biopsy instances.
Many of the participants in the dataset range between 20 and 30 years old, and beyond 50 years old. In Figure 6, the distribution is visible. For example, in terms of the biopsy, many patients that are shown to be in class zero. That means they do not have cancer according to the biopsy diagnosis. In addition, a very small number that our model flags are in class one, on the right, which means that they have cancer. The algorithm given below shows how the authors have prepared the data before building and training the model.
Start
# Setup Array
Step 1: Rearrange array from (421,570,) to (421,570,)
# Model Training
Train mode (421,570, 1)
Step 2: Reshape model
Step 3: Display updated shape
Step 4: Before feeding model → Scale data
Step 5: Import necessary skelearn as MyScale library
Step 6: Fit scaled model before transformations
Step 7: MyScale is equivalent to skelearn library
Step 8: Model is trained using scaler fit to transformation
Step 9: Divide final-dataset → train & test dataset → Calculate performance
Step 10: Final dataset is split into trained and testing dataset with test and train set = 0.25
End
Step 3: Build the Model to predict cervical cancer risk
In this model building, the authors have used the extreme gradient boosting algorithm for regression and classification tasks. The extreme gradient boosting algorithm is a supervised learning algorithm which uses a gradient boosted tree algorithm. It works by joining the ensemble of predictions from several weak models. It is robust to many data distributions and relationships and offers many hyperparameters to tune model performance. It offers good speed and better memory utilization. It uses the idea of discovering truth by building on previous discoveries. Boosting algorithms work by building a model from the trained data, then the second model is built based on the maximum number of models that have been created or until the model provides good predictions.
Figure 7 shows the operation of the extreme gradient boost model. It repeatedly builds new models and combines them into an ensemble model. Initially, it builds the first model and calculates the errors for each observation in the dataset. The extreme gradient boost algorithm is superior compared to the gradient boosting algorithm, since it offers a good balance between bias and variance. Gradient boost works by building a tree based on the error from the previous tree. It scales the trees and then adds the predictions from the new tree to the predictions from the previous trees.
Figure 7. Operation of the extreme gradient boost model.

4. Results

The pseudocode given below shows the process used in training the model. The authors have used the extreme gradient boost algorithm for training the model. The learning rate used in training is 0.1, with a maximum depth of 50, and the number of estimators is 100. Thereafter, the model is fitted, and the score is calculated. The accuracy of the extreme gradient boost algorithm is calculated using the built-in methods in Python. At last, the classification report and confusion matrix are calculated.
Training the model
Start
Step 1: XGBoost should be imported as eb model = eb.
Step 2: XGBoost classifier implemented using 100 estimators, 50 max depth & 0.1 as rate of learning.
Step 3: Model is fit using the function to fit the model.
Step 4: Model = result_train, score(xtrain, ytrain)
Step 5: Accuracy of the model is then calculated for trained and testing model.
Step 6: Calculate (xtest, ytest) score
Step 7: ypredict = model print(“Accuracy:”.format(result))
Step 8: sklearn library is imported to predict the risk rate
Step 9: Classification report and Confusion matrix is plotted for visualization of results
End
Figure 8 shows the histogram of the entire dataset plotted for the better visualization of the results. The model is trained with 10× and 100× the number of estimators and the tree depth and the accuracy of the trained model came out to be 96.5%. Table 1 presents the report for classifying the proposed framework for precision, recall, F1-score, and the support.
Figure 8. Histogram of the entire dataset.
Table 1. Classification report.
At last, the confusion matrix is plotted and is shown in Figure 9. The pseudocode for the plotting of the confusion matrix is given below.
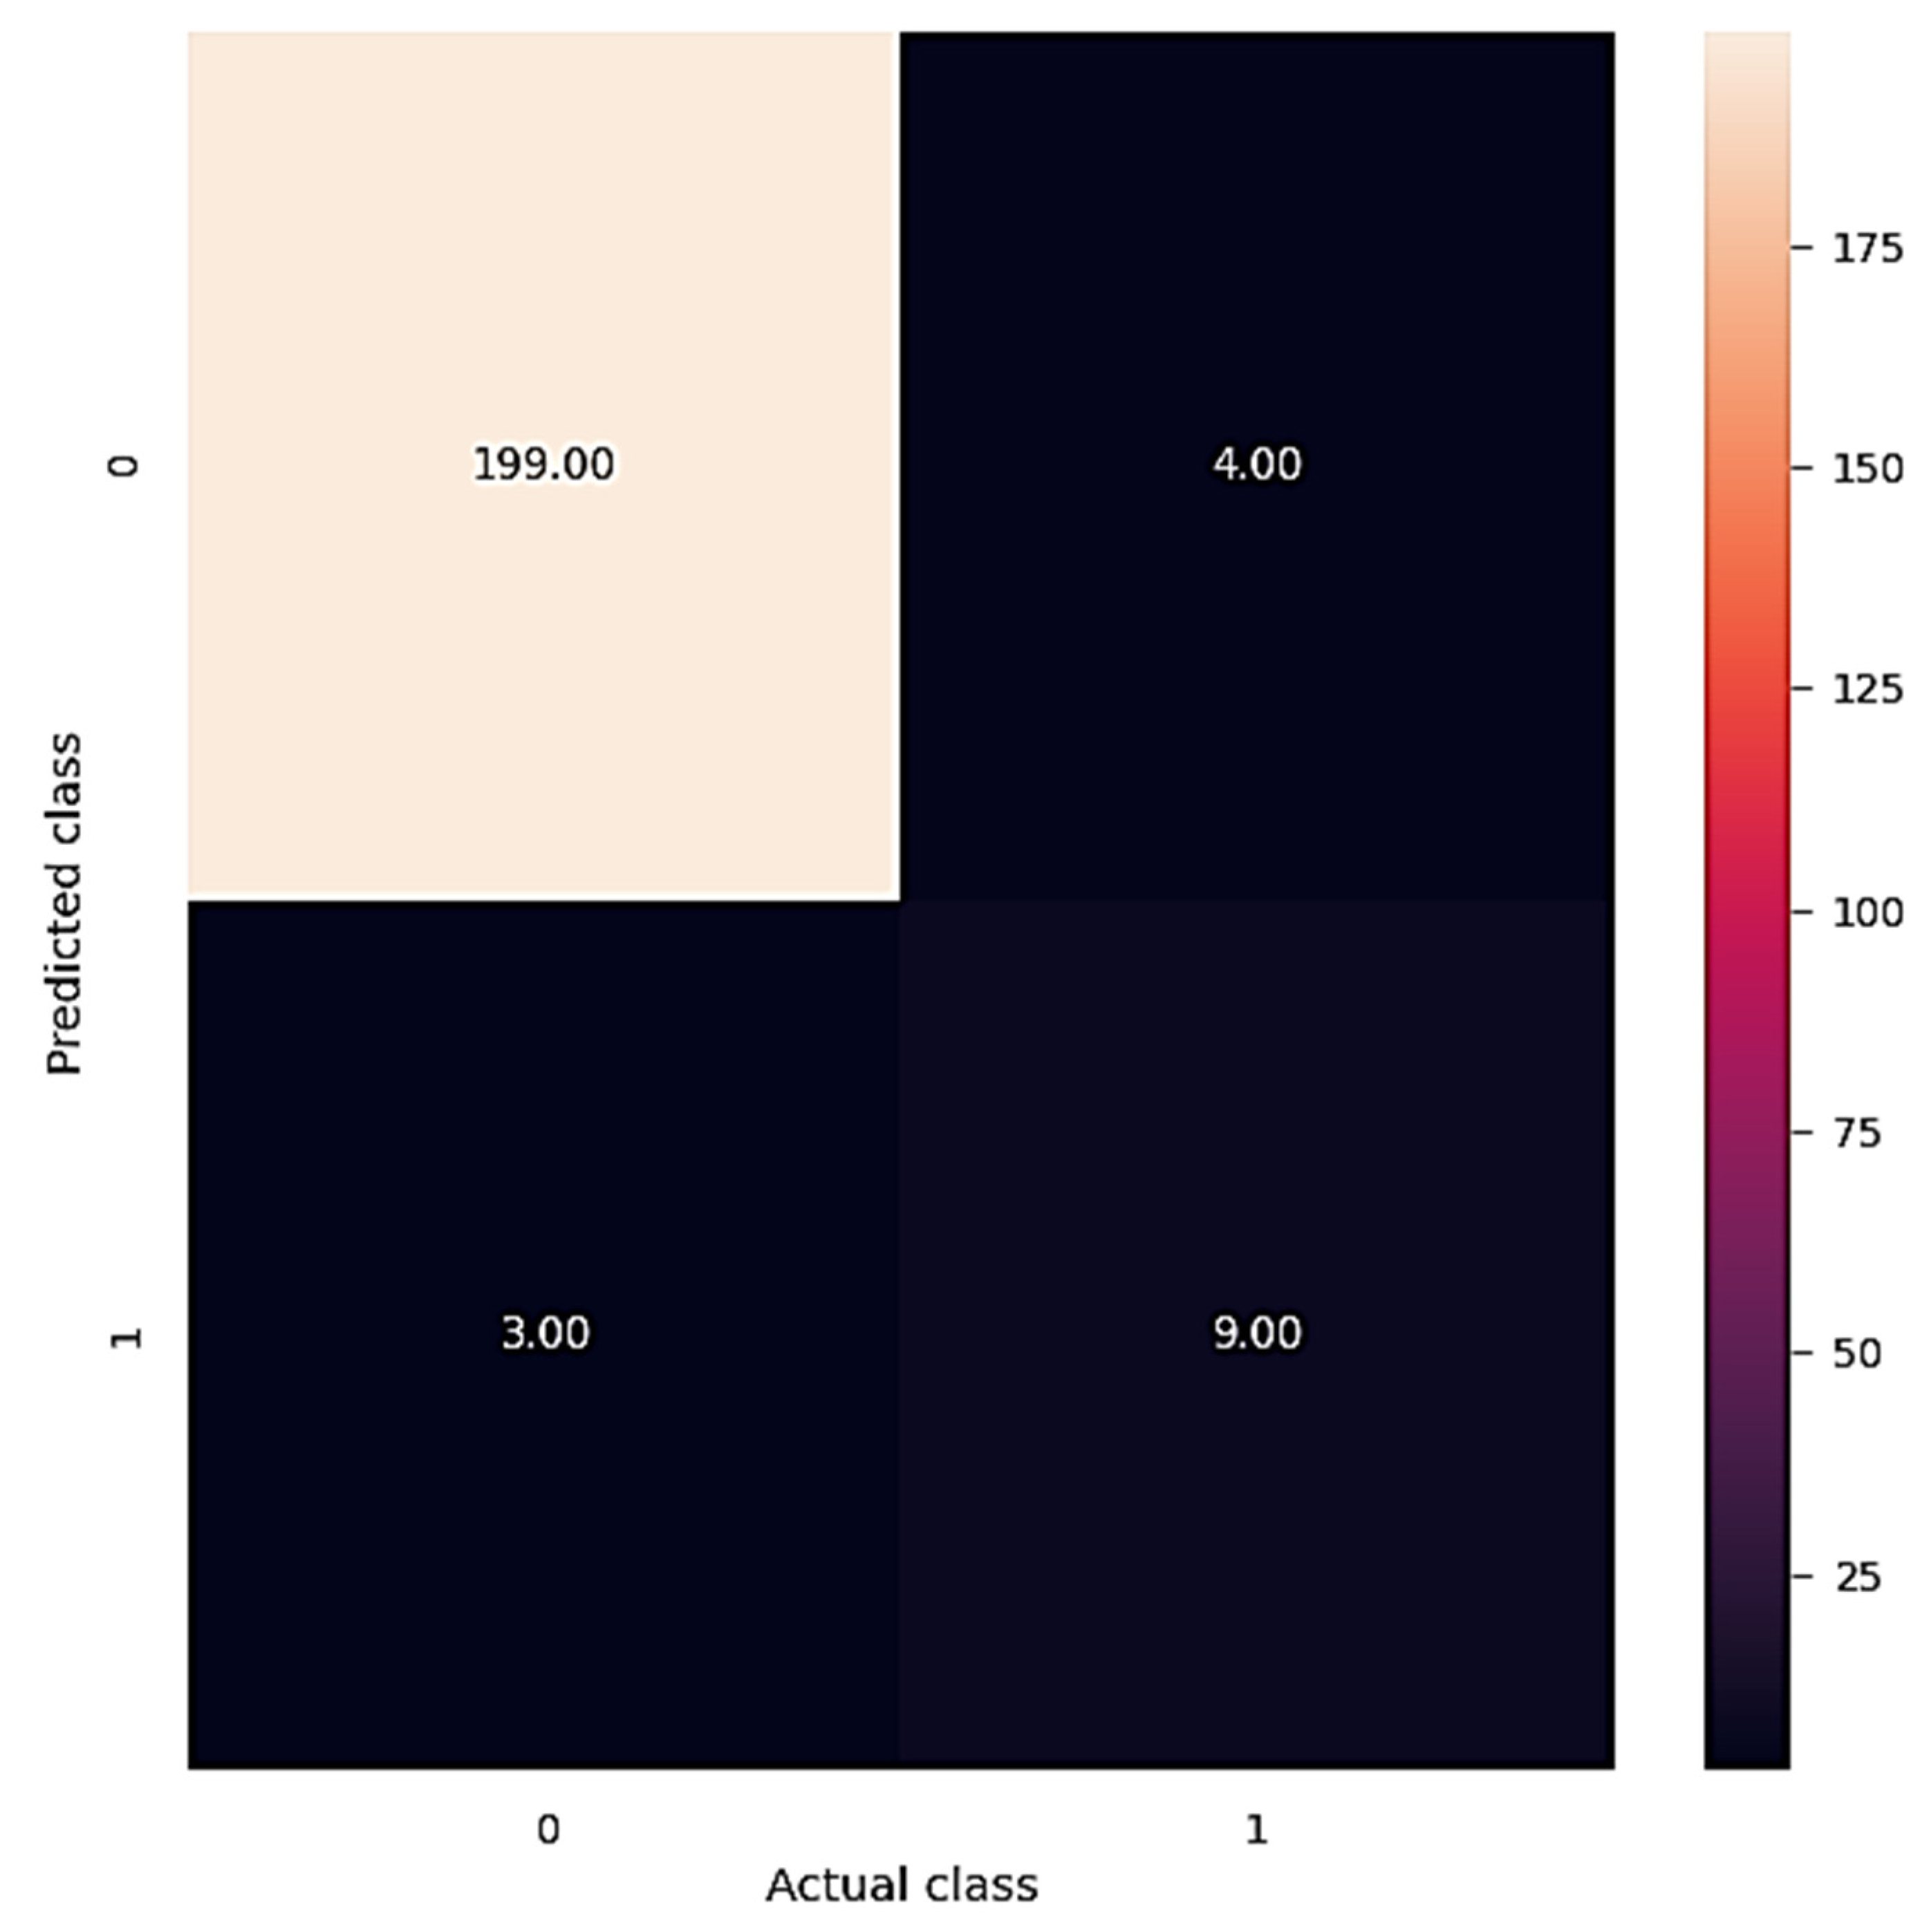
ConfMat <- ConfusionMatrix(ypredict, ytest)
Plot the figure
Set HeatMap <- Cervical_Cancer
Plot the HeatMap (PredictedClass, ActualClass)
Figure 9. Confusion matrix.
The confusion matrix shows that 199 instances fall under class 0 of the predicted class, whereas only 3 instances fall under class 1 of the predicted class. It clearly shows that our model has performed well on the dataset used for the prediction of cervical cancer. The formula used for the performance metrics of the classification report are presented below as
Precision being calculated in Equation (3), where tp is the True Positive and fp is the False Positive as
Precision   = tp / ( tp   +   fp )
Precision is the capacity of the classifier to not categorize a sample that is negative as positive with the ratio as blow, while Equation (4) presents the recall to the classifier’s capacity to locate all positive samples.
Recall   = tp / ( tp   +   fn )
F1 is a metric that combines accuracy and recall, as presented in Equation (5), which is often referred to as the harmonic mean of the two. The harmonic mean is a method of calculating an “average” of numbers that are said to be better for ratios than the standard arithmetic mean. The formula for the F1-score is
  F 1 = 2   Precision Recall Precision + Recall
The authors did a comparative analysis with various studies that follows the same approach in the same area. The comparative analysis demonstrates that our proposed framework is second best over the other existing frameworks. The comparative analysis with similar frameworks, as shown in Table 2, offers a comparison of similar methods.
Table 2. Comparative analysis with similar approaches.
The authors in [27] tried to utilize machine learning algorithms to figure out whether the patient has cancer based on a variety of characteristics in the dataset. Cervical cancer can be detected sooner if the existence of the disease can be predicted. Considering various prominent machine learning classifiers, the authors of [28] found that the random forest fared the best. Moreover, the suggested cervical cancer forecasting model outperformed previously published cervical cancer prediction models [29,30,31,32,33,34,35]. Furthermore, a software device is being designed that may gather cervical cancer potential risk data and which provides findings from a cervical cancer forecasting model for immediate and correct intervention at the early stages of cervical cancer [23,36,37,38,39,40,41,42,43,44,45]. Our proposed model worked on a deep learning model supported by the XGBoost algorithm and offered the second-best performance among the various existing frameworks in the same domain.

5. Conclusions

In this study, the authors classified research based on the prediction of cervical cancer risks. The authors profiled data and performed comprehensive benchmarking to evaluate the performance of risks using predictive models based on precision, recall, F1-score, and support. The proposed deep learning model was implemented using the Python programming language with packages and libraries. The cervical cancer dataset was used to perform basic data analysis, then data standardization and visualization were performed. Finally, the model was trained for the accurate prediction of cervical cancer, and the accuracy and performance of the model were also evaluated. The dataset was chosen specifically to evaluate attributes such as smoking, STDs, STD, AIDS, first sexual intercourse, and cytology, which are the major risk factors of cervical cancer. Based on the computational results obtained, one hundred and nineteen instances were under the ‘class zero’ predicted class, while only three instances were found under ‘class one’ of the predicted class, which illustrated the proposed model performs very well for the cervical cancer dataset.

Author Contributions

Conceptualization, A.B., K.K., S.B., N.A., A.U.R., E.T.E. and N.A.G.; methodology, A.B., K.K., S.B., N.A., A.U.R., E.T.E. and N.A.G.; software, S.B.; validation, A.B., K.K. and S.B.; formal analysis, A.B., K.K., and S.B.; investigation, A.B., K.K. and S.B.; resources, S.B.; data curation, S.B.; writing—original draft preparation A.B., K.K., S.B., N.A., A.U.R., E.T.E. and N.A.G.; writing—review and editing, A.B., K.K., S.B., N.A., A.U.R., E.T.E. and N.A.G.; visualization, S.B.; supervision, A.B. and S.B.; project administration, N.A.G. and E.T.E.; funding acquisition; E.T.E. and N.A.G. All authors have read and agreed to the published version of the manuscript.

Funding

This research was supported by Future University Researchers Supporting Project Number FUESP-2020/48 at Future University in Egypt, New Cairo 11845, Egypt.

Institutional Review Board Statement

Not applicable.

Data Availability Statement

Not applicable.

Acknowledgments

This research was supported by Future University Researchers Supporting Project Number FUESP-2020/48 at Future University in Egypt, New Cairo 11845, Egypt.

Conflicts of Interest

The authors declare no conflict of interest.

References

  1. World Health Organization. (n.d.) Cervical Cancer. World Health Organization. Available online: https://www.who.int/health-topics/cervical-cancer#tab=tab_1 (accessed on 19 September 2022).
  2. Henderson, R. E. Ali Screenings of Pap Smears Can Detect Precursors to Cervical Cancer. News. Available online: https://www.news-medical.net/news/20210317/AI-screenings-of-pap-smears-can-detect-precursors-to-cervical-cancer.aspx (accessed on 19 September 2021).
  3. Baydoun, A.; Xu, K.; Heo, J.U.; Yang, H.; Zhou, F.; Bethell, L.A.; Fredman, E.T.; Ellis, R.J.; Podder, T.K.; Traughber, M.S.; et al. Synthetic CT generation of the pelvis in patients with cervical cancer: A single input approach using generative adversarial network. IEEE Access 2021, 9, 17208–17221. [Google Scholar] [CrossRef] [PubMed]
  4. Rahaman, M.; Li, C.; Wu, X.; Yao, Y.; Hu, Z.; Jiang, T.; Li, X.; Qi, S. A Survey for Cervical Cytopathology Image Analysis Using Deep Learning. IEEE Access 2020, 8, 61687–61710. [Google Scholar] [CrossRef]
  5. Li, Y.; Chen, J.; Xue, P.; Tang, C.; Chang, J.; Chu, C.; Ma, K.; Li, Q.; Zheng, Y.; Qiao, Y. Computer-Aided Cervical Cancer Diagnosis Using Time-Lapsed Colposcopic Images. IEEE Trans. Med. Imaging 2020, 39, 3403–3415. [Google Scholar] [CrossRef]
  6. Yu, S.; Feng, X.; Wang, B.; Dun, H.; Zhang, S.; Zhang, R.; Huang, X. Automatic Classification of Cervical Cells Using Deep Learning Method. IEEE Access 2021, 9, 32559–32568. [Google Scholar] [CrossRef]
  7. Li, C.; Chen, H.; Zhang, L.; Xu, N.; Xue, D.; Hu, Z.; Ma, H.; Sun, H. Cervical Histopathology Image Classification Using Multilayer Hidden Conditional Random Fields and Weakly Supervised Learning. IEEE Access 2019, 7, 90378–90397. [Google Scholar] [CrossRef]
  8. Luo, Y.-M.; Zhang, T.; Li, P.; Liu, P.-Z.; Sun, P.; Dong, B.; Ruan, G. MDFI: Multi-CNN Decision Feature Integration for Diagnosis of Cervical Precancerous Lesions. IEEE Access 2020, 8, 29616–29626. [Google Scholar] [CrossRef]
  9. Senthilkumar, G.; Ramakrishnan, J.; Frnda, J.; Ramachandran, M.; Gupta, D.; Tiwari, P.; Shorfuzzaman, M.; Mohammed, M.A. Incorporating Artificial Fish Swarm in Ensemble Classification Framework for Recurrence Prediction of Cervical Cancer. IEEE Access 2021, 9, 83876–83886. [Google Scholar] [CrossRef]
  10. Xue, D.; Zhou, X.; Li, C.; Yao, Y.; Rahaman, M.; Zhang, J.; Chen, H.; Zhang, J.; Qi, S.; Sun, H. An Application of Transfer Learning and Ensemble Learning Techniques for Cervical Histopathology Image Classification. IEEE Access 2020, 8, 104603–104618. [Google Scholar] [CrossRef]
  11. Kurnianingsih; Allehaibi, K.H.S.; Nugroho, L.E.; Widyawan; Lazuardi, L.; Prabuwono, A.S.; Mantoro, T. Segmentation and Classification of Cervical Cells Using Deep Learning. IEEE Access 2019, 7, 116925–116941. [Google Scholar] [CrossRef]
  12. Khorshed, T.; Moustafa, M.N.; Rafea, A. Deep Learning for Multi-Tissue Cancer Classification of Gene Expressions (GeneXNet). IEEE Access 2020, 8, 90615–90629. [Google Scholar] [CrossRef]
  13. Fernandes, K.; Cardoso, J.S.; Fernandes, J. Automated Methods for the Decision Support of Cervical Cancer Screening Using Digital Colposcopies. IEEE Access 2018, 6, 33910–33927. [Google Scholar] [CrossRef]
  14. Liu, Y.; Zhang, P.; Song, Q.; Li, A.; Zhang, P.; Gui, Z. Automatic Segmentation of Cervical Nuclei Based on Deep Learning and a Conditional Random Field. IEEE Access 2018, 6, 53709–53721. [Google Scholar] [CrossRef]
  15. Pal, A.; Xue, Z.; Befano, B.; Rodriguez, A.C.; Long, L.R.; Schiffman, M.; Antani, S. Deep Metric Learning for Cervical Image Classification. IEEE Access 2021, 9, 53266–53275. [Google Scholar] [CrossRef]
  16. Adweb, K.M.A.; Cavus, N.; Sekeroglu, B. Cervical Cancer Diagnosis Using Very Deep Networks Over Different Activation Functions. IEEE Access 2021, 9, 46612–46625. [Google Scholar] [CrossRef]
  17. Zhang, S.; Bamakan, S.M.H.; Qu, Q.; Li, S. Learning for Personalized Medicine: A Comprehensive Review From a Deep Learning Perspective. IEEE Rev. Biomed. Eng. 2019, 12, 194–208. [Google Scholar] [CrossRef]
  18. Meng, Z.; Zhao, Z.; Li, B.; Su, F.; Guo, L. A Cervical Histopathology Dataset for Computer Aided Diagnosis of Precancerous Lesions. IEEE Trans. Med. Imaging 2021, 40, 1531–1541. [Google Scholar] [CrossRef] [PubMed]
  19. Xing, F.; Xie, Y.; Su, H.; Liu, F.; Yang, L. Deep Learning in Microscopy Image Analysis: A Survey. IEEE Trans. Neural Netw. Learn. Syst. 2018, 29, 4550–4568. [Google Scholar] [CrossRef]
  20. Babukarthik, R.G.; Adiga, V.A.K.; Sambasivam, G.; Chandramohan, D.; Amudhavel, J. Prediction of COVID-19 Using Genetic Deep Learning Convolutional Neural Network (GDCNN). IEEE Access 2020, 8, 177647–177666. [Google Scholar] [CrossRef]
  21. Khan, S.; Sajjad, M.; Hussain, T.; Ullah, A.; Imran, A.S. A Review on Traditional Machine Learning and Deep Learning Models for WBCs Classification in Blood Smear Images. IEEE Access 2020, 9, 10657–10673. [Google Scholar] [CrossRef]
  22. Peng, J.; Wang, Y. Medical Image Segmentation With Limited Supervision: A Review of Deep Network Models. IEEE Access 2021, 9, 36827–36851. [Google Scholar] [CrossRef]
  23. Hu, Z.; Tang, J.; Wang, Z.; Zhang, K.; Zhang, L.; Sun, Q. Deep learning for image-based cancer detection and diagnosis---A survey. Pattern Recognit. 2018, 83, 134–149. [Google Scholar] [CrossRef]
  24. Arimura, H.; Soufi, M.; Kamezawa, H.; Ninomiya, K.; Yamada, M. Radiomics with artificial intelligence for precision medicine in radiation therapy. J. Radiat. Res. 2019, 60, 150–157. [Google Scholar] [CrossRef]
  25. Torres-Velazquez, M.; Chen, W.-J.; Li, X.; McMillan, A.B. Application and Construction of Deep Learning Networks in Medical Imaging. IEEE Trans. Radiat. Plasma Med. Sci. 2020, 5, 137–159. [Google Scholar] [CrossRef]
  26. Polterauer, S.; Grimm, C.; Hofstetter, G.; Concin, N.; Natter, C.; Sturdza, A.; Pötter, R.; Marth, C.; Reinthaller, A.; Heinze, G. Nomogram prediction for overall survival of patients diagnosed with cervical cancer. Br. J. Cancer 2012, 107, 918–924. [Google Scholar] [CrossRef]
  27. Parikh, D.; Menon, V. Machine Learning Applied to Cervical Cancer Data. Int. J. Math. Sci. Comput. 2019, 5, 53–64. [Google Scholar] [CrossRef]
  28. Ijaz, M.F.; Attique, M.; Son, Y. Data-Driven Cervical Cancer Prediction Model with Outlier Detection and Over-Sampling Methods. Sensors 2020, 20, 2809. [Google Scholar] [CrossRef]
  29. Cervical Cancer. DataHub. 2020. Available online: https://www.datahub.io/machine-learning/cervical-cancer (accessed on 19 September 2022).
  30. Bharany, S.; Badotra, S.; Sharma, S.; Rani, S.; Alazab, M.; Jhaveri, R.H.; Gadekallu, T.R. Energy efficient fault tolerance techniques in green cloud computing: A systematic survey and taxonomy. Sustain. Energy Technol. Assess. 2022, 53. [Google Scholar] [CrossRef]
  31. Bharany, S.; Sharma, S.; Badotra, S.; Khalaf, O.I.; Alotaibi, Y.; Alghamdi, S.; Alassery, F. Energy-Efficient Clustering Scheme for Flying Ad-Hoc Networks Using an Optimized LEACH Protocol. Energies 2021, 14, 6016. [Google Scholar] [CrossRef]
  32. Kaur, K.; Bharany, S.; Badotra, S.; Aggarwal, K.; Nayyar, A.; Sharma, S. Energy-efficient polyglot persistence database live migration among heterogeneous clouds. J. Supercomput. 2022, 1–30. [Google Scholar] [CrossRef]
  33. Landoni, F.; Maneo, A.; Cormio, G.; Perego, P.; Milani, R.; Caruso, O.; Mangioni, C. Class II versus class III radical hysterectom in stage IB-IIA cervical cancer: A prospective randomized study. Gynecol. Oncol. 2001, 80, 3–12. [Google Scholar] [CrossRef]
  34. Bharany, S.; Sharma, S.; Bhatia, S.; Rahmani, M.K.I.; Shuaib, M.; Lashari, S.A. Energy Efficient Clustering Protocol for FANETS Using Moth Flame Optimization. Sustainability 2022, 14, 6159. [Google Scholar] [CrossRef]
  35. Bharany, S.; Sharma, S.; Khalaf, O.I.; Abdulsahib, G.M.; Al Humaimeedy, A.S.; Aldhyani, T.H.H.; Maashi, M.; Alkahtani, H. A Systematic Survey on Energy-Efficient Techniques in Sustainable Cloud Computing. Sustainability 2022, 14, 6256. [Google Scholar] [CrossRef]
  36. Ramirez, P.T.; Frumovitz, M.; Pareja, R.; Lopez, A.; Vieira, M.; Ribeiro, M.; Buda, A.; Yan, X.; Shuzhong, Y.; Chetty, N.; et al. Minimally Invasive versus Abdominal Radical Hysterectomy for Cervical Cancer. N. Engl. J. Med. 2018, 379, 1895–1904. [Google Scholar] [CrossRef]
  37. Bharany, S.; Kaur, K.; Badotra, S.; Rani, S.; Kavita; Wozniak, M.; Shafi, J.; Ijaz, M.F. Efficient Middleware for the Portability of PaaS Services Consuming Applications among Heterogeneous Clouds. Sensors 2022, 22, 5013. [Google Scholar] [CrossRef]
  38. Falconer, H.; Palsdottir, K.; Stalberg, K.; Dahm-Kähler, P.; Ottander, U.; Lundin, E.S.; Wijk, L.; Kimmig, R.; Jensen, P.T.; Eriksson, A.G.Z.; et al. Robot-assisted approach to cervical cancer (RACC): An international multi-center, open-label randomized controlled trial. Int. J. Gynecol. Cancer 2019, 29, 1072–1076. [Google Scholar] [CrossRef]
  39. Shuaib, M.; Badotra, S.; Khalid, M.I.; Algarni, A.D.; Ullah, S.S.; Bourouis, S.; Iqbal, J.; Bharany, S.; Gundaboina, L. A Novel Optimization for GPU Mining Using Overclocking and Undervolting. Sustainability 2022, 14, 8708. [Google Scholar] [CrossRef]
  40. Bharany, S.; Sharma, S. Intelligent Green Internet of Things: An Investigation. In Machine Learning, Blockchain, and Cyber Security in Smart Environments; Chapman and Hall/CRC: London, UK, 2022; pp. 1–15. [Google Scholar] [CrossRef]
  41. Wenzel, H.H.; Smolders, R.G.; Beltman, J.J.; Lambrechts, S.; Trum, H.W.; Yigit, R.; Zusterzeel, P.L.; Zweemer, R.P.; Mom, C.H.; Bekkers, R.L.; et al. Survival of patients with early-stage cervical cancer after abdominal or laparoscopic radical hysterectomy: A nationwide cohort study and literature review. Eur. J. Cancer 2020, 133, 14–21. [Google Scholar] [CrossRef]
  42. Bharany, S.; Sharma, S.; Frnda, J.; Shuaib, M.; Khalid, M.I.; Hussain, S.; Iqbal, J.; Ullah, S.S. Wildfire Monitoring Based on Energy Efficient Clustering Approach for FANETS. Drones 2022, 6, 193. [Google Scholar] [CrossRef]
  43. Talwar, B.; Arora, A.; Bharany, S. An Energy Efficient Agent Aware Proactive Fault Tolerance for Preventing Deterioration of Virtual Machines within Cloud Environment. In Proceedings of the 2021 9th International Conference on Reliability, Infocom Technologies and Optimization (Trends and Future Directions) (ICRITO), Noida, India, 3–4 September 2021; pp. 1–7. [Google Scholar] [CrossRef]
  44. Magrina, J.F.; Goodrich, M.A.; Weaver, A.L.; Podratz, K.C. Modified radical hysterectomy: Morbidity and mortality. Gynecol. Oncol. 1995, 59, 277–282. [Google Scholar] [CrossRef]
  45. Liu, X.; Guo, Z.; Cao, J.; Tang, J. MDC-net: A new convolutional neural network for nucleus segmentation in histopathology images with distance maps and contour information. Comput. Biol. Med. 2021, 135, 104543. [Google Scholar] [CrossRef] [PubMed]
Publisher’s Note: MDPI stays neutral with regard to jurisdictional claims in published maps and institutional affiliations.

Article Metrics

Citations

Article Access Statistics

Multiple requests from the same IP address are counted as one view.