Abstract
Being physical mechanical parameters of joints, normal and shear stiffnesses are indispensable components of the numerical simulation and theoretical analysis of the behavior of joints. The objective of this work is to put forward an experimental method to determine joint stiffness under constant normal load (CNL) conditions. For this purpose, joint closure and direct shear tests under CNL conditions were conducted. Normal stiffness was determined by the ratio of normal stress increment and the corresponding normal displacement; the shear stiffness was calculated by the ratio of shear stress increment to the relative shear displacement. The average and instantaneous shear stiffness were distinguished. Experimental results showed that joint normal and shear stiffness are time and spatially varying parameters during direct shearing. With increasing normal stress, average shear stiffness, maximum instantaneous shear stiffness, and normal stiffness increases. Normal stiffness was about 26–28 times higher than the average shear stiffness under one normal stress level. Average shear stiffness was little influenced by shear velocity. Instantaneous shear stiffness shows the velocity-dependent behavior. Maximum instantaneous shear stiffness decreases rapidly with increasing shear rate. At lower shear velocity, maximum instantaneous shear stiffness is higher than normal stiffness; minimum instantaneous shear stiffness can be negative and the absolute value also decreases with faster shear velocity. These findings provide a reference for selecting the appropriate value of normal and shear stiffness for evaluation of the mechanical response of interface.
1. Introduction
Rock is the main material of the earth’s crust. Rock mass is an important research subject in civil engineering, mining sciences, nuclear waste storage, and protective engineering. Rock mass contains discontinuities (joints) and is anisotropic. The performance of joints is of great significance to the design of tunnels, underground projects, water conservancy projects, and geothermal reservoirs, and the evaluation of geological hazards [1,2,3,4,5,6]. Being a physical mechanical parameter of rock joints, joint stiffness plays an important role in the numerical simulation and theoretical analysis of their behavior [7,8].
With the aim of obtaining a closer understanding of the deformation of joint stiffness, several experimental and theoretical investigations have described the mechanical behavior of the interface during locked or sliding contact under CNL conditions [8,9,10,11,12,13,14,15,16,17,18,19]. Rock joints occupy space and have thickness [14]. The block-to-block contact can be viewed as either a thin-layer problem [20] or a no-thickness problem [20,21,22]. The interface normal stiffness (kn) between two solids can be defined as the macroscopic contact stress required to produce one unit of mutual proximity on the surface (Equation (1)). Meanwhile, shear stiffness (ks) is the tangential stress needed to cause shear deformation per unit length (Equation (2)).
- dσn: the normal stress increment,
- dτ: the shear stress increment,
- dun: the joint normal displacement increment,
- dus: the shear displacement increment.
To be specific, previous studies employed several experimental techniques (such as detecting ultrasonic waves, evaluating local natural frequencies) to estimate the contact stiffness of solids [9,10,11]. Paggi and Wriggers [23] found that interface nonlinearity contributed significantly to the deformability of the polycrystalline materials. An increase in the number of levels increased the ability to transform. Anisotropy of stiffness and strength is observed due to different load orientations and mixed mode deformations of the interface. Stiffness anisotropy is amplified by increasing the number of levels. Xiao et al. [24] studied the interaction between a rough surface and a rigid plane, including force deflection characteristics and the corresponding nonlinear vibration. The nonlinear characteristics of contact stiffness and its influence on natural frequency and frequential response of different rough surface topography are analysed. Kumar and Verma [18] performed direct shear tests under constant normal load. The shear stiffness was calculated as the slope of the shear curve within the range from 0.25 to 0.75 of peak shear stress in each shearing direction and they found that it increases with larger normal stress in every shear direction. The shear behavior of planar joints is explored using FLAC3D. They proved that the stiffness is very sensitive to the simulation results [8]. Similarly, Zhang et al. [19] established a meso-scale FE [25,26] model to numerically estimate the stiffness and strength properties of 3D braided composites. Constant contact normal stiffness does not lead to uniform settlement of specimens under different normal stresses. In general, a satisfactory consistency can be obtained only if the normal stiffness increases proportionally with the increase of the normal load. It indirectly proves that normal and shear stiffness is enlarged by increasing normal load level. For instance, Raffa et al. [25] proposed a spring-based contact framework to depict the mechanical characteristics of rough surfaces in locked contact, considering a closure stress.
In this paper, joint closure and joint shear tests with different shear velocities of a planar joint were conducted in a laboratory. According to these lab investigations, joint normal and shear stiffness were determined. The lab test set-up is detailed in Section 2, and the test results are provided in Section 3. The method of calculating shear stiffness is discussed in Section 4, and Section 5 presents the main conclusion.
2. Lab Test Set-Up
2.1. Sample
The rock specimens were sourced from the construction site of Jiangjunshan Tunnel, Zhuhai, and had a size of 300 mm × 60 mm × 150 mm (length × width × height). The jointed specimen contained a saw-cut plane joint which separated the specimen in the middle. The roughness of the joint surface was checked by the optical scanning system and had less than 0.1 cm deviation from an ideal smooth plane. As reported in Table 1, under this condition, samples had the following parameters:

Table 1.
The properties of tested sample.
2.2. Joint Closure and Direct Shear Tests Set-Up
2.2.1. Joint Closure Tests
To test the joint normal stiffness, we conducted joint closure tests in the rock mechanical laboratory of TU Freiberg. The normal load started at 0.1 kN up to 180 kN with a loading rate of 1/6 kN/s, followed by unloading to 10 kN with an unloading rate of 1/6 kN/s. Afterwards, the normal load rose to 90 kN with the same loading rate. Note that these tests were carried out for both the intact specimen and specimen with joints. The system for measuring displacement is shown in Figure 1.
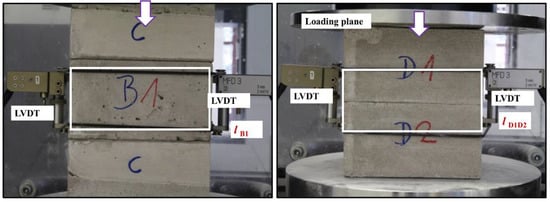
Figure 1.
The configuration of displacement measurement.
Figure 1 displays the advanced displacement measuring system, which can detect the deformation of the rock matrix or the joints directly. Also, by using external displacement sensors, it can reduce test errors caused by the interfaces between specimen and loading plates. As shown in the photos, B1 was an intact rock sample and D1D2 was jointed. As a result, the joint displacement and joint normal stiffness are calculated using Equations (3) and (4):
lJoint = lD1D2 − lB1
- lJoint is the actual displacement of the joint,
- lD1D2 is the displacement of the jointed specimen (sensors measured),
- lB1 is the displacement of the intact specimen (sensors measured).kn= σn/lJoint
- σn is the applied normal stress.
2.2.2. Direct Shear Tests
For direct shear tests of planar joints, a GS-1000 shear box device [27] was used (Figure 2). Four shear rates (100 mm/min, 10 mm/min, 1 mm/min, and 0.1 mm/min) and three levels of normal stress (1.25 MPa, 1.875 MPa, and 3.75 MPa) were selected for our tests. Shear displacements were measured with a highaccuracy (±1 micron) horizontal LVDT affixed to the lower part of the shear box. Force sensors were built into vertical and horizontal loading pistons, which measured the corresponding load values. Nguyen et al. [7] have published the specimen installation procedures, and we followed these principles. The relative parameters used for the different modes of testing are reported in Table 2.
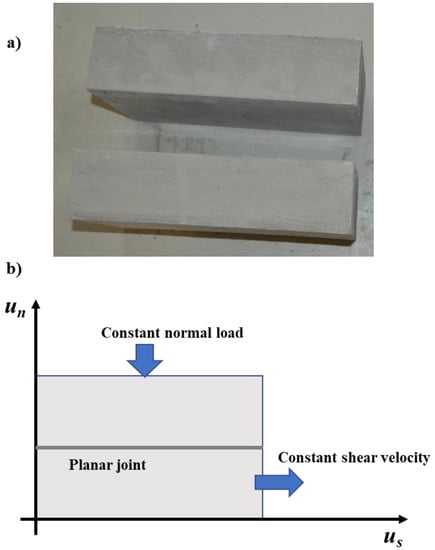
Figure 2.
Method of experimental study: (a) the concrete specimen (size: 300 mm × 160 mm × 150 mm), and (b) the loading mode of direct shear test.
Table 2.
Set-up for CNL multi-stage tests.
3. Test Results
3.1. Joint Closure Test Results
Joint closure test results are shown in Figure 3. During the first loading stage, there was some porosity of the specimen and a certain amount of space of the contact surface. Only the repeated (second round) loading/unloading parts were selected for calculation (shown in Figure 3a,b). The measured normal displacements were normalized so that a normal stress of 0 MPa corresponded to a normal displacement of 0 mm (Figure 3c). Figure 3d shows that joint normal displacement (calculated by Equation (3)) and joint normal stiffness (calculated by Equation (4)) changed with change in normal stress, and both of them increased with an increase in normal stress. The normal stiffness ranged from 51 to 92 MPa/mm within normal stress from 0.4 to 3.75 MPa. The normal stiffness changing trend agrees well with the previous research [6,8]. The normal stiffness can be calculated by using the following formula:
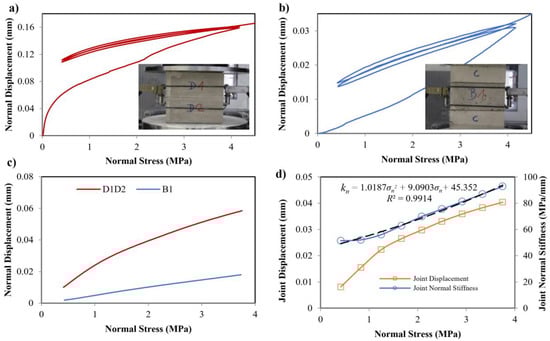
Figure 3.
Joint closure test results: (a) measured normal displacement vs. normal stress of the joint specimen, (b) measured normal displacement vs. normal stress of the intact specimen, (c) normalized displacement vs. normal stress, and (d) joint normal stiffness and joint displacement vs. normal stress.
- kn is the joint normal stiffness,
- σn is the normal stress.
3.2. Direct Shear Test Results
Figure 4 illustrates a representative result of the relationship between shear stress and shear distance. Obviously, with increasing normal stress, the shear load increased. Observing each shear stage, firstly, the shear stress increased linearly with the increase of shear displacement until it reached the peak shear stress. When the peak shear stress was reached, the frictional sliding proceeded stably under the residual shear stress level almost the same as for the peak. The shear stress-shear displacement diagram can be considered as having three stages, which are described as follows:
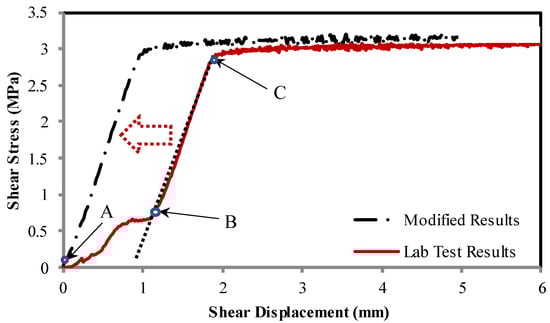
Figure 4.
Shear stress vs. shear displacement under normal stress of 3.75 MPa at shear velocity of 100 mm/min.
- Stage 1 (A–B): At this stage, the shear distance was not big enough and the interface was mainly compacted. There was an irregular relationship between initial shear stress and shear displacement. At this stage, the specimen and the shear box spontaneously adjusted to each other to form a stable contact.
- Stage 2 (B–C): The second stage comprised linear elastic deformations with increasing shear stress until peak value was reached. Unloading of shear stress may have recovered the shear displacement elastically.
- Stage 3 (After point C): The third stage was characterized by friction sliding. In this stage, the shear stress remained stable with a little fluctuation owing to the surface roughness and damage.
In order to eliminate any errors caused by the space between the specimen and shear box device (shearing stage: A–B) the lab test result was modified, as shown in Figure 4. The elastic stage of the shear stress was extended to zero, then the starting point of the shear displacement was shifted to zero. The modified shear stress–displacement curves are shown in Figure 5. It can be seen that shear stresses increased with increasing normal stresses. Shear velocity had little influence on the peak shear stress, which differed from the results reported by Atapour and Moosavi [17]. In general, increasing shear velocity could increase or decrease the shear strength according to the material characteristics. For our material and the tested velocity range (0.1 mm/min~100 mm/min), the shear velocity had only very little influence on shear strength (negligible). The properties of Atapour and Moosavi’s [17] material (e.g., compressive strength, Young’s modulus, Poisson’s ratio, microstructure, grain size distribution, etc.) are different to ours. Therefore, we believe that depending on the material increasing or decreasing or even staying more or less constant, shear strength can be observed with varying shear velocity. However, shear veloctiy has significant influence on the stick–slip behavior (from the partial enlarged drawing in Figure 5, the stick–slip characters were observed in all the direct shear tests). The shear stress–displacement curves fluctuate significantly at low shear velocities, which means that lower shear velocity leads to more pronounced stick–slip behavior. It can be concluded that stick–slip behavior increases with decreasing shear velocity. This conclusion agrees with the results reported by Bro [28].
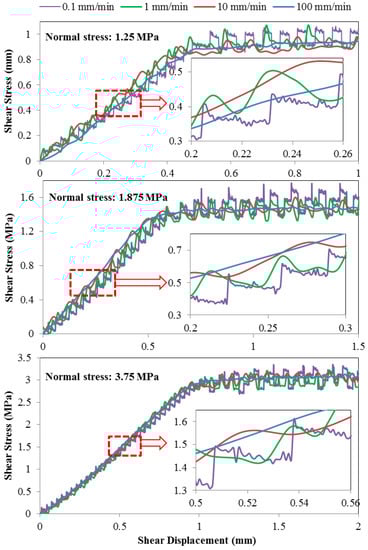
Figure 5.
Shear stress vs. shear displacement under different normal load conditions.
Average shear stiffness was calculated for all tests based on the slope of the increasing branch of the graphs in Figure 5. As shown in Figure 6, average shear stiffness increased with increasing normal stress. Under the same normal stress level, average shear stiffness was nearly contant at different shear velocities. Here, the calculated shear stiffnesses were about 2.2 MPa/mm, 2.7 MPa/mm, and 3.2 MPa/mm under normal stress of 1.25 MPa, 1.875 MPa, and 3.75 MPa, respectively. Under these normal stress levels, the corresponding normal stiffnesses were 56 MPa/mm, 69 MPa/mm, and 90 MPa/mm, respectively. The ratio between the normal stiffness and average shear stiffness was about 26:28 in all tested normal stress levels. This ratio is a good reference for selecting the numerical simulation parameter. Instantaneous maximum shear stiffness was calculated for all tests based on the slope of the instantaneous increasing part of the partially enlarged drawing in Figure 5. As shown in Figure 7, instantaneous maximum shear stiffness also increased with increasing normal stress, but was significantly influenced by shear velocities. With increasing shear velocity, instantaneous maximum shear stiffness dropped dramatically. It is worthwhile to note that the instantaneous maximum shear stiffness was mainly decreased by shear velocity in the range of 0.1–1 mm/min. At higher shear velocities (10–100 mm/min), the stiffness was less affected by the shear velocity, and it was close to the average shear stiffness. The variation behavior of the instantaneous maximum shear stiffness was associated with the stick–slip behehavior. Comprehensive understanding of the mechanism of the stick–slip behavior leads us to a deeper understanding of instantaneous maximum shear stiffness changing along with shear velocity.
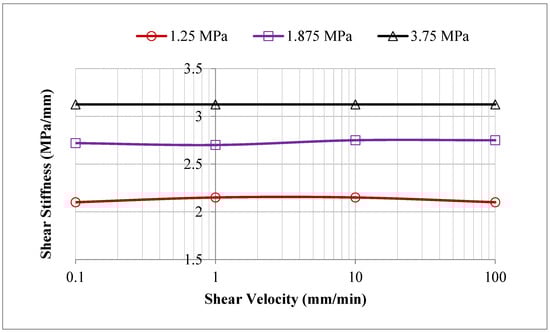
Figure 6.
Average shear stiffness vs. shear velocity under different normal stress conditions.
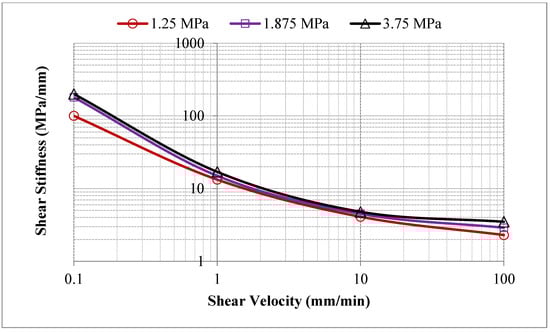
Figure 7.
Maximum shear stiffness vs. shear velocity.
4. Discussion
4.1. Calculation of Shear Stiffness
The method for calculating shear stiffness suggested by ISRM [28] defines shear stiffness as the ratio of shear stress to the corresponding shear displacement prior to reaching the peak shear strength. According to this definition, shear stiffness is an average and macroscopic value. However, for some tests, the specific points of the peak shear stress are not very clear (especially for the direct shear tests at low shear velocity). So, the calculated value of the shear stiffness depends on the selected range of shear displacement. Taking Atapour and Moosavi’s [17] work, for instance, under normal stress of 0.64 MPa at shear velocity of 0.3 mm/min within the shear range of 0 to 0.2 mm, the calculated shear stiffness was about 1.5 MPa/mm, whereas within the shear range of 0 to 0.3 mm, the calculated shear stiffness becomes about 1.3 MPa/mm. The shear stiffness of 2.0 MPa/mm that was reported by Atapour and Moosavi [17] is very confusing. It is not easy to select the appropriate calculation section (the peak shear stress is not very clear in their tests with 0.3 mm/min slip rate). Therefore, their statement “shear stiffness rapidly decreased when the shearing velocity increased” seems arbitrary. Additionally, the stick-slip behavior also occurred in their tests (the shear stress-shear displacement curve fluctuates), but was not included in their calculations; and the instantaneous shear stiffness was also neglected.
Nowadays, it is widely accepted that there is an elastic shearing stage before reaching the peak shear strength during direct shearing [7,29] (also documented in Section 3). We recommend researchers use the elastic shearing stage for calculation of the average shear stiffness. Moreover, if the stick–slip behavior is pronounced, the instantaneous shear stiffness should also be given, as it can make the physical meaning of the shear stiffness clearer.
4.2. Stiffness Non-Uniform Distribution
Stiffness (shear stiffness and normal stiffness) is an essential input parameter in the simulation of jointed rock mass using computational methods. As presented in Equation (6), this classical formula is widely used to determine the normal and shear stiffness of joints in numerical simulations, but it is problematic in that it shows that the value of the shear and normal stiffness is only influenced by the minimum size of the mesh of contact surfaces, Young’s modulus, and bulk modulus. Therefore, normal and shear stiffness is a constant value of the interface using FLAC3D [26].
The normal stress effect is neglected (lab test and numerical simulation results have proved that normal stiffness increases with an increase in normal stress [8,17,25]. Moreover, average normal and shear stiffness are popularly used for the evaluation of joints, but there have been few investigations of instantaneous stiffness. Therefore, it is urgent to put forward a method to determine the “real stiffness”, which can provide us a deeper understanding of the mechanical behavior of joints.
- kn is the joint normal stiffness,
- ks is the joint shear stress,
- K is the Young modulus,
- G is the bulk modulus,
- Δzmin is the minimum size of the mesh of contact surfaces.
Dang et al. [8] reported that the stress is non-uniformly distributed along the interface of the planar joint during direct shearing (Figure 8). Combined with the statement “average shear and normal stiffness increases with the enhancement of normal stress”, documented in Section 3, we can indirectly deduce that the stress with non-uniform distribution also leads to the stiffness with non-uniform distribution along the interface. Moreover, normal and shear stresses change during shearing at different times and different parts of the joint surface. It also means that normal and shear stiffness change and they are time and spatially varying parameters during direct shearing. In general, people always use a constant value of the normal or shear stiffness in numerical simulation [7,8]. Detailed lab test results and numerical simulation results prove that normal and shear stiffness are time- and spatially varying parameters. Therefore, the constant of the normal and shear stiffness should be varied during the direct shearing, which can make the numerical simulation process closer to the real situation in the lab.
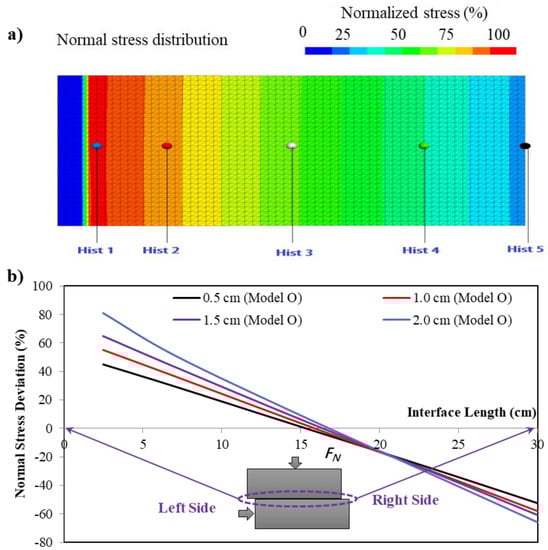
Figure 8.
(a) Contours of normal stress for shear test with the applied normal stress of 1.875 MPa when shear displacement reached 20 mm, and (b) simulated results, uneven normal stress arrangement (deviation from average value) along the shear direction.
5. Conclusions
This study presents an experimental method developed for determining the joint normal and shear stiffnesses in the laboratory. Joint closure tests and direct shear tests were performed under CNL conditions. The average and instantaneous shear stiffnesses were distinguished. The main foundation of this research is summarized as follows:
- Joint normal and shear stiffnesses are time- and spatially varying parameters during direct shearing.
- With increasing normal stress, average shear stiffness, instantaneous shear stiffness, and normal stiffness increase. Normal stiffness is about 26–28 times higher than the average shear stiffness.
- Instantaneous shear stiffness of joints decreases rapidly when the shear velocity is increased.
- At lower shear velocities, stick–slip behavior is remarkable, instantaneous shear stiffness can be higher than the normal stiffness, minimum instantaneous shear stiffness can be negative, and the absolute value decreases with increase in shear velocity.
It should be noted that the roughness of the surface can also change the stick–slip and shear behaviors [30], which was not taken into consideration in this paper. Additionally, the material type and loading approach also influence the behavior of stiffness. Further investigations on these topics [31,32,33,34,35] will be conducted in the near future.
Author Contributions
Conceptualization, D.L. (Dong Li), W.D. and D.L. (Dongyang Li); methodology, W.D. and D.L. (Dong Li); formal analysis, W.D.; investigation, W.D.; resources, W.D. and D.L. (Dong Li); data curation, W.D.; writing—original draft preparation, W.D.; writing—review and editing, W.D. and G.A.; project administration, D.L. (Dong Li), W.D. and X.C.; funding acquisition, D.L. (Dong Li) and X.C. All authors have read and agreed to the published version of the manuscript.
Funding
The authors are grateful for financial support from the Zhuhai Science and Technology Planning Project in the field of social development (ZH22036205200004PWC), the Zhuhai Industry University Research Cooperation Project (ZH22017001200149PWC), and the Science and Technology Planning Project of Guangdong Provincial Department of Housing and Urban Rural Development (2020−K4−315671, 2020−K4−534762, 2021−K4−021299).
Institutional Review Board Statement
Not applicable.
Informed Consent Statement
Not applicable.
Data Availability Statement
The data presented in this study are available on reasonable request from the corresponding author.
Conflicts of Interest
The authors declare no conflict of interest.
References
- Hoek, E.; Brown, E.T. Underground Excavations in Rock; The Institution of Mining and Metallurgy: London, UK, 1980. [Google Scholar]
- Hoek, E.; Bray, J. Rock Slope Engineering; Taylor & Francis: London, UK, 1981. [Google Scholar]
- Liu, Z.; Dang, W.; He, X. Undersea safety mining of the large gold deposit in Xinli District of Sanshandao Gold Mine. Int. J. Miner. Metall. Mater. 2012, 19, 574–583. [Google Scholar] [CrossRef]
- Liu, Z.-X.; Dang, W.-G.; He, X.-Q.; Li, D.-Y. Cancelling ore pillars in large-scale coastal gold deposit: A case study in Sanshandao gold mine, China. Trans. Nonferrous Met. Soc. China 2013, 23, 3046–3056. [Google Scholar] [CrossRef]
- Liu, Z.; Dang, W. Rock quality classification and stability evaluation of undersea deposit based on M-IRMR. Tunn. Undergr. Space Technol. 2014, 40, 95–101. [Google Scholar] [CrossRef]
- Dang, W.; Konietzky, H.; Frühwirt, T. Shear behaviour of a plane joint under dynamic normal load (DNL) conditions. Eng. Geol. 2016, 213, 133–141. [Google Scholar] [CrossRef]
- Nguyen, V.H.; Konietzky, H.; Frühwirt, T. New methodology to characterize shear behavior of joints by combination of direct shear box testing and numerical simulations. Geo. Geol. Eng. 2014, 32, 829–846. [Google Scholar] [CrossRef]
- Dang, W.; Konietzky, H.; Frühwirt, T. Rotation and stress changes on a plane joint during direct shear tests. Int. J. Rock Mech. Min. Sci. 2016, 89, 129–135. [Google Scholar] [CrossRef]
- Krolikowski, J.; Szczepek, J.; Witczak, Z. Ultrasonic investigation of contact between solids under high hydrostatic-pressure. Ultrasonics 1989, 27, 45–49. [Google Scholar] [CrossRef]
- Sherif, H.A.; Kossa, S.S. Relationship between normal and tangential contact stiffness of nominally flat surfaces. Wear 1991, 151, 49–62. [Google Scholar] [CrossRef]
- Krolikowski, J.; Szczepek, J. Assessment of tangential and normal stiffness of contact between rough surfaces using ultrasonic method. Wear 1993, 160, 253–258. [Google Scholar] [CrossRef]
- Baltazar, A.; Rokhlin, S.I.; Pecorari, C. On the relationship between ultrasonic and micromechanical properties of contacting rough surfaces. J. Mech. Phys. Solids 2002, 50, 1397–1416. [Google Scholar] [CrossRef]
- Dwyer, J.R.S.; Gonzalez, V.M. Ultrasonic determination of normal and shear interface stiffness and the effect of Poisson’s ratio. Tribol. Ser. 2003, 43, 143–149. [Google Scholar]
- Wang, J.G.; Ichikawa, Y.; Leung, C.F. A constitutive model for rock interfaces and joints. Int. J. Rock Mech. Min. Sci. 2003, 40, 41–53. [Google Scholar] [CrossRef]
- Gonzalez, V.M.; Baltazar, A.; Dwyer, J.R.S. Study of interfacial stiffness ratio of a rough surface in contact using a spring model. Wear 2010, 268, 373–379. [Google Scholar] [CrossRef]
- Kumar, S.; Scanlan, J.P. On axisymmetric adhesive joints with graded interface stiffness. Int. J. Adhes. Adhes. 2013, 41, 57–72. [Google Scholar] [CrossRef]
- Atapour, H.; Moosavi, M. The influence of shearing velocity on shear behavior of artificial joints. Rock Mech. Rock Eng. 2014, 47, 1745–1761. [Google Scholar] [CrossRef]
- Kumar, R.; Verma, A.K. Anisotropic shear behavior of rock joint replicas. Int. J. Rock Mech. Min. Sci. 2016, 90, 62–73. [Google Scholar] [CrossRef]
- Zhang, C.; Curiel-Sosa, J.L.; Bui, T.Q. A novel interface constitutive model for prediction of stiffness and strength in 3D braided composites. Compos. Struct. 2017, 163, 32–43. [Google Scholar] [CrossRef]
- Desai, C.S.; Zaman, M.M.; Lightner, J.G.; Siriwardane, H.J. Thin-layer element for interfaces and joints. Int. J. Numer. Anal. Meth. Geomech. 1984, 8, 19–43. [Google Scholar] [CrossRef]
- Goodman, R.E. Methods of Geological Engineering in Discontinuous Rocks; West Publishing Company: San Francisco, CA, USA, 1976. [Google Scholar]
- Sharma, K.G.; Desai, C.S. Analysis and implementation of thin-layer element for interfaces and joints. J. Eng. Mech. 1992, 118, 2442–2462. [Google Scholar] [CrossRef]
- Paggi, M.; Wriggers, P. Stiffness and strength of hierarchical polycrystalline materials with imperfect interfaces. J. Mech. Phys. Solids 2012, 60, 557–572. [Google Scholar] [CrossRef]
- Xiao, H.; Shao, Y.; Brennan, M.J. On the contact stiffness and nonlinear vibration of an elastic body with a rough surface in contact with a rigid flat surface. Eur. J. Mech. A Solids 2015, 49, 321–328. [Google Scholar] [CrossRef]
- Raffa, M.L.; Lebon, F.; Vairo, G. Normal and tangential stiffnesses of rough surfaces in contact via an imperfect interface model. Int. J. Solids Struct. 2016, 87, 245–253. [Google Scholar] [CrossRef]
- Itasca. FLAC3D—Fast Lagrangian Analysis of Continua in 3 Dimensions—Theory and Background; Itasca Consulting Group Inc.: Minneapolis, MN, USA, 2012. [Google Scholar]
- Konietzky, H.; Frühwirt, T.; Luge, H. A new large dynamic rock mechanical direct shear box device. Rock Mech. Rock Eng. 2012, 45, 427–432. [Google Scholar] [CrossRef]
- Muralha, J.; Grasselli, G.; Tatone, B.; Blümel, M.; Chryssanthakis, P.; Yujing, J. ISRM Suggested Method for Laboratory Determination of the Shear Strength of Rock Joints: Revised Version. Rock Mech. Rock Eng. 2014, 47, 291–302. [Google Scholar] [CrossRef]
- Dang, W.; Konietzky, H.; Herbst, M.; Frühwirt, T. Complex analysis of shear box tests with explicit consideration of interaction between test device and sample. Measurement 2017, 102, 1–9. [Google Scholar] [CrossRef]
- Li, W.S.; Jiang, B.Y.; Gu, S.T.; Yang, X.X.; Shaikh, F.U.A. Experimental study on the shear behavior of grout-infilled specimens and micromechanical properties of grout-rock interface. J. Cent. South Univ. 2022, 29, 1686–1700. [Google Scholar] [CrossRef]
- Du, K.; Yang, C.Z.; Su, R.; Tao, M.; Wang, S.F. Failure properties of cubic granite, marble, and sandstone specimens under true triaxial stress. Int. J. Rock Mech. Min. Sci. 2020, 130, 104309. [Google Scholar] [CrossRef]
- Du, K.; Li, X.F.; Tao, M.; Wang, S.F. Experimental study on acoustic emission (AE) characteristics and crack classification during rock fracture in several basic lab tests. Int. J. Rock Mech. Min. Sci. 2020, 133, 104411. [Google Scholar] [CrossRef]
- Du, K.; Li, X.F.; Yang, C.Z.; Zhou, J.; Chen, S.J.; Manoj, K. Experimental investigations on mechanical performance of rocks under fatigue loads and biaxial confinements. J. Cent. South Univ. 2020, 27, 2985–2998. [Google Scholar] [CrossRef]
- Dou, L.; Yang, K.; Chi, X. Fracture behavior and acoustic emission characteristics of sandstone samples with inclined precracks. Int. J. Coal Sci. Technol. 2021, 8, 77–87. [Google Scholar] [CrossRef]
- Petr, V.N.; Svetlana, A.E.; Vladimir, L.S.; Polina, S.A. Experimental study of coal fracture dynamics under the influence of cyclic freezing–thawing using shear elastic waves. Int. J. Coal Sci. Technol. 2021, 8, 562–574. [Google Scholar]
Publisher’s Note: MDPI stays neutral with regard to jurisdictional claims in published maps and institutional affiliations. |
© 2022 by the authors. Licensee MDPI, Basel, Switzerland. This article is an open access article distributed under the terms and conditions of the Creative Commons Attribution (CC BY) license (https://creativecommons.org/licenses/by/4.0/).