
Perceived Accessibility and Key Influencing Factors in Transportation


Abstract
:1. Introduction
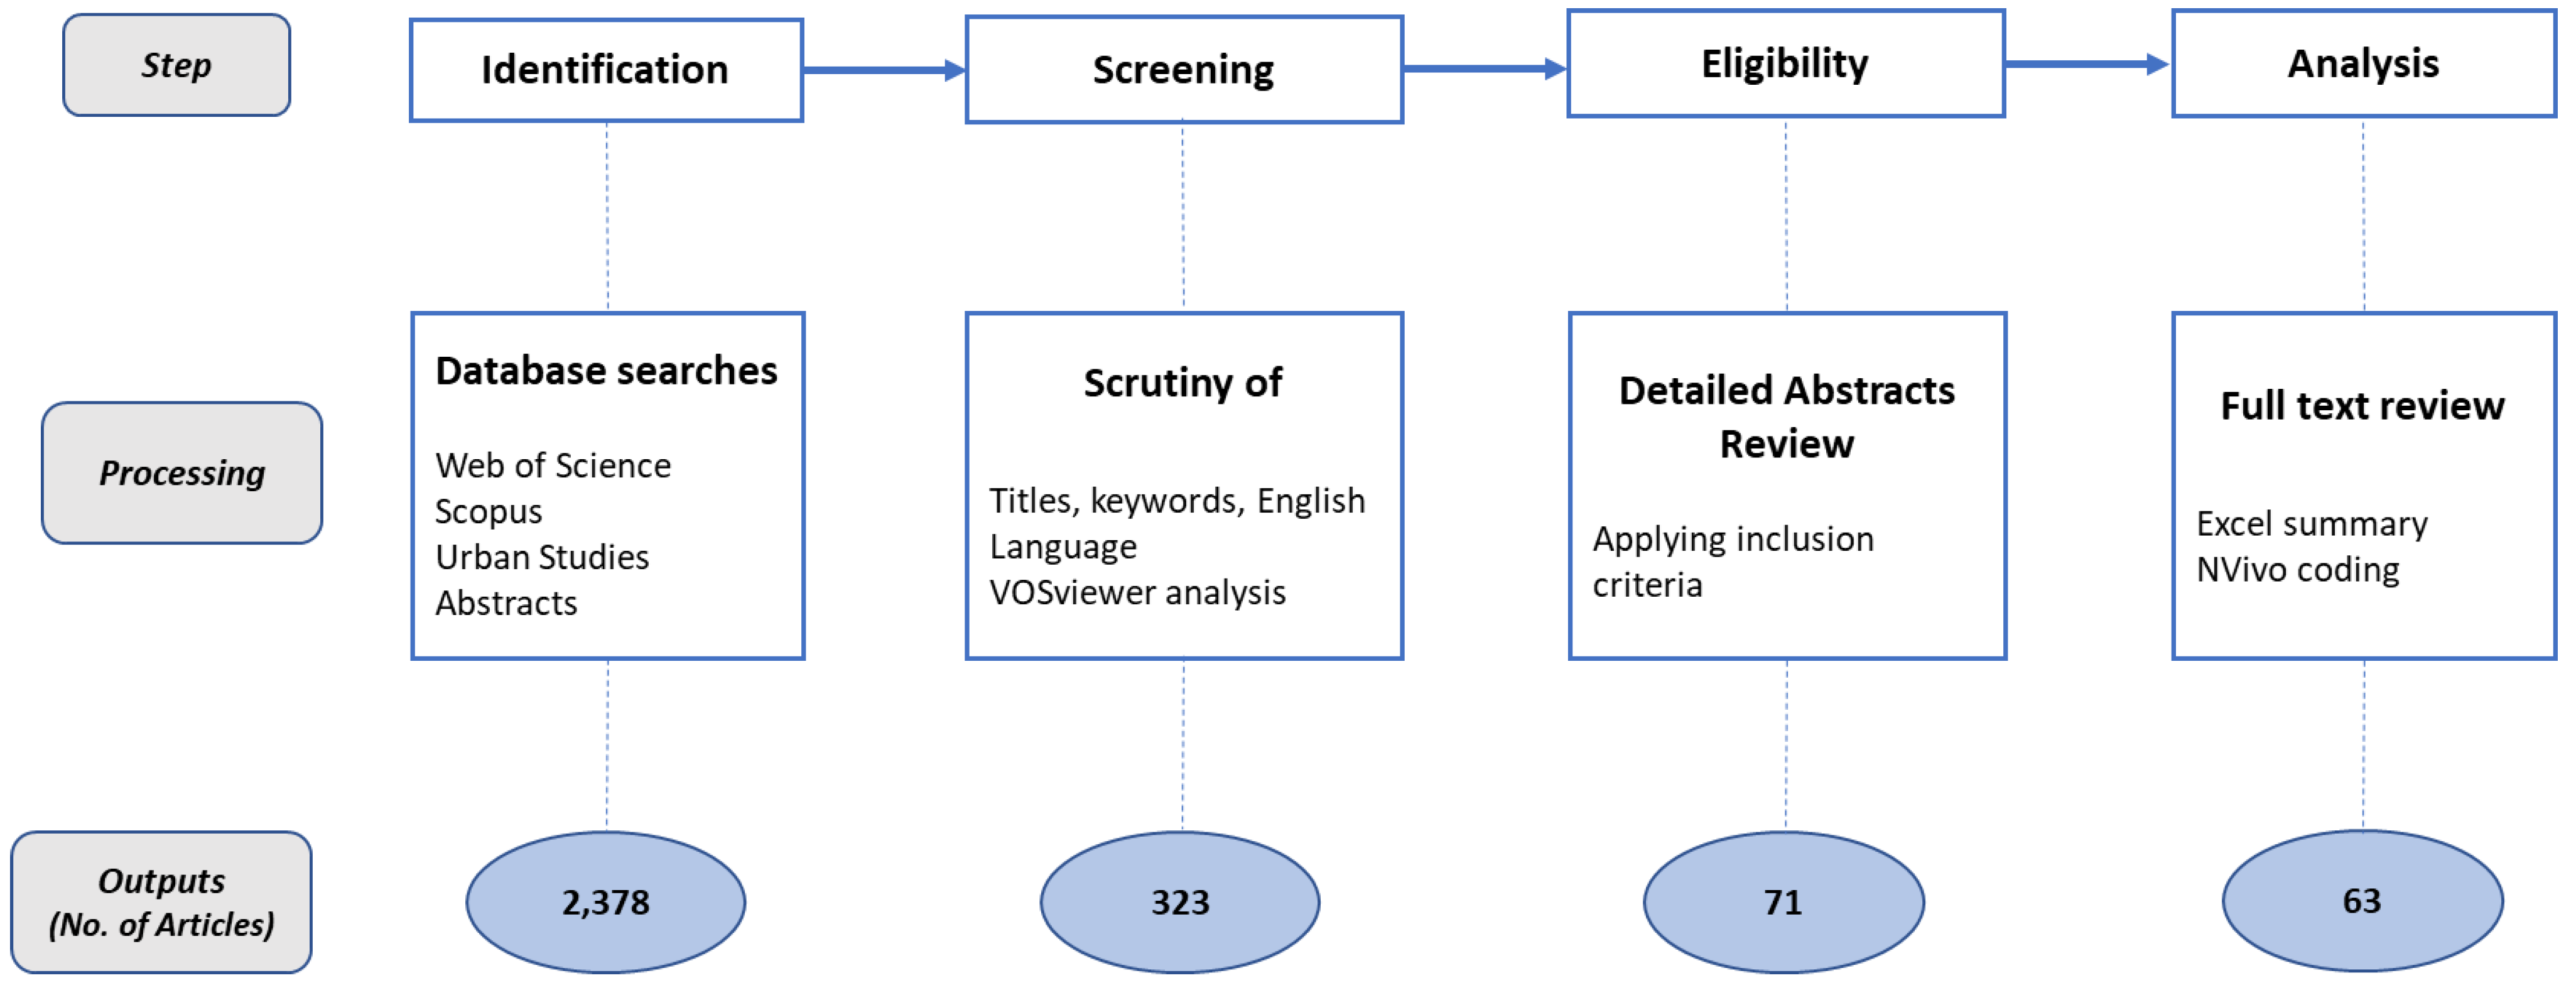
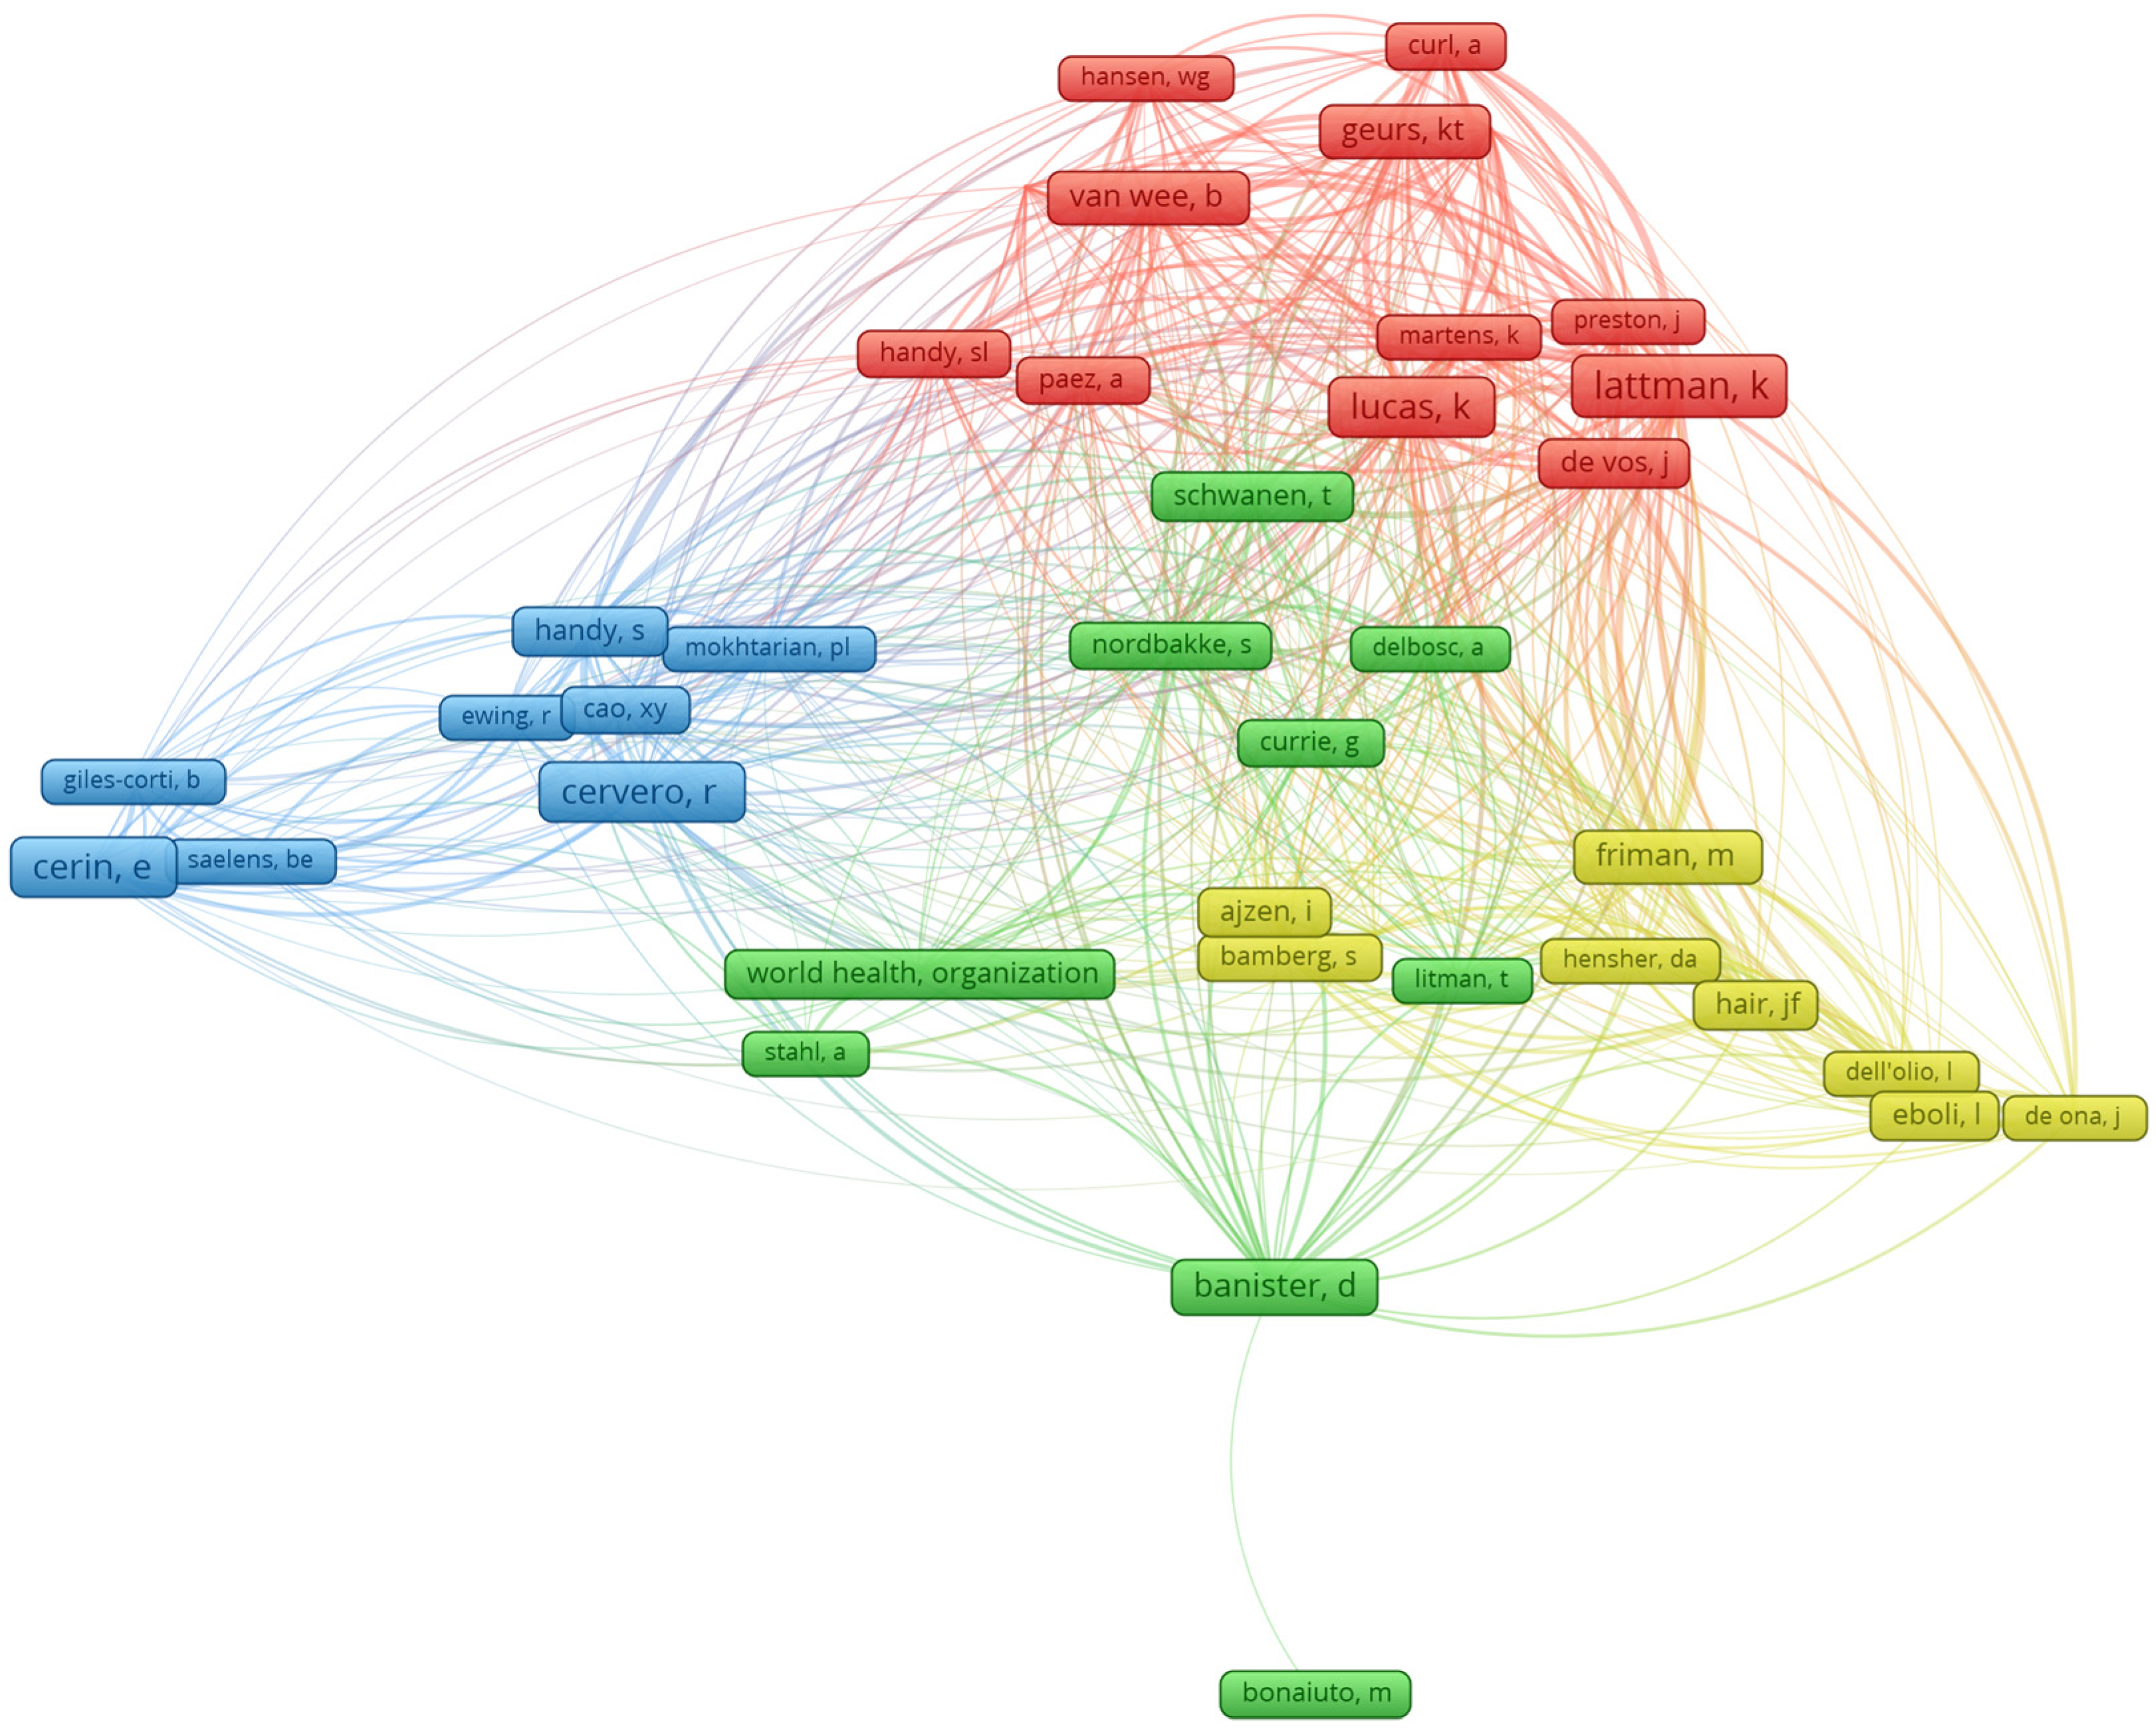
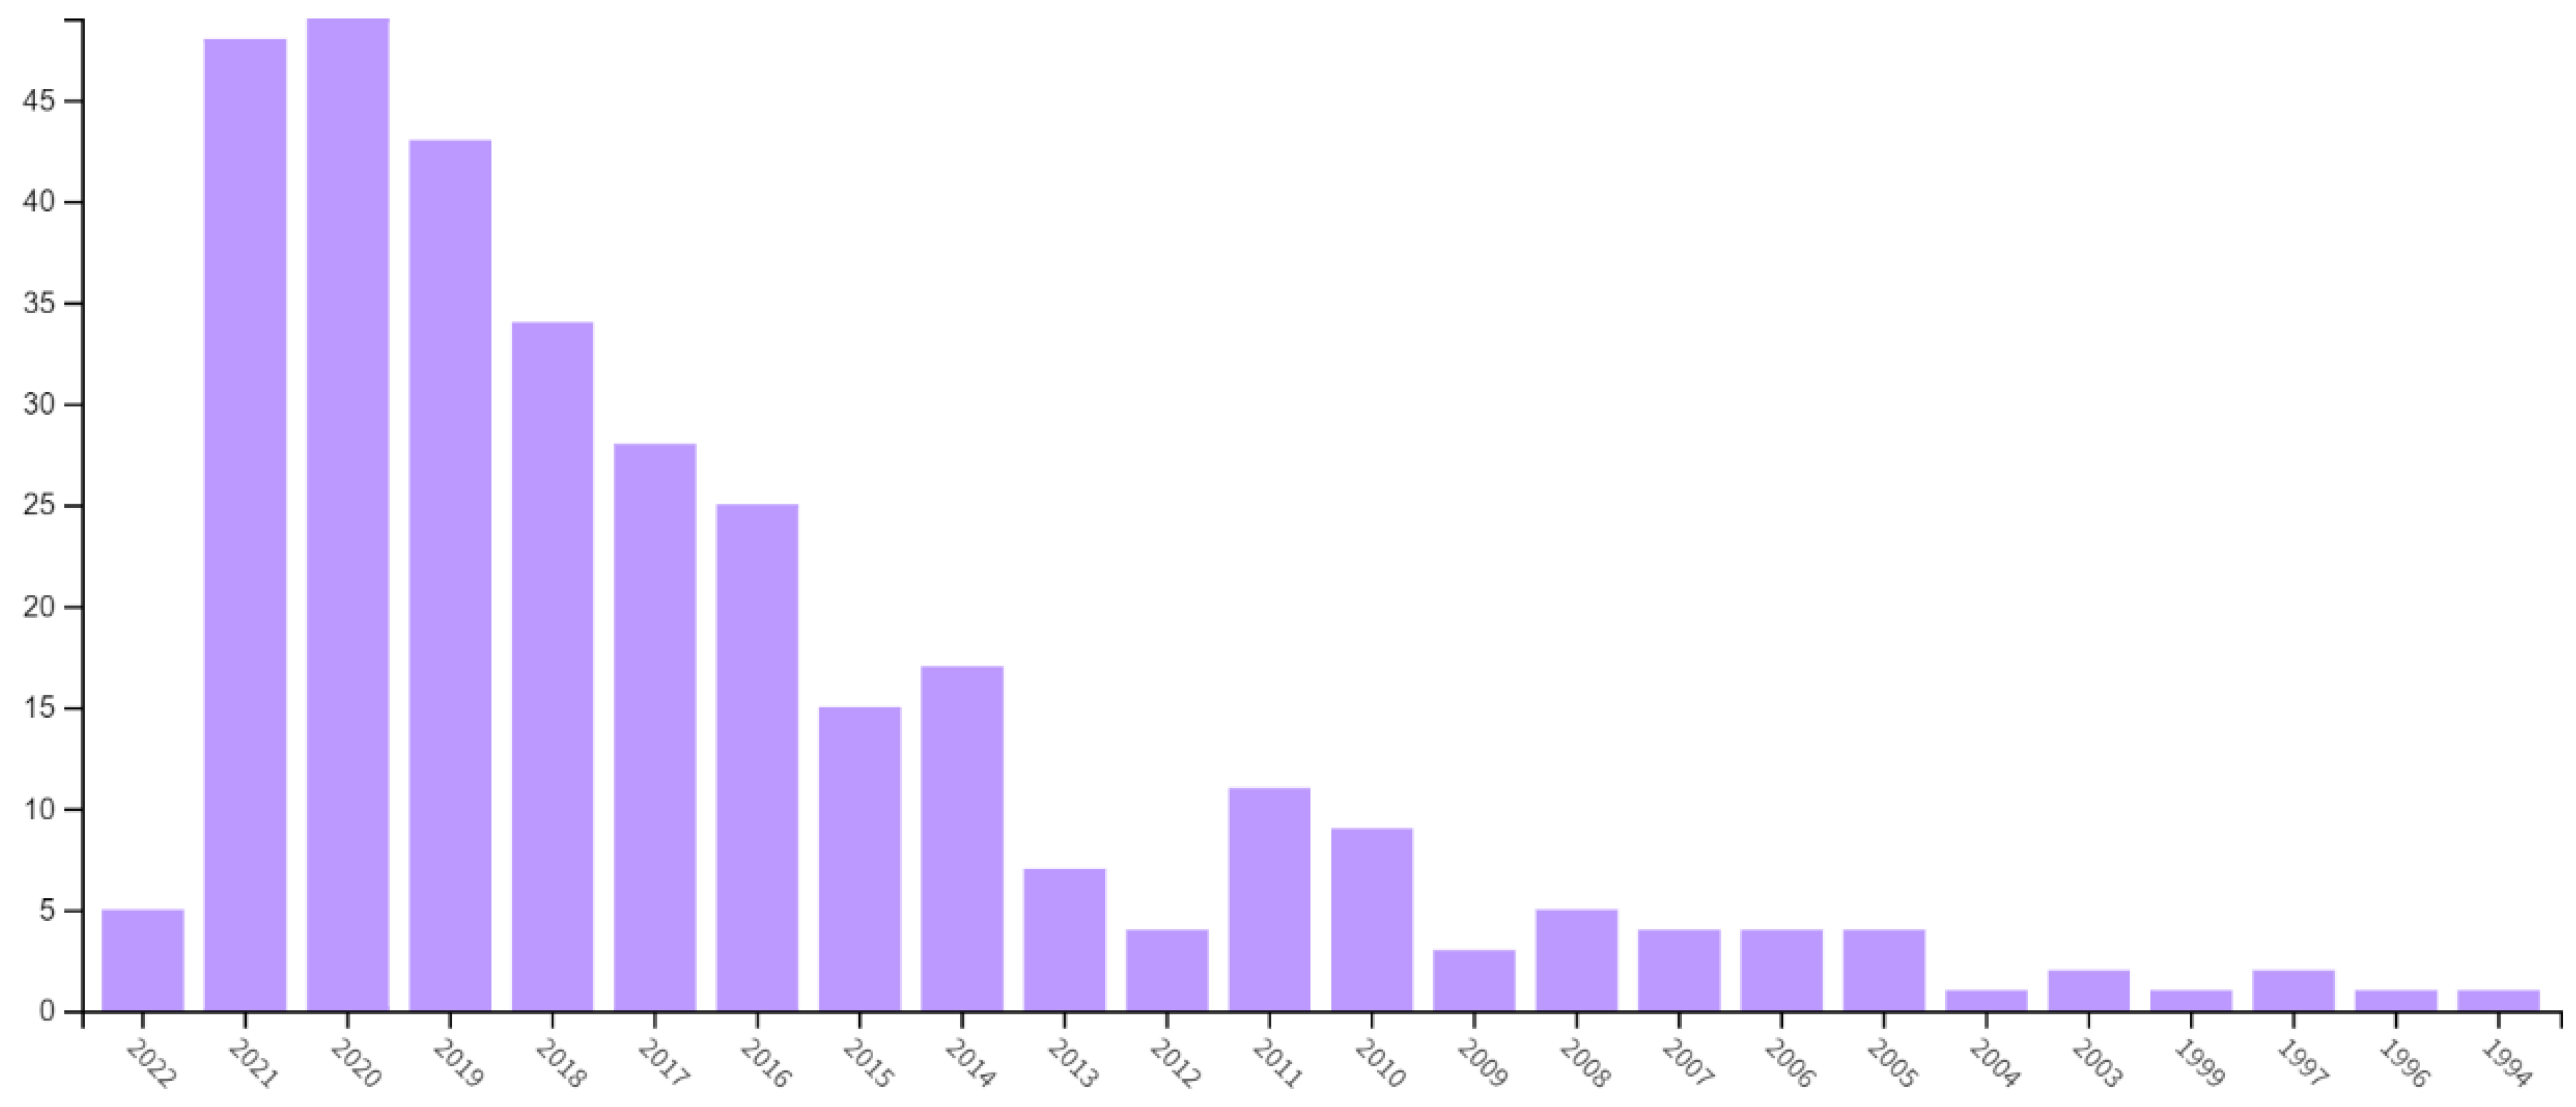
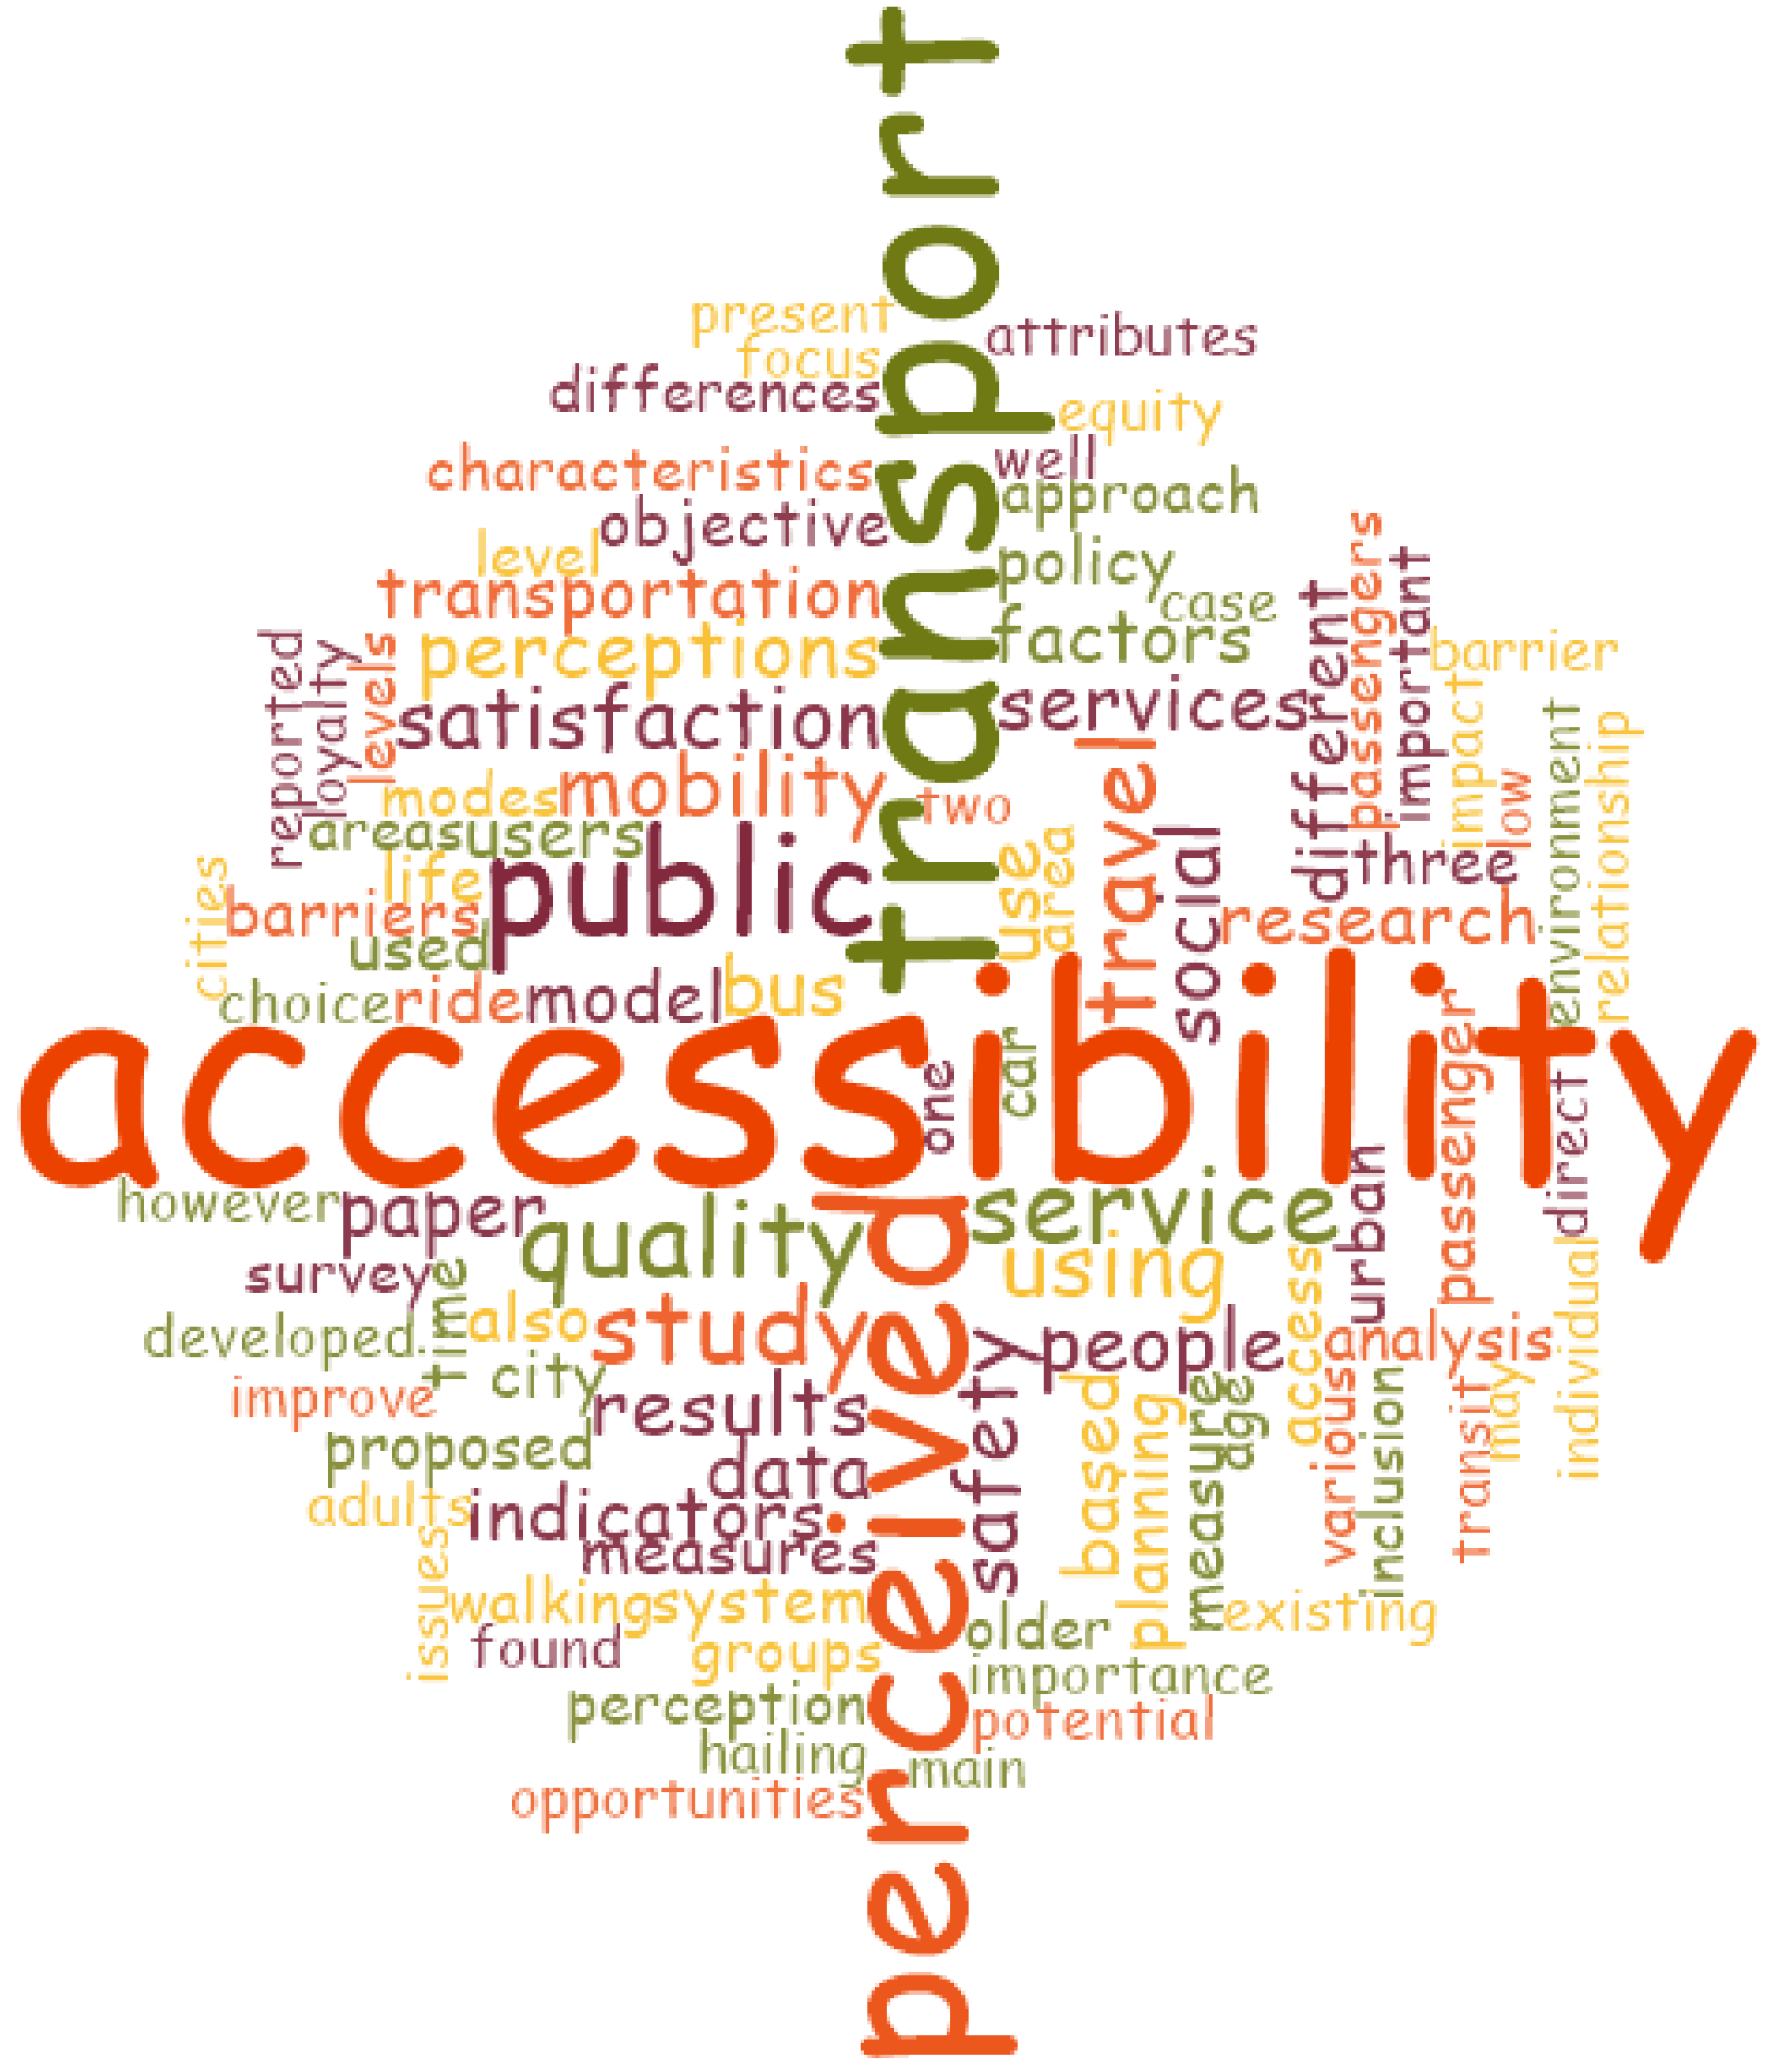
2. Methods
3. Results of the Literature Review
3.1. Understanding Conventional versus Perceived Accessibility
3.2. Perceived Accessibility—A New Concept
3.3. Social Drivers of Perceived Accessibility
3.4. Barriers to Perceived Accessibility
3.5. Evaluating Perceived Accessibility
3.6. Perceived Safety and Service Quality: Prominent Factors Affecting Perceived Accessibility
3.7. Factors Affecting Perceived Safety
3.7.1. Demographic Aspects
3.7.2. Financial Attributes
3.7.3. Psychological Attributes
3.7.4. Situational Determinants
3.8. Models for Service Quality
4. Discussion
5. Conclusions
Author Contributions
Funding
Institutional Review Board Statement
Informed Consent Statement
Conflicts of Interest
References
- Curl, A.; Nelson, J.D.; Anable, J. Does accessibility planning address what matters? A review of current practice and practitioner perspectives. Res. Transp. Bus. Manag. 2011, 2, 3–11. [Google Scholar] [CrossRef]
- Morris, J.M.; Dumble, P.L.; Wigan, M.R. Accessibility indicators for transport planning. Transp. Res. Part A Gen. 1979, 13, 91–109. [Google Scholar] [CrossRef]
- Lättman, K.; Olsson, L.E.; Friman, M. A new approach to accessibility–Examining perceived accessibility in contrast to objectively measured accessibility in daily travel. Res. Transp. Econ. 2018, 69, 501–511. [Google Scholar] [CrossRef]
- Halden, D. The use and abuse of accessibility measures in UK passenger transport planning. Res. Transp. Bus. Manag. 2011, 2, 12–19. [Google Scholar] [CrossRef]
- Preston, J.; Rajé, F. Accessibility, mobility and transport-related social exclusion. J. Transp. Geogr. 2007, 15, 151–160. [Google Scholar] [CrossRef]
- Pot, F.J.; van Wee, B.; Tillema, T. Perceived accessibility: What it is and why it differs from calculated accessibility measures based on spatial data. J. Transp. Geogr. 2021, 94, 103090. [Google Scholar] [CrossRef]
- Curl, A. The importance of understanding perceptions of accessibility when addressing transport equity. J. Transp. Land Use 2018, 11, 1147–1162. [Google Scholar] [CrossRef]
- Friman, M.; Lättman, K.; Olsson, L.E. Public transport quality, safety, and perceived accessibility. Sustainability 2020, 12, 3563. [Google Scholar] [CrossRef]
- Geurs, K.T.; Östh, J. Advances in the measurement of transport impedance in accessibility modelling. Eur. J. Transp. Infrastruct. Res. 2016, 16, 294–299. [Google Scholar]
- Geurs, K.T.; van Wee, B. Accessibility evaluation of land-use and transport strategies: Review and research directions. J. Transp. Geogr. 2004, 12, 127–140. [Google Scholar] [CrossRef]
- Saif, M.A.; Zefreh, M.M.; Torok, A. Public transport accessibility: A literature review. Period. Polytech. Transp. Eng. 2019, 47, 36–43. [Google Scholar] [CrossRef] [Green Version]
- Meerow, S.; Newell, J.P.; Stults, M. Defining urban resilience: A review. Landsc. Urban Plan. 2016, 147, 38–49. [Google Scholar] [CrossRef]
- Hansen, W.G. How accessibility shapes land use. J. Am. Inst. Plan. 1959, 25, 73–76. [Google Scholar] [CrossRef]
- Sundling, C.; Berglund, B.; Nilsson, M.E.; Emardson, R.; Pendrill, L. New perspective on the accessibility of railway transport for the vulnerable traveller. J. Phys. Conf. Ser. 2013, 459, 012021. [Google Scholar] [CrossRef]
- Velho, R.; Holloway, C.; Symonds, A.; Balmer, B. The effect of transport accessibility on the social inclusion of wheelchair users: A mixed method analysis. Soc. Incl. 2016, 4, 24–35. [Google Scholar] [CrossRef]
- Iacono, M.; Krizek, K.J.; El-Geneidy, A. Measuring non-motorized accessibility: Issues, alternatives, and execution. J. Transp. Geogr. 2010, 18, 133–140. [Google Scholar] [CrossRef]
- Páez, A.; Scott, D.M.; Morency, C. Measuring accessibility: Positive and normative implementations of various accessibility indicators. J. Transp. Geogr. 2012, 25, 141–153. [Google Scholar] [CrossRef]
- Scheepers, C.E.; Wendel-Vos GC, W.; Van Kempen, E.; De Hollander, E.; van Wijnen, H.J.; Maas, J.; den Hertog, F.R.J.; Staatsen, B.A.M.; Stipdonk, H.L.; Stipdonk, H.L.; et al. Perceived accessibility is an important factor in transport choice—Results from the AVENUE project. J. Transp. Health 2016, 3, 96–106. [Google Scholar] [CrossRef]
- Vitman-Schorr, A.; Ayalon, L.; Khalaila, R. Perceived accessibility to services and sites among Israeli older adults. J. Appl. Gerontol. 2019, 38, 112–136. [Google Scholar] [CrossRef]
- Burns, L.D. Transportation, Temporal, and Spatial Components of Accessibility; Pergamon Press: Elmsford, NY, USA, 1980. [Google Scholar]
- Weibull, J.W. On the numerical measurement of accessibility. Environ. Plan. A 1980, 12, 53–67. [Google Scholar] [CrossRef]
- Huisman, O.; Conceptual, A. Operational Definition of Accessibility: Report for Objective 3 Milestone 2−Reduced CO2 from Sustainable Household Travel. In Centre for Social and Health Outcomes Research and Evaluation (SHORE) and Te Ropu Whariki; Massey University: Auckland, New Zealand, 2005. [Google Scholar]
- El-Geneidy, A.; Levinson, D.; Diab, E.; Boisjoly, G.; Verbich, D.; Loong, C. The cost of equity: Assessing transit accessibility and social disparity using total travel cost. Transp. Res. Part A Policy Pract. 2016, 91, 302–316. [Google Scholar] [CrossRef] [Green Version]
- Sundling, C.; Berglund, B.; Nilsson, M.E.; Emardson, R.; Pendrill, L.R. Overall accessibility to traveling by rail for the elderly with and without functional limitations: The whole-trip perspective. Int. J. Environ. Res. Public Health 2014, 12, 12938–12968. [Google Scholar] [CrossRef] [PubMed]
- Liu, D.; Kwan, M.-P. Measuring spatial mismatch and job access inequity based on transit-based job accessibility for poor job seekers. Travel Behav. Soc. 2020, 19, 184–193. [Google Scholar] [CrossRef]
- Guzman, L.A.; Oviedo, D. Accessibility, affordability and equity: Assessing ‘pro-poor’ public transport subsidies in Bogotá. Transp. Policy 2018, 68, 37–51. [Google Scholar] [CrossRef]
- Lättman, K.; Friman, M.; Olsson, L.E. Perceived accessibility of public transport as a potential indicator of social inclusion. Soc. Incl. 2016, 4, 36–45. [Google Scholar] [CrossRef]
- Olsson, L.E.; Friman, M.; Lättman, K. Accessibility Barriers and Perceived Accessibility: Implications for Public Transport. Urban Sci. 2021, 5, 63. [Google Scholar] [CrossRef]
- Ryan, M.; Lin, T.; Xia, J.C.; Robinson, T. Comparison of perceived and measured accessibility between different age groups and travel modes at Greenwood Station, Perth, Australia. Eur. J. Transp. Infrastruct. Res. 2016, 16, 406–423. [Google Scholar]
- Coppola, P.; Silvestri, F. Estimating and visualizing perceived accessibility to transportation and urban facilities. Transp. Res. Procedia 2018, 31, 136–145. [Google Scholar] [CrossRef]
- Friman, M.; Lättman, K.; Olsson, L.E. Carpoolers’ Perceived Accessibility of Carpooling. Sustainability 2020, 12, 8976. [Google Scholar] [CrossRef]
- de Vos, J.; Schwanen, T.; van Acker, V.; Witlox, F. Travel and subjective well-being: A focus on findings, methods and future research needs. Transp. Rev. 2013, 33, 421–442. [Google Scholar] [CrossRef]
- Nordbakke, S.; Schwanen, T. Well-being and mobility: A theoretical framework and literature review focusing on older people. Mobilities 2014, 9, 104–129. [Google Scholar] [CrossRef]
- Axhausen, K.W.; Gärling, T. Activity-based approaches to travel analysis: Conceptual frameworks, models, and research problems. Transp. Rev. 1992, 12, 323–341. [Google Scholar] [CrossRef] [Green Version]
- Burns, L.D.; Golob, T.F. The role of accessibility in basic transportation choice behavior. Transportation 1976, 5, 175–198. [Google Scholar] [CrossRef]
- Muhammad, S.; de Jong, T.; Ottens, H.F.L. Job accessibility under the influence of information and communication technologies. Neth. J. Transp. Geogr. 2008, 16, 203–216. [Google Scholar] [CrossRef]
- Geurs, K.T.; van Eck, J.R.R. Accessibility Measures: Review and Applications. Evaluation of Accessibility Impacts of Land-Use Transportation Scenarios, and Related Social and Economic Impact; RIVM Report 408505006; Urban Research Centre, Utrecht University: Utrecht, The Netherlands, 2001. [Google Scholar]
- Curl, A.; Nelson, J.D.; Anable, J. Same question, different answer: A comparison of GIS-based journey time accessibility with self-reported measures from the National Travel Survey in England. Comput. Environ. Urban Syst. 2015, 49, 86–97. [Google Scholar] [CrossRef]
- van Wee, B. Accessible accessibility research challenges. J. Transp. Geogr. 2016, 51, 9–16. [Google Scholar] [CrossRef]
- Farrington, J.H. The new narrative of accessibility: Its potential contribution to discourses in (transport) geography. J. Transp. Geogr. 2007, 15, 319–330. [Google Scholar] [CrossRef]
- Wretstrand, A.; Svensson, H.; Fristedt, S.; Falkmer, T. Older people and local public transit: Mobility effects of accessibility improvements in Sweden. J. Transp. Land Use 2009, 2, 49–65. [Google Scholar] [CrossRef]
- Kwan, M.P.; Weber, J. Individual accessibility revisited: Implications for geographical analysis in the twenty-first century. Geogr. Anal. 2003, 35, 341–353. [Google Scholar] [CrossRef]
- Budd, J.W.; Mumford, K.A. Family-friendly work practices in Britain: Availability and perceived accessibility, Human Resource Management: Published in Cooperation with the School of Business Administration. Univ. Mich. Alliance Soc. Hum. Resour. Manag. 2006, 45, 23–42. [Google Scholar] [CrossRef]
- Lotfi, S.; Koohsari, M.J. Measuring objective accessibility to neighborhood facilities in the city (A case study: Zone 6 in Tehran, Iran). Cities 2009, 26, 133–140. [Google Scholar] [CrossRef]
- Dong, M.; Hirshleifer, D.; Richardson, S.; Teoh, S.H. Does investor misvaluation drive the takeover market? J. Financ. 2006, 61, 725–762. [Google Scholar] [CrossRef] [Green Version]
- Hanson, S.; Schwab, M. Accessibility and intraurban travel. Environ. Plan. A 1987, 19, 735–748. [Google Scholar] [CrossRef]
- Kwan, M.P. Space-time and integral measures of individual accessibility: A comparative analysis using a point-based framework. Geogr. Anal. 1998, 30, 191–216. [Google Scholar] [CrossRef]
- Dalvi, M.Q.; Martin, K. The measurement of accessibility: Some preliminary results. Transportation 1976, 5, 17–42. [Google Scholar] [CrossRef]
- Mamun, S.A.; Lownes, N.E. Measuring service gaps: Accessibility-based transit need index. Transp. Res. Rec. 2011, 2217, 153–161. [Google Scholar] [CrossRef]
- van der Vlugt, A.-L.; Curl, A.; Wittowsky, D. What about the people? Developing measures of perceived accessibility from case studies in Germany and the UK. Appl. Mobil. 2019, 4, 142–162. [Google Scholar] [CrossRef]
- Lättman, K.; Friman, M.; Olsson, L.E. Restricted car-use and perceived accessibility. Transp. Res. Part D Transp. Environ. 2020, 78, 102213. [Google Scholar] [CrossRef]
- Lättman, K.; Olsson, L.E.; Friman, M.; Fujii, S. Perceived accessibility, satisfaction with daily travel, and life satisfaction among the elderly. Int. J. Environ. Res. Public Health 2019, 16, 4498. [Google Scholar] [CrossRef]
- van der Vlugt, A.-L.; Curl, A.; Scheiner, J. The influence of travel attitudes on perceived walking accessibility and walking behaviour. Travel Behav. Soc. 2022, 27, 47–56. [Google Scholar] [CrossRef]
- Márquez, L.; Poveda, J.C.; Vega, L.A. Factors affecting personal autonomy and perceived accessibility of people with mobility impairments in an urban transportation choice context. J. Transp. Health 2019, 14, 100583. [Google Scholar] [CrossRef]
- Church, A.; Frost, M.; Sullivan, K. Transport and social exclusion in London. Transp. Policy 2000, 7, 195–205. [Google Scholar] [CrossRef]
- Lucas, K. Transport and social exclusion: Where are we now? Transp. Policy 2012, 20, 105–113. [Google Scholar] [CrossRef]
- di Ciommo, F.; Shiftan, Y. Transport equity analysis. Transp. Rev. 2017, 37, 139–151. [Google Scholar] [CrossRef]
- Pyrialakou, V.D.; Gkritza, K.; Fricker, J.D. Accessibility, mobility, and realized travel behavior: Assessing transport disadvantage from a policy perspective. J. Transp. Geogr. 2016, 51, 252–269. [Google Scholar] [CrossRef]
- Tiznado-Aitken, I.; Lucas, K.; Muñoz, J.C.; Hurtubia, R. Understanding accessibility through public transport users’ experiences: A mixed methods approach. J. Transp. Geogr. 2020, 88, 102857. [Google Scholar] [CrossRef]
- Jones, P.; Lucas, K. The social consequences of transport decision-making: Clarifying concepts, synthesising knowledge and assessing implications. J. Transp. Geogr. 2012, 21, 4–16. [Google Scholar] [CrossRef]
- Delbosc, A.; Currie, G. Exploring the relative influences of transport disadvantage and social exclusion on well-being. Transp. Policy 2011, 18, 555–562. [Google Scholar] [CrossRef]
- Cheng, Y.-H.; Chen, S.-Y. Perceived accessibility, mobility, and connectivity of public transportation systems. Transp. Res. Part A Policy Pract. 2015, 77, 386–403. [Google Scholar] [CrossRef]
- Chowdhury, S.; Zhai, K.; Khan, A. The effects of access and accessibility on public transport users’ attitudes. J. Public Transp. 2016, 19, 7. [Google Scholar] [CrossRef]
- Blöbaum, A.; Hunecke, M. Perceived danger in urban public space: The impacts of physical features and personal factors. Environ. Behav. 2005, 37, 465–486. [Google Scholar] [CrossRef]
- Joewono, T.B.; Kubota, H. Safety and security improvement in public transportation based on public perception in developing countries. IATSS Res. 2006, 30, 86–100. [Google Scholar] [CrossRef] [Green Version]
- Eboli, L.; Mazzulla, G. A Stated Preference Experiment for Measuring Service Quality in Public Transport. Transp. Plan. Technol. 2008, 31, 509–523. [Google Scholar] [CrossRef]
- Stradling, S.; Carreno, M.; Rye, T.; Noble, A. Passenger perceptions and the ideal urban bus journey experience. Transp. Policy 2007, 14, 283–292. [Google Scholar] [CrossRef]
- Concern, C. People’s Perceptions of Personal Security and Their Concerns about Crime on Public Transport: The Literature Review; Department for Transport: London, UK, 2002.
- Hinkle, J.C. Emotional fear of crime vs. perceived safety and risk: Implications for measuring ‘fear’ and testing the broken windows thesis. Am. J. Crim. Justice 2015, 40, 147–168. [Google Scholar] [CrossRef]
- Adebola, O.; Samuel, O.; Feyisola, A.; Eno, O. An assessment of public transport security and safety: An examination of Lagos bus rapid transit (BRT), Nigeria. Civ. Environ. Res. 2014, 6, 105–117. [Google Scholar]
- Litman, T. A new transit safety narrative. J. Public Transp. 2014, 17, 114–135. [Google Scholar] [CrossRef]
- Ross, C.E.; Jang, S.J. Neighbourhood disorder, fear and mistrust: The buffering role of social ties with neighbours. Am. J. Community Psychol. 2000, 28, 401–442. [Google Scholar] [CrossRef]
- Pantazis, C. Fear of crime, vulnerability and poverty. Br. J. Criminol. 2000, 40, 414–436. [Google Scholar] [CrossRef]
- Concern, C. People Perceptions of Personal Security and Their Concerns about Crime on Public Transport: Research Findings; Department for Transport: London, UK, 2004. [Google Scholar]
- Currie, G.; Delbosc, A. Modelling the social and psychological impacts of transport disadvantage. Transportation 2010, 37, 953–966. [Google Scholar] [CrossRef]
- Ferraro, K.F.; LaGrange, R.L. Are older people most afraid of crime? Reconsidering age differences in fear of victimization. J. Gerontol. 1992, 47, 233–244. [Google Scholar] [CrossRef] [PubMed]
- Morse, L.B.; Benjamin, J.M. Analysis of feeling of security on public transit among rresidents of small urban area. Transp. Res. Rec. 1997, 1557, 28–31. [Google Scholar] [CrossRef]
- Oh, J.H.; Kim, S. Aging, neighborhood attachment, and fear of crime: Testing reciprocal effects. J. Community Psychol. 2009, 37, 21–40. [Google Scholar] [CrossRef]
- Loukaitou-Sideris, A.; Eck, J.E. Crime prevention and active living. Am. J. Health Promot. 2007, 21, 380–389. [Google Scholar] [CrossRef] [PubMed]
- Loukaitou-Sidaris, A.; Liggett, R.; Iseki, H. The geography of transit crime. J. Plan. Educ. Res. 2002, 22, 135–151. [Google Scholar] [CrossRef]
- Kennedy, D.M. Personal Security in Public Transport Travel in New Zealand: Problems, Issues and Solution. In Land Transport New Zealand Research Report 344; 2008. Available online: https://nzta.govt.nz/assets/resources/research/reports/344/docs/344.pdf (accessed on 14 May 2022).
- Salmi, V.; Smolej, M.; Kivivuori, J. Crime victimization, exposure to crime news and social trust among adolescents. Young 2007, 15, 255–272. [Google Scholar] [CrossRef]
- Kim, H.S.; Kim, E. Effect of public transit on automobile ownership and use in households of the USA. Rev. Urban Reg. Dev. Stud. 2004, 16, 245–262. [Google Scholar] [CrossRef]
- Lynch, G.; Atkins, S. The influence of personal security fears on women’s travel patterns. Transportation 1988, 15, 257–277. [Google Scholar] [CrossRef]
- Wallace, R.R.; Rodriguez, D.A.; White, C.; Levine, J. Who noticed, who cares? Passenger reactions to transit safety measures. Transp. Res. Rec. 1999, 1666, 133–138. [Google Scholar] [CrossRef]
- Sudaryanto, S.; Kartikasari, R. The Measurement of the Service Quality of TransJakarta Public Transportation. In International Seminar on Industrial Engineering and Management; Menara Peninsula: Jakarta, Indonesia, 2007. [Google Scholar]
- Grönroos, C. A service quality model and its marketing implications. Eur. J. Mark. 1984, 18, 36–44. [Google Scholar] [CrossRef]
- Parasuraman, A.; Zeithaml, V.A.; Berry, L.L. A conceptual model of service quality and its implications for future research. J. Mark. 1985, 49, 41–50. [Google Scholar] [CrossRef]
- Parasuraman, A.; Zeithaml, V.A.; Berry, L.L. SERVQUAL: A multiple-item scale for measuring consumer perceptions of service quality. J. Retail. 1988, 64, 12–37. [Google Scholar]
- Boulding, W.; Kalra, A.; Staelin, R.; Zeithaml, V.A. A dynamic process model of service quality: From expectations to behavioral intentions. J. Mark. Res. 1993, 30, 7–27. [Google Scholar] [CrossRef]
- Abdelghani, E. Applying SERVQUAL to banking services: An exploratory study in Morocco. Stud. Bus. Econ. 2012, 7, 62–72. [Google Scholar]
- Bhat, M.A. Tourism service quality: A dimension-specific assessment of SERVQUAL. Glob. Bus. Rev. 2012, 13, 327–337. [Google Scholar] [CrossRef]
- Chaturvedi, R.K. Mapping service quality in hospitality industry: A case through SERVQUAL. Asian J. Manag. 2017, 8, 413–423. [Google Scholar] [CrossRef]
- Barabino, B.; Deiana, E.; Tilocca, P. Measuring service quality in urban bus transport: A modified SERVQUAL approach. Int. J. Qual. Serv. Sci. 2012, 4, 238–252. [Google Scholar] [CrossRef]
- Sam, E.F.; Hamidu, O.; Daniels, S. SERVQUAL analysis of public bus transport services in Kumasi metropolis, Ghana: Core user perspectives. Case Stud. Transp. Policy 2018, 6, 25–31. [Google Scholar] [CrossRef]
- Babakus, E.; Boller, G.W. An empirical assessment of the SERVQUAL scale. J. Bus. Res. 1992, 24, 253–268. [Google Scholar] [CrossRef]
- Parasuraman, A.; Berry, L.L.; Zeithaml, A.V. Refinement and Reassessment of the SERVQUAL Scale. J. Retail. 1991, 67, 420–450. [Google Scholar]
- Prasad, M.D.P.M.D.; Prasad, M.D.; Shekhar, B.R. Development of railqual: A service quality scale for measuring Indian railway passenger. Manag. Sci. Eng. 2010, 4, 87–94. [Google Scholar]
- Luke, R.; Heyns, G.J. An analysis of the quality of public transport in Johannesburg, South Africa using an adapted SERVQUAL model. Transp. Res. Procedia 2020, 48, 3562–3576. [Google Scholar] [CrossRef]
- Mapunda, M.A. Customers’ Satisfaction on Bus Rapid Transit Services in Tanzania: The Servqual Model Perspective. In Sustainable Education and Development; Mojekwu, J.N., Thwala, W., Aigbavboa, C., Atepor, L., Sackey, S., Eds.; Springer: Cham, Switzerland, 2021; pp. 194–208. [Google Scholar]
- Ulkhaq, M.M.; Ardiani, A.J.; Farhan, M.; Bagja, R.P.; Hanif, R.Z. Service quality analysis of bus rapid transit: A case in Semarang, Indonesia. In Proceedings of the 2019 4th International Conference on Intelligent Transportation Engineering (ICITE), Singapore, 5–7 September 2019; pp. 6–10. [Google Scholar]
- Boakye-Dankwa, E.; Nathan, A.; Barnett, A.; Busija, L.; Lee, R.S.Y.; Pachana, N.; Turrell, G.; Cerin, E. Walking behaviour and patterns of perceived access to neighbourhood destinations in older adults from a low-density (Brisbane, Australia) and an ultra-dense city (Hong Kong, China). Cities 2019, 84, 23–33. [Google Scholar] [CrossRef]
- Sundling, C.; Nilsson, M.E.; Hellqvist, S.; Pendrill, L.R.; Emardson, R.; Berglund, B. Travel behaviour change in old age: The role of critical incidents in public transport. Eur. J. Ageing 2016, 13, 75–83. [Google Scholar] [CrossRef]
- Cerin, E.; Sit, C.H.; Barnett, A.; Cheung, M.-C.; Chan, W.-M. Walking for recreation and perceptions of the neighborhood environment in older Chinese urban dwellers. J. Urban Health 2013, 90, 56–66. [Google Scholar] [CrossRef]
- Weijs-Perrée, M.; Dane, G.; van den Berg, P. Analyzing the relationships between citizens’ emotions and their momentary satisfaction in urban public spaces. Sustainability 2020, 12, 7921. [Google Scholar] [CrossRef]
- Reed, T.; Wallace, R.; Rodriguez, D. Transit passenger perceptions of transit-related crime reduction measures. Transp. Res. Rec. J. Transp. Res. Board 2000, 1731, 130–141. [Google Scholar] [CrossRef]
- Lukina, A.V.; Sidorchuk, R.R.; Mkhitaryan, S.V.; Stukalova, A.A.; Skorobogatykh, I.I. Study of Perceived Accessibility in Daily Travel within the Metropolis. Emerg. Sci. J. 2021, 5, 868–883. [Google Scholar] [CrossRef]
- Schneider, I.E.; Guo, T.; Schroeder, S. Quality of Life: Assessment for Transportation Performance Measures; Minnesota Department of Transportation: St. Paul, MN, USA, 2013.
- Mansor, N.; Zakaria, Z.; Daud, C.H.R. Quality of life in the 21st century: Narrowing the gap between rural and urban area. Int. J. Bus. Soc. Sci. 2013, 4, 186–195. [Google Scholar]
- Hassan, N.; Jaafar, N.I.M.; Ariffin, R.N.R.; Samah, A.A.; Jaafar, M.N. Perceptions on quality of life in Malaysia: The urban-rural divide. Plan. Malays. J. 2013, 11, 21–40. [Google Scholar]


| Author (Reference) | Definition |
|---|---|
| Morris et al. [2] | “measure of spatial separation of human activities. Essentially, it denotes the ease with which activities may be reached from a given location using a particular transportation system” p. 91 |
| Páez et al. [17] | “…the potential for reaching spatially distributed opportunities (for employment, recreation, social interaction, etc.) …” p. 141 |
| Preston and Rajé [5] | “the ease of reaching…” a location p. 154 |
| Saif et al. [11] | “…the physical access to goods, services, and destinations” p. 36 |
| Scheepers et al. [18] | “…how easily an individual can pursue an activity of a desired type, at a desired location, by a desired mode, and at a desired time” p. 97 |
| Geurs and van Wee [10] | “the extent to which land-use and transport systems enable (groups of) individuals to reach activities or destinations by means of a (combination of) transport mode(s)” p.c128 |
| Vitman-Schorr et al. [19] | “The physical distance or proximity to a service with the goal of making it as short as possible” or “the simplicity with which activities in society can be reached, including trading areas, industries, and public services” p. 114 |
| Author (Reference) | Definition |
|---|---|
| Curl [7] | “…how an individual, or groups of individuals, understand or experience their own accessibility” p. 1148 |
| Lättman et al. [27] | “…how easy it is to live a satisfactory life using the transport system” which includes accessibility while using the transport system per se, ease of getting to the transport system, and the perceived possibilities and ease to live the life one wants with help of the transport system” p. 258 |
| Pot et al. [6] | “the perceived potential to participate in spatially dispersed opportunities” p. 2 |
| Ryan et al. [29] | “…an individual’s perception on how easy it is to reach opportunities based on their own experiences” p. 406 |
| Saif et al. [11] | “a measure of living a satisfactory life using public transportation” p. 37 |
| Coppola and Silvestri [30] | “…overall location utility, perceived by individuals, computed as a function of proximity to different transportation and urban facilities” p. 137 |
| Friman et al. [31] | “…the individual experience and evaluation of these [objective/environmental conditions of travel such as service quality in terms of travel time, punctuality, information, and comfort] conditions based on individual preferences and prerequisites” p. 2. |
| Perceived Accessibility | Conventional/Objective Accessibility |
|---|---|
| PA captures behavioural dimensions including perceptions of reliability, affordability and convenience. | CA focuses on objective spatial measures such as time, distance and cost. It does not consider individual circumstances (e.g., variations of income, tolerance of distance, etc.) which affect affordability and reliability. |
| PA considers the experiences of dealing with barriers to travel such as feeling of safety and assessment of service quality. | CA considers only physical barriers |
| PA distinguishes the levels of accessibility among individuals and specific groups (including vulnerable people) | CA measures accessibility for a given area or location which might comprise different categories of people |
| PA can have direct impacts on personal wellbeing since it captures people’s ability and satisfaction with travel | CA does not reflect personal wellbeing but rather convenience based on technocratic indicators |
| PA is a subjective measure meaning two identical people could assess their accessibility differently | As objective accessibility, CA introduces less biases and can be replicated with same data and methodology |
| As a subjective construct, the impacts of competition on accessibility are largely ignored in PA | CA sometimes capture competition effect based on the density and levels of demand of opportunities |
| Study | Age | Gender (Women) | Income | Education |
|---|---|---|---|---|
| Friman et al. [8] | + | + | n/a | n/a |
| Friman et al. [31] | 0 | 0 | n/a | - |
| Lättman et al. [3] | 0 | + | 0 | n/a |
| Lättman et al. [51] | 0 | 0 | n.a | - |
| Lättman et al. [52] | −/+ | + | n/a | n/a |
| Marquez [54] | - | n/a | + | n/a |
| Olsson et al. [28] | −/0 | +/0 | n/a | 0 |
| Ryan et al. [29] | - | n/a | n/a | n/a |
| Vitman-Schorr [19] | - | 0 | n/a | 0 |
| Van der Vlugt et al. [50] | 0 | 0 | - | 0 |
| Approach | Example of Indicators | References |
|---|---|---|
| Destination- and/or activity-focused | Satisfaction or ease of accessing services and locations Possibilities of performing preferred activities | [19,27,51] |
| Travel-focused | Perception of journey/travel times Perceptions of travel distance and average speed | [7] |
| Modal-focused | Satisfaction of travelling with a particular mode of transport Ease to perform activities using mode | [24,31] |
| Utility-focused | Assessment of values or satisfaction with specified range of distances | [30] |
| Trip-focused | Assessment of perceptions about whole-trip components including quality of service, feeling of safety at and to stations as well as walking environments. It captures the whole-trip experience. | [62] |
| Overall accessibility | Assessment of ease of performing daily activities Satisfaction of perceived access to preferred activities | [3] |
Publisher’s Note: MDPI stays neutral with regard to jurisdictional claims in published maps and institutional affiliations. |
© 2022 by the authors. Licensee MDPI, Basel, Switzerland. This article is an open access article distributed under the terms and conditions of the Creative Commons Attribution (CC BY) license (https://creativecommons.org/licenses/by/4.0/).
Share and Cite
Jamei, E.; Chan, M.; Chau, H.W.; Gaisie, E.; Lättman, K. Perceived Accessibility and Key Influencing Factors in Transportation. Sustainability 2022, 14, 10806. https://doi.org/10.3390/su141710806
Jamei E, Chan M, Chau HW, Gaisie E, Lättman K. Perceived Accessibility and Key Influencing Factors in Transportation. Sustainability. 2022; 14(17):10806. https://doi.org/10.3390/su141710806
Chicago/Turabian StyleJamei, Elmira, Melissa Chan, Hing Wah Chau, Eric Gaisie, and Katrin Lättman. 2022. "Perceived Accessibility and Key Influencing Factors in Transportation" Sustainability 14, no. 17: 10806. https://doi.org/10.3390/su141710806
APA StyleJamei, E., Chan, M., Chau, H. W., Gaisie, E., & Lättman, K. (2022). Perceived Accessibility and Key Influencing Factors in Transportation. Sustainability, 14(17), 10806. https://doi.org/10.3390/su141710806