Abstract
Over the past three decades, more than 8000 pedestrians have been killed in Australia due to vehicular crashes. There is a general assumption that pedestrians are often the most vulnerable to crashes. Sustainable transportation goals are at odds with the high risk of pedestrian fatalities and injuries in car crashes. It is imperative that the reasons for pedestrian injuries be identified if we are to improve the safety of this group of road users who are particularly susceptible. These results were obtained mostly through the use of well-established statistical approaches. A lack of flexibility in managing outliers, incomplete, or inconsistent data, as well as rigid pre-assumptions, have been criticized in these models. This study employed three well-known machine learning models to predict road-crash-related pedestrian fatalities (RCPF). These models included support vector machines (SVM), ensemble decision trees (EDT), and k-nearest neighbors (KNN). These models were hybridized with a Bayesian optimization (BO) algorithm to find the optimum values of their hyperparameters, which are extremely important to accurately predict the RCPF. The findings of this study show that all the three models’ performance was improved using the BO. The KNN model had the highest improvement in accuracy (+11%) after the BO was applied to it. However, the ultimate accuracy of the SVM and EDT models was higher than that of the KNN model. This study establishes the framework for employing optimized machine learning techniques to reduce pedestrian fatalities in traffic accidents.
1. Introduction
Undoubtedly, pedestrians are among the most vulnerable of all road users. Pedestrians are equally essential to the sustainable development of transportation systems. They are, however, prone to traffic accidents, which clashes with the goal of sustainable mobility. Pedestrian injuries in traffic accidents have significant socioeconomic impacts. This is especially significant in light of the continuous efforts made by developed economies to improve road safety. Pedestrians account for the vast majority of all road users, owing to the fact that almost anybody may be one at any moment. Individuals walk for a number of purposes, including leisure, travelling to work or school, or visiting local businesses, as well as connecting to other forms of transport. A vulnerable road user category is specified for pedestrians in the National Road Safety Strategy. Contrary to other road users, they receive extremely little protection in the event of a crash [1]. There have been over 50,000 fatalities on Australian roads in the previous 30 years; 15.6% of those deaths are pedestrians, despite the fact that pedestrians travel less kilometers than any other kind of road user [2]. Over the previous three decades, the number of pedestrian deaths has been reduced by 57%. Pedestrians make up a big part of the deaths in Australian crashes involving heavy vehicles and buses. At least 30 percent of those that were killed in bus crashes are pedestrians. A total of 25% of all truck fatalities include pedestrians, motorcycle riders, and pedal cyclists [3].
A decrease in pedestrian deaths from road accidents has not deterred scholars from looking for new ways to learn more about the variables that influence crash possibility in order to better predict pedestrian-involved crashes and implement policies and prevention measures to reduce the number of road-crash-related pedestrian fatalities (RCPF) in Australia [4,5,6,7].
Research on RCPF has been plagued by a number of severe data problems. Insufficient specifications may lead to incorrect predictions of pedestrian collision probabilities and inferences regarding the causes of accidents. A number of problems, such as inaccuracies in the crash location and time, difficulties in data linkage (such as with traffic data), severity misclassification, inconsistencies and imperfections in the demographic information of those affected by the event, and the incorrect discovery of accident contributing factors, are among these [8]. The variability inherent in pedestrian collision data, which derives from unobservable features that cops do not track and cannot be acquired from incident reports, makes it difficult to identify and examine the causes of pedestrian crash fatalities. Parameter estimation could be distorted due to this variability, resulting in potentially erroneous results [9,10,11].
Conventional, widely used discrete choice modeling approaches were used to look at the crash data. These included mixed logit models, multinomial logit models, ordered logit/probit models, and partial proportional odds logit models. However, most of the methods listed above depend largely on presumptions. Without prior assumptions, machine learning (ML) approaches may efficiently examine noisy data, extreme values, and incomplete information without the need for prior knowledge of the inputs [12,13,14,15,16,17,18]. Data-driven approaches such as ML are significant examples of how accident-related data processing and predictions may be made more efficient and precise. Previous studies used a variety of ML algorithms to predict the severity and likelihood of pedestrian-involved collisions and found that these approaches are quite versatile, and they can surpass traditional methods in terms of accuracy. Therefore, three ML-based techniques optimized using the Bayesian optimization (BO) algorithm were chosen for this research to examine data linked with road-crash-related pedestrian fatalities (RCPF).
The use of support vector machines (SVM), ensemble decision trees (EDT), and k-nearest neighbours (KNN) in computer science is on the rise, thanks to recent developments. These models were able to accurately forecast the outcomes of nonlinear and difficult situations, indicating their relevance in tackling these issues. However, the determination of hyperparameters for SVM, EDT, and KNN is frequently complicated and has an impact on the model’s accuracy and generalizability [13,19]. For SVM, the kernel function, box constraint level (C) and multiclass method are the most important hyperparameters; for EDT, the ensemble method, maximum number of splits, number of learners, and learning rate; for KNN, the number of neighbors (K), distance metric, and distance weight are the most important hyperparameters. Hyperparameters in software and tools are often set to default values, resulting in suboptimal results across a wide range of research areas. Random, grid, or evolutionary algorithms have been employed in several investigations to find the best hyperparameters for a given situation. However, there are apparent limitations to these optimization approaches when it comes to assessing RCPF. Because both random and grid searches are blind, they take a long time to complete. Genetic algorithms (GAs) have a tendency to fall into local optimality, which has a negative impact on overall effectiveness.
The main aim of this paper is to see how effective the BO algorithm is at optimizing the ML models for the prediction of RCPF. To reach the goal of the study, three ML models, including SVM, EDT, and KNN, are optimized with the BO algorithm and tested using information about pedestrians who died in road accidents in Australia. Several performance metrics were used to compare the models in this research.
The rest of this paper is designed as follows. The next section provides a comprehensive literature review on road-crash-related pedestrian fatalities (RCPF). Section 3 presents a summary of the data collection and preparations. In Section 4, the design of the research is provided. Input selection and model development procedures are presented in Section 5 and Section 6. The models’ performance is presented in Section 7. A summary of this research is presented in Section 8.
2. Literature Review
In the vast number of pedestrian-involved collision prediction investigations, conventional statistical approaches have been used. The ordered probit model [20,21,22,23,24], the binary logit model [25], and the multinomial logit model (MNL) [23,26,27,28,29,30] were among the models examined. It was commonly accepted that MNL could be used to examine pedestrian accidents, but critics pointed out that it depends on the premise that independent factors have the same effect in all cases, which might be challenged if there are unobserved data heterogeneities to consider. In part, this is because the data on traffic accidents is insufficient, which implies that the effects may vary in various situations. Consequently, the mixed logit model was used to avoid the constraint enforced by the independence of irrelevant alternatives (IIA) property by dispersing the parameters across different observations [26,30,31,32,33]. Additional models, such as partial proportional odds (PPO), were used to study collisions involving pedestrians in addition to the mixed logit model, which solves the shortcomings of the MNL model [34,35,36,37,38]. When modelling the severity of pedestrian collision injuries, the PPO model’s parameter estimations might have varying impacts on a response variable. Even while traditional statistical approaches are commonly applied to forecast pedestrian-related fatalities, their usefulness and precision may make them obsolete. Regression-based methods, on the other hand, assume linear or nonlinear relationships between input variables and the response variable, which has a number of problems. Models that do not meet these conditions might lead to inaccurate results [39]. It is becoming more common to employ machine learning (ML) to tackle transportation-related problems as the result of technological advances and as the quantity of data has grown. Non-parametric ML approaches, in contrast to classic statistical techniques, are less constrained by presumptions about the relationships between fatal collision results and significant contributors [40].
There are a number of popular ML algorithms for analyzing accident data, including neural network (NN), random forest (RF), support vector machine (SVM), decision tree (DT), and gradient boosting (GB). Table 1 provides a list of research that used ML approaches to analyse pedestrian collision data. Identifying contributory factors in road collisions is typically a multi- or binary-class issue in road safety studies. DT-based models, such as classification and regression trees (CART), XGBoost, and random forest (RF), were the most commonly employed ML approaches for pedestrian accident data. On the other hand, strong models such as SVM and KNN were seldom utilized to analyse collision data including pedestrians, e.g., [41]. The models mentioned above have a number of hyperparameters that should be tuned to yield a more accurate result. To the best of the authors’ knowledge, so far, no study has employed an optimization algorithm to find the best value for the SVM, KNN, and EDT hyperparameters models to predict the RCPF. The advantages of ML models over conventional statistical approaches, in addition to the improvements made by hybridizing the Bayesian optimization algorithm into SVM, KNN, and EDT, it is important to assess whether the optimized models can be employed to forecast RCPF well and whether they tackle the standard form of the ML methods.

Table 1.
Some investigations have used ML approaches to predict pedestrian accidents.
3. Data Collection and Preparation
The data for this study came from the Australian Road Deaths Database (ARDD) [2]. The police in Australia report monthly to state and local road safety organizations on the number of people killed or seriously injured in car accidents around the country. In Australia, the ARDD gathers data on the demographics and circumstances of the deaths of those killed in automobile accidents. It is called a road death when a person dies within 30 days after an automobile collision due to the effects of the injuries they experienced. If a pedestrian is killed in a crash, it is considered a “pedestrian crash” for the purposes of this database. A total of 13 of the ARDD’s 24 columns/variables are useful in forecasting the likelihood of a pedestrian collision. In light of this, it is important to note that the data used in this research were gathered between 1989 and 2021. In this dataset, there are 52,843 records, and 1200 of these records were utilized to predict pedestrian deaths. The factors employed in this study are listed in Table 2. The RCPF’s fundamental information is included in this dataset. Nevertheless, these factors enable us to accomplish the purpose of this work, which is to hybridise the BO algorithm with several ML models, such as SVM, KNN, and EDT, in order to forecast pedestrian accident data. Using datasets with a greater number of factors, future research may expand on this topic.
Table 2.
List of variables.
It is important to note that input variables were converted and normalized as described in the following:
- The arrangement of nominal variables was altered to place the smallest class first and the biggest class last.
- For null values in continuous variables, the mean was replaced.
- For null values in nominal variables, the mode was replaced.
- For null values in ordinal variables, the median was replaced.
- The independent variable was originally nominal. The categories of this variable were driver, motorcycle pillion passenger, motorcycle rider, passenger, pedal cyclist, and pedestrian. This variable was then converted into binary. The new variable includes pedestrian fatalities and non-pedestrian fatalities.
4. Study Design
In this study, the BO algorithm is applied to three well-known ML techniques, including SVM, EDT, and KNN, to predict the RCPF. As previously mentioned, the data for the development of this study were derived from the ARDD. A total of 1200 samples were randomly chosen to develop these models. A total of 80% of the data was randomly used to train the models, and 20% of the remaining data was used to test the models. In addition, a 5-fold cross validation technique was used to train the models and prevent overfitting. The distribution of variables in the training and testing datasets is shown in Figure 1 and Figure 2. The models developed in this study were evaluated using the models’ accuracy, ROC curves, and AUC. Figure 3 shows the flowchart of this study.
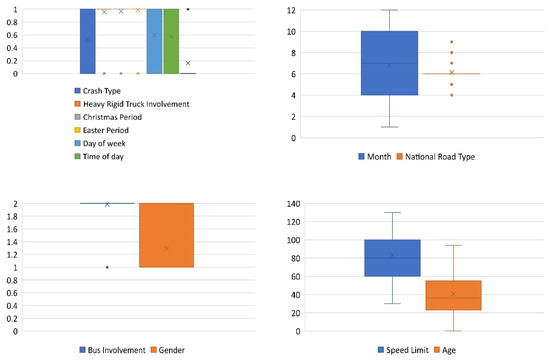
Figure 1.
Distribution of variables in the training dataset.
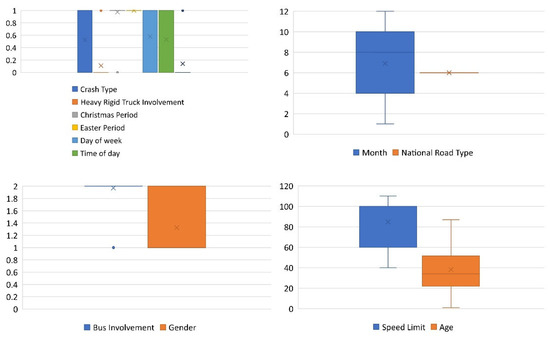
Figure 2.
Distribution of variables in the testing dataset.
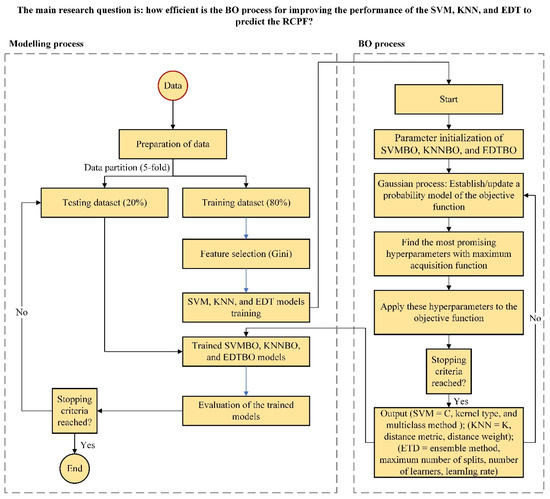
Figure 3.
Flowchart of research.
It is important to note that the imbalance ratio of the training and testing datasets is 5.15 and 6.14 (major class/minor class). Most ML techniques have difficulty predicting the target variable of an imbalanced dataset. A dataset with a larger imbalance ratio is normally assumed to be more difficult to forecast [50]. Thus, if a new model outperforms other current models on this dataset, the superiority of the new model may be shown.
5. Input Selection
The cornerstone of pedestrian safety research is the ability to anticipate pedestrian deaths in certain situations. To effectively anticipate the RCPF and prevent injuries and fatalities in road incidents, numerous variables influencing the RCPF must be extensively taken into account. It is acknowledged that all the input factors shown in Table 2 help with the forecasting of RCPF. However, the relevance of every input parameter is uncertain and requires additional investigation. The machine learning models also work well with a smaller group of input variables.
The mutual information test method [51] was used to figure out the importance of the inputs to RCPF in order to study and evaluate how different factors affect RCPF. Mutual information (MI) is a screening method that can be utilized to find out how each attribute is connected to the target variable. It assesses the interconnectedness of variables and reveals the magnitude of the relationship between them. The information gained may be used to estimate the MI’s magnitude between two variables:
where all potential values for N are represented by the number p, and Mp denotes the set of M that exists when N has the value np. The stronger the relationship between N and M, the greater the value of Gain(M, N).
It has now been found that RCPF can be predicted by an input variable that has a high mutual information value. According to the findings, as depicted in Figure 4, factors such as the Christmas and Easter seasons, heavy rigid truck involvement, national road type, and gender had no effect on the ability to forecast RCPF. Rather, the time of day, bus involvement, day of the week, age, crash type, and speed limit all had non-zero gain scores. RCPF may be best predicted by the speed limit. All variables with a non-zero gain score are included in the SVM, KNN, and ensemble DT models, as well as their optimized variations.

Figure 4.
Gain scores of input variables.
6. Models’ Development
6.1. Development of the RCPF Prediction Models
Using the dataset collected from ARDD, the RCPF predictive models were developed, and their performance was assessed utilizing MATLAB. The models were trained using three ML-based techniques: SVM, KNN, and ensemble DT. These models were chosen since previous research studies had shown their reliability and effectiveness in predicting the RCPF and crash analysis. For example, Das, Le, and Dai [42] employed EDT for categorizing crash types based on unstructured textual inputs. Mokhtarimousavi [45] employed SVM to predict the extent of injury to pedestrians in an accident. Additionally, Wali et al. [52] utilized KNN to analyze the crash severity of vulnerable road users. However, studies on optimizing these models using the BO algorithm to forecast road-crash-related pedestrian fatalities are still rare. These models’ optimized variations have been effectively employed in different study disciplines, e.g., [53,54,55,56]. Thus, by investigating the effectiveness of optimized versions of SVM, KNN, and ensemble DT models in predicting pedestrian deaths in traffic accidents, this work adds to the body of knowledge.
Six of the non-zero input variables identified by the gain score were used to develop these models. For the development of these models, eighty percent of the data was utilized for training and twenty percent for testing. In addition, a 5-fold cross-validation approach was used to train the data in order to avoid overfitting. The models’ performances were evaluated using the accuracy, ROC curve, and AUC. It should also be mentioned that the search range for the optimal parameters’ values was the MATLAB toolbox’s default values, since such parameter values are often effective on many classification and prediction tasks in different research domains, e.g., [57,58].
6.2. Tree-Ensemble-Based Prediction Model
The ensemble DT technique is an ML approach that uses several DTs derived from the provided data. Various strategies, including bagging and boosting, are viable for assembling DTs (Figure 5). Bagging arbitrarily selects training dataset data to form many sets, each of which is employed to train its own DTs. Early learners are used to successively train a number of weak learners in the boosting strategy by fitting basic models to data. For further analysis, the weights are increased to account for any errors. Using the average and projected values of many groups of trained trees reduces overfitting and reduces forecasting variance more than using a single DT. For the tree ensemble regression, the final predicted value is found by taking the average of each DT’s prediction (called “bagging”) or the predicted value of a strong learner made up of many weak learners (called “boosting”). Each DT’s structure is modeled using hyperparameters such as the ensemble method, maximum number of splits, and number of learners, and the learners can be modified by adjusting hyperparameters such as the learning rate. BO was performed for the EDT-based RCPF prediction model for five hyperparameters: the ensemble method, maximum number of splits, number of learners, and learning rate (Table 3). An ensemble of DT with boosting was the most efficient technique to obtain an accurate RCPF outcome from the provided learning data. The best number of decision splits in an EDT structure was six. The optimal performance of the EDT model was obtained by using a learning rate of 0.209%.
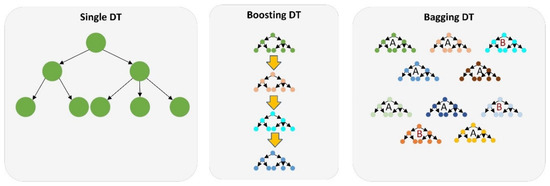
Figure 5.
The schematic system of the ensemble DT models.
Table 3.
Hyperparameters for the EDT’s optimization.
6.3. Support Vector Machines (SVM)
In SVM, margin and support vectors are used to divide the data into linear and nonlinear structures in order to produce an effective decision boundary. The margin reflects the spacing between the boundary and the data; the SVM divides the data into several groups based on the margin with the greatest value (Figure 6). With respect to other machine learning approaches, SVM is quicker and simpler. Developers may pick kernel functions by intuition and establish ideal boundary conditions by changing the hyperparameters, making it easier for them to implement their ideas. Using data distribution, this hyperparameter defines the extent of the margin and kernel that constitute the border shape.
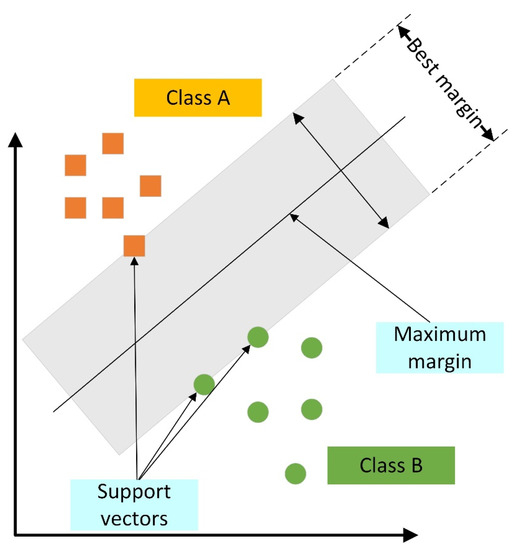
Figure 6.
The schematic system of the SVM model.
In order to enhance the effectiveness of the SVM prediction model, Bayesian optimization was carried out on three hyperparameters: kernel function, box constraint level, and multiclass method. An ideal arrangement of hyperparameters is indicated in Table 4. Cubic and 0.0152 were selected as the optimal kernel function and box constraints (C) for the purpose of learning the distributed feature of the data.
Table 4.
SVM optimization hyperparameters.
6.4. K-Nearest Neighboyrs (KNN)
One of the most often used classification algorithms is KNN, which use a similarity metric to classify new data or instances (Figure 7). Most often, it is employed to classify data points based on the classification of their neighbours. The number of closest neighbours to include in a majority vote is expressed as a parameter, K, in KNN. K is based on the similarity of the features of each object. In order to improve accuracy, it is necessary to choose the correct value of K, which is termed parameter tuning. Smaller values for K are more susceptible to errors and will have a greater impact on the final outcome. Smoother decision boundaries are associated with higher K values, and they also entail reduced variance but more bias. This is also a time-consuming process. Besides K, there are two other KNN hyperparameters that are required to be optimized, including the distance metric and distance weight. The optimized values of these hyperparameters are shown in Table 5.
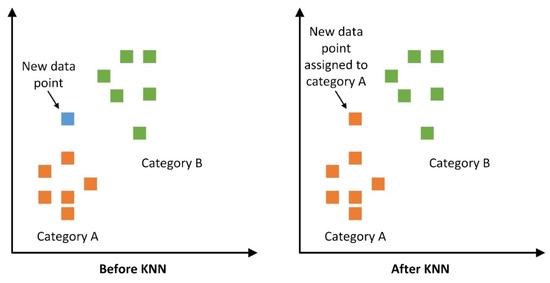
Figure 7.
The schematic system of the KNN model.
Table 5.
KNN optimization hyperparameters.
7. Comparison of Models Developed
The SVM, KNN, and EDT models were iterated 100 times. Figure 8 shows the progress of the SVM, KNN, and EDT hyperparameter optimizations, including the optimal point. For SVM, KNN, and EDT models, the scores for the minimum classification errors observed of 0.11625, 0.12375, and 0.1125 were observed at 63, 80, and 97 iterations, respectively. Thus, the SVM model converged earlier than other models as a result of optimization by the BO algorithm.
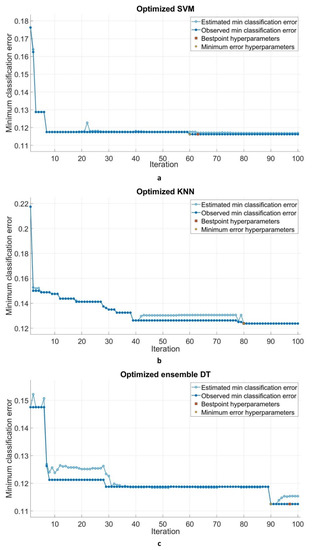
Figure 8.
Iteration process of the optimized models.
The models developed in this study were compared using several performance criteria. Table 6 shows the accuracy of the standard forms of the models and their optimized variants. Additionally, this table provides information on how the BO method affected the accuracy of the DT, SVM, and KNN models. As can be seen, the SVM model shows the most improvement during the training phase (5.4%), followed by the KNN model (5.2%). However, during the testing phase, the KNN model shows the most improvement (11%). In addition, the training times of the eight models developed in this study are compared in Figure 9. As can be seen, the optimized variant of SVM requires the highest time to be built (785.43 s), while the optimized KNN model has the lowest training time among the optimized models (204.36).
Table 6.
The accuracy of the models developed in the study and their changes due to the optimization process.
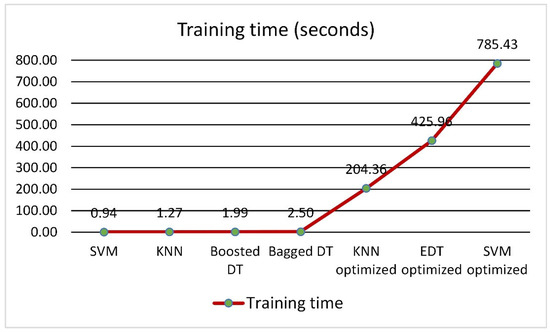
Figure 9.
The training time of various models developed in this study.
The models were also compared with respect to their ROC curve and AUC values from the testing phase (Figure 10). All optimized models achieved an AUC greater than 0.7, which is assumed to be a desirable value. In addition, it could be seen that the BO algorithm improved the AUC of all standard models. The BO improved the performance of the SVM, KNN, and boosted DT/bagged DT by 0.05, 0.16, and 0.06, respectively. The outcomes of this analysis along with the achieved accuracies show that despite the fact that the optimized SVM and optimized EDT models achieved a higher accuracy than the optimized KNN model, the BO algorithm could improve the performance of the standard KNN model more substantially than the two other models.
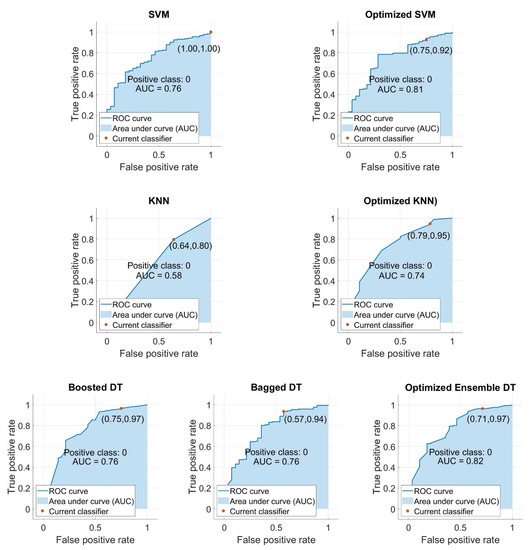
Figure 10.
ROC curves and AUC values of the models developed in this study (testing phase).
The testing performance of the optimized variants of the SVM, EDT, and KNN models was also compared with that of some of the well-known machine learning algorithms, including artificial neural networks (ANNs), random forest, and extreme gradient boosting trees (XGBT). The outcome of this comparison is shown in Figure 11. As can be seen, the optimized SVM, KNN, and EDT models outperformed the ANN, RF, and XGBT models for predicting road-crash-related pedestrian fatalities.
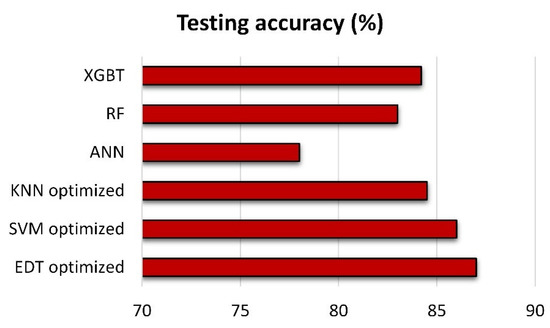
Figure 11.
Testing accuracy of the optimized models and ANN, RF, and XGBT models.
An important aspect of the BO algorithm’s performance is its ability to utilize past iterations’ data to determine the best future parameter option [59,60]. This might be the major reason why the BO could improve the performance of the SVM, KNN, and EDT algorithms to predict the RCPF. BO keeps track of the results of previous assessments to make a probabilistic model that turns hyperparameters into objective function scores. This technique constantly updates the surrogate probability model after each assessment of the goal function in order to become “less incorrect” with more evidence. Indeed, BO is effective since it makes informed decisions about the subsequent hyperparameters. The primary concept behind BO is to devote a little more effort to picking the subsequent hyperparameters to reduce the number of calls to the objective function. In reality, the time devoted to choosing the subsequent hyperparameters is negligible in comparison to the time invested in the objective function.
In addition, the fact that age was found to be an important predictor of RCPF in this study backs up the results of previous studies, e.g., [61,62,63] that showed how important this factor is in pedestrian crashes. The importance of other important factors of this present study, such as the time of day, bus involvement, day of the week, age, crash type, and speed limit, also have been confirmed in the previous studies [64,65,66].
8. Conclusions
This work developed and optimized three ML-based models (SVM, KNN, and EDT) to forecast the RCPF by determining the ideal combination of hyperparameters for each ML approach. Analyses of the models’ performance in making predictions were conducted. The dataset used in this study was derived from ARDD. The models that were made were optimized to improve their performance equally, and statistical measures were used to figure out how accurate their predictions were. Before developing these models, this study selected the most relevant inputs using the Gain score. Six input variables were selected to develop the three models and their optimized variants. The outcomes may be summed up as follows:
- With regards to the iteration process, the SVM model achieved the minimum classification error earlier than the other two models. The SVM was followed by the KNN and EDT, respectively.
- In both training and testing phases, the classification accuracy of all standard SVM, KNN, and EDT models was improved using the BO algorithm. For training phases, the SVM model’s accuracy improved more substantially (+5.4%) than the two other models. In the testing phase, the KNN model showed the greatest improvement (+11%).
- With regards to testing the AUC after the optimization process, the optimized KNN model had the greatest improvement (+0.16) compared to the two other models. The KNN model was followed by the SVM (0.05) and EDT (0.06), respectively.
- SVM and EDT models required the higher training time than the KNN model. However, this higher training time resulted in higher accuracy for these two models. As a result, we can overlook the longer training times of SVM and EDT models when compared to KNN models in exchange for their higher accuracy and performance.
This study employed the default search range of MATLAB. The authors believe these search ranges are sufficient. However, we suggest future studies employ a wider search range using the same algorithms and dataset. The findings of this paper show that the BO algorithm effectively improves the performance of the standard ML models to predict the RCPF. The application of BO to the KNN model yielded a greater improvement. However, the SVM and EDT models are stronger models compared to the KNN model, and it is recommended that future studies use these two models first for predicting the RCPF, as they can produce more accurate results than the KNN model. In addition, in the future, the BO algorithm can be used with other ML models to predict the RCPF, and the results can be shared so that all ML models can be compared more thoroughly.
Author Contributions
Conceptualization, M.A. (Mahdi Aghaabbasi); Data curation, M.A. (Mahdi Aghaabbasi); Formal analysis, M.A. (Mahdi Aghaabbasi), M.A. (Mujahid Ali) and A.J.; Funding acquisition, B.B., M.F.J. and N.M.S.; Investigation, L.Y. and M.A. (Mahdi Aghaabbasi); Methodology, M.A. (Mahdi Aghaabbasi) and M.A. (Mujahid Ali); Resources, B.B., M.F.J. and N.M.S.; Software, M.A. (Mahdi Aghaabbasi); Writing—original draft, L.Y., M.A. (Mahdi Aghaabbasi) and M.A. (Mujahid Ali). All authors have read and agreed to the published version of the manuscript.
Funding
This research was funded by King Khalid University, [grant number RGP.2/208/43].
Institutional Review Board Statement
Not applicable.
Informed Consent Statement
Not applicable.
Acknowledgments
The authors extend their appreciation to the Deanship of Scientific Research at King Khalid University for funding this work through Research Group Program [grant number RGP.2/208/43].
Conflicts of Interest
The authors declare no conflict of interest.
References
- Australian Transport Council (ATC). National Road Safety Strategy 2011–2020; Australian Transport Council (ATC): Canberra, Australia, 2011. [Google Scholar]
- Department of Infrastructure Regional Development and Cities. Australian Road Deaths Database. 2021. Available online: https://www.bitre.gov.au/statistics/safety/fatal_road_crash_database (accessed on 13 November 2021).
- Bureau of Infrastructure and Transport Research Economics (BITRE). Road Trauma Involving Heavy Vehicles 2018 Crash Statistical Summary; BITRE: Canberra, Australia, 2020. [Google Scholar]
- Zegeer, C.V.; Bushell, M. Pedestrian crash trends and potential countermeasures from around the world. Accid. Anal. Prev. 2012, 44, 3–11. [Google Scholar] [CrossRef] [PubMed]
- Anderson, R.; Ponte, G.; Doecke, S. A Survey of Bullbar Prevalence at Pedestrian Crash Sites in Adelaide, South Australia; Centre for Automotive Safety Research: Adelaide, Australia, 2008. [Google Scholar]
- Samerei, S.A.; Aghabayk, K.; Shiwakoti, N.; Karimi, S. Modelling bus-pedestrian crash severity in the state of Victoria, Australia. Int. J. Inj. Control Saf. Promot. 2021, 28, 233–242. [Google Scholar] [CrossRef] [PubMed]
- Arnold, P.; Rosman, D.; Thornett, M. Pedestrian crash risk in Western Australia for both pedestrians and drivers. Road Transp. Res. 1992, 1, 60–75. [Google Scholar]
- Imprialou, M.; Quddus, M. Crash data quality for road safety research: Current state and future directions. Accid. Anal. Prev. 2019, 130, 84–90. [Google Scholar] [CrossRef]
- Mannering, F.L.; Bhat, C.R. Analytic methods in accident research: Methodological frontier and future directions. Anal. Methods Accid. Res. 2014, 1, 1–22. [Google Scholar] [CrossRef]
- Shaheed, M.S.; Gkritza, K. A latent class analysis of single-vehicle motorcycle crash severity outcomes. Anal. Methods Accid. Res. 2014, 2, 30–38. [Google Scholar] [CrossRef]
- Sun, M.; Sun, X.; Shan, D. Pedestrian crash analysis with latent class clustering method. Accid. Anal. Prev. 2019, 124, 50–57. [Google Scholar] [CrossRef]
- Aghaabbasi, M.; Shekari, Z.A.; Shah, M.Z.; Olakunle, O.; Armaghani, D.J.; Moeinaddini, M. Predicting the use frequency of ride-sourcing by off-campus university students through random forest and Bayesian network techniques. Transp. Res. Part A Policy Pract. 2020, 136, 262–281. [Google Scholar] [CrossRef]
- Qian, Y.; Aghaabbasi, M.; Ali, M.; Alqurashi, M.; Salah, B.; Zainol, R.; Moeinaddini, M.; Hussein, E.E. Classification of Imbalanced Travel Mode Choice to Work Data Using Adjustable SVM Model. Appl. Sci. 2021, 11, 11916. [Google Scholar] [CrossRef]
- Aghaabbasi, M.; Shah, M.Z.; Zainol, R. Investigating the Use of Active Transportation Modes among University Employees through an Advanced Decision Tree Algorithm. Civ. Sustain. Urban Eng. 2021, 1, 26–49. [Google Scholar] [CrossRef]
- Ali, M.; de Azevedo, A.R.G.; Marvila, M.T.; Khan, M.I.; Memon, A.M.; Masood, F.; Almahbashi, N.M.Y.; Shad, M.K.; Khan, M.A.; Fediuk, R.; et al. The Influence of COVID-19-Induced Daily Activities on Health Parameters—A Case Study in Malaysia. Sustainability 2021, 13, 7465. [Google Scholar] [CrossRef]
- Ali, M.; Dharmowijoyo, D.B.; Harahap, I.S.; Puri, A.; Tanjung, L.E. Travel behaviour and health: Interaction of Activity-Travel Pattern, Travel Parameter and Physical Intensity. Solid State Technol. 2020, 63, 4026–4039. [Google Scholar]
- Ali, M.; Dharmowijoyo, D.B.E.; de Azevedo, A.R.G.; Fediuk, R.; Ahmad, H.; Salah, B. Time-Use and Spatio-Temporal Variables Influence on Physical Activity Intensity, Physical and Social Health of Travelers. Sustainability 2021, 13, 12226. [Google Scholar] [CrossRef]
- Chen, Y.; Aghaabbasi, M.; Ali, M.; Anciferov, S.; Sabitov, L.; Chebotarev, S.; Nabiullina, K.; Sychev, E.; Fediuk, R.; Zainol, R. Hybrid Bayesian Network Models to Investigate the Impact of Built Environment Experience before Adulthood on Students’ Tolerable Travel Time to Campus: Towards Sustainable Commute Behavior. Sustainability 2022, 14, 325. [Google Scholar] [CrossRef]
- Fan, Q.; Zhang, Y. Self-adaptive differential evolution algorithm with crossover strategies adaptation and its application in parameter estimation. Chemom. Intell. Lab. Syst. 2016, 151, 164–171. [Google Scholar] [CrossRef]
- Zajac, S.S.; Ivan, J.N. Factors influencing injury severity of motor vehicle–crossing pedestrian crashes in rural Connecticut. Accid. Anal. Prev. 2003, 35, 369–379. [Google Scholar] [CrossRef]
- Rifaat, S.M.; Chin, H.C. Accident severity analysis using ordered probit model. J. Adv. Transp. 2007, 41, 91–114. [Google Scholar] [CrossRef]
- Obeng, K.; Rokonuzzaman, M. Pedestrian injury severity in automobile crashes. Open J. Saf. Sci. Technol. 2013, 3, 9–17. [Google Scholar] [CrossRef]
- Kwigizile, V.; Sando, T.; Chimba, D. Inconsistencies of ordered and unordered probability models for pedestrian injury severity. Transp. Res. Rec. 2011, 2264, 110–118. [Google Scholar] [CrossRef]
- Yasmin, S.; Eluru, N. Evaluating alternate discrete outcome frameworks for modeling crash injury severity. Accid. Anal. Prev. 2013, 59, 506–521. [Google Scholar] [CrossRef]
- Sze, N.-N.; Wong, S. Diagnostic analysis of the logistic model for pedestrian injury severity in traffic crashes. Accid. Anal. Prev. 2007, 39, 1267–1278. [Google Scholar] [CrossRef] [PubMed]
- Kim, S.; Ulfarsson, G.F. Traffic safety in an aging society: Analysis of older pedestrian crashes. J. Transp. Saf. Secur. 2019, 11, 323–332. [Google Scholar] [CrossRef]
- Ulfarsson, G.F.; Kim, S.; Booth, K.M. Analyzing fault in pedestrian–motor vehicle crashes in North Carolina. Accid. Anal. Prev. 2010, 42, 1805–1813. [Google Scholar] [CrossRef] [PubMed]
- Tay, R.; Choi, J.; Kattan, L.; Khan, A. A multinomial logit model of pedestrian–vehicle crash severity. Int. J. Sustain. Transp. 2011, 5, 233–249. [Google Scholar] [CrossRef]
- Zhou, Z.-P.; Liu, Y.-S.; Wang, W.; Zhang, Y. Multinomial logit model of pedestrian crossing behaviors at signalized intersections. Discret. Dyn. Nat. Soc. 2013, 2013, 172726. [Google Scholar] [CrossRef]
- Chen, Z.; Fan, W. Modeling pedestrian injury severity in pedestrian-vehicle crashes in rural and urban areas: Mixed logit model approach. Transp. Res. Rec. 2019, 2673, 1023–1034. [Google Scholar] [CrossRef]
- Kim, J.-K.; Ulfarsson, G.F.; Shankar, V.N.; Mannering, F.L. A note on modeling pedestrian-injury severity in motor-vehicle crashes with the mixed logit model. Accid. Anal. Prev. 2010, 42, 1751–1758. [Google Scholar] [CrossRef]
- Haleem, K.; Alluri, P.; Gan, A. Analyzing pedestrian crash injury severity at signalized and non-signalized locations. Accid. Anal. Prev. 2015, 81, 14–23. [Google Scholar] [CrossRef]
- Tulu, G.S.; Washington, S.; Haque, M.M.; King, M.J. Injury severity of pedestrians involved in road traffic crashes in Addis Ababa, Ethiopia. J. Transp. Saf. Secur. 2017, 9, 47–66. [Google Scholar] [CrossRef]
- Rifaat, S.M.; Tay, R.; de Barros, A. Urban street pattern and pedestrian traffic safety. J. Urban Des. 2012, 17, 337–352. [Google Scholar] [CrossRef]
- Sasidharan, L.; Menéndez, M. Partial proportional odds model—An alternate choice for analyzing pedestrian crash injury severities. Accid. Anal. Prev. 2014, 72, 330–340. [Google Scholar] [CrossRef] [PubMed]
- Pour, A.T.; Moridpour, S.; Tay, R.; Rajabifard, A. A partial proportional odds model for pedestrian crashes at mid-blocks in Melbourne metropolitan area. In MATEC Web of Conferences; EDP Sciences: Paris, France, 2016; p. 02020. [Google Scholar]
- Li, Y.; Fan, W.D. Modelling severity of pedestrian-injury in pedestrian-vehicle crashes with latent class clustering and partial proportional odds model: A case study of North Carolina. Accid. Anal. Prev. 2019, 131, 284–296. [Google Scholar] [CrossRef]
- Li, Y.; Fan, W. Pedestrian injury severities in pedestrian-vehicle crashes and the partial proportional odds logit model: Accounting for age difference. Transp. Res. Rec. 2019, 2673, 731–746. [Google Scholar] [CrossRef]
- Chang, L.-Y.; Chen, W.-C. Data mining of tree-based models to analyze freeway accident frequency. J. Saf. Res. 2005, 36, 365–375. [Google Scholar] [CrossRef]
- Gong, Y.; Abdel-Aty, M.; Cai, Q.; Rahman, M.S. A decentralized network level adaptive signal control algorithm by deep reinforcement learning. In Proceedings of the Transportation Research Board 98th Annual Meeting, Washington, DC, USA, 13–17 January 2019. [Google Scholar]
- Zhu, S.Y. Analyse vehicle-pedestrian crash severity at intersection with data mining techniques. Int. J. Crashworth. 2021, 9. [Google Scholar] [CrossRef]
- Das, S.; Le, M.; Dai, B.Y. Application of machine learning tools in classifying pedestrian crash types: A case study. Transp. Saf. Environ. 2020, 2, 106–119. [Google Scholar] [CrossRef]
- Ding, C.; Chen, P.; Jiao, J.F. Non-linear effects of the built environment on automobile-involved pedestrian crash frequency: A machine learning approach. Accid. Anal. Prev. 2018, 112, 116–126. [Google Scholar] [CrossRef]
- Guo, M.; Yuan, Z.; Janson, B.; Peng, Y.; Yang, Y.; Wang, W. Older pedestrian traffic crashes severity analysis based on an emerging machine learning XGBoost. Sustainability 2021, 13, 926. [Google Scholar] [CrossRef]
- Mokhtarimousavi, S. A Time of Day Analysis of Pedestrian-Involved Crashes in California: Investigation of Injury Severity, a Logistic Regression and Machine Learning Approach Using HSIS Data. ITE J.-Inst. Transp. Eng. 2019, 89, 25–33. [Google Scholar]
- Pour, A.T.; Moridpour, S.; Rajabifard, A.; Tay, R. Spatial and temporal distribution of pedestrian crashes in Melbourne metropolitan area. Road Transp. Res. 2017, 26, 4–20. [Google Scholar]
- Rahimi, A.; Azimi, G.; Asgari, H.; Jin, X. Injury severity of pedestrian and bicyclist crashes involving large trucks. In Proceedings of the ASCE International Conference on Transportation and Development (ASCE ICTD), Seattle, WA, USA, 26–29 May 2020; pp. 110–122. [Google Scholar]
- Saha, D.; Dumbaugh, E. Use of a model-based gradient boosting framework to assess spatial and non-linear effects of variables on pedestrian crash frequency at macro-level. J. Transp. Saf. Secur. 2021, 32, 1419–1450. [Google Scholar] [CrossRef]
- Tao, W.; Aghaabbasi, M.; Ali, M.; Almaliki, A.H.; Zainol, R.; Almaliki, A.A.; Hussein, E.E. An Advanced Machine Learning Approach to Predicting Pedestrian Fatality Caused by Road Crashes: A Step toward Sustainable Pedestrian Safety. Sustainability 2022, 14, 2436. [Google Scholar] [CrossRef]
- Zhu, R.; Guo, Y.; Xue, J.-H. Adjusting the imbalance ratio by the dimensionality of imbalanced data. Pattern Recognit. Lett. 2020, 133, 217–223. [Google Scholar] [CrossRef]
- Verron, S.; Tiplica, T.; Kobi, A. Fault detection and identification with a new feature selection based on mutual information. J. Process Control 2008, 18, 479–490. [Google Scholar] [CrossRef]
- Wali, B.; Khattak, A.J.; Ahmad, N. Injury severity analysis of pedestrian and bicyclist trespassing crashes at non-crossings: A hybrid predictive text analytics and heterogeneity-based statistical modeling approach. Accid. Anal. Prev. 2021, 150, 16. [Google Scholar] [CrossRef]
- Xie, W.; Nie, W.; Saffari, P.; Robledo, L.F.; Descote, P.-Y.; Jian, W. Landslide hazard assessment based on Bayesian optimization–support vector machine in Nanping City, China. Nat. Hazards 2021, 109, 931–948. [Google Scholar] [CrossRef]
- Alajmi, M.S.; Almeshal, A.M. Estimation and optimization of tool wear in conventional turning of 709M40 alloy steel using support vector machine (SVM) with Bayesian optimization. Materials 2021, 14, 3773. [Google Scholar] [CrossRef]
- Pandey, P.; Bandhu, K.C. A credit risk assessment on borrowers classification using optimized decision tree and KNN with bayesian optimization. Int. J. Inf. Technol. 2022, 1–11. [Google Scholar] [CrossRef]
- Xia, Y.; Liu, C.; Li, Y.; Liu, N. A boosted decision tree approach using Bayesian hyper-parameter optimization for credit scoring. Expert Syst. Appl. 2017, 78, 225–241. [Google Scholar] [CrossRef]
- Xu, H.; Lu, C.; Berendt, R.; Jha, N.; Mandal, M. Automated analysis and classification of melanocytic tumor on skin whole slide images. Comput. Med. Imaging Graph. 2018, 66, 124–134. [Google Scholar] [CrossRef]
- Xu, H.; Park, S.; Hwang, T.H. Computerized classification of prostate cancer gleason scores from whole slide images. IEEE/ACM Trans. Comput. Biol. Bioinform. 2019, 17, 1871–1882. [Google Scholar] [CrossRef] [PubMed]
- Rashedi, E.; Nezamabadi-Pour, H.; Saryazdi, S. GSA: A gravitational search algorithm. Inf. Sci. 2009, 179, 2232–2248. [Google Scholar] [CrossRef]
- Abdel-Basset, M.; Shawky, L.A. Flower pollination algorithm: A comprehensive review. Artif. Intell. Rev. 2019, 52, 2533–2557. [Google Scholar] [CrossRef]
- Oxley, J.; Whelan, M. It cannot be all about safety: The benefits of prolonged mobility. Traffic Inj. Prev. 2008, 9, 367–378. [Google Scholar] [CrossRef]
- Onieva-García, M.Á.; Martínez-Ruiz, V.; Lardelli-Claret, P.; Jiménez-Moleón, J.J.; Amezcua-Prieto, C.; de Dios Luna-del-Castillo, J.; Jiménez-Mejías, E. Gender and age differences in components of traffic-related pedestrian death rates: Exposure, risk of crash and fatality rate. Inj. Epidemiol. 2016, 3, 14. [Google Scholar] [CrossRef]
- Toran Pour, A.; Moridpour, S.; Tay, R.; Rajabifard, A. Influence of pedestrian age and gender on spatial and temporal distribution of pedestrian crashes. Traffic Inj. Prev. 2018, 19, 81–87. [Google Scholar] [CrossRef]
- Aarts, L.; Van Schagen, I. Driving speed and the risk of road crashes: A review. Accid. Anal. Prev. 2006, 38, 215–224. [Google Scholar] [CrossRef]
- Park, H.-C.; Joo, Y.-J.; Kho, S.-Y.; Kim, D.-K.; Park, B.-J. Injury severity of bus–pedestrian crashes in South Korea considering the effects of regional and company factors. Sustainability 2019, 11, 3169. [Google Scholar] [CrossRef]
- Li, P.; Abdel-Aty, M.; Yuan, J. Using bus critical driving events as surrogate safety measures for pedestrian and bicycle crashes based on GPS trajectory data. Accid. Anal. Prev. 2021, 150, 105924. [Google Scholar] [CrossRef]
Publisher’s Note: MDPI stays neutral with regard to jurisdictional claims in published maps and institutional affiliations. |
© 2022 by the authors. Licensee MDPI, Basel, Switzerland. This article is an open access article distributed under the terms and conditions of the Creative Commons Attribution (CC BY) license (https://creativecommons.org/licenses/by/4.0/).