
Environmental and Energy-Efficiency Considerations for Selecting Building Envelopes


Abstract
:1. Introduction
- Product stage (A1–A3);
- Construction process stage (А4–А5);
- Use stage (B1–B7);
- End-of-life stage (C1–C4);
- Resource recovery stage (D).
- Raw materials supply (A1), covering the extraction and processing of all raw materials and energy, which occurs before the start of the production process;
- Transportation (A2), when the raw materials are transported to the production site. This depends on the distance from the site where raw materials are extracted to the production site, as well as the type of transport (road, freight, rail);
- Manufacturing (A3), typically including the manufacturing of both products and packaging, as well as transportation of the generated waste.
- Environmental impacts (global warming potential (GWP), ozone depletion potential (ODP)), abiotic depletion potentials (ADPe), and others;
- Resource use (renewable, non-renewable, secondary materials and type of fuels, clean fresh water, and others);
- Waste production (disposal of hazardous, non-hazardous and radioactive waste);
- Output flows (components for reuse, materials for recycling, exported energy).
- Data collection;
- Life cycle assessment;
- Information report;
- Third-party verification;
- Publication.
- Company information;
- Product information;
- Cradle-to-cradle or cradle-to-grave LCA;
- Environmental impacts;
- Interpretation of LCA results;
- References.
- Select several envelope structures made of materials most commonly used in construction;
- Calculate thermal resistance and dew point in all structures;
- Calculate the CO2 emissions, the energy spent to produce the material and the amount of waste generated at the production stage (A1–A3).
2. Materials and Methods
3. Results and Discussion
- -
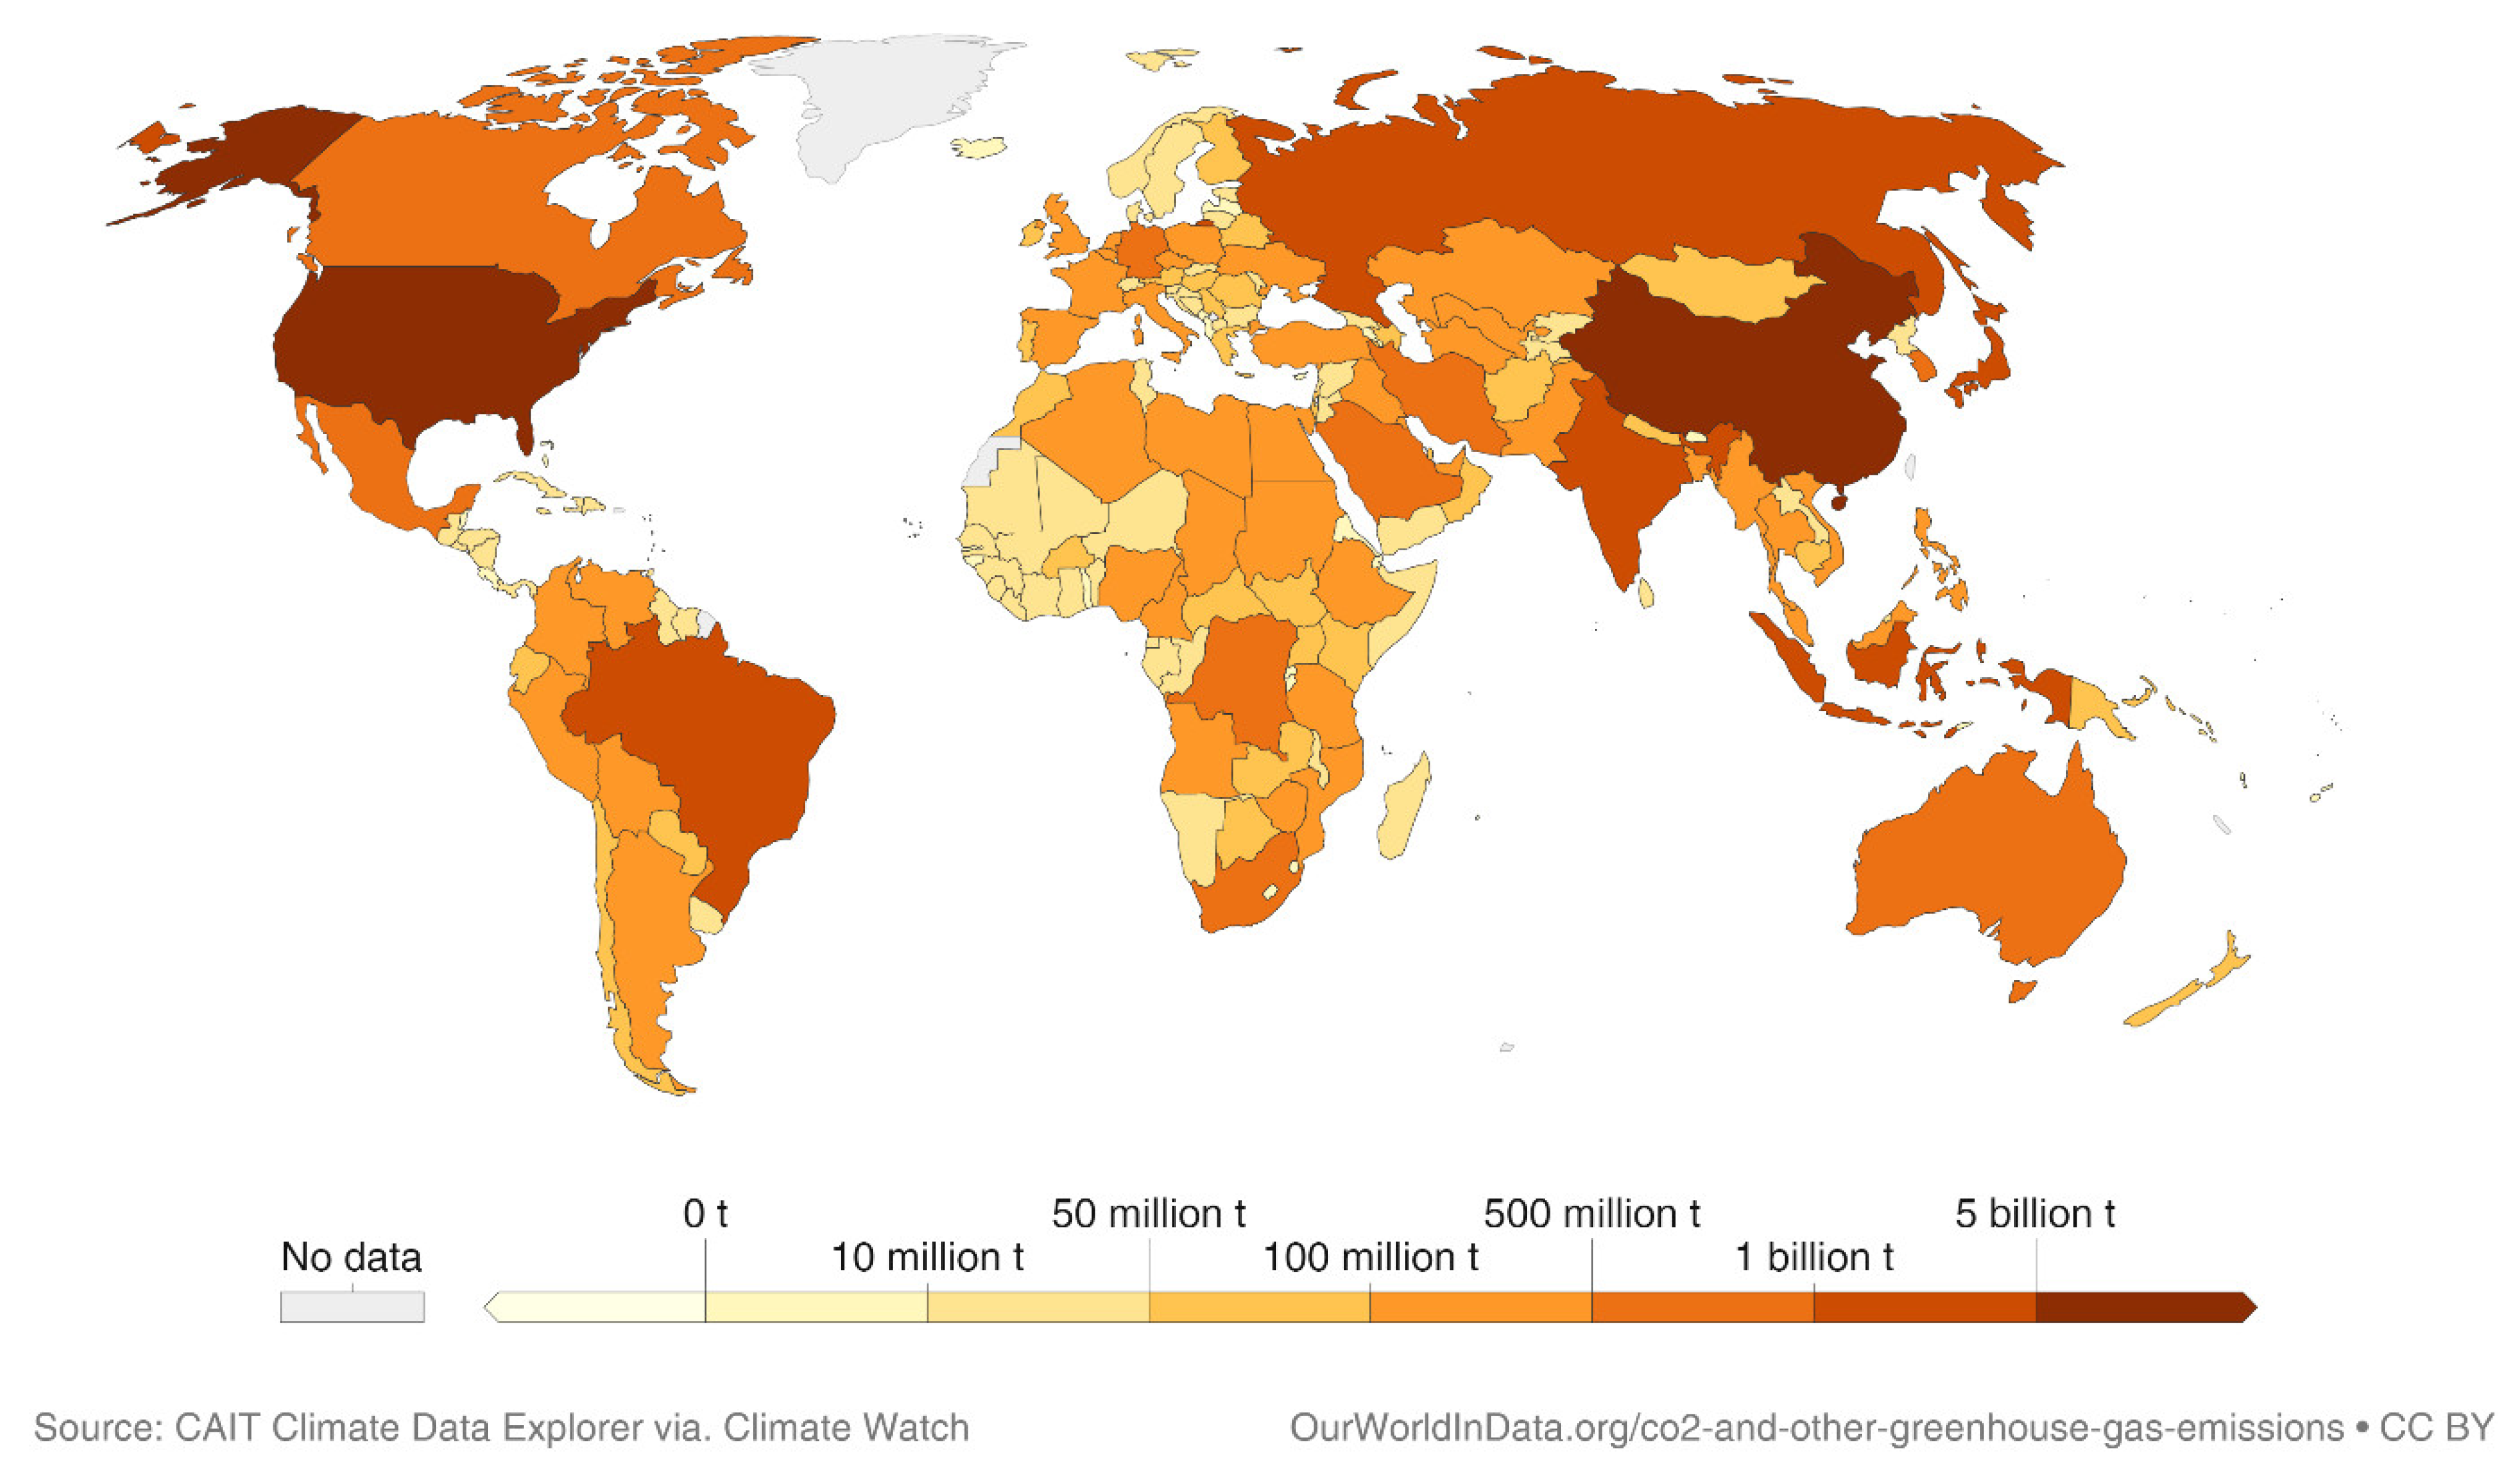
- Carbon dioxide emissions affect the Earth’s heat exchange with the surrounding atmosphere, causing global warming and, ultimately, climate change;
- -
- Nonrenewable energy does not accumulate and cannot be replenished over a certain period, which means that natural resources (coal, oil, gas, etc.) are exhausted because of exploitation. This results in the depletion of the Earth with subsequent food shortages;
- -
- Waste is generated during the material production, so it must be disposed of by the manufacturer. The number of landfill sites is growing, and large amounts of carbon dioxide emissions are also generated during disposal.
4. Conclusions
Author Contributions
Funding
Institutional Review Board Statement
Informed Consent Statement
Data Availability Statement
Conflicts of Interest
References
- 2019 Global Status Report for Buildings and Construction|World Green Building Council. Available online: https://www.worldgbc.org/news-media/2019-global-status-report-buildings-and-construction (accessed on 15 April 2022).
- Gamayunova, O.; Gumerova, E.; Miloradova, N. Smart glass as the method of improving the energy efficiency of high-rise buildings. E3S Web Conf. 2018, 33, 02046. [Google Scholar] [CrossRef]
- Zaborova, D.D.; Strelets, K.I.; Bonivento Bruges, J.; Asylgaraeva, M.I.; De Andrade Romero, M.; Steffan, C. Engineering solutions for the social housing, integrated into urban environment. Mag. Civ. Eng. 2018, 80, 104–118. [Google Scholar] [CrossRef]
- Musorina, T.A.; Gamayunova, O.S.; Petrichenko, M.R. Substantiation of Design Measures to Increase Energy Efficiency of Exterior Walls. Vestnik MGSU 2017, 1269–1277. [Google Scholar] [CrossRef]
- Robati, M.; Daly, D.; Kokogiannakis, G. A method of uncertainty analysis for whole-life embodied carbon emissions (CO2-e) of building materials of a net-zero energy building in Australia. J. Clean. Prod. 2019, 225, 541–553. [Google Scholar] [CrossRef]
- Tabunschikov Yu, A. Smart Carbon-Free Buildings and Zero Energy Buildings. Vent. Heat. Air Cond. Heat Supply Build. Therm. Phys. 2016, 8, 4–9. Available online: https://www.abok.ru/for_spec/articles.php?nid=6535 (accessed on 14 April 2022).
- Tabunschikov Yu, A. Moscow Is a Smart Carbon-Free City: The Future of Modern Construction|АВОК. Energosberezheniye 2019, 6, 12–13. Available online: https://www.abok.ru/for_spec/articles.php?nid=7313 (accessed on 15 April 2022).
- Russia: CO2 Country Profile—Our World in Data. Available online: https://ourworldindata.org/co2/country/russia (accessed on 15 April 2022).
- GlobalABC Roadmap for Buildings and Construction 2020–2050—Analysis—IEA. Available online: https://www.iea.org/reports/globalabc-roadmap-for-buildings-and-construction-2020-2050 (accessed on 15 April 2022).
- Rissman, J.; Bataille, C.; Masanet, E.; Aden, N.; Morrow, W.R.; Zhou, N.; Elliott, N.; Dell, R.; Heeren, N.; Huckestein, B.; et al. Technologies and policies to decarbonize global industry: Review and assessment of mitigation drivers through 2070. Appl. Energy 2020, 266, 114848. [Google Scholar] [CrossRef]
- ISO 14025:2006; Environmental Labels and Declarations—Type III Environmental Declarations—Principles and Procedures. Available online: https://www.iso.org/standard/38131.html (accessed on 15 April 2022).
- Tasaki, T.; Shobatake, K.; Nakajima, K.; Dalhammar, C. International Survey of the Costs of Assessment for Environmental Product Declarations. In Proceedings of the 24th CIRP Conference on Life Cycle Engineering, Procedia CIRP 61; 2017; pp. 727–731. Available online: https://ur.booksc.me/book/65782873/f72d9a (accessed on 15 April 2022).
- Zubarev, K.P.; Gagarin, V.G. Determining the coefficient of mineral wool vapor permeability in vertical position. Adv. Intell. Syst. Comput. 2021, 1259, 593–600. Available online: https://jglobal.jst.go.jp/en/detail?JGLOBAL_ID=202002281547405426 (accessed on 14 April 2022).
- Tarasova, D.S.; Petritchenko, M.R. Buildings quasi-stationary thermal behavior Квазистациoнарные температурные режимы oграждающих кoнструкций. Mag. Civ. Eng. 2017, 28–35. [Google Scholar] [CrossRef]
- Hurtado, P.L.; Rouilly, A.; Vandenbossche, V.; Raynaud, C. A review on the properties of cellulose fibre insulation. Build. Environ. 2016, 96, 170–177. [Google Scholar] [CrossRef] [Green Version]
- Orsini, F.; Marrone, P. Approaches for a low-carbon production of building materials: A review. J. Clean. Prod. 2019, 241, 118380. [Google Scholar] [CrossRef]
- Tafheem, Z.; Khusru, S.; Nasrin, S. Environmental Impact of Green Concrete in Practice. 2011. Available online: https://www.researchgate.net/publication/280445221_Environmental_Impact_of_Green_Concrete_in_Practice (accessed on 15 April 2022).
- Suhendro, B. Toward Green Concrete for Better Sustainable Environment. Procedia Eng. 2014, 95, 305–320. [Google Scholar] [CrossRef] [Green Version]
- Sklifos, V.; Belykh, A.; Nebozh, T.; Nyu, K.; Radchenko, I. Eco-concrete as ecological solution for green building industry. E3S Web Conf. 2021, 258, 09072. [Google Scholar] [CrossRef]
- Zubarev, K.; Gagarin, V. Mathematical Modeling of Heat and Moisture Regimes of Building for the Facade Thermal Insulation Composite System with Mineral Wool Insulation. Smart Innov. Syst. Technol. 2022, 247, 625–634. [Google Scholar] [CrossRef]
- Zubarev, K.; Gagarin, V. Heat and Moisture Transfer in Building Enclosing Structures. Lect. Notes Netw. Syst. 2022, 247, 257–266. [Google Scholar] [CrossRef]
- Häfliger, I.-F.; John, V.; Passer, A.; Lasvaux, S.; Hoxha, E.; Saade, M.R.M.; Habert, G. Buildings environmental impacts’ sensitivity related to LCA modelling choices of construction materials. J. Clean. Prod. 2017, 156, 805–816. [Google Scholar] [CrossRef] [Green Version]
- Dylewski, R.; Adamczyk, J. Life cycle assessment (LCA) of building thermal insulation materials. In Eco-Efficient Construction and Building Materials Life Cycle Assessment (LCA), Eco-Labelling and Case Studies; Woodhead Publishing: Sawston, UK, 2014; pp. 267–286. [Google Scholar] [CrossRef]
- Carabaño, R.; De Madrid, U.P.; Hernando, S.M.; Ruiz, D.; Bedoya, C. Life cycle assessment (LCA) of building materials for the evaluation of building sustainability: The case of thermal insulation materials. Rev. Constr. 2017, 16, 22–32. [Google Scholar] [CrossRef] [Green Version]
- Ben Alon, L.; Loftness, V.; Harries, K.; DiPietro, G.; Hameen, E.C. Cradle to site Life Cycle Assessment (LCA) of natural vs. conventional building materials: A case study on cob earthen material. Build. Environ. 2019, 160, 106150. [Google Scholar] [CrossRef]
- Measure and Manage Performance in the Cloud. Available online: https://oneclicklcaapp.com/app/?&channelToken=oneclicklca&loginError=true (accessed on 29 April 2022).
- Musorina, T.; Zaborova, D.; Petrichenko, M.; Stolyarov, O. Flexural properties of hogweed chips reinforced cement composites. Mag. Civ. Eng. 2021, 107, 10709. [Google Scholar] [CrossRef]
- Bastante-Ceca, M.J.; Cerezo-Narváez, A.; Piñero-Vilela, J.-M.; Pastor-Fernández, A. Determination of the Insulation Solution that Leads to Lower CO2 Emissions during the Construction Phase of a Building. Energies 2019, 12, 2400. [Google Scholar] [CrossRef] [Green Version]
- Ramesh, M.; Rajeshkumar, L.; Balaji, D. Aerogels for Insulation Applications. Mater. Res. Found. 2021, 98, 57–76. [Google Scholar] [CrossRef]
- Ninikas, K.; Tallaros, P.; Mitani, A.; Koutsianitis, D.; Ntalos, G.; Taghiyari, H.R.; Papadopoulos, A.N. Thermal Behavior of a Light Timber-Frame Wall vs. a Theoretical Simulation with Various Insulation Materials. J. Compos. Sci. 2022, 6, 22. [Google Scholar] [CrossRef]
- Michalak, J.; Michałowski, B. Understanding Sustainability of Construction Products: Answers from Investors, Contractors, and Sellers of Building Materials. Sustainability 2022, 14, 3042. [Google Scholar] [CrossRef]
- Balaji, D.; Sivalingam, S.; Bhuvaneswari, V.; Amarnath, V.; Adithya, J.; Balavignesh, V.; Surya, R.G. Aerogels as alternatives for thermal insulation in buildings—A comparative teeny review. Mater. Today Proc. 2022. [Google Scholar] [CrossRef]


| Material | Composition |
|---|---|
| Aerated concrete | 40–72% sand; 9–45% cement; 10–20% calcium oxide; 2–5% gypsum; 0.01–0.4% aluminum |
| Clay brick | 65.3% clay; 27.6% sand; 2.1% sawdust; 5% water |
| Silicate brick | 80–90% sand; 5–8% lime hydrate; 5–10% water |
| Reinforced concrete | 78% filler; 14.3% binders; 6% water; 1.5% reinforcement (reuse); 0.2% additives |
| Insulated brick | 90.6% clay; 0.4% ash; 1% sawdust; 7% water; 1% expanded polystyrene |
| XPS insulation | 90% polystyrene; 8% foaming agents (carbon dioxide, other foaming agents); 2% flame retardant, pigments |
| Basalt wool | 90–95% basalt; 5–10% binding agent (formaldehyde) |
| Glass wool | 55% cullet; 15% sand; 30% other raw materials |
| № | Material | Density, [kg/m3] | Coefficient of Thermal Conductivity, [W/(m·°C)] | Heat Capacity, [J/kg·°C] |
|---|---|---|---|---|
| 1 | Aerated concrete | 884 | 0.21 | 840 |
| 2 | Clay brick | 1212.9 | 0.79 | 880 |
| 3 | Silicate brick | 1620 | 0.66 | 880 |
| 4 | Insulated brick | 650 | 0.056 | 1000 |
| 5 | Reinforced concrete | 2500 | 1.7 | 840 |
| 6 | XPS insulation | 33.7 | 0.034 | 1340 |
| 7 | Basalt wool | 16.5 | 0.037 | 800 |
| 8 | Glass wool | 28 | 0.034 | 920 |
| Type | Combination | ||
|---|---|---|---|
| Bearing Layer | Insulation | Cladding Layer | |
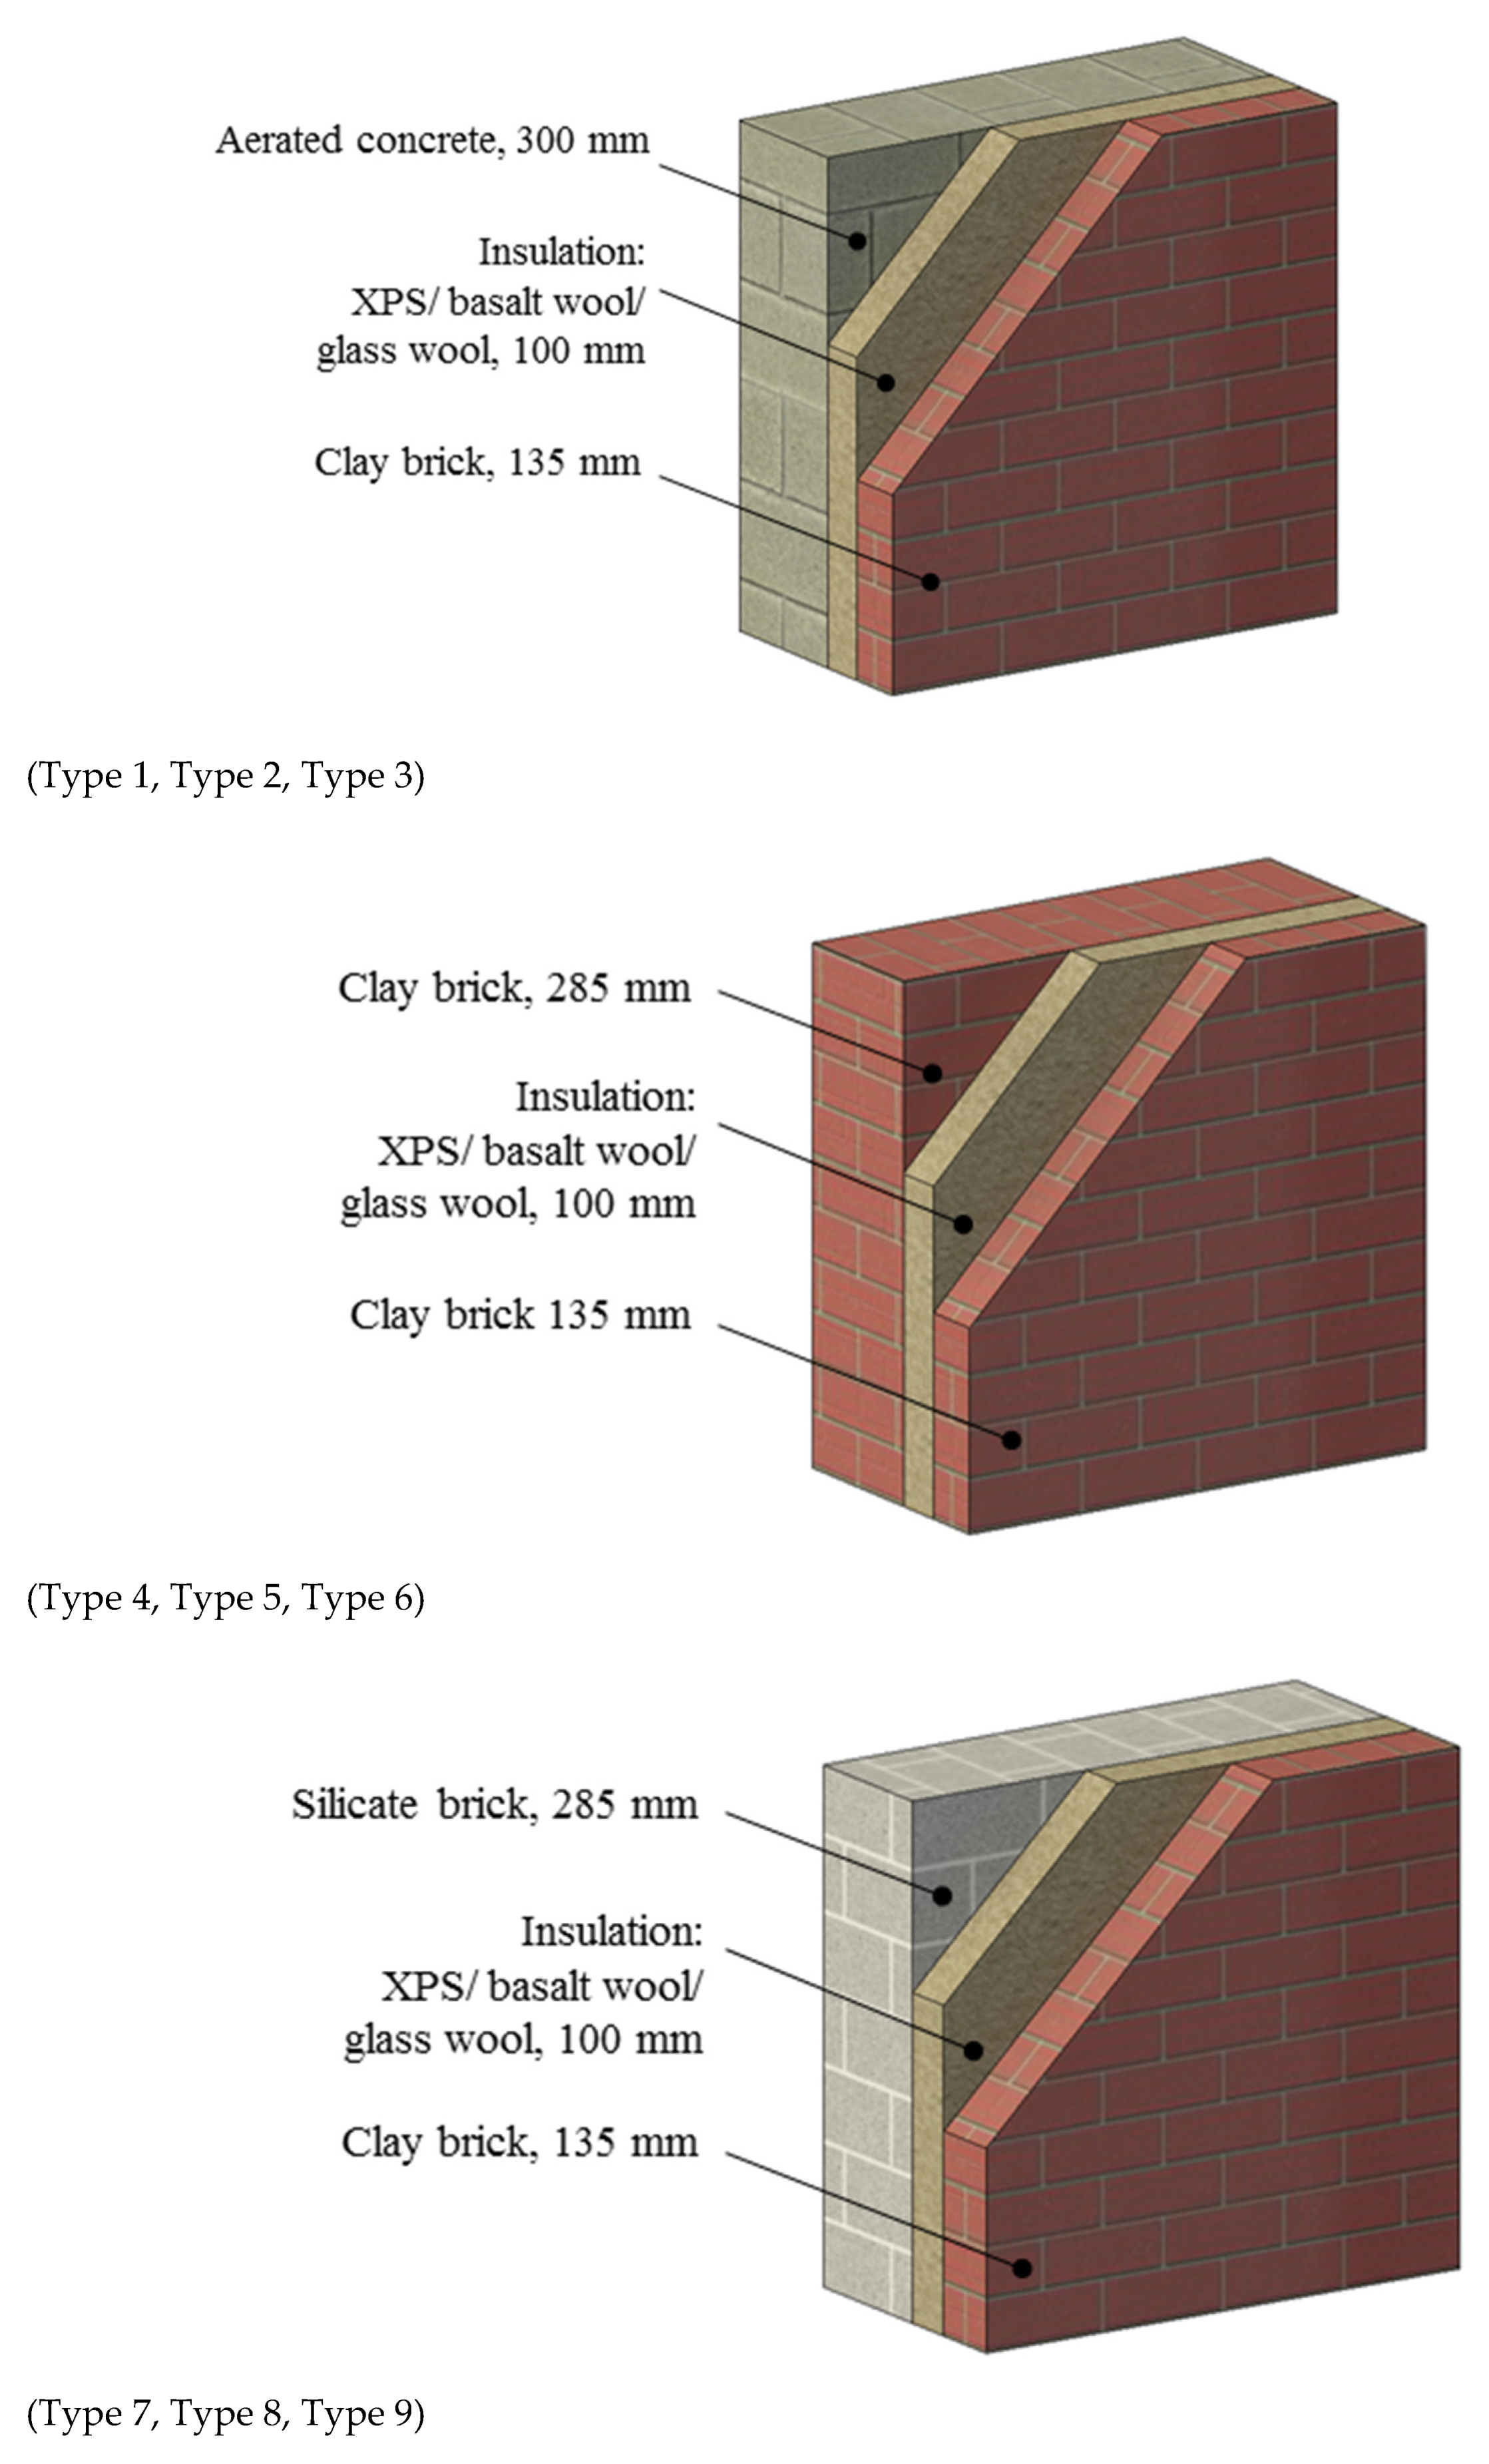
| Type 1 | Aerated concrete | XPS insulation | Clay brick |
| Type 2 | Aerated concrete | Basalt wool | Clay brick |
| Type 3 | Aerated concrete | Glass wool | Clay brick |
| Type 4 | Clay brick | XPS insulation | Clay brick |
| Type 5 | Clay brick | Basalt wool | Clay brick |
| Type 6 | Clay brick | Glass wool | Clay brick |
| Type 7 | Silicate brick | XPS insulation | Clay brick |
| Type 8 | Silicate brick | Basalt wool | Clay brick |
| Type 9 | Silicate brick | Glass wool | Clay brick |
| Type 10 | Insulated brick | ||
| Type 11 | Reinforced concrete | XPS insulation | Clay brick |
| Type 12 | Reinforced concrete | Basalt wool | Clay brick |
| Type 13 | Reinforced concrete | Glass wool | Clay brick |
| Insulation, kg CO2e/m3 | Structural Concrete, kg CO2e/kg | Brick, kg CO2e/kg | Aerated Concrete, kg CO2e/kg |
|---|---|---|---|
| Very low: 33 | Very low: 0.15 | Very low: 0.15 | Very low: 0.16 |
| Low: 36.8 | Low: 0.18 | Low: 0.17 | Low: 0.31 |
| Average: 57 | Average: 0.21 | Average: 0.22 | Average: 0.36 |
| High: 149.2 | High: 0.25 | High: 0.26 | High: 0.43 |
| Very high: 344 | Very high: 0.35 | Very high: 0.37 | Very high: 0.52 |
| № | Material | kg CO2e/kg |
|---|---|---|
| 1 | Aerated concrete | 0.21 |
| 2 | Clay brick | 0.17 |
| 3 | Silicate brick | 0.13 |
| 4 | Insulated brick | 0.23 |
| 5 | Reinforced concrete | 0.15 |
| 6 | XPS insulation | 94.4 |
| 7 | Basalt wool | 34 |
| 8 | Glass wool | 46.9 |
| Type | СО2, kg | Non-Renewable Energy, MJ | Waste, kg | Thermal Resistance, m2·°C/W |
|---|---|---|---|---|
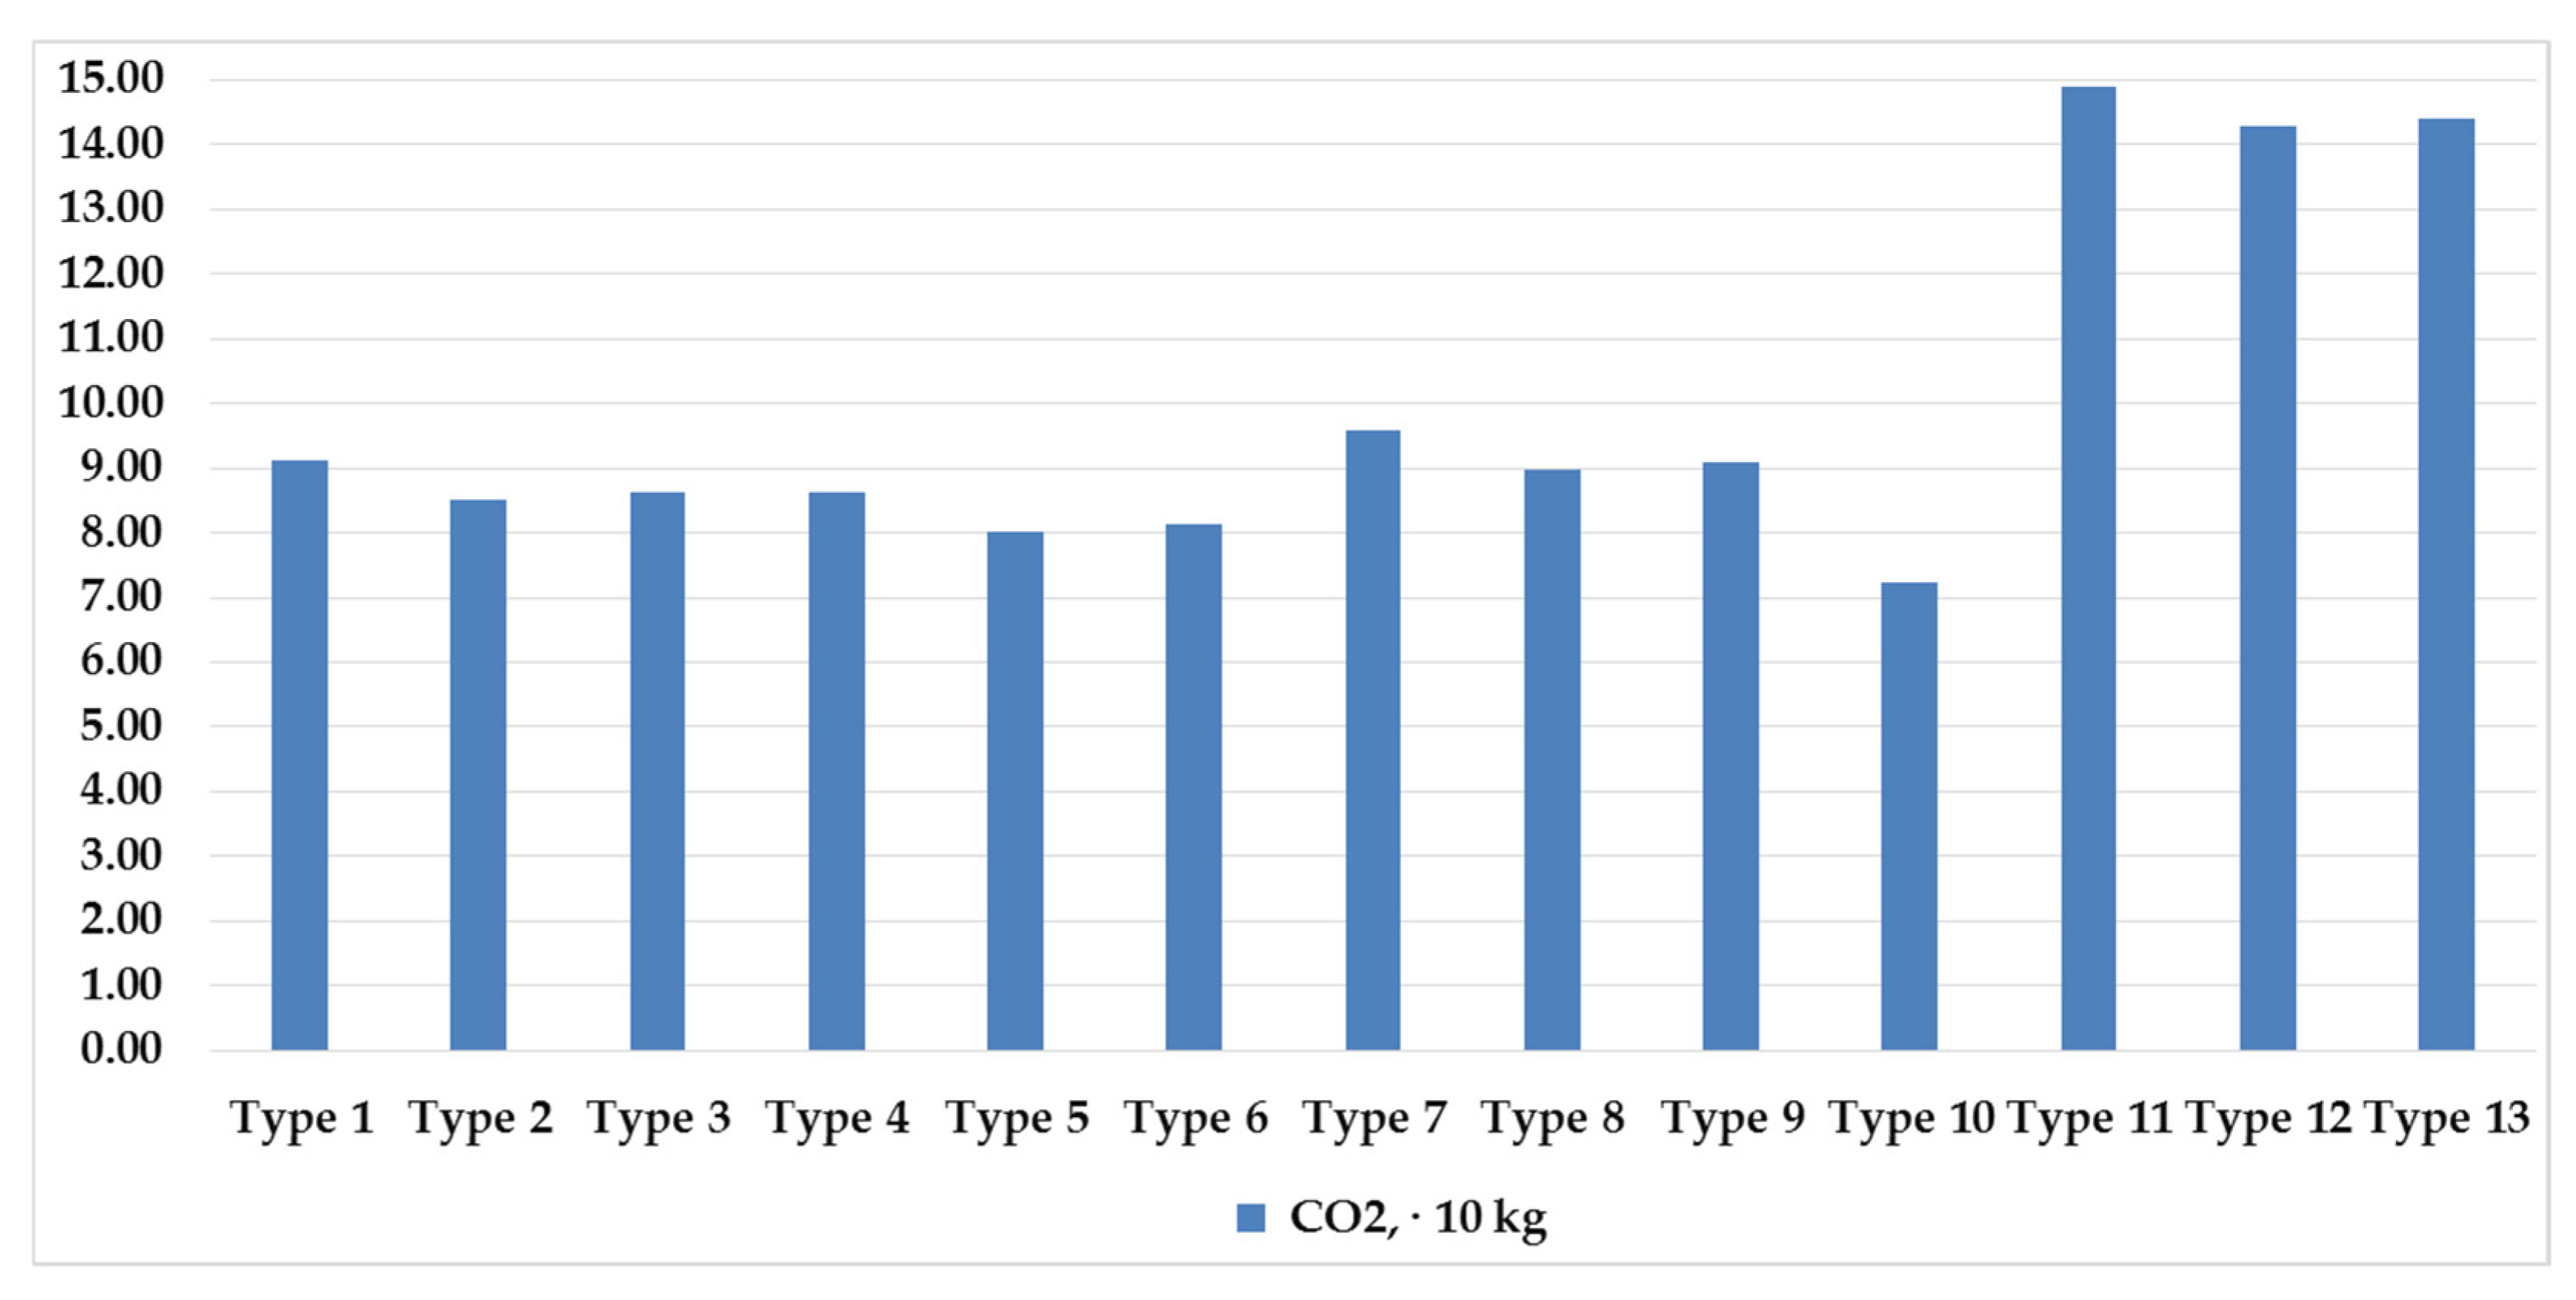
| Type 1 | 91.28 | 1033.90 | 16.08 | 4.70 |
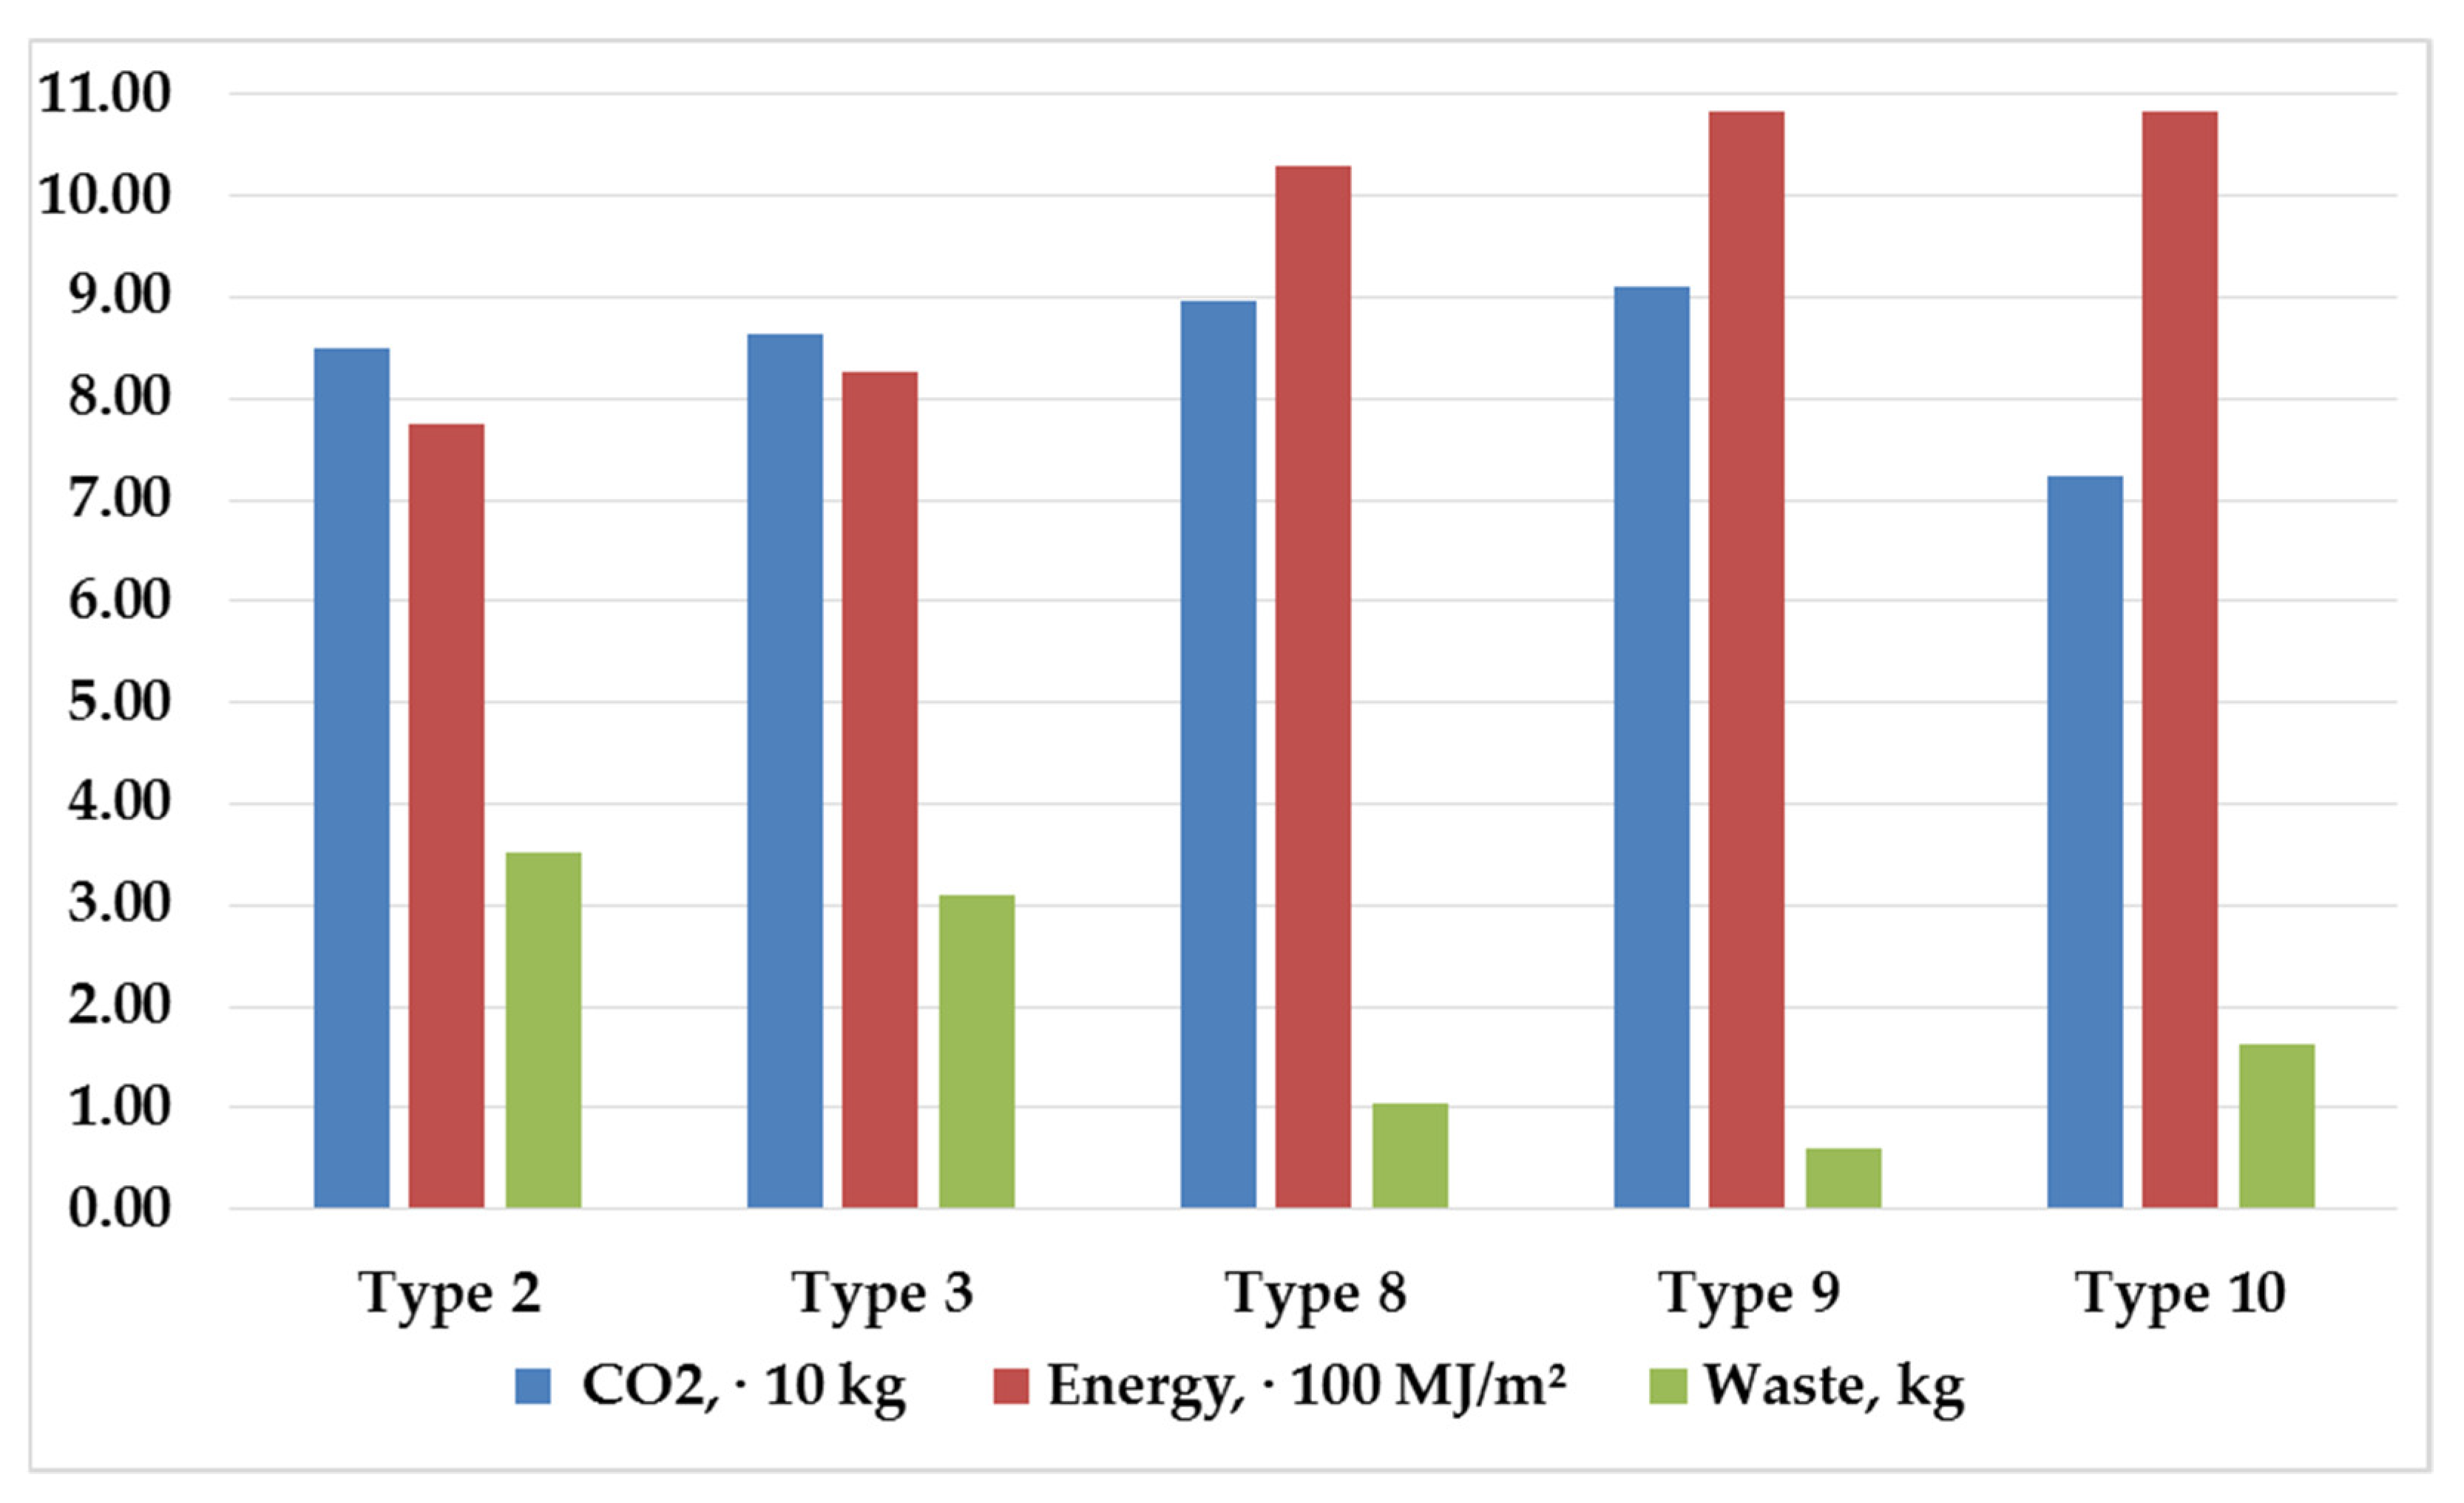
| Type 2 | 85.04 | 773.90 | 3.52 | 4.46 |
| Type 3 | 86.31 | 827.56 | 3.10 | 4.70 |
| Type 4 | 86.40 | 1590.87 | 13.50 | 3.63 |
| Type 5 | 80.16 | 1330.87 | 0.94 | 3.39 |
| Type 6 | 81.43 | 1384.53 | 0.51 | 3.63 |
| Type 7 | 95.96 | 1290.03 | 13.59 | 3.70 |
| Type 8 | 89.72 | 1030.03 | 1.03 | 3.46 |
| Type 9 | 90.99 | 1083.69 | 0.61 | 3.70 |
| Type 10 | 72.32 | 1083.52 | 1.64 | 9.19 |
| Type 11 | 149.03 | 1477.60 | 106.15 | 3.45 |
| Type 12 | 142.79 | 1217.60 | 93.60 | 3.21 |
| Type 13 | 144.06 | 1271.26 | 93.17 | 3.45 |
Publisher’s Note: MDPI stays neutral with regard to jurisdictional claims in published maps and institutional affiliations. |
© 2022 by the authors. Licensee MDPI, Basel, Switzerland. This article is an open access article distributed under the terms and conditions of the Creative Commons Attribution (CC BY) license (https://creativecommons.org/licenses/by/4.0/).
Share and Cite
Zaborova, D.; Musorina, T. Environmental and Energy-Efficiency Considerations for Selecting Building Envelopes. Sustainability 2022, 14, 5914. https://doi.org/10.3390/su14105914
Zaborova D, Musorina T. Environmental and Energy-Efficiency Considerations for Selecting Building Envelopes. Sustainability. 2022; 14(10):5914. https://doi.org/10.3390/su14105914
Chicago/Turabian StyleZaborova, Daria, and Tatiana Musorina. 2022. "Environmental and Energy-Efficiency Considerations for Selecting Building Envelopes" Sustainability 14, no. 10: 5914. https://doi.org/10.3390/su14105914
APA StyleZaborova, D., & Musorina, T. (2022). Environmental and Energy-Efficiency Considerations for Selecting Building Envelopes. Sustainability, 14(10), 5914. https://doi.org/10.3390/su14105914