
Land Cover Changes in Ghana over the Past 24 Years


Abstract
1. Introduction
2. Materials and Methods
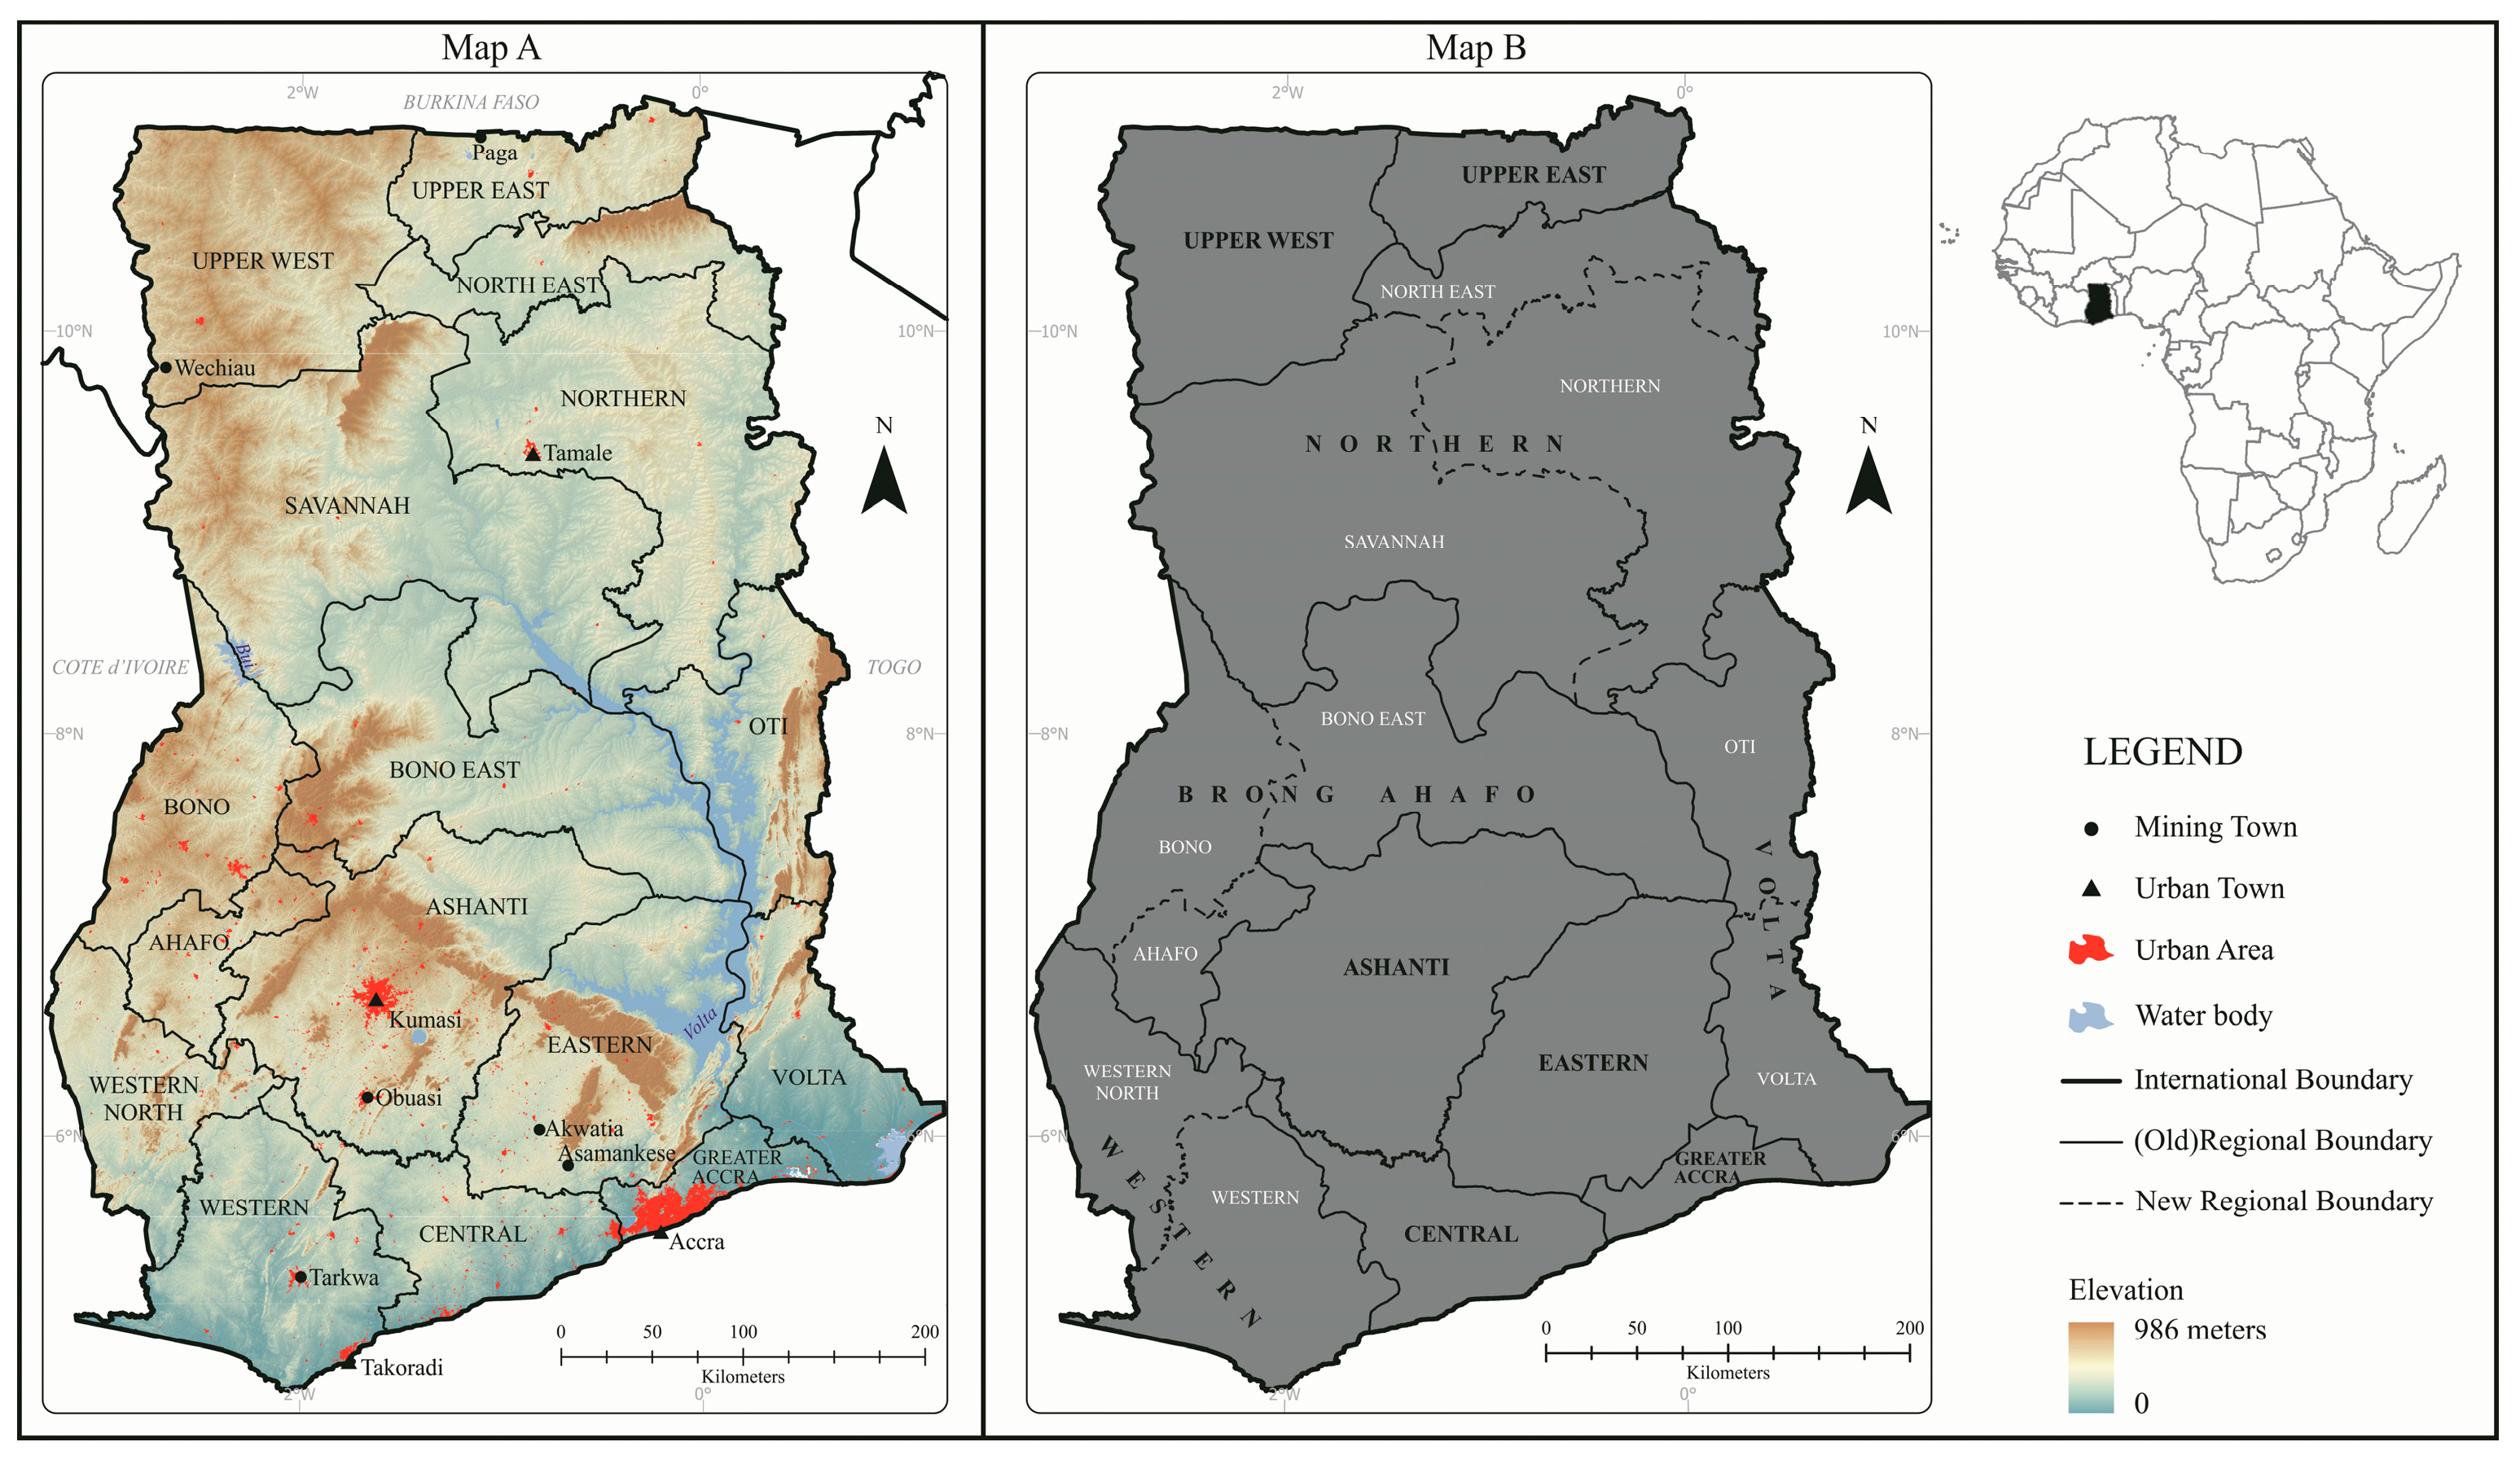
2.1. Study Area
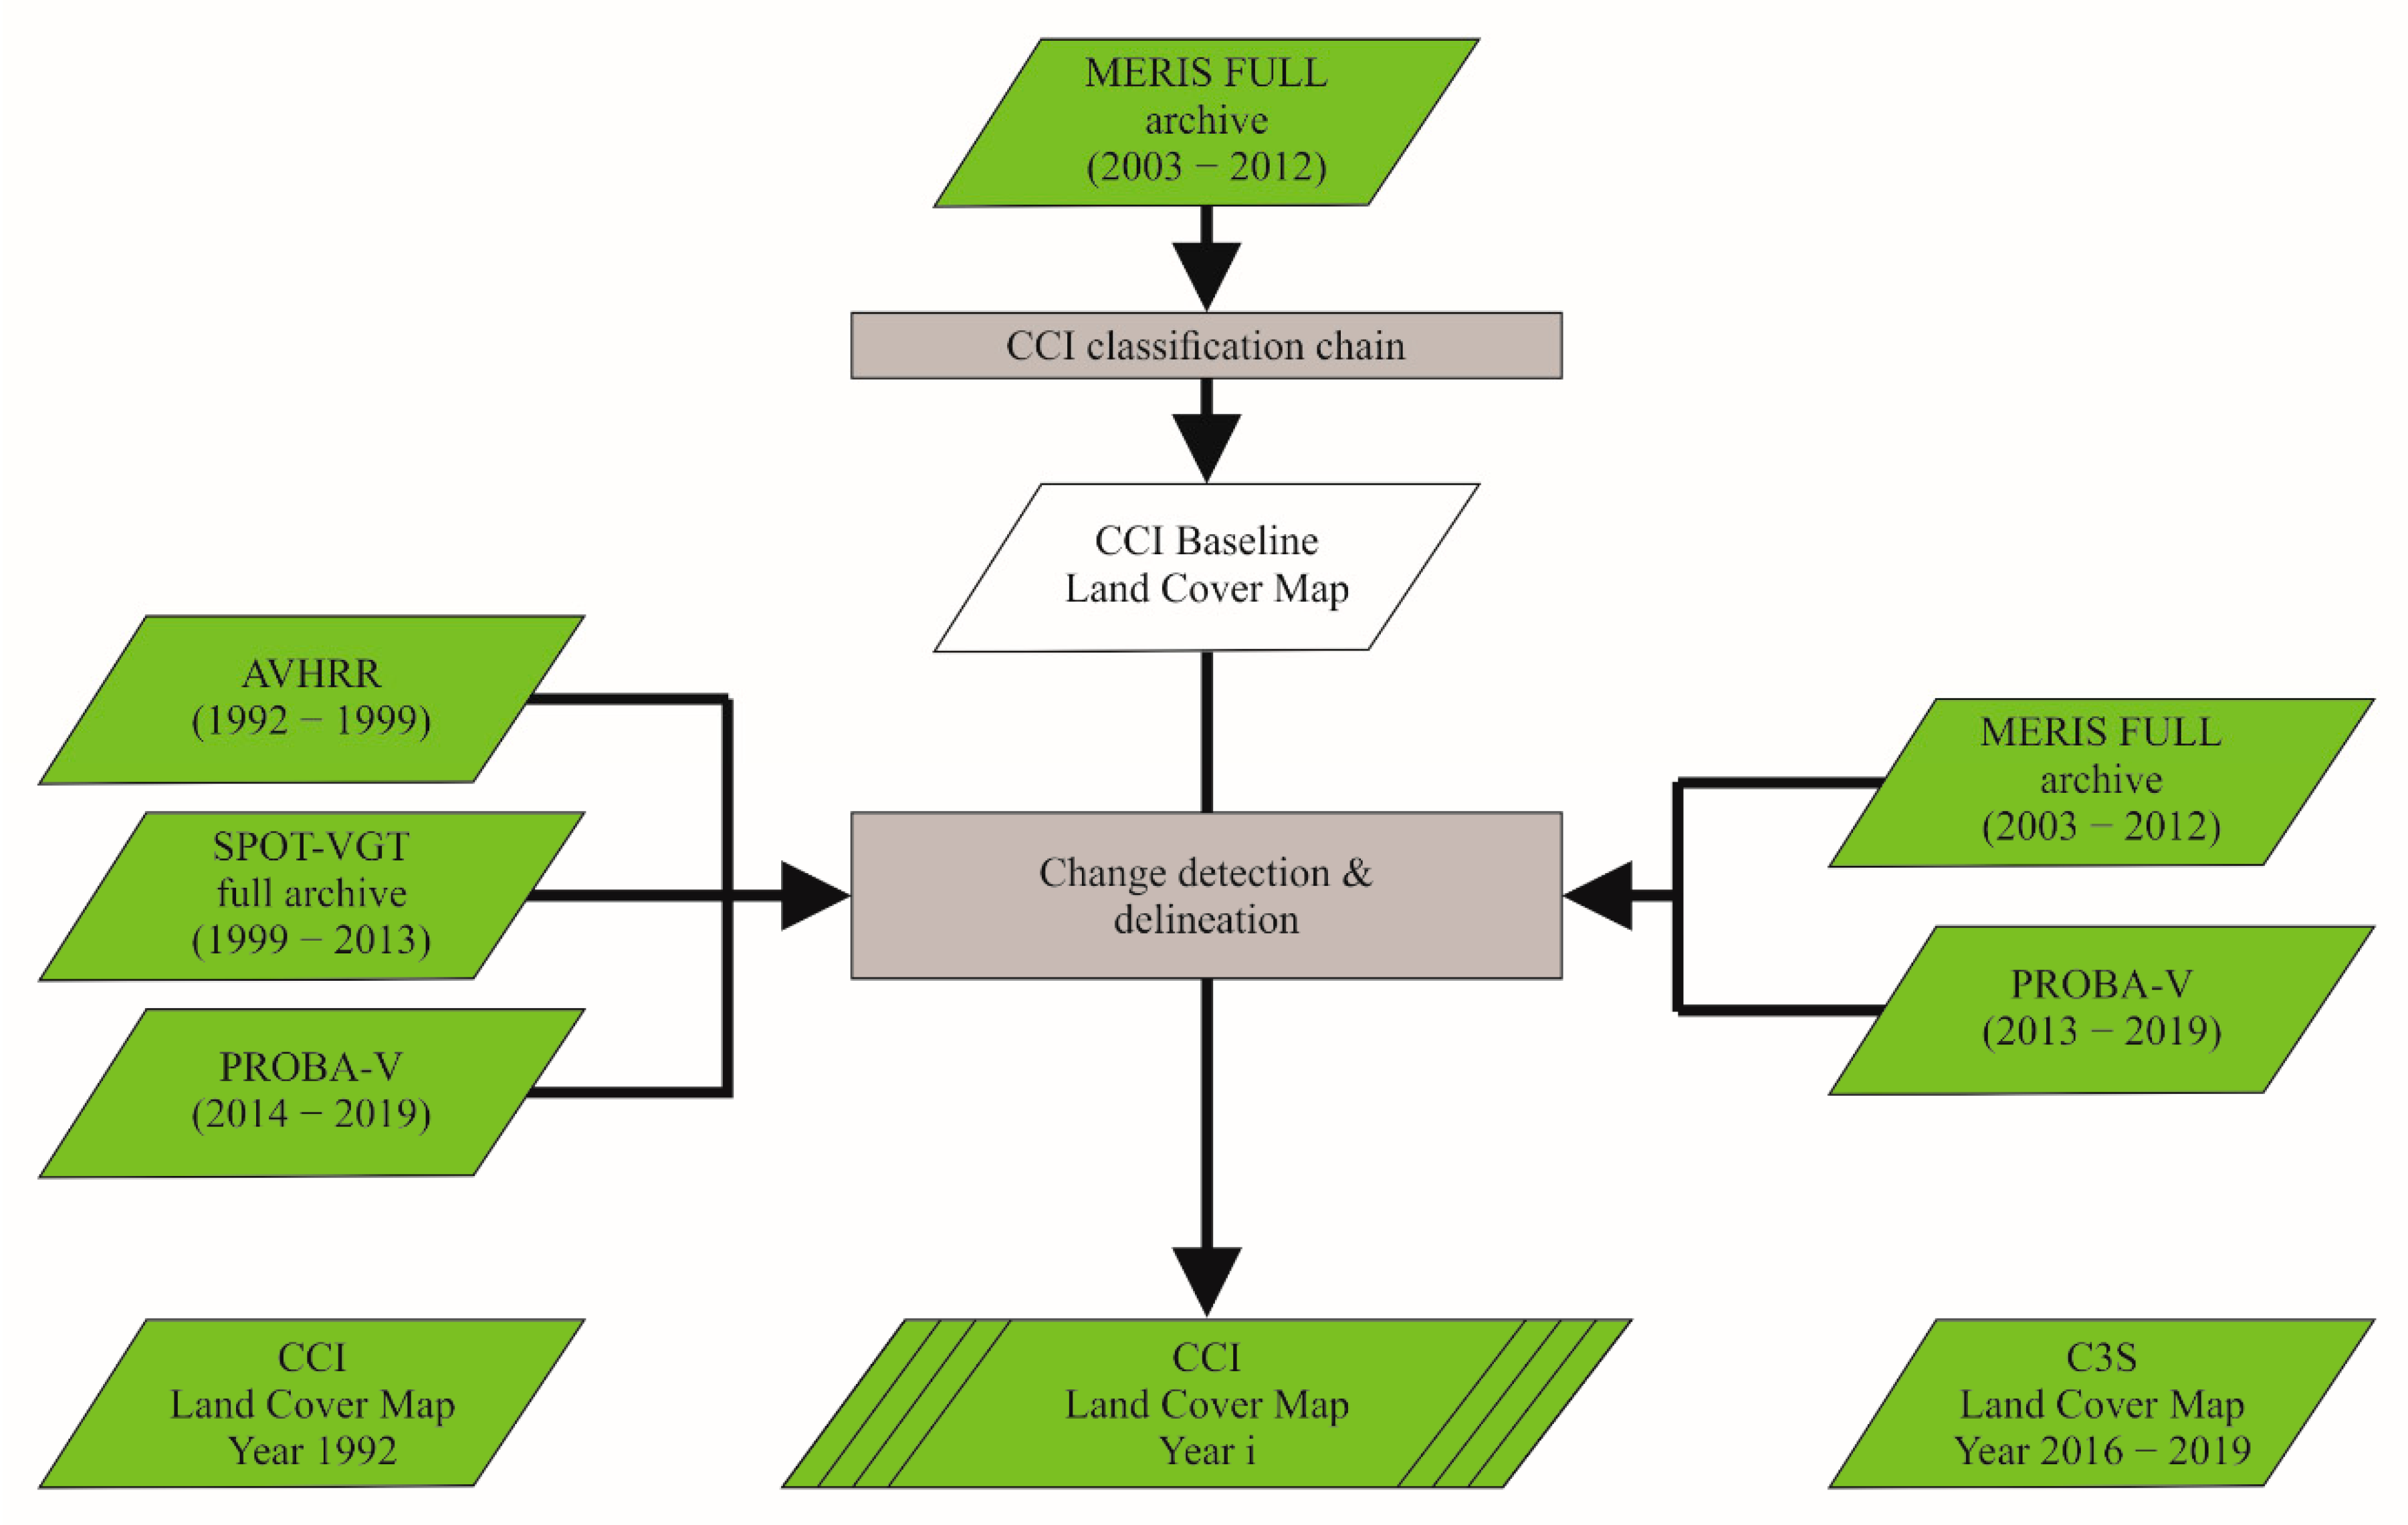
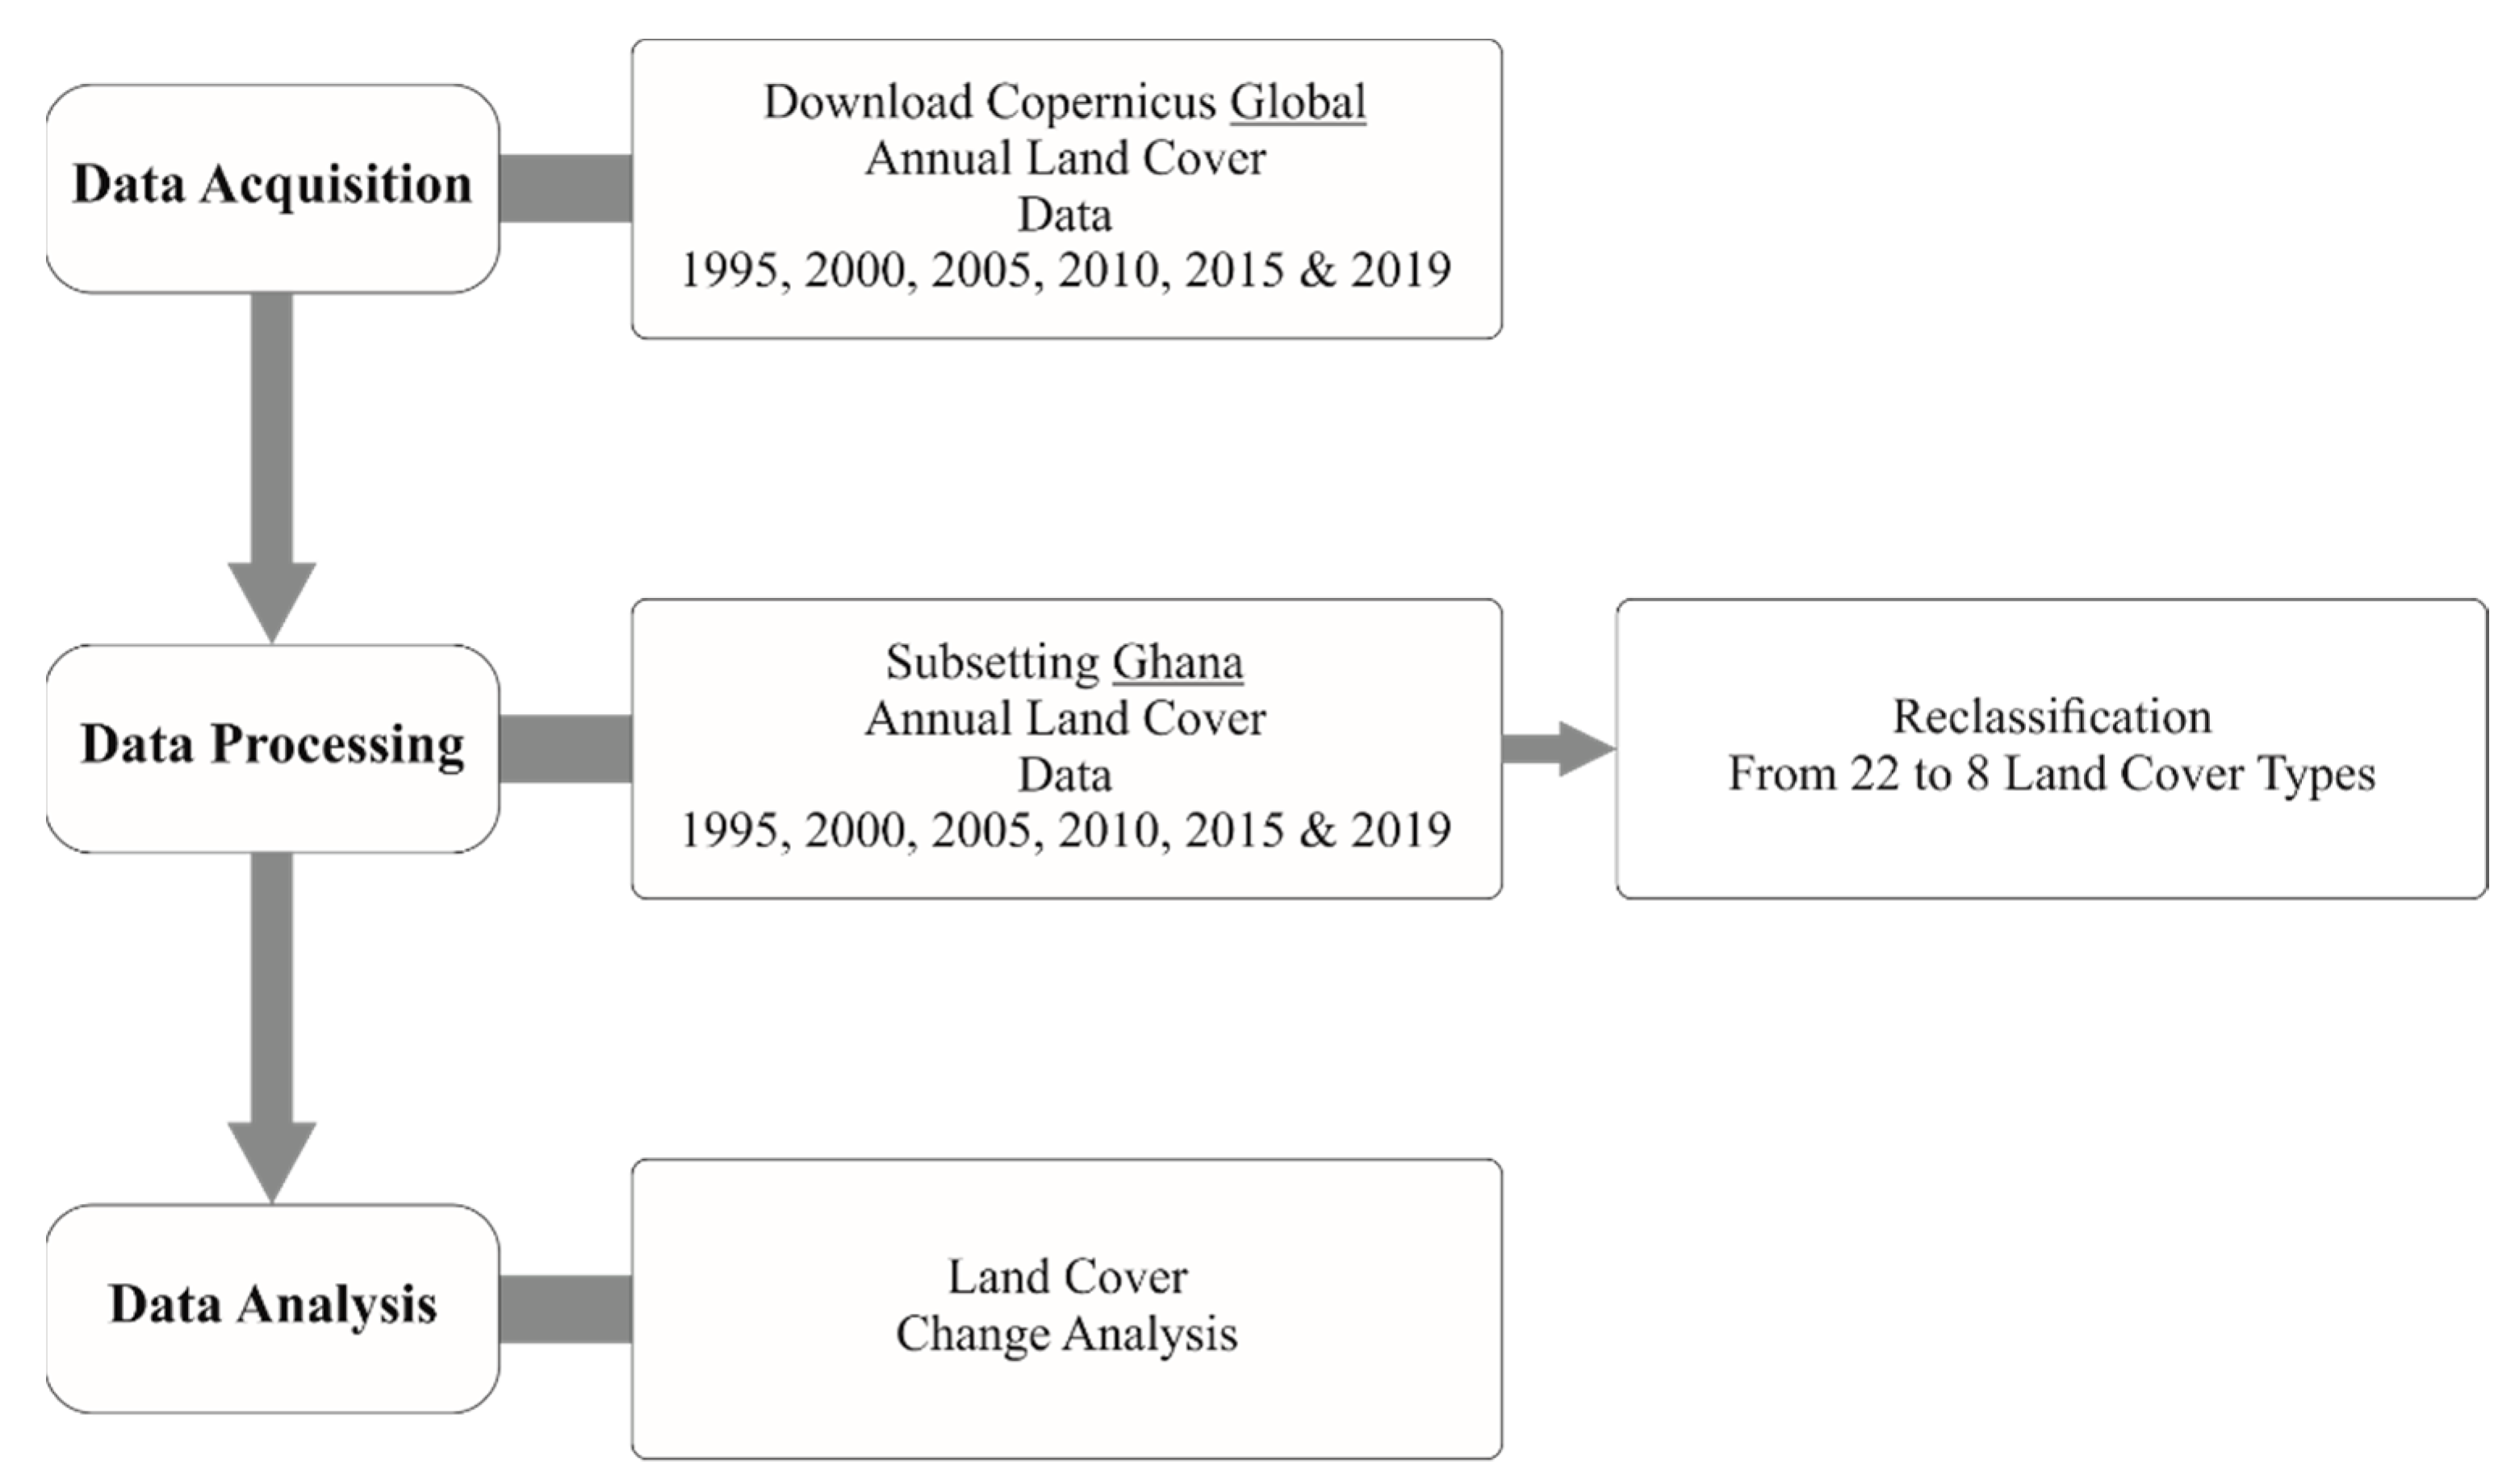
2.2. Data Used
2.3. Data Analysis
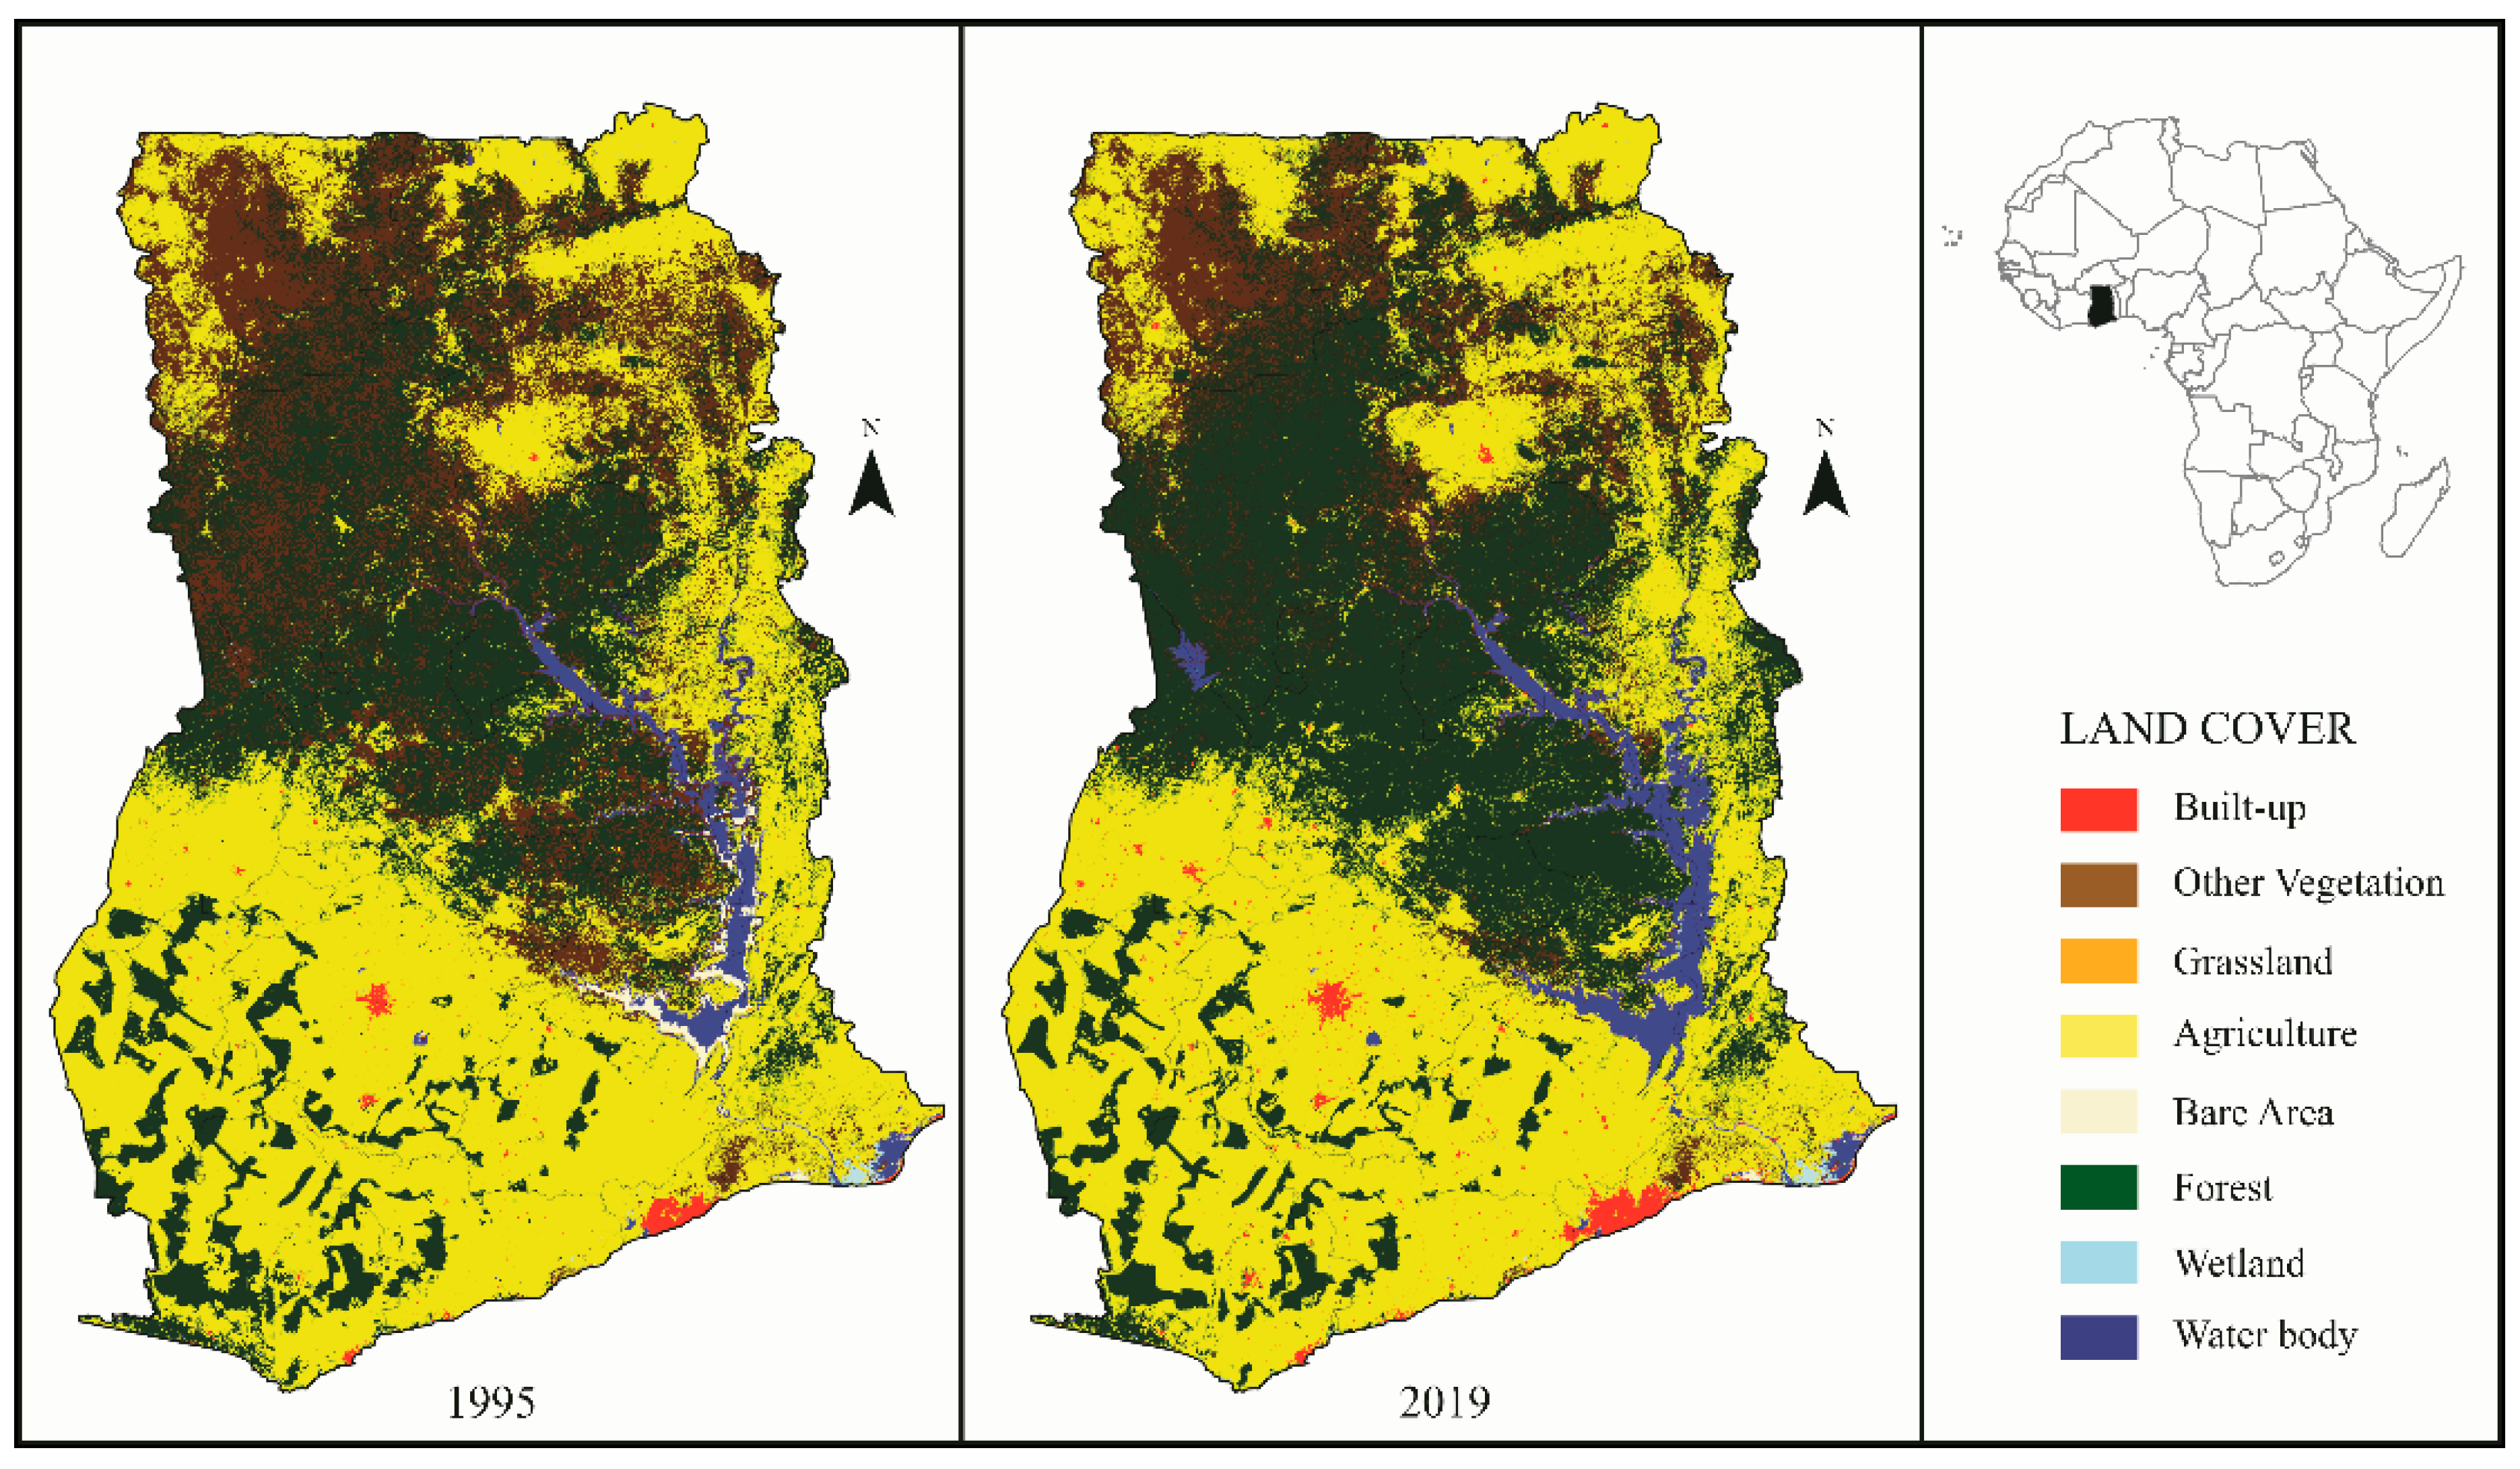
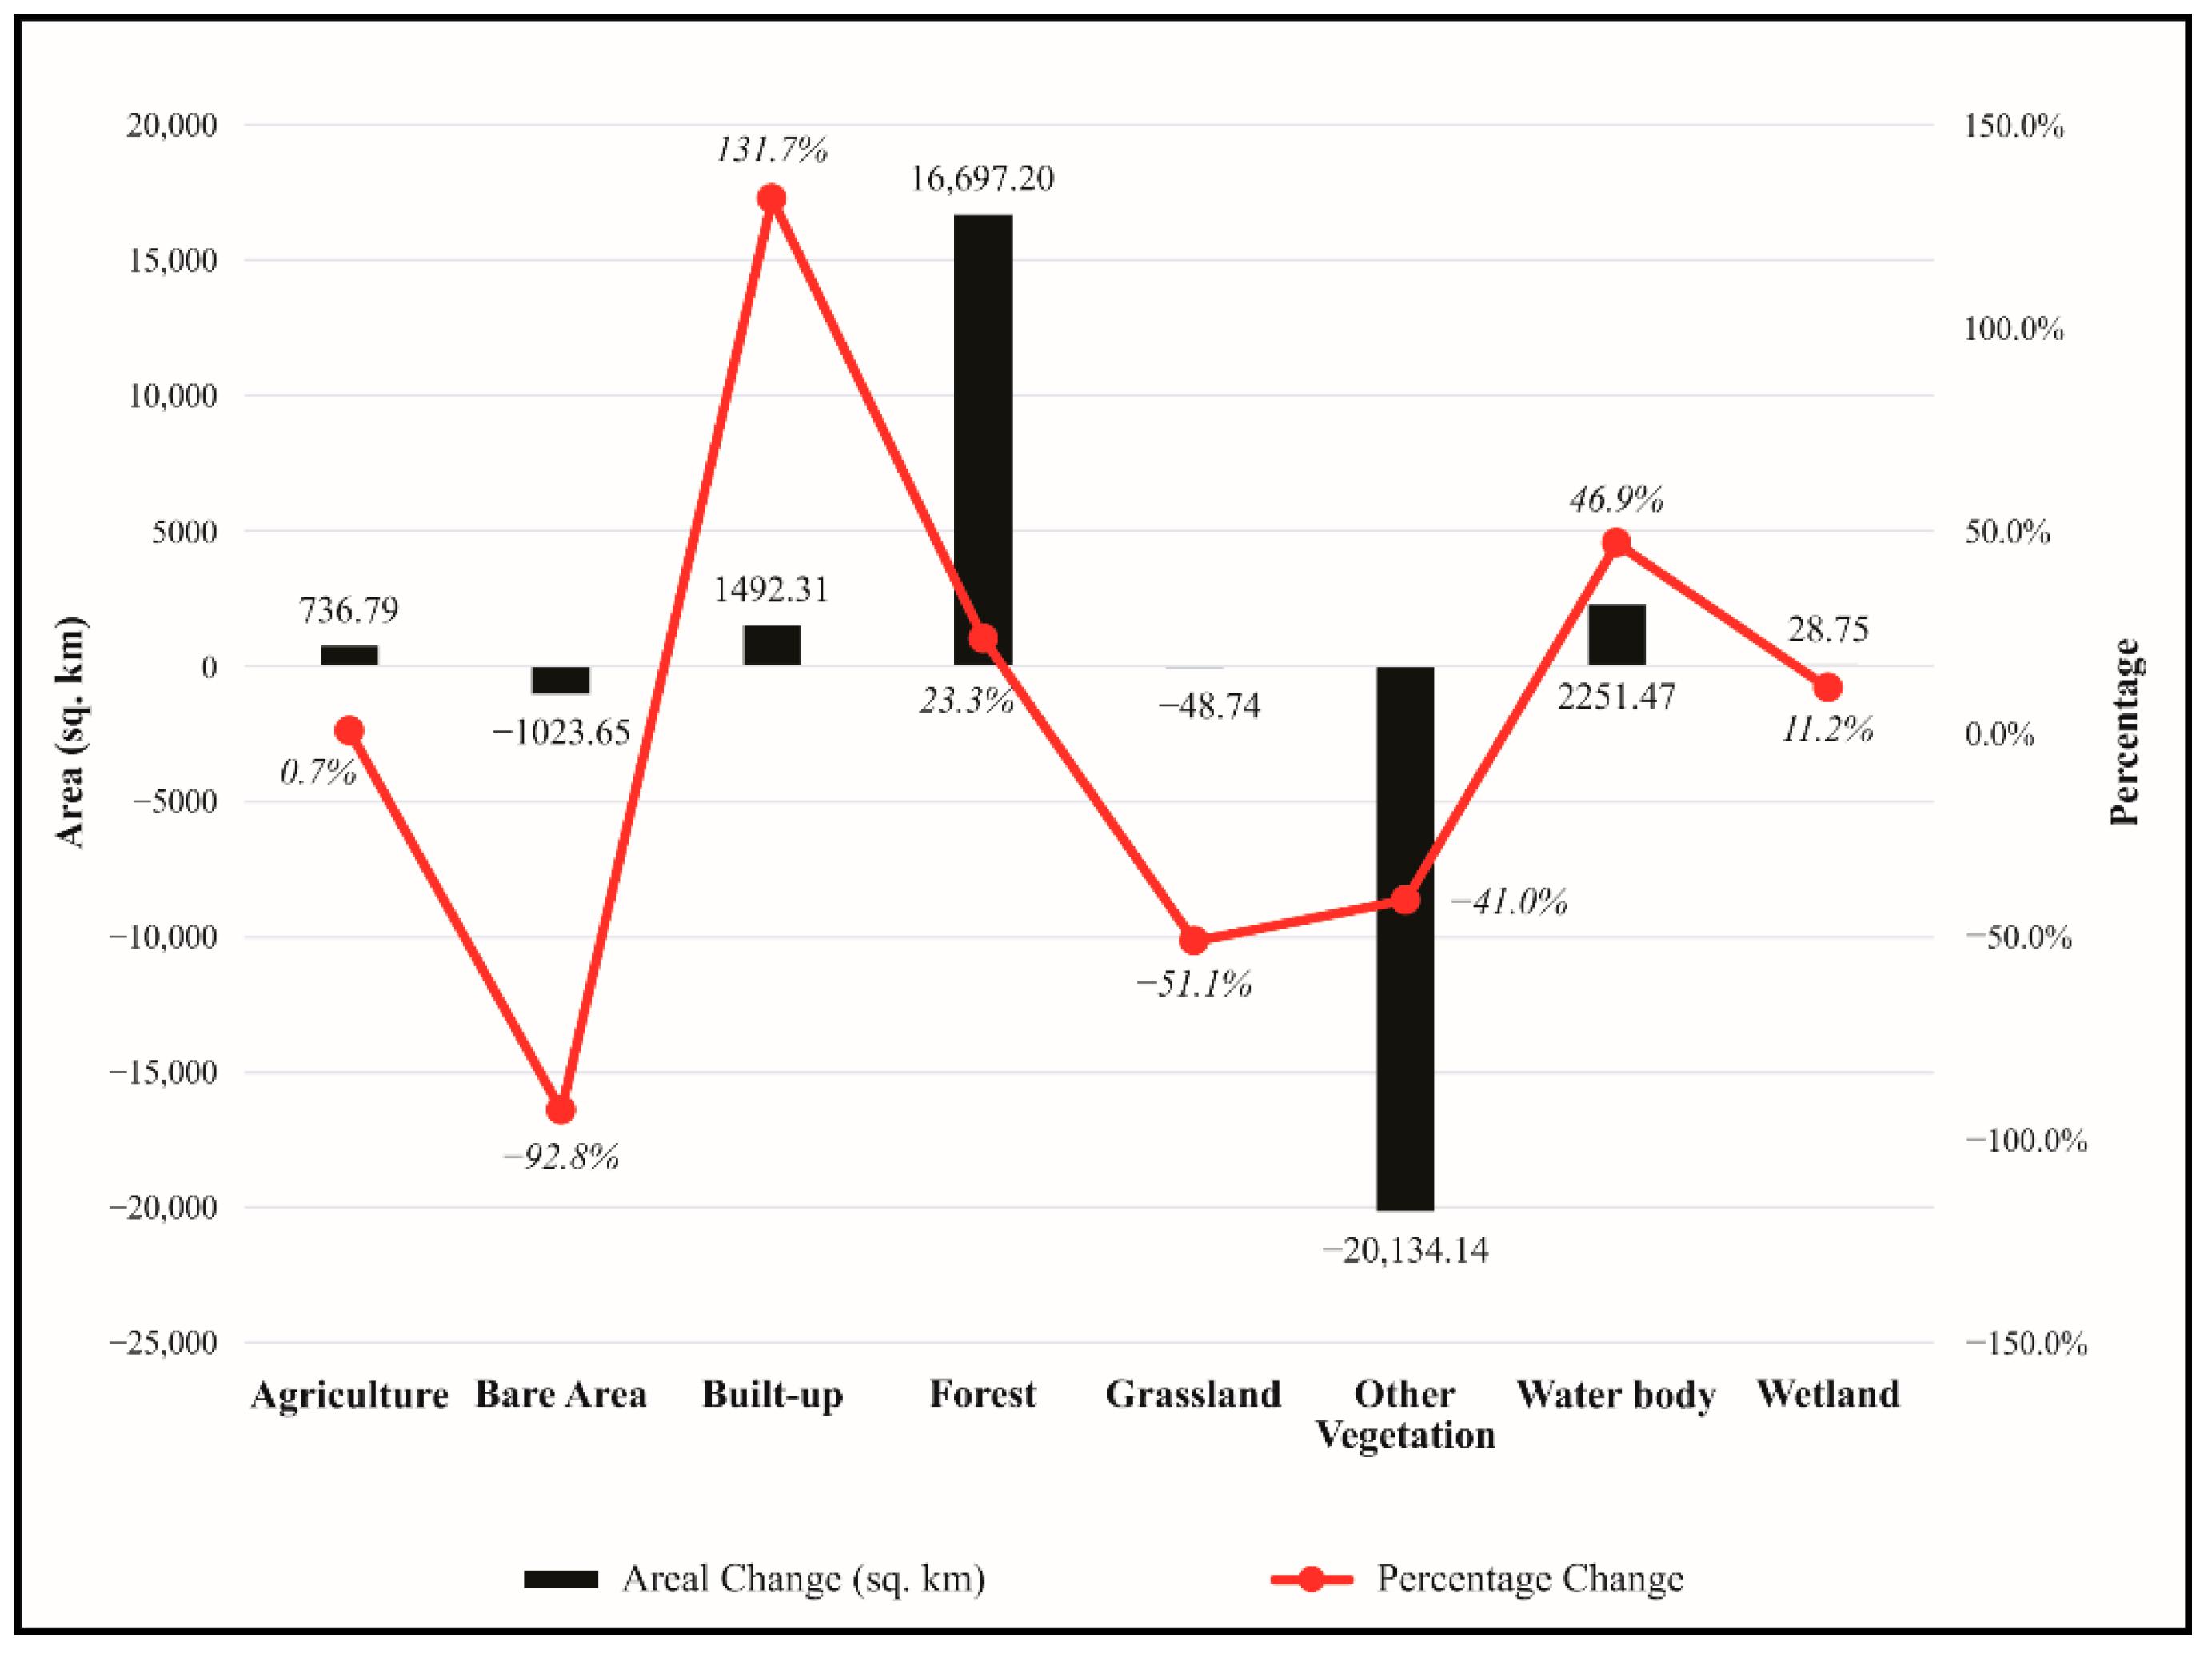
3. Results
4. Discussion
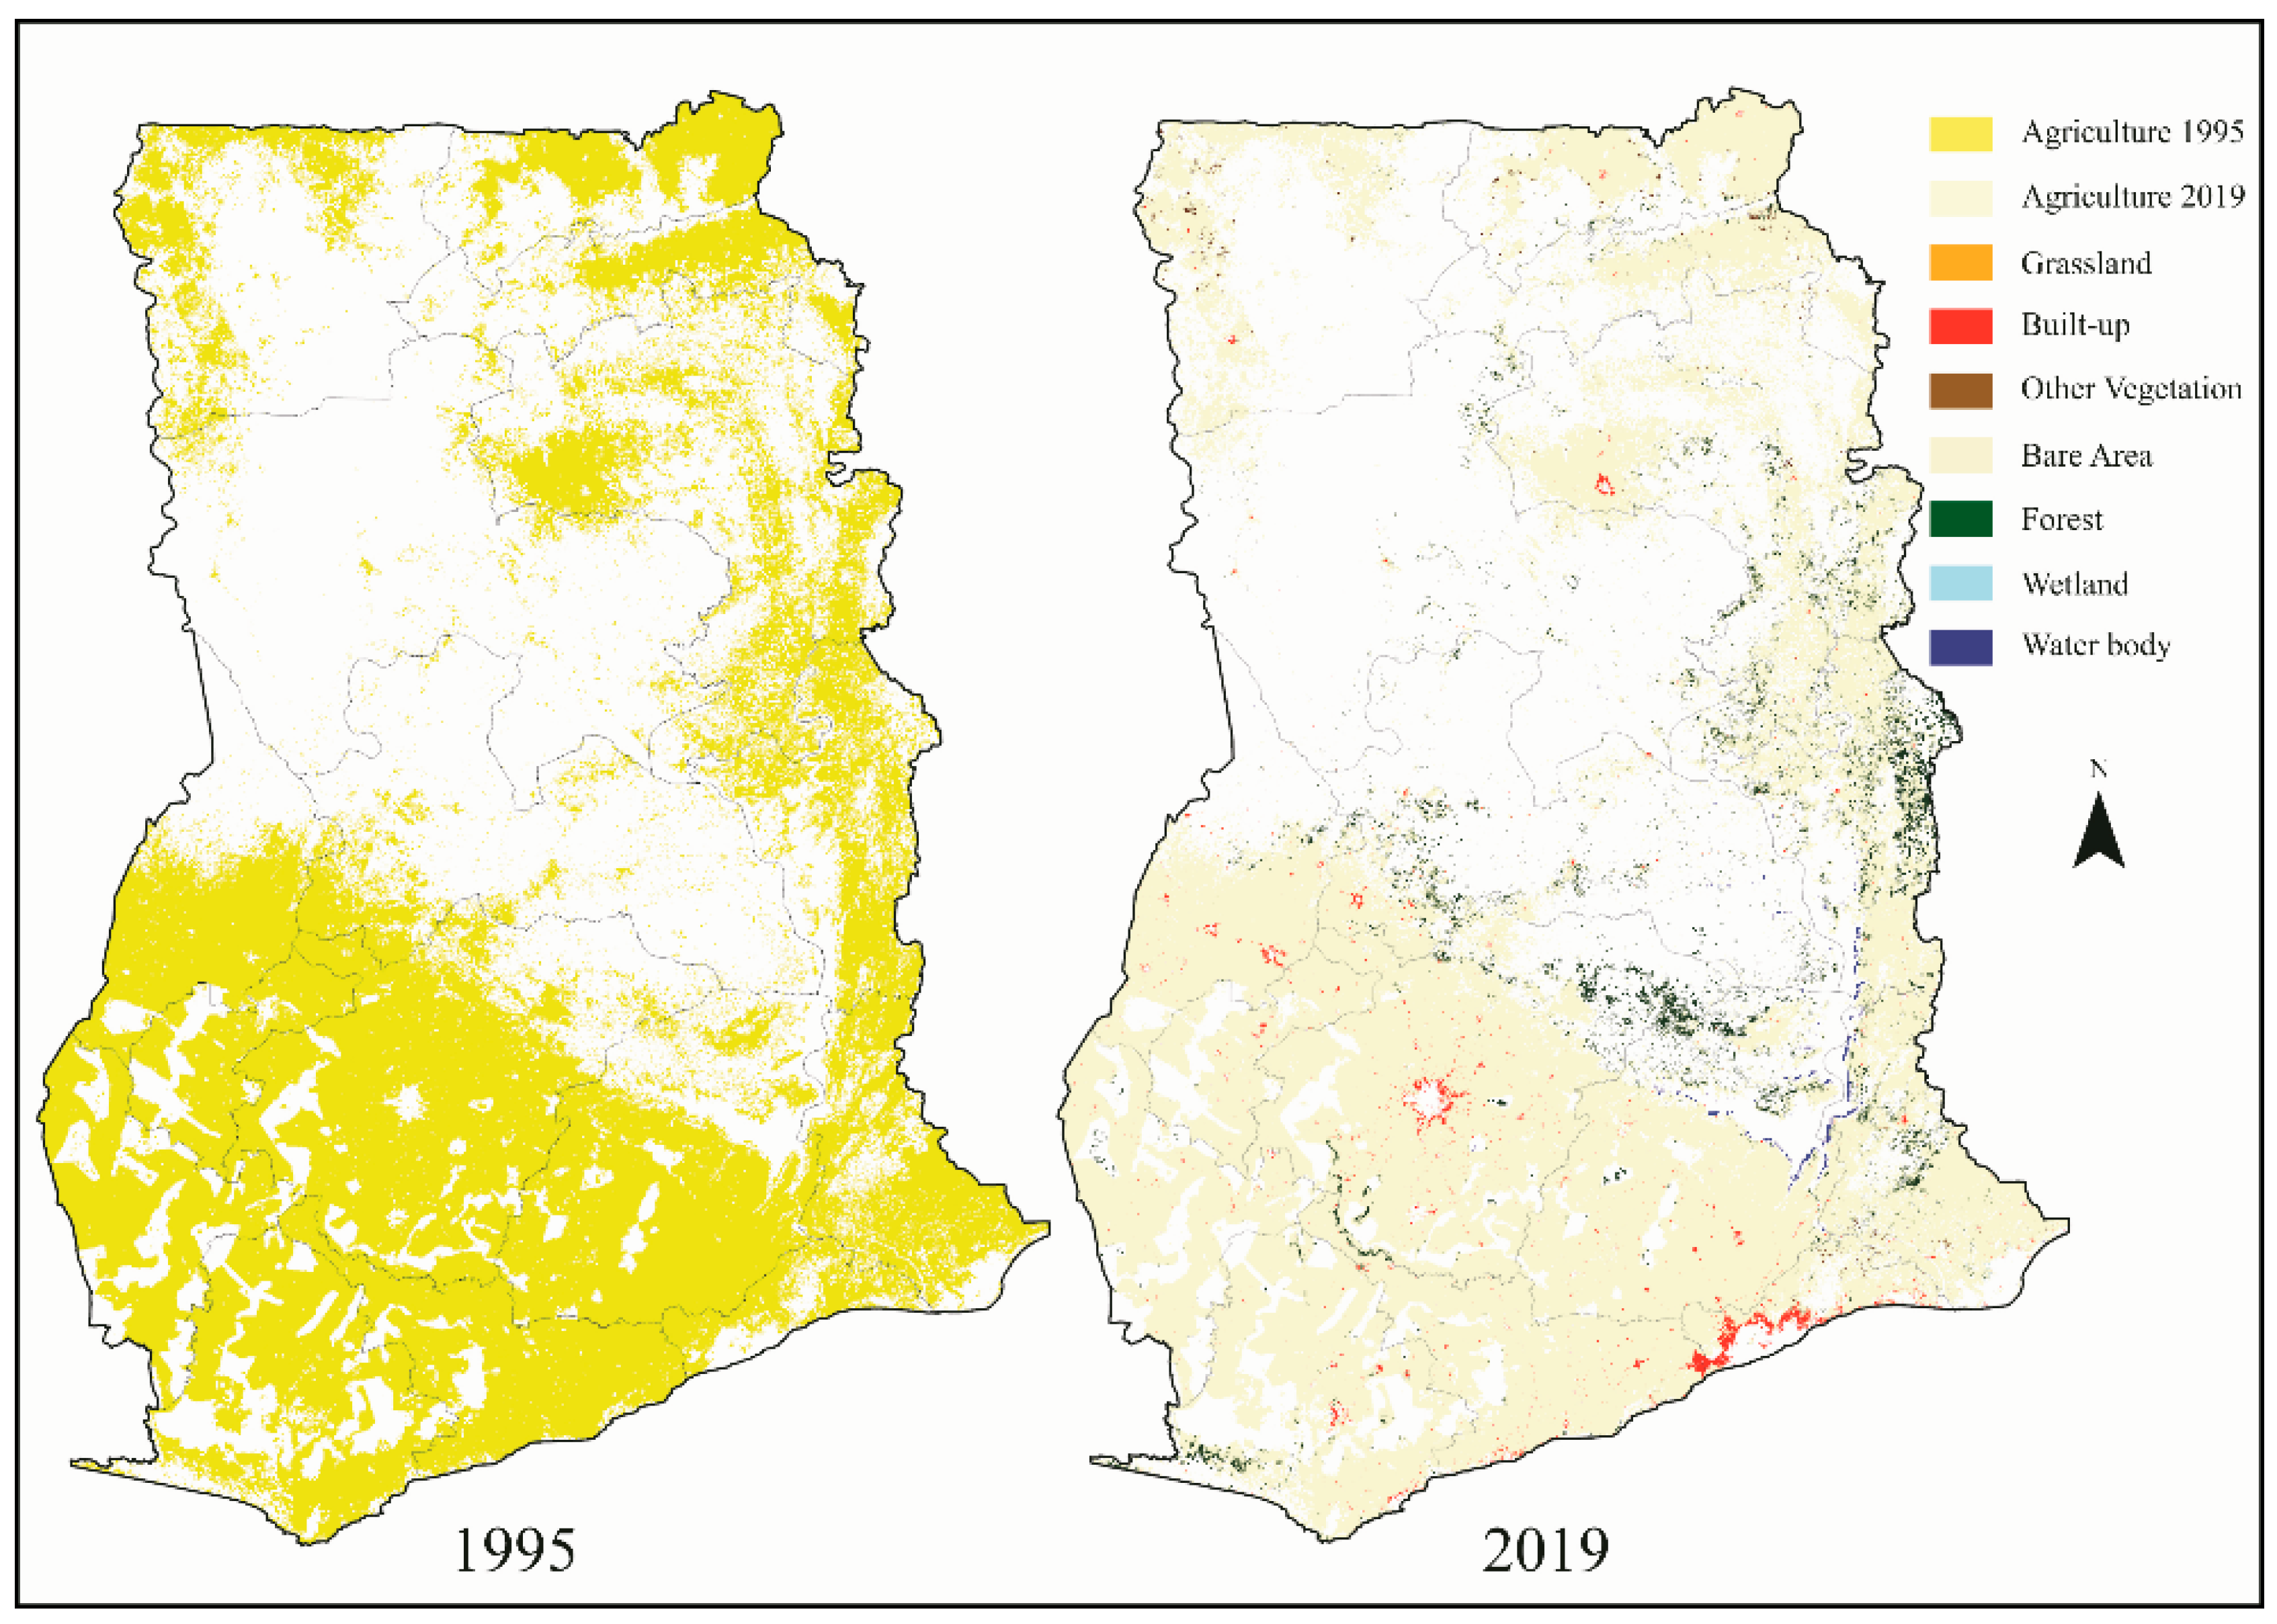
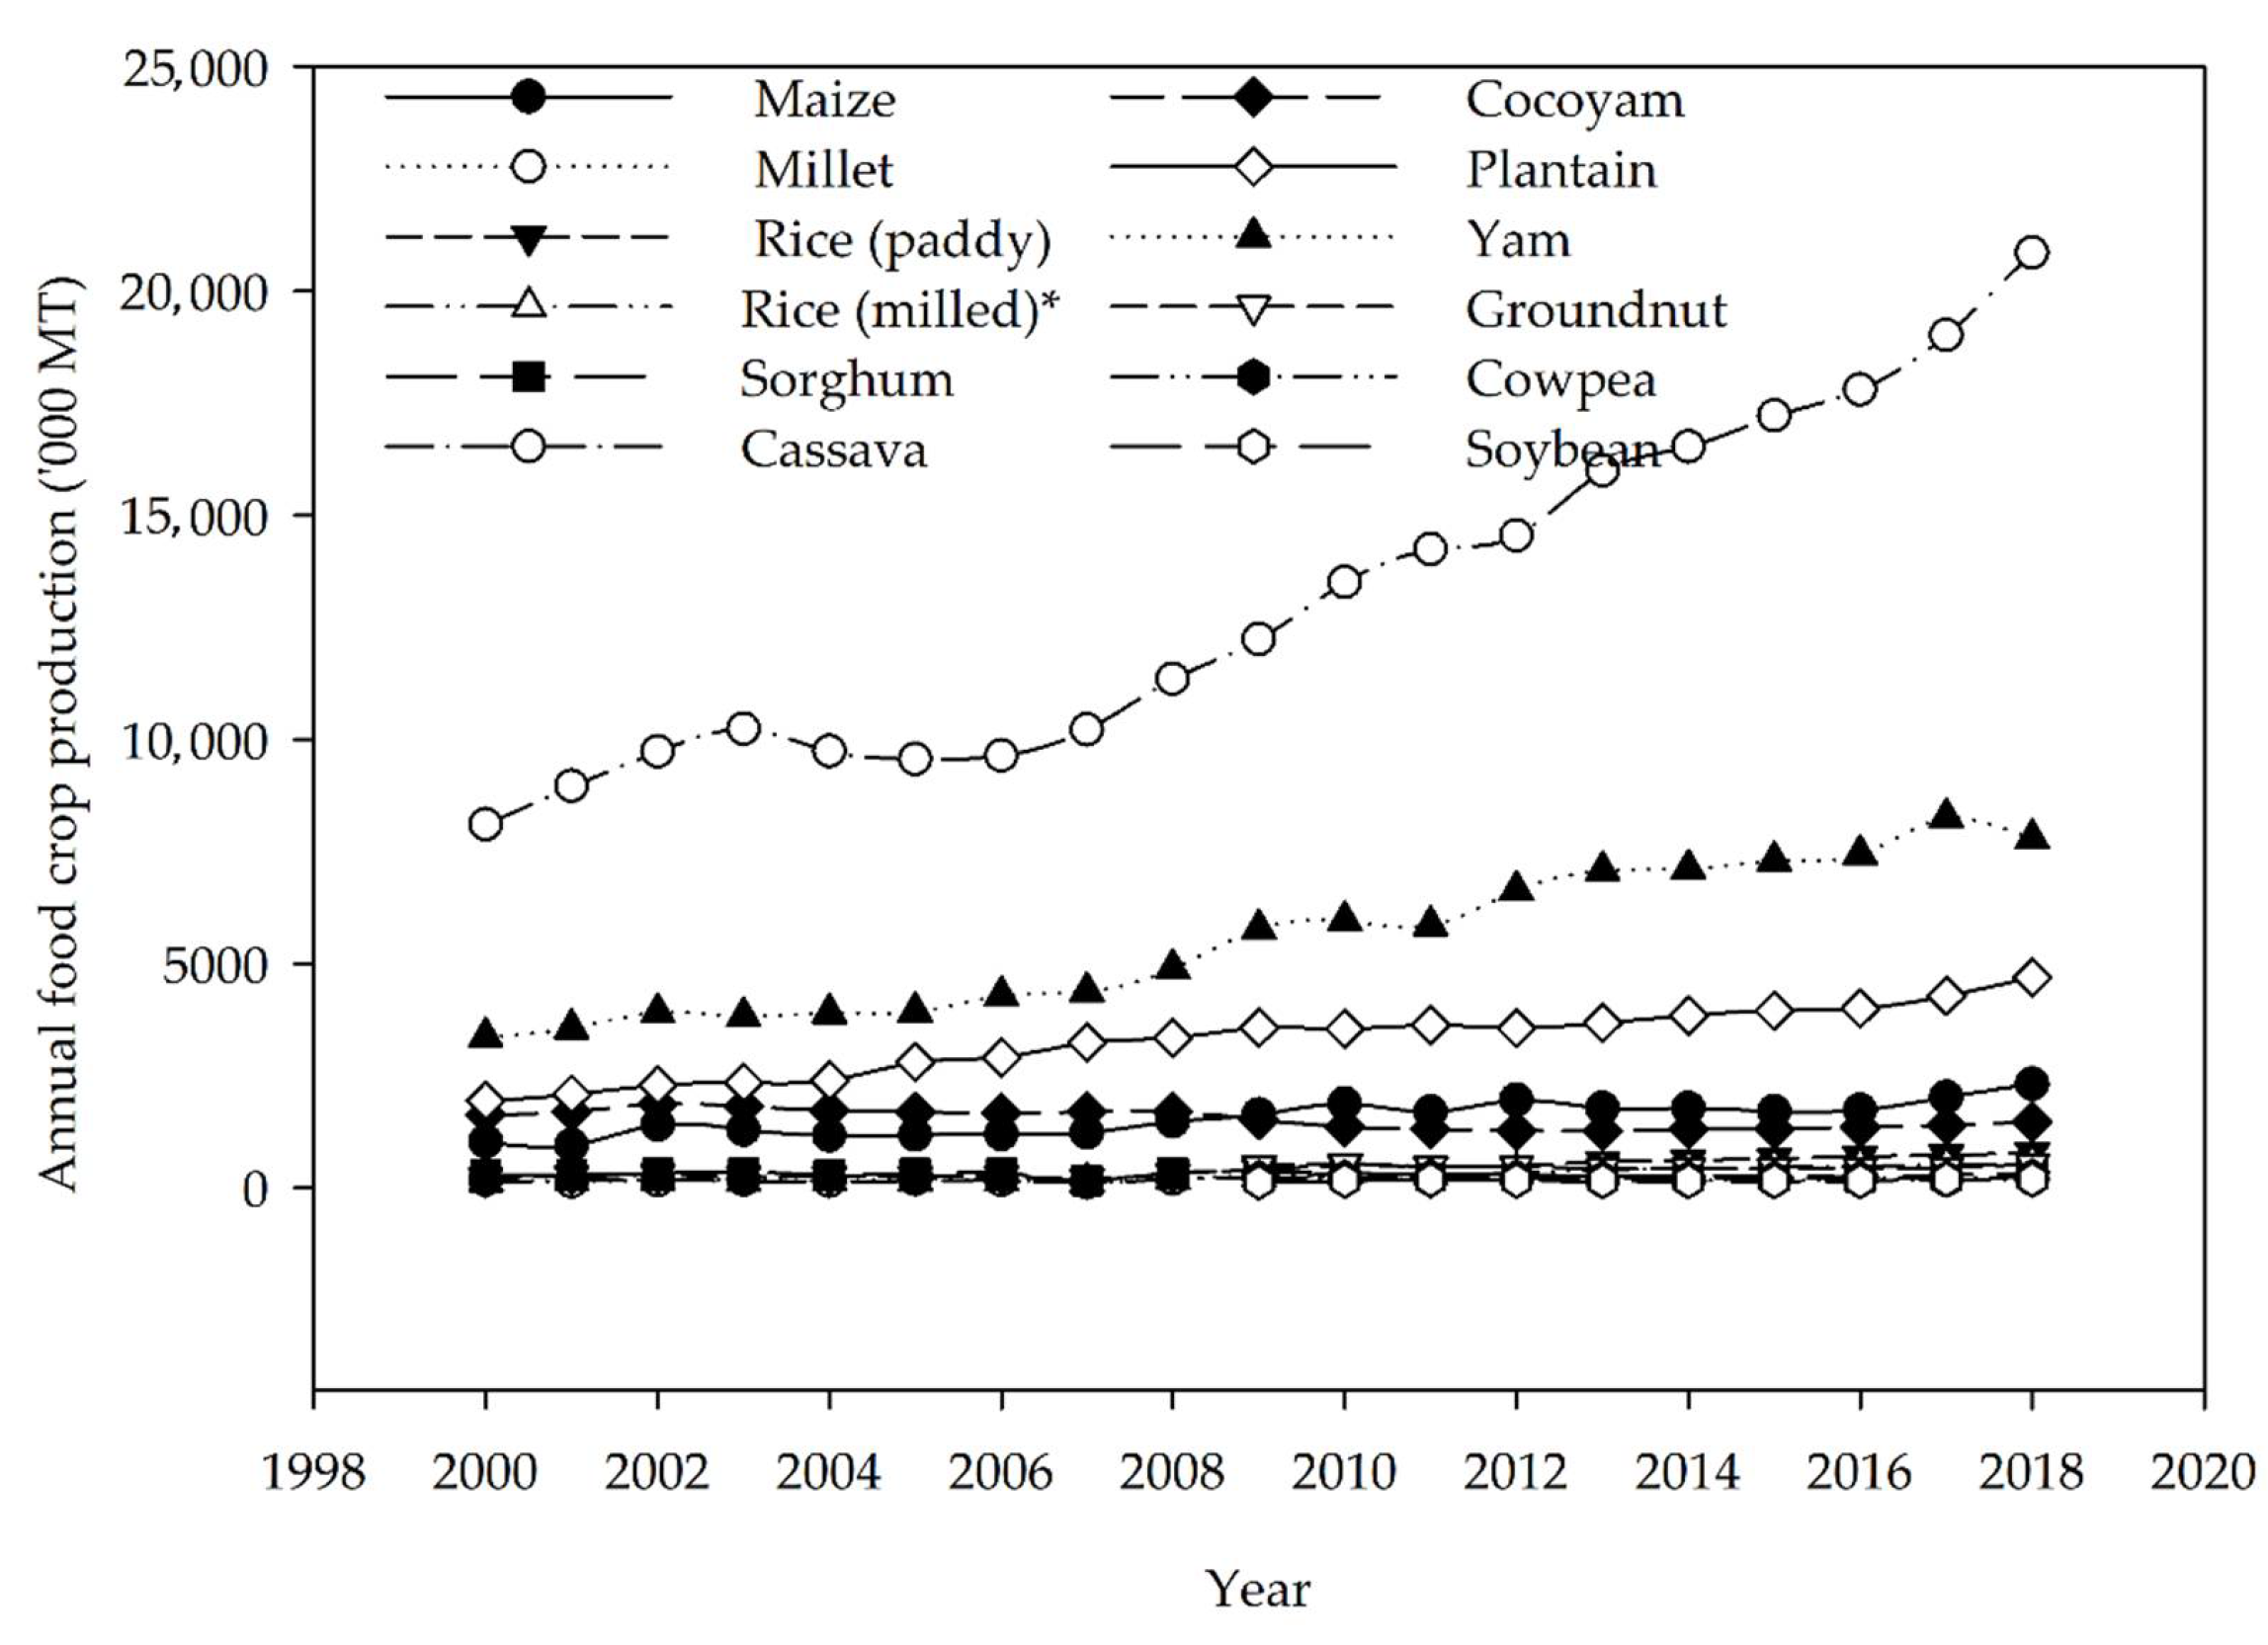
4.1. Changes in Agricultural Land Cover
4.2. Changes in Urban or the Built-Up Landcover
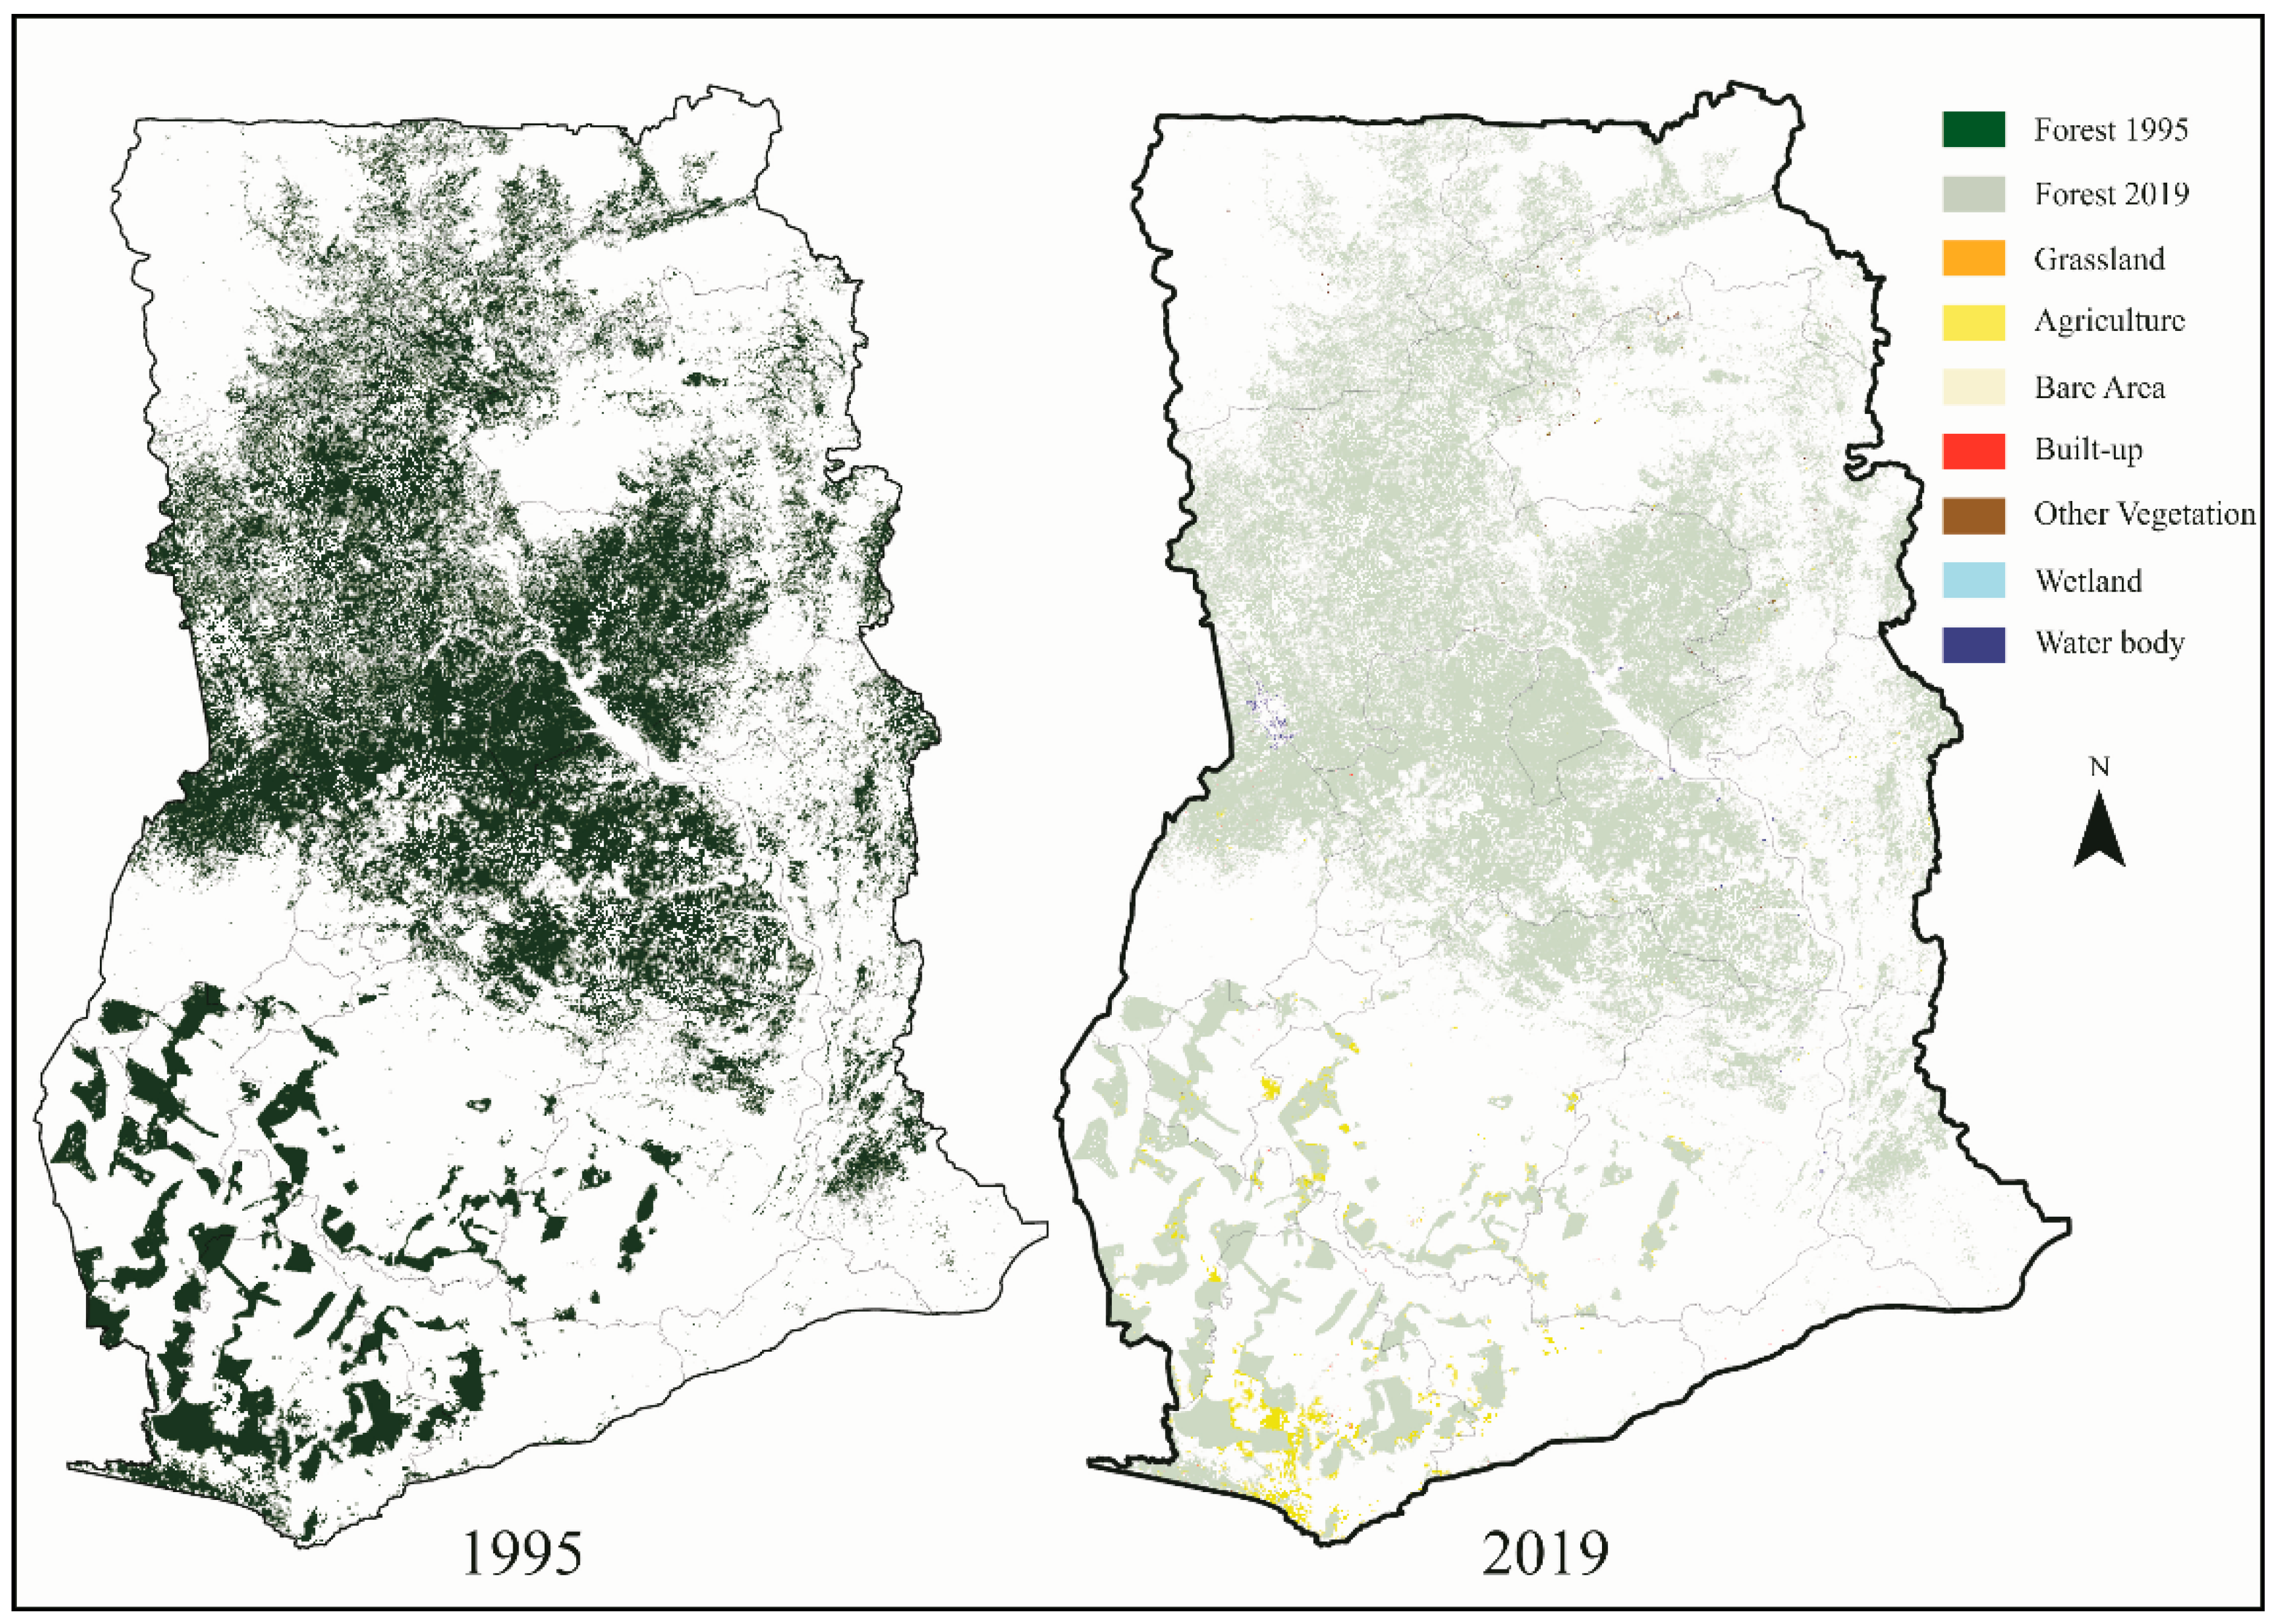
4.3. Changes in Forest Land Cover
4.4. Changes in Grassland Cover
4.5. Changes in Other Vegetation Cover
4.6. Changes in Bare Area
4.7. Changes in Waterbodies
4.8. Changes in Wetlands
5. Opportunities for Sustainable Land Use and Development
6. Conclusions
Author Contributions
Funding
Institutional Review Board Statement
Informed Consent Statement
Data Availability Statement
Acknowledgments
Conflicts of Interest
References
- Acheampong, M.; Yu, Q.; Enomah, L.D.; Anchang, J.; Eduful, M. Land use/cover change in Ghana’s oil city: Assessing the impact of neoliberal economic policies and implications for sustainable development goal number one–A remote sensing and GIS approach. Land Use Policy 2018, 73, 373–384. [Google Scholar] [CrossRef]
- Weeks, J.R. Population: An Introduction to Concepts and Issues, 12th ed.; Cengage Learning: Boston, MA, USA, 2015. [Google Scholar]
- Cohen, B. Urbanization in developing countries: Current trends, future projections, and key challenges for sustainability. Technol. Soc. 2006, 28, 63–80. [Google Scholar] [CrossRef]
- Addae, B.; Oppelt, N. Land-use/land-cover change analysis and urban growth modelling in the Greater Accra Metropolitan Area (GAMA), Ghana. Urban Sci. 2019, 3, 26. [Google Scholar] [CrossRef]
- Toure, S.I.; Stow, D.A.; Clarke, K.; Weeks, J. Patterns of land cover and land use change within the two major metropolitan areas of Ghana. Geocarto Int. 2020, 35, 209–223. [Google Scholar] [CrossRef]
- United Nations Population Division. World Population Prospects, The 2019 Revision-Volume I: Comprehensive Tables: United Nations. 2019. Available online: https://population.un.org/wpp/Publications/Files/WPP2019_Volume-I_Comprehensive-Tables.pdf (accessed on 30 January 2021).
- Braimoh, A.K.; Vlek, P.L.G. Land-cover dynamics in an urban area of Ghana. Earth Interact. 2003, 8, 1–15. [Google Scholar] [CrossRef]
- Ghana Statistics Service. 2010 Population & Housing Census: National Analytical Report; Ghana Statistics Service: Accra, Ghana, 2013. [Google Scholar]
- CILSS. Landscapes of West Africa-a Window on a Changing World; CILSS: Ouagadougou, Burkina Faso, 2016. [Google Scholar]
- McNeill, J.; Alves, D.; Arizpe, L.; Bykova, O.; Galvin, K.; Kelmelis, J.; Migot-Adholla, S.; Morrisette, P.; Moss, R.; Richards, J.; et al. Toward a typology and regionalization of land-cover and land-use change: Report of working group B. Chang. Land Use Land Cover Glob. Perspect. 1994, 4, 55–71. [Google Scholar]
- Obeng-Odoom, F. Political-economic origins of Sekondi-Takoradi, West Africa’s new oil city. Urbani Izziv. 2012, 23, 121–130. [Google Scholar] [CrossRef]
- Karg, H.; Hologa, R.; Schlesinger, J.; Drescher, A.; Kranjac-Berisavljevic, G.; Glaser, R. Classifying and mapping peri-urban areas of rapidly growing medium-sized Sub-Saharan African cities: A multi-method approach applied to Tamale, Ghana. Land 2019, 8, 40. [Google Scholar] [CrossRef]
- Cobbinah, P.B.; Erdiaw-Kwasie, M.O.; Amoateng, P. Rethinking sustainable development within the framework of poverty and urbanisation in developing countries. Environ. Dev. 2015, 13, 18–32. [Google Scholar] [CrossRef]
- Obeng-Odoom, F. Resource curse or blessing in Africa’s oil cities? Empirical evidence from Sekondi-Takoradi, West Africa. City Cult. Soc. 2013, 4, 229–240. [Google Scholar] [CrossRef]
- Basommi, P.L.; Guan, Q.; Cheng, D. Exploring land use and land cover change in the mining areas of Wa East District, Ghana using satellite imagery. Open Geosci. 2015, 1, 618–626. [Google Scholar] [CrossRef]
- Cohen, W.B.; Goward, S.N. Landsat’s role in ecological applications of remote sensing. Bioscience 2004, 54, 535–545. [Google Scholar] [CrossRef]
- Yuan, F.; Sawaya, K.E.; Loeffelholz, B.C.; Bauer, M.E. Land cover classification and change analysis of the Twin Cities (Minnesota) Metropolitan Area by multitemporal Landsat remote sensing. Remote Sens. Environ. 2005, 98, 317–328. [Google Scholar] [CrossRef]
- Koranteng, A.; Zawila-Niedzwiecki, T. Modelling forest loss and other land use change dynamics in Ashanti Region of Ghana. Folia For. Pol. 2015, 57, 96–111. [Google Scholar] [CrossRef]
- Braimoh, A.K.; Vlek, P.L.G. Land-cover change trajectories in Northern Ghana. Environ. Manag. 2005, 36, 356–373. [Google Scholar] [CrossRef]
- Coulter, L.L.; Stow, D.A.; Tsai, Y.-H.; Ibanez, N.; Shih, H.-C.; Kerr, A.; Benza, M.; Weeks, J.R.; Mensah, F. Classification and assessment of land cover and land use change in southern Ghana using dense stacks of Landsat 7 ETM+ imagery. Remote Sens. Environ. 2016, 184, 396–409. [Google Scholar] [CrossRef]
- Stow, D.A.; Weeks, J.R.; Shih, H.-C.; Coulter, L.L.; Johnson, H.; Tsai, Y.-H.; Kerr, A.; Benza, M.; Mensah, F. Inter-regional pattern of urbanization in southern Ghana in the first decade of the new millennium. Appl. Geogr. 2016, 71, 32–43. [Google Scholar] [CrossRef]
- Alo, C.A.; Pontius, R.G., Jr. Identifying systematic land-cover transitions using remote sensing and GIS: The fate of forests inside and outside protected areas of Southwestern Ghana. Environ. Plan. B Plan. Des. 2008, 35, 280–295. [Google Scholar] [CrossRef]
- Dadson, I.Y. Land Use and Land Cover Change Analysis along the Coastal Regions of Cape Coast and Sekondi. Ghana J. Geogr. 2016, 8, 108–126. [Google Scholar]
- Weeks, J.R.; Stow, D.A.; An, L. Demographics, health drivers & impacts on land cover and land use change in Ghana. In Reference Module in Earth Systems and Environmental Sciences; Elsevier: Amsterdam, The Netherlands, 2017; Volume 9. [Google Scholar]
- Schueler, V.; Kuemmerle, T.; Schröder, H. Impacts of surface gold mining on land use systems in western Ghana. Ambio. 2011, 40, 528–539. [Google Scholar] [CrossRef]
- Appiah, D.O.; Bugri, J.T.; Forkuo, E.K.; Boateng, P.K. Determinants of Peri-Urbanization and Land Use Change Patterns in Peri-Urban Ghana. J. Sustain. Dev. 2014, 7, 95. [Google Scholar] [CrossRef]
- Appiah, D.O.; Forkuo, E.K.; Bugri, J.T. Land use conversion probabilities in a peri-urban district of Ghana. Chin. J. Urban Environ. Stud. 2015, 3, 1550026. [Google Scholar] [CrossRef]
- Appiah, D.O.; Forkuo, E.K.; Bugri, J.T.; Apreku, T.O. Geospatial analysis of land use and land cover transitions from 1986–2014 in a peri-urban Ghana. Geoscience 2017, 7, 125. [Google Scholar] [CrossRef]
- Aduah, M.S.; Baffoe, P.E. Remote sensing for mapping land-use/cover changes and urban sprawl in Sekon-di-Takoradi, Western Region of Ghana. Int. J. Eng. Sci. 2013, 2, 66–72. [Google Scholar]
- Attua, E.M.; Fisher, J.B. Historical and future land-cover change in a municipality of Ghana. Earth Interact. 2011, 15, 1–26. [Google Scholar] [CrossRef]
- Bessah, E.; Bala, A.; Agodzo, S.K.; Okhimamhe, A.A.; Boakye, E.A.; Ibrahim, S.U. The impact of crop farmers’ deci-sions on future land use, land cover changes in Kintampo North Municipality of Ghana. Int. J. Clim. Chang. Strateg. Manag. 2019, 11, 72–87. [Google Scholar] [CrossRef]
- Kleemann, J.; Inkoom, J.N.; Thiel, M.; Shankar, S.; Lautenbach, S.; Fürst, C. Peri-urban land use pattern and its relation to land use planning in Ghana, West Africa. Landsc. Urban Plan. 2017, 165, 280–294. [Google Scholar] [CrossRef]
- Adjei, P.O.-W.; Buor, D.; Addrah, P. Geo-spatial analysis of land use and land cover changes in the Lake Bosomtwe Basin of Ghana. Ghana J. Geogr. 2014, 6, 1–23. [Google Scholar]
- Awotwi, A.; Kumi, M.; Jansson, P.E.; Yeboah, F.; Nti, I.K. Predicting hydrological responses to climate change in the Whilte Volta catchment, West Africa. J. Earth Sci. Clim. Chang. 2015, 6, 249. [Google Scholar]
- Amproche, A.A.; Antwi, M.; Kabo-Bah, A.T. Geospatial Assessment of Land Use and Land Cover Patterns in the Black Volta Basin. J. Remote Sens. GIS 2020, 9, 269. [Google Scholar]
- Awotwi, A.; Anornu, G.K.; Quaye-Ballard, J.A.; Annor, T. Monitoring land use and land cover changes due to extensive gold mining, urban expansion, and agriculture in the Pra River Basin of Ghana, 1986–2025. Land Degrad. Dev. 2018, 29, 3331–3343. [Google Scholar] [CrossRef]
- Boakye, E.; Anornu, G.K.; Quaye-Ballard, J.A.; Donkor, E.A. Land use change and sediment yield studies in Ghana. J. Geogr. Reg. Plan. 2018, 11, 122–133. [Google Scholar]
- ESA. Land Cover CCI Product User Guide Version 2.0; ESA: Libin, Belgium, 2020. [Google Scholar]
- Bicheron, P.; Defourny, P.; Brockmann, C.; Schouten, L.; Vancutsem, C.; Huc, M.; Bontemps, S.; Leroy, M.; Achard, F.; Herold, M.; et al. GlobCover: Products Description and Validation Report, ESA GlobCover Project. Issue 2.0. 2008. Available online: http://due.esrin.esa.int/page_globcover.php (accessed on 14 December 2020).
- Bontemps, S.; Herold, M.; Kooistra, L.; van Groenestijn, A.; Hartley, A.; Arino, O.; Moreau, I.; Defourny, P. Revisiting land cover observations to address the needs of the climate modelling community. Biogeosciences 2012, 9, 2145–2157. [Google Scholar] [CrossRef]
- MoFA. Agriculture in Ghana: Facts and Figures; Statistics RaIDS, Editor: Accra, Ghana, 2011. [Google Scholar]
- MoFA. Agriculture in Ghana: Facts and Figures; Statistics RaIDS, Editor: Accra, Ghana, 2019. [Google Scholar]
- R Core Team. R: A Language and Environment for Statistical Computing; R Foundation for Statistical Computing: Vienna, Austria, 2013. [Google Scholar]
- ESRI. ArcGIS Pro 2.7.1.; Environmental Systems Research Institute Inc.: Redlands, CA, USA, 2021. [Google Scholar]
- Microsoft. Microsoft 365 MSO; Microsoft Corporation: Redmond, WA, USA, 2021. [Google Scholar]
- McGregor, D.F.M.; Adam-Bradford, A.; Thompson, D.A.; Simon, D. Resource management and agriculture in the periurban interface of Kumasi, Ghana: Problems and prospects. Singap. J. Trop. Geogr. 2011, 32, 382–398. [Google Scholar] [CrossRef]
- Owusu-Ansah, F.; Smardon, R.C. Mining and agriculture in Ghana: A contested terrain. Int. J. Environ. Sustain. Dev. 2015, 14, 371–397. [Google Scholar] [CrossRef]
- Kasanga, M.; Andersen, P.; Atuoye, K.; Mason-Renton, S. Contested commons: Agricultural modernization, tenure ambiguities and intra-familial land grabbing in Ghana. Land Use Policy 2018, 75, 215–224. [Google Scholar] [CrossRef]
- Camagni, R.; Gibelli, M.C.; Rigamonti, P. Urban mobility and urban form: The social and environmental costs of different patterns of urban expansion. Ecol. Econ. 2002, 40, 199–216. [Google Scholar] [CrossRef]
- Fuseini, I.; Kemp, J. Characterising urban growth in Tamale, Ghana: An analysis of urban governance response in infrastructure and service provision. Habitat Int. 2016, 56, 109–123. [Google Scholar] [CrossRef]
- Naab, F.Z.; Dinye, R.D.; Kasanga, R.K. Urbanisation and its impact on agricultural lands in growing cities in developing countries: A case study of Tamale in Ghana. Mod. Soc. Sci. J. 2013, 2, 256–287. [Google Scholar]
- Kuusaana, E.D.; Eledi, J.A. (Eds.) As the city grows, where do the farmers go? Understanding Peri-urbanization and food systems in Ghana-Evidence from the Tamale Metropolis. Urban Forum 2015, 26, 443–465. [Google Scholar] [CrossRef]
- Ampim, P.A.; Adiku, S.G.K.; Sloan, J.J. Green roofs: A possible best management practice for enhancing the environmental quality of Ghanaian cities. Afr. J. Environ. Sci. Technol. 2015, 9, 701–711. [Google Scholar]
- Acheampong, E.O.; Macgregor, C.J.; Sloan, S.; Sayer, J. Deforestation is driven by agricultural expansion in Ghana’s forest reserves. Sci. Afr. 2019, 5, e00146. [Google Scholar] [CrossRef]
- Weisse, M.; Goldman, E.D. The World Lost a Belgium-Sized Area of Primary Rainforests Last Year; World Resources Institute: Den Haag, The Netherlands, 2019; p. 29. [Google Scholar]
- MASDAR. Masterplan Study on the Oil Palm Industry in Ghana: Final Report; Ministry of Food and Agriculture (MOFA), Ghana: Hampshire, UK, 2011. [Google Scholar]
- Angelucci, F. Analysis of Incentives for Palm Oil in Ghana; mafap: Rome, Italy, 2013. [Google Scholar]
- Asante-Poku, A.; Angelucci, F. Analysis of Incentives and Disincentives for Cocoa in Ghana; MAFAP, FAO: Rome, Italy, 2013. [Google Scholar]
- Asubonteng, K.; Pfeffer, K.; Ros-Tonen, M.; Verbesselt, J.; Baud, I. Effects of tree-crop farming on land-cover transitions in a mosaic landscape in the eastern region of Ghana. Environ. Manag. 2018, 62, 529–547. [Google Scholar] [CrossRef] [PubMed]
- Acheampong, E.O.; Sayer, J.; Macgregor, C.; Sloan, S. Application of Landscape Approach Principles Motivates Forest Fringe Farmers to Reforest Ghana’s Degraded Reserves. Forests 2020, 11, 411. [Google Scholar] [CrossRef]
- Osei-Wusu, W.; Quaye-Ballard, J.; Antwi, T.; Quaye-Ballard, N.K.; Awotwi, A. Forest Loss and Susceptible Area Prediction at Sefwi Wiawso District (SWD), Ghana. Int. J. For. Res. 2020, 8894639. [Google Scholar] [CrossRef]
- World Resources Institute. Global Forest Watch Home Page. Available online: https://www.globalforestwatch.org/ (accessed on 1 February 2021).
- Appiah, M.; Blay, D.; Damnyag, L.; Dwomoh, F.K.; Pappinen, A.; Luukkanen, O. Dependence on forest resources and tropical deforestation in Ghana. Environ. Dev. Sustain. 2009, 11, 471–487. [Google Scholar] [CrossRef]
- Jassen, T.A.; Ametsitsi, G.K.; Collins, M.; Adu-Bredu, S.; Oliveras, I.; Mitchard, E.T.; Veenendaal, E.M. Extending the baseline of tropical dry forest loss in Ghana (1984–2015) reveals drivers of major deforestation inside a protected area. Biol. Conserv. 2018, 218, 163–172. [Google Scholar] [CrossRef]
- Tsai, Y.H.; Stow, D.A.; López-Carr, D.; Weeks, J.R.; Clarke, K.C.; Mensah, F. Monitoring forest cover change within different reserve types in southern Ghana. Environ. Monit. Assess. 2019, 191, 1–15. [Google Scholar] [CrossRef] [PubMed]
- Koranteng, A.; Adu-Poku, I.; Zawila-Niedzwiecki, T. Drivers of land use change and carbon mapping in the savan-nah area of Ghana. Folia For. Pol. 2017, 59, 287–311. [Google Scholar]
- Antwi, E.K.; Owusu-Banahene, W.; Boakye-Danquah, J.; Mensah, R.; Tetteh, J.D.; Nagao, M.; Takeuchi, K. Sustainability as-sessment of mine-affected communities in Ghana: Towards ecosystems and livelihood restoration. Sustain. Sci. 2017, 12, 747–767. [Google Scholar] [CrossRef]
- PASCO Corporation. Report on Mapping of Forest Cover and Carbon Stock in Ghana; PASCO Corporation in Collaboration with FC-RMSC, CSIR-FORIG and CSIR-SRI, Ghana; PASCO Corporation: Tokyo, Japan, 2013. [Google Scholar]
- Braimoh, A.K. Seasonal migration and land-use change in Ghana. Land Degrad. Dev. 2004, 15, 37–47. [Google Scholar] [CrossRef]
- Awumbila, M.; Tsikata, D. Migration dynamics and small scale gold mining in north-eastern Ghana: Implications for sustainable rural livelihoods. In Proceedings of the Fifth African Population Conference, Arusha, Tanzania, 10–14 December 2007. [Google Scholar]
- Basommi, L.P.; Guan, Q.-F.; Cheng, D.-D.; Singh, S.K. Dynamics of land use change in a mining area: A case study of Nadowli District, Ghana. J. Mt. Sci. 2016, 13, 633–642. [Google Scholar] [CrossRef]
- Awotwi, A.; Yeboah, F.; Kumi, M. Assessing the impact of land cover changes on water balance components of White Volta Basin in West Africa. Water Environ. J. 2014, 29, 259–267. [Google Scholar] [CrossRef]
- Kugbe, J.X.; Mathias, F.; Desta, T.L.; Denich, M.; Vlek, P.L. Annual vegetation burns across the northern savanna region of Ghana: Period of occurrence, area burns, nutrient losses and emissions. Nutr. Cycl. Agroecosyst. 2012, 93, 265–284. [Google Scholar] [CrossRef]
- Leemhuis, C.; Jung, G.; Kasei, R.; Liebe, J. The Volta Basin water allocation system: Assessing the impact of small-scale reservoir development on the water resources of the Volta Basin, West Africa. Adv. Geosci. 2009, 21, 57–62. [Google Scholar] [CrossRef]
- Issahaku, A.R.; Campion, B.B.; Edziyie, R. Rainfall and temperature changes and variability in the Upper East Region of Ghana. Earth Space Sci. 2016, 3, 284–294. [Google Scholar] [CrossRef]
- Incoom, A.B.M.; Adjei, K.A.; Odai, S.N. Rainfall variabilities and droughts in the Savannah zone of Ghana from 1960–2015. Sci. Afr. 2020, 10, e00571. [Google Scholar]
- Amoako, E.E.; Misana, S.; Kranjac-Berisavljevic, G.; Zizinga, A.; Ballu Duwiejuah, A. Effect of the seasonal burning on tree species in the Guinea savanna woodland, Ghana: Implications for climate change mitigation. Appl. Ecol. Environ. Res. 2018, 16, 1935–1949. [Google Scholar] [CrossRef]
- Tuffour-Mills, D.; Antwi-Agyei, P.; Addo-Fordjour, P. Trends and drivers of land cover changes in a tropical urban forest in Ghana. Trees For. People 2020, 2, 100040. [Google Scholar] [CrossRef]
- Water Resources Commission of Ghana. River Systems. Available online: https://www.wrc-gh.org/water-resources-management-and-governance/river-systems/ (accessed on 25 February 2021).
- Kankam-Yeboah, K.; Obuobie, E.; Amisigo, B.; Opoku-Ankomah, Y. Impact of climate change on streamflow in selected river basins in Ghana. Hydrol. Sci. J. 2013, 58, 773–788. [Google Scholar] [CrossRef]
- Hausermann, H. “Ghana must progress, but we are really suffering”: Bui Dam, antipolitics development, and the livelihood implications for rural people. Soc. Nat. Resour. 2018, 31, 633–648. [Google Scholar] [CrossRef]
- Bessah, E.; Raji, A.O.; Taiwo, O.J.; Agodzo, S.K.; Ololade, O.O.; Strapasson, A. Hydrological responses to climate and land use changes: The paradox of regional and local climate effect in the Pra River Basin of Ghana. J. Hydrol. Reg. Stud. 2020, 27, 100654. [Google Scholar] [CrossRef]
- Oti, J.O.; Kabo-Bah, A.T.; Ofosu, E. Hydrologic response to climate change in the Densu River Basin in Ghana. Heliyon 2020, 6, e04722. [Google Scholar] [CrossRef]
- Attiogbe, F.; Nkansah, A. The impact of mining on the water resources in Ghana: Newmont case study at Birim north district (new abirem). Energy Environ. Res. 2017, 7, 27–36. [Google Scholar] [CrossRef]
- Tahiru, A.A.; Doke, D.A.; Baatuuwie, B.N. Effect of land use and land cover changes on water quality in the Nawuni Catchment of the White Volta Basin, Northern Region, Ghana. Appl. Water Sci. 2020, 10, 1–14. [Google Scholar] [CrossRef]
- Yeleliere, E.; Cobbina, S.J.; Duwiejuah, A.B. Review of Ghana’s water resources: The quality and management with particular focus on freshwater resources. Appl. Water Sci. 2018, 8, 1–12. [Google Scholar] [CrossRef]
- Ramsar Convention Secretariat. The Ramsar Convention Manual: A Guide to the Convention on Wetlands (Ramsar, Iran, 1971), 6th ed.; Ramsar Convention Secretariat: Gland, Switzerland, 2013. [Google Scholar]
- Ministry of Lands and Forestry. Managing Ghana’s Wetlands: A National Wetlands Conservation Strategy; Minister of Lands and Forestry: Accra, Ghana, 1999.
- Anderson, K. Wetlands Ecosystem. 2010. Available online: http://gh.chm-cbd.net/biodiversity/faunal-diversity-ghana/ecosystem-diversity/wetlands-ecosystem (accessed on 26 February 2021).
- Finlayson, C.; Gordon, C.; Ntiamoa-Baidu, Y.; Tumbulto, J.; Storrs, M. The hydrobiology of Keta and Songor lagoons: Implications for coastal wetland management in Ghana; Supervising Scientist Report; Environmental Research Institute: Sydney, Australia, 2000; pp. 97–98. [Google Scholar]
- Kondra, M. The Status of the Wetlands in the Greater Accra Region; Governance and Sustainability Lab, Trier University: Trier, Germany, 2016. [Google Scholar]
- Kumi, J.; Kumi, M.; Apraku, A. Threats to the conservation of wetlands in Ghana: The case of Songor Ramsar site. J. Sci. Res. Rep. 2015, 6, 13–25. [Google Scholar] [CrossRef]
- Ekumah, B.; Armah, F.A.; Afrifa, E.A.K.; Aheto, D.W.; Odoi, J.O.; Afitiri, A.-R. Assessing land use and land cover change in coastal urban wetlands of international importance in Ghana using intensity analysis. Wetl. Ecol. Manag. 2020, 28, 271–284. [Google Scholar] [CrossRef]
- Amo, M.; Bih, F.; Agyeman, A.; Adu-Gyamfi, T.; Mensah, T. Investigation into the acquisition and development of Wetlands built environment industry: A case study in Kumasi Metropolis. Int. J. Civ. Eng. Constr. Estate Manag. 2017, 5, 1–20. [Google Scholar]
- Nkonya, E.; Karsenty, A.; Msangi, S.; Souza, C., Jr.; Shah, M.; Von Braun, J.; Galford, J.; Park, S.; Le Blanc, D. Sustainable Land Use for the 21st Century; United Nations Department of Economic and Social Affairs Division for Sustainable Development: Incheon, Korea, 2012. [Google Scholar]
- Armah, F.A.; Luginaah, I.; Yengoh, G.T.; Taabazuing, T.; Yawson, D.O. Management of natural resources in a conflicting environment in Ghana: Unmasking a messy policy problem. J. Environ. Plan. Manag. 2014, 57, 1724–1745. [Google Scholar] [CrossRef]
- Owusu, P.A.; Asumadu-Sarkodie, S.; Ameyo, P. A review of Ghana’s water resource management and the future prospect. Cogent Eng. 2016, 3, 1164275. [Google Scholar] [CrossRef]
- Tasantab, J.C. Beyond the plan: How land use control practices influence flood risk in Sekondi-Takoradi. Jàmbá J. Disaster Risk Stud. 2019, 11, a638. [Google Scholar] [CrossRef] [PubMed]
- Anarfi, K.; Hill, R.A.; Shiel, C. Highlighting the sustainability implications of urbanisation: A comparative analysis of two urban areas in Ghana. Land 2020, 9, 300. [Google Scholar] [CrossRef]
- Junge, B.; Abaidoo, R.; Chikoye, D.; Stahr, K. Soil Conservation in Nigeria: Past and Present on-Station and on-Farm Initiatives; Soil and Water Conservation Society: Ankeny, IA, USA, 2008; pp. 1–24. [Google Scholar]


| Original Category | Reclassified Category | ||
|---|---|---|---|
| Landcover | Code | Landcover | Code |
| Urban areas | 190 | Built-up | 190 |
| Mosaic herbaceous cover | 110 | Grassland | 110 |
| Grassland | 130 | ||
| Shrubland | 120, 122 | Other Vegetation | 120 |
| Sparse vegetation | 150, 153 | ||
| Shrub or herbaceous cover | 180 | ||
| Bare areas | 200, 201, 202 | Bare Area | 200 |
| Rainfed cropland | 10, 11 | Agriculture | 10 |
| Irrigated cropland | 20 | ||
| Mosaic cropland (>50% vegetation) | 30 | ||
| Mosaic natural vegetation | 40 | ||
| Tree cover (broadleaved evergreen) | 50 | Forest | 50 |
| Tree cover (broadleaved deciduous) | 60, 62 | ||
| Mosaic tree and shrub | 100 | ||
| Tree cover (flooded, fresh, or brackish water) | 160 | Wetland | 170 |
| Tree cover (saline water) | 170 | ||
| Water bodies | 210 | Water body | 210 |
| Land Cover | 2000 | 2005 | 2010 | 2015 | 2019 |
|---|---|---|---|---|---|
| km2 | |||||
| Agriculture | 993.46 (0.9) ‡ | 324.83 (0.3) | 560.03 (0.5) | 615.49 (0.5) | −1757.02 (−1.5) |
| Bare Area | −1034.93 (−93.8) | −8.67 (−12.7) | 0.46 (0.8) | 7.44 (12.4) | 12.05 (17.9) |
| Built-up | 159.53 (14.1) | 373.7 (28.9) | 272.87 (16.4) | 352.05 (18.2) | 334.16 (14.6) |
| Forest | 6119.03 (8.6) | 5181.67 (6.7) | 1037.62 (1.3) | 159.91 (0.2) | 4198.97 (5) |
| Grassland | −41.06 (−43.1) | −10.65 (−19.6) | 0.55 (1.3) | 5.16 (11.7) | −2.74 (−5.6) |
| Other Vegetation | −8179 (−16.7) | −5867.14 (−14.3) | −1894.63 (−5.4) | −1395.29 (−4.2) | −2798.08 (−8.8) |
| Water body | 1981.94 (41.3) | 4.94 (0.1) | 23.77 (0.4) | 259.38 (3.8) | −18.56 (−0.3) |
| Wetland | 1.04 (0.4) | 1.32 (0.5) | −0.68 (−0.3) | −4.15 (−1.6) | 31.22 (12.3) |
| Region | Agriculture | Bare Area | Built-Up | Forest | Grassland | Other Vegetation | Water Body | Wetland |
|---|---|---|---|---|---|---|---|---|
| km2 | ||||||||
| Ahafo | 40.42 (1) ‡ | 0 (0) | 34.88 (182.7) | −75.21 (−6.1) | −0.19 (−100) | 0.09 (1.1) | 0 (0) | 0 (0) |
| Ashanti | −662.22 (−3.8) | −5.66 (−100) | 301.4 (105.2) | 1529.23 (30.3) | −7.04 (−85) | −1170.42 (−72.2) | 14.63 (33.3) | 0.09 (53.6) |
| Bono | −148.16 (−2.1) | 0 (0) | 104.62 (212.7) | 490.44 (13) | −0.09 (−100) | −587.64 (−79.4) | 143 (20,329,707.5) | −2.16 (−86.8) |
| Bono East | −545.32 (−15.7) | −65.53 (−84.8) | 63.39 (1260.7) | 4789.45 (35.4) | 3.44 (196.9) | −4622.23 (−86.4) | 368.2 (59.8) | 8.6 (166.1) |
| Central | −92.33 (−1.1) | −3.97 (−95.5) | 182.27 (307.3) | −77.09 (−9) | −6.19 (−61.3) | −0.2 (−0.3) | −1.71 (−14.2) | −0.78 (−5.6) |
| Eastern | −560.49 (−4.3) | −710.9 (−99) | 99.43 (202.7) | 1244.06 (56.9) | −24.72 (−90.3) | −984.24 (−60.6) | 930.07 (81.2) | 6.8 (327.5) |
| Greater Accra | −340.83 (−14.3) | −6.58 (−14.8) | 387.67 (80.6) | 20.92 (91.3) | −8.06 (−37.8) | −48.87 (−8.6) | −3.32 (−3.9) | −0.94 (−4.8) |
| North East | 852.4 (22.9) | 0 (0) | 5.33 (712.6) | 198.08 (10.9) | 0.9 (313.6) | −1056.71 (−29.3) | 0 (0) | 0 (0) |
| Northern | 1807.64 (17.1) | 1 (0) | 48.74 (353.8) | 1287.36 (22.3) | −0.17 (−6.9) | −3168.84 (−34.7) | 22.83 (7.3) | 1.44 (768.2) |
| Oti | −947.83 (−15) | −122.79 (−91.8) | 19.57 (638) | 1304.15 (62.3) | 2.18 (126) | −693 (−57.2) | 426.37 (32.8) | 11.35 (524.3) |
| Savannah | 43.6 (2.6) | −1.69 (−81.8) | 12.75 (2954.8) | 5715.64 (26.9) | 2.3 (447.6) | −5933.89 (−52.7) | 165.71 (29.2) | −4.42 (−76.1) |
| Upper East | 189.54 (4) | 0 (0) | 17.82 (454.9) | 408.76 (26.1) | −0.75 (−80) | −614.92 (−24.5) | −0.47 (−2) | 0 (0) |
| Upper West | 808.7 (15.7) | 0 (0) | 18.14 (2426.8) | 356.19 (11.4) | −1.31 (−77.8) | −1181.73 (−10.8) | 0 (0) | 0 (0) |
| Volta | −420.77 (−6.2) | −107.51 (−92.2) | 51.47 (90.1) | 337.87 (25.3) | −7.17 (−48.2) | −58.34 (−13.7) | 192.17 (29.8) | 12.26 (7) |
| Western | 611.54 (6.6) | 0 (0) | 111.22 (131.8) | −704.69 (−14.7) | −1.6 (−67.9) | −8.4 (−30) | −4.79 (−16.7) | −3.29 (−11.4) |
| Western North | 101.31 (1.5) | 0 (0) | 31.1 (179.2) | −132.19 (−4.2) | −0.03 (−5.9) | −0.18 (−12.1) | 0 (0) | 0 (0) |
Publisher’s Note: MDPI stays neutral with regard to jurisdictional claims in published maps and institutional affiliations. |
© 2021 by the authors. Licensee MDPI, Basel, Switzerland. This article is an open access article distributed under the terms and conditions of the Creative Commons Attribution (CC BY) license (https://creativecommons.org/licenses/by/4.0/).
Share and Cite
Ampim, P.A.Y.; Ogbe, M.; Obeng, E.; Akley, E.K.; MacCarthy, D.S. Land Cover Changes in Ghana over the Past 24 Years. Sustainability 2021, 13, 4951. https://doi.org/10.3390/su13094951
Ampim PAY, Ogbe M, Obeng E, Akley EK, MacCarthy DS. Land Cover Changes in Ghana over the Past 24 Years. Sustainability. 2021; 13(9):4951. https://doi.org/10.3390/su13094951
Chicago/Turabian StyleAmpim, Peter A. Y., Michael Ogbe, Eric Obeng, Edwin K. Akley, and Dilys S. MacCarthy. 2021. "Land Cover Changes in Ghana over the Past 24 Years" Sustainability 13, no. 9: 4951. https://doi.org/10.3390/su13094951
APA StyleAmpim, P. A. Y., Ogbe, M., Obeng, E., Akley, E. K., & MacCarthy, D. S. (2021). Land Cover Changes in Ghana over the Past 24 Years. Sustainability, 13(9), 4951. https://doi.org/10.3390/su13094951