1. Introduction: Cultural Landmarks in Urban Landscapes
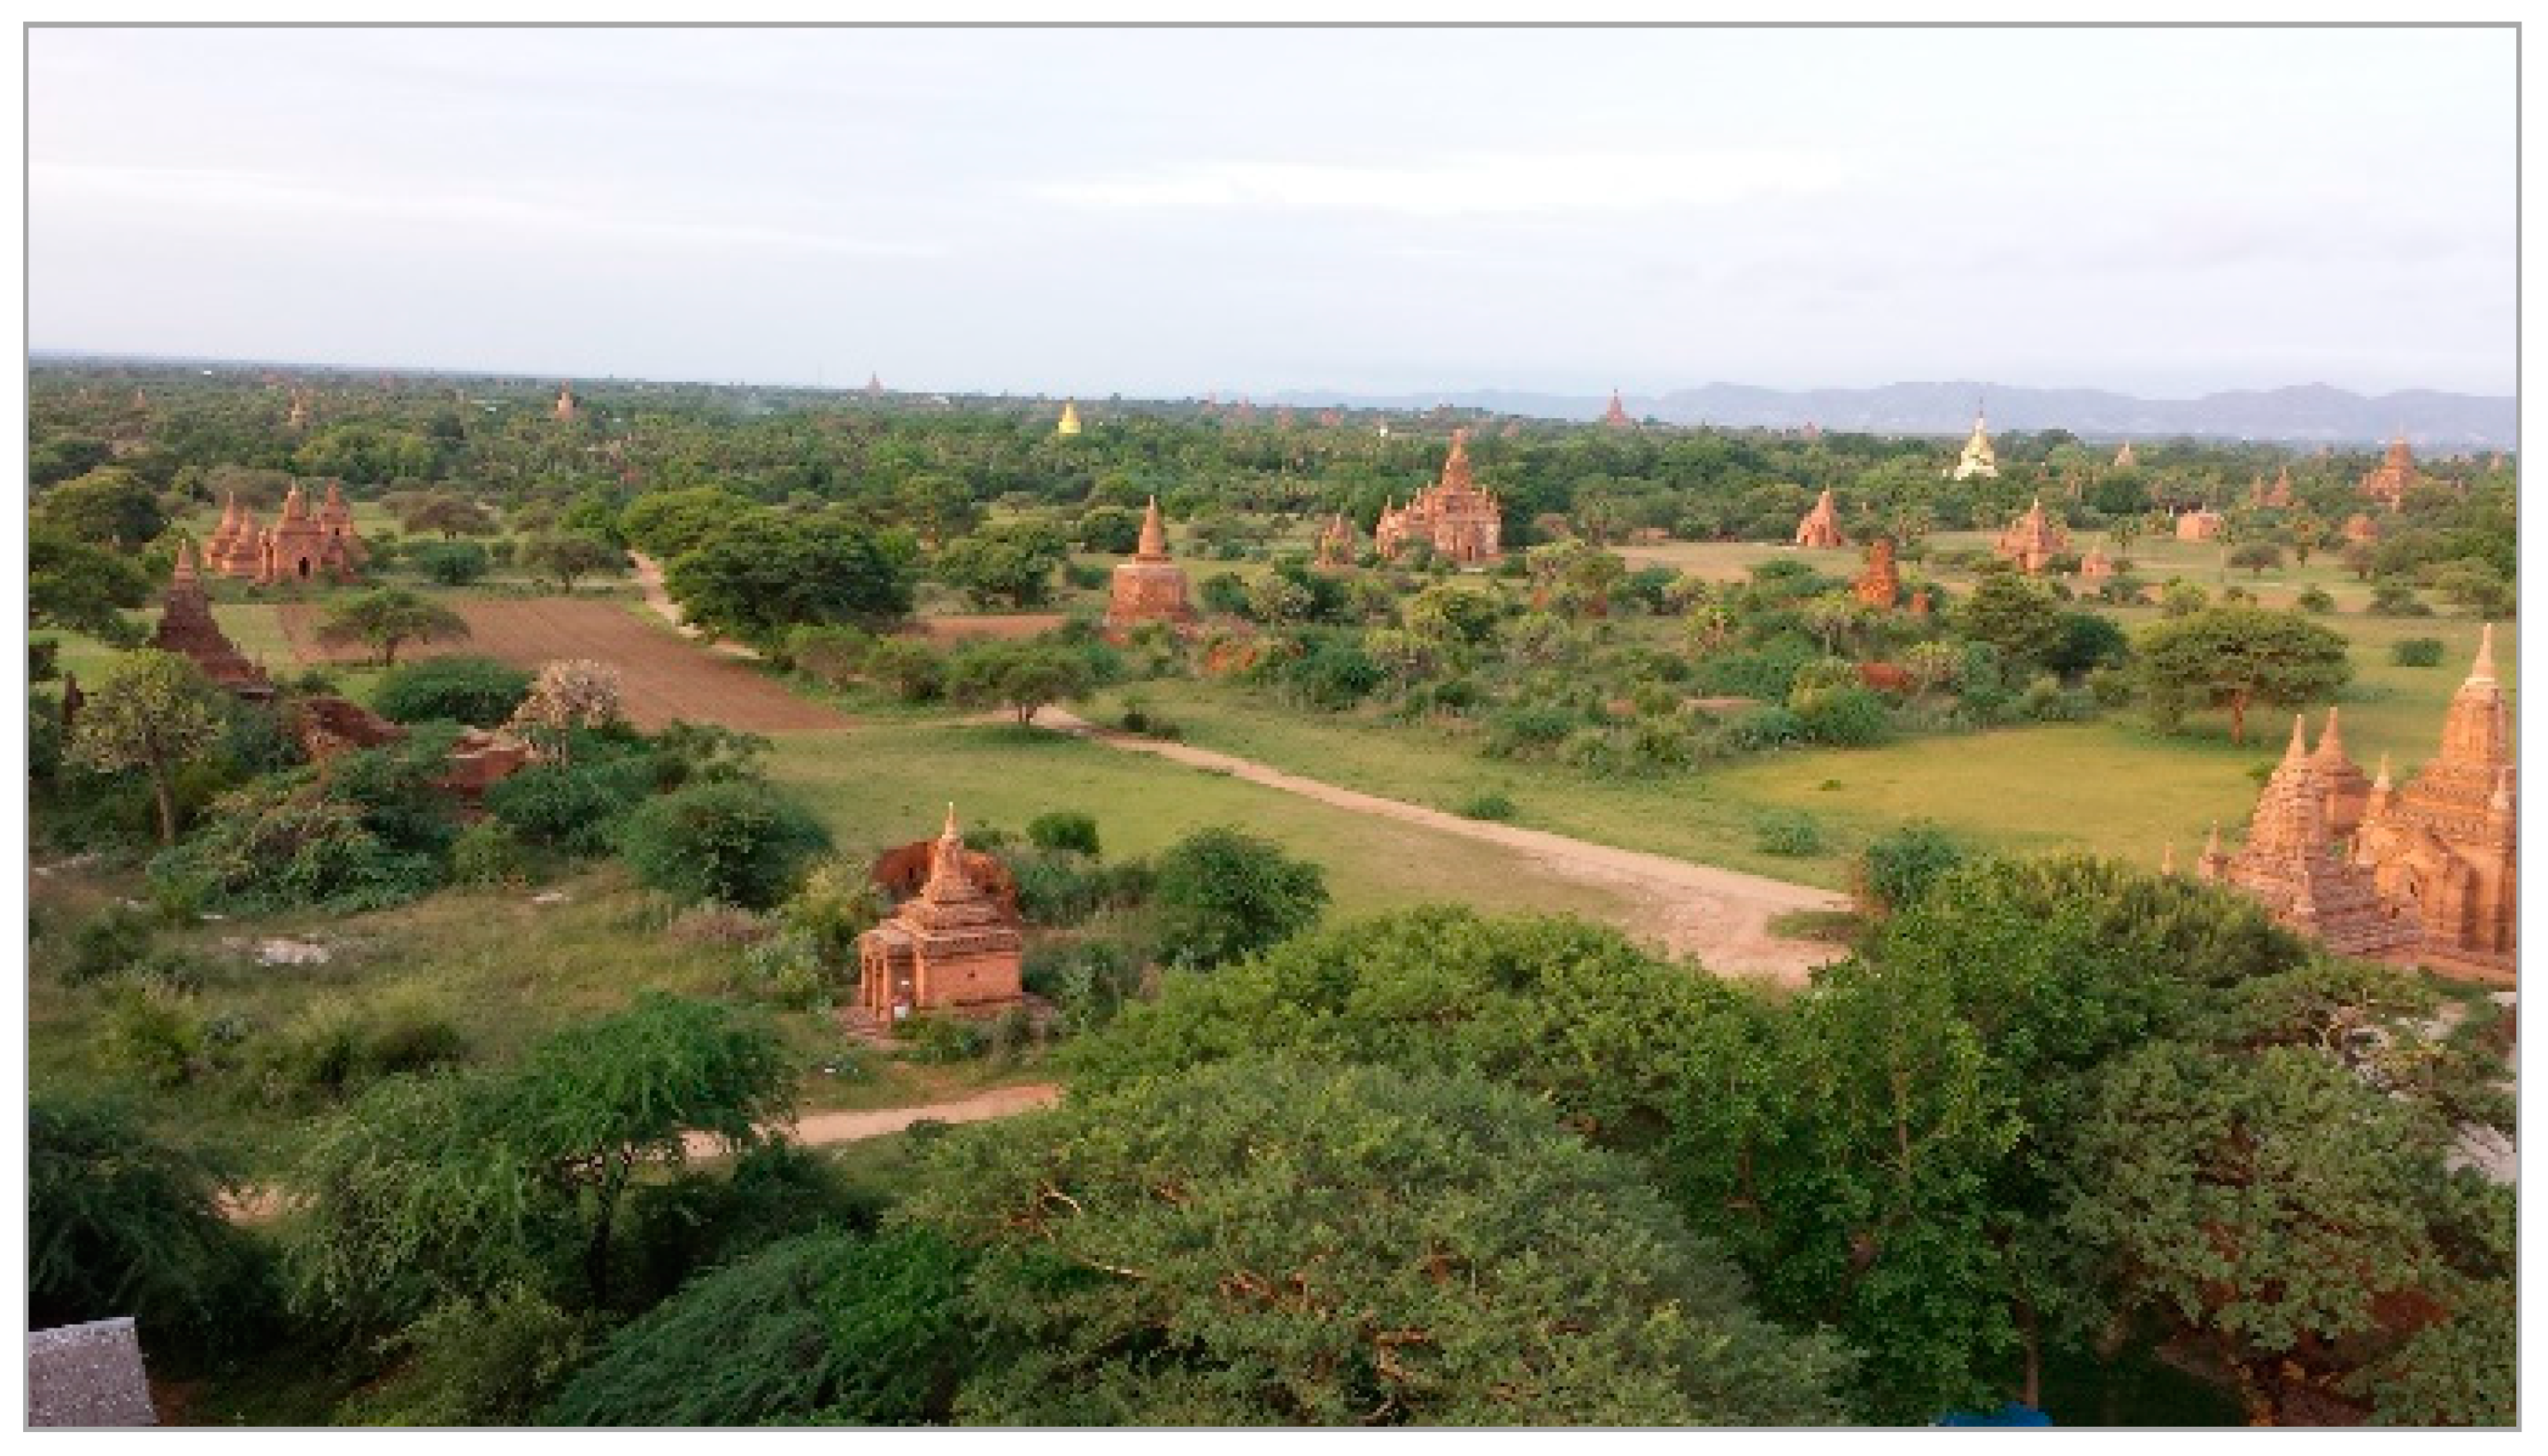
Before dawn on 23 June 2015, we climbed up to the top of Shwesandaw Pagoda in the east side of Bagan, Myanmar, to observe the breathtaking sunrise on this sacred landscape, featuring an exceptional range of Buddhist art and architecture (
Figure 1). Under the rising sun, the spectacular landscape was gradually unveiled—a green, luxurious space full of trees and grasses, dotted with countless ancient pagodas of various sizes. It is notable that the vegetation around each pagoda is well protected, likely due to the Buddhist beliefs among locals; modern urban infrastructure (e.g., buildings, paved roads, etc.) is completely absent, and agricultural lands account for a small fraction of the landscape. Later in the day, we conducted a semi-structured interview with three government officials and four community representatives at the Urban Planning Committee of Bagan. The committee had asked UNESCO to name Bagan, a relatively small city of 7000 residents in 575 km
2, one of the World Heritage Cities—a request that was granted some four years later (
https://whc.unesco.org/en/news/2004/, accessed on 23 February 2021). When we asked about the challenges facing planners regarding future urban development (i.e., How could they design the future landscape once these pagodas and associated buffer zones that account for a major portion of the land are under protection?), the committee responded that, as the baseline for addressing the challenges, the master plan for Bagan targeted a 1.1% increase in population over the next 30 years, with the tourist industry as the most important revenue generator for the city. Yet, three inter-linked issues remained difficult to address: (1) the limited available land after exclusion of the UNESCO’s heritage sites; (2) foreseeable climatic risks that will eventually hinder agricultural and livestock production for local residents; and (3) a need for effective approaches and facilities to treat the increasing amount of solid waste where the recycling program is lacking. Clearly, urban design and planning for Bagan cannot be successful without placing the city’s proud assets in the context of continued religious practices, the level of socioeconomic development, local geophysical settings (e.g., rivers), and global climatic changes.
The question we asked about Bagan is relevant to many cities around the world that are experiencing drastic urbanization and changes. The aggregated behaviors of residents shape city landscapes through their social interactions and cultural representation. Landmarks—one of five key elements of cities (i.e., path, edge, district, node, and landmark) [
1]—play a significant role in social interactions by providing spatial reference points [
2,
3]. With distinct spatial features and associated characteristics [
4], landmarks can be enjoyed and shared by residents and other visitors [
2,
5]. While the importance of landmarks has been studied in various fields, our understanding of the quantitative relationship between landmarks and surrounding landscapes remains limited. Here, we aimed to explore the meaning of cultural landmarks and their impacts on landscape structure through investigating cities in multiple regions with different cultural backgrounds.
From a cultural point of view, a city is a place consisting of visible and permanent symbols or landmarks [
6]. Landmarks historically have been featured in urban landscapes, and they likely will continue to be in the future [
7]. The roles of permanent landmarks in current urban landscapes, as well as in planning for future landscapes, need to be considered in the context of unique socioeconomic development (e.g., predicted population growth and GDP), geophysical settings and cultural backgrounds, land tenure policies, and other factors [
8,
9]. Globally, there have been many cases where new development is limited in areas surrounding landmarks due to concerns about historic preservation. In Beijing, for example, the construction plan for the Olympic Park in 2008 was partially affected by the decision to not demolish many historical landmarks or sites (
http://www.chinaheritagequarterly.org, accessed on 25 February 2021) [
10]. In France, under the concept of ‘urban heritage’, protected areas—zones de protection du patrimoine architectural et urbain—were introduced to limit urban development in several cities [
11]. Though there is an assumption that such historic preservation poses development constraints, urban development that accommodates cultural landmarks often creates new social and functional diversity. Historic building preservation often plays a pivotal role in urban regeneration as an anchor landmark, guiding and inspiring new construction and public spaces, such as the Italian “piazza” (i.e., public square) [
12,
13]. Along the same line of thought, the new urban agenda issued at the Habitat III (United Nations Conference on Housing and Sustainable Urban Development) emphasizes the importance of landmarks as a priority in urban planning, as well as a tool for sustainable urban development [
14]. Here “landmarks” include natural structures (e.g., urban green space and public space) and manmade structures (e.g., churches in most European countries, temples in East Asia, mosques in Islamic regions). Given the crucial roles of cultural landmarks in urban landscapes, it is vital to understand their status (i.e., number, size, density) and influence on surrounding landscapes in terms of composition and structure. We thus initiated our study to examine the spatial impact of existing cultural landmarks (mostly Catholic and Buddhist religious architecture) that are still embedded and visible in the urban landscapes of Europe and East Asia. As cities vary in design and installation of cultural landmarks in their urban landscapes, this study focuses on comparisons of cities with current dominancy of Catholic and Buddhist/Daoism religion/culture, as well as emerging cities with limited religious architecture (e.g., Shenzhen in China, Ulaanbaatar in Mongolia). Our specific study objectives are: (1) to provide qualitative comparisons of the long-term evolution of selected urban landscapes by constructing maps that reflect the layouts of the cities 150+ years ago; (2) to quantify the spatial distributions of cultural landmarks in the current landscape; and (3) to examine the potential influences of these landmarks on landscape composition and structure. We hypothesize that current urban landscapes have been influenced similarly by cultural landmarks, although substantial differences exist among cities with contrasting histories and religions. In other words, we expect to find that the relationships between cultural landmarks and landscape structure among the pairs of cities that share the same religion and history are similar to one another and very different from those in cities with different religious histories. A comprehensive database of all global cities is needed for a thorough test of this hypothesis. As a first step, we chose two cities from each of three categories to explore the research question, aiming at fine-tuning our hypothesis to be tested with the completion of global datasets.
2. Methods
While historical preservation policies to protect cultural landmarks have been promoted for several decades, designation and conservation of landmarks are often made by local and central governments without consideration of universal standards [
15]. For example, the cultural and aesthetic values of modern architecture vary substantially from city to city, as well as overarching cultures and institutions. Ideally, this can be done by including all global cities with various histories, cultures, and governments. This will require a comprehensive database of all cultural landmarks, associated features [
4], and accurate landscapes. While the current landscapes of global cities can be examined through multiple products [
15], there is no comprehensive database of cultural landmarks, partially due to the difficulties in defining “cultural landmarks”, lack of a standard protocol for identify and labeling them, as well as their dynamic nature (e.g., establishment, renovations, disappearances). To achieve our study objectives, we focused on cultural landmarks that have been historically used to promote social interactions, such as historical and religious buildings, public squares (plazas/piazzas), and temples. These cultural heritage sites are typical cultural landmarks, although the selection of landmarks is based on knowledge of their importance (i.e., some degrees of subjective judgement). Due to a lack of a global database, we initialized this study by using the database collected from our previous research in six cities [
16,
17,
18,
19,
20,
21,
22], albeit comprehensive assessments would require including cities from more regions and cultural backgrounds. The six cities with available data (Bari, Barcelona, Beijing, Vientiane, Ulaanbaatar, and Shenzhen), fortunately, are from two contrasting cultures: Europe and East Asia. In addition, two cities (Shenzhen and Ulaanbaatar), also in Asia, were only substantially developed over the past four decades. Although Ulaanbaatar was settled as a permanent Buddhist monastic center in its current location in 1778, its urban land area did not experience substantial expansion until the 20th century, especially during the recent four decades. Due to the short urbanization history of Shenzhen and unique situation of Ulaanbaatar, we categorized them as “emerging cities”, in contrast to the other four cities that have long cultural history. As a result, the discoveries from this small selection of cities should not be extrapolated to other cities, or considered as differences between the contrasting societies.
2.1. Three Pairs of Cities with Contrasting Cultures
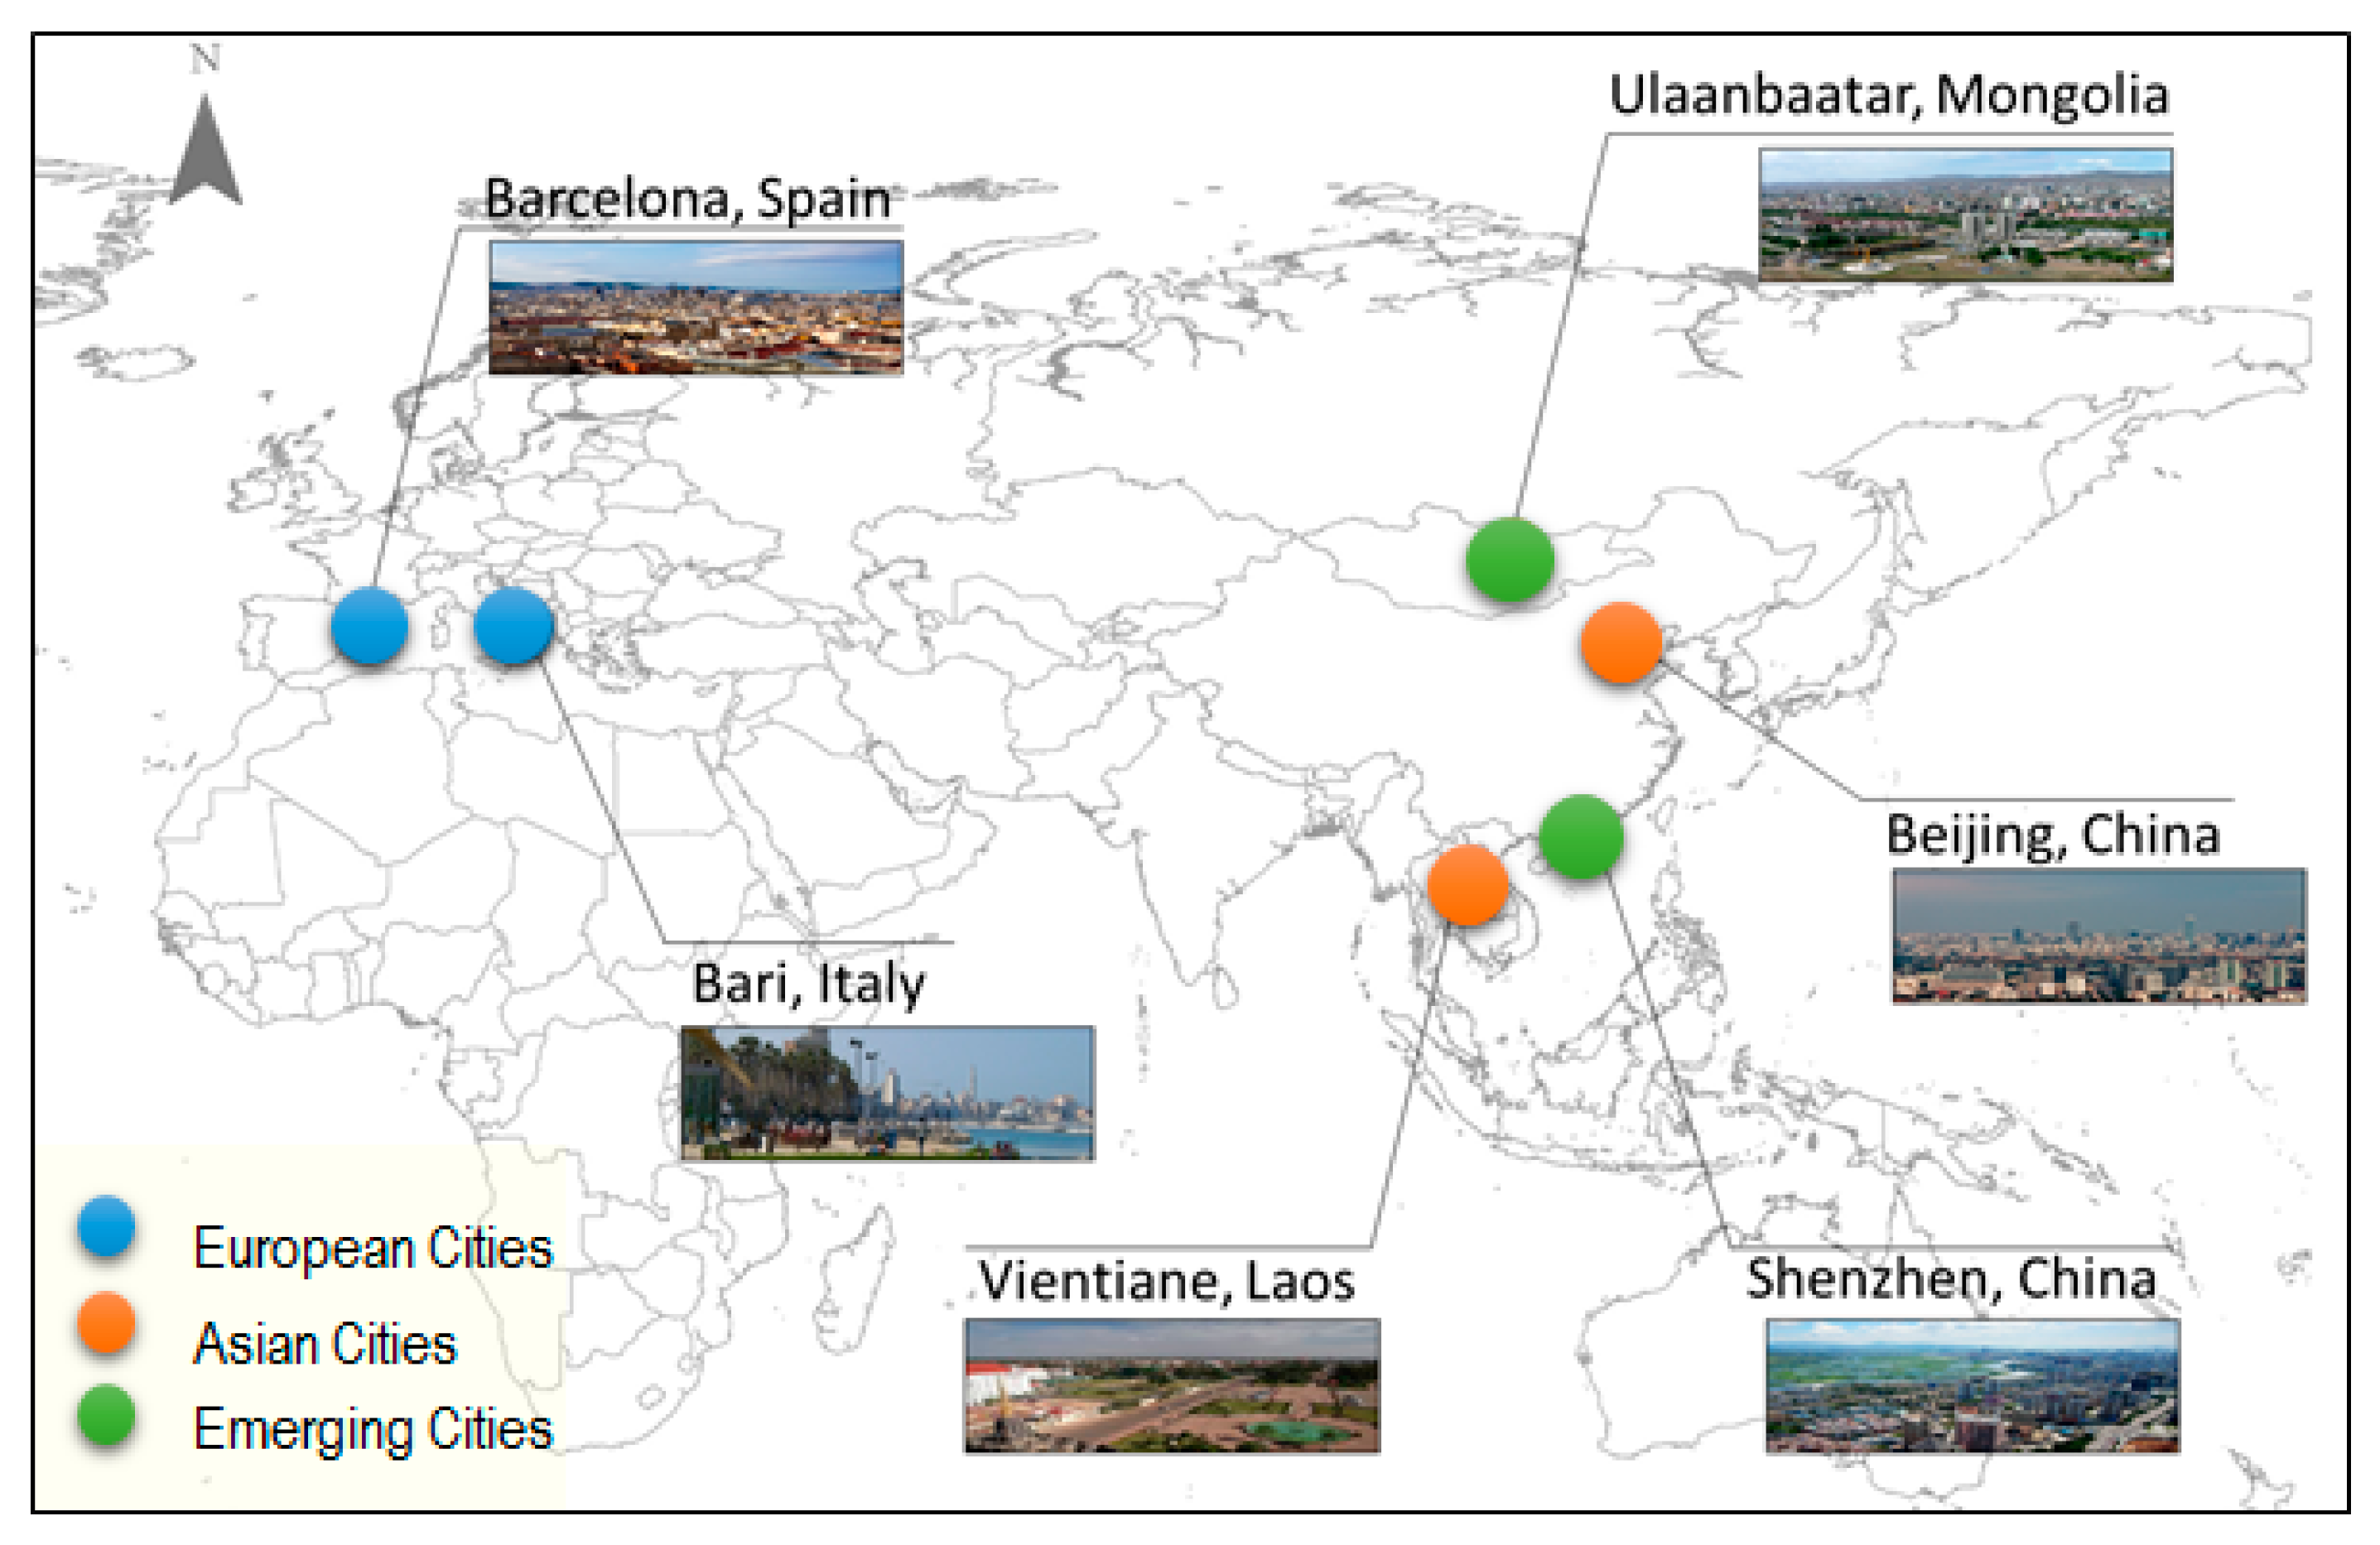
We selected three pairs of cities representing three contrasting cultures and categorized them as: Catholic Europe (Bari, Italy; Barcelona, Spain), Buddhist Asia (Beijing, China; Vientiane, Laos), and emerging cities (Shenzhen, China; Ulaanbaatar, Mongolia) (
Figure 2). It is worth noting that the use of “Catholic” and “Buddhist” is based on present dominance of religion in the cities though their historical cultures/regions have been very diverse and dynamic. For example, Beijing has also been dominated by Daoism and Confucianism, whereas Bari and Barcelona have had substantial periods of dominance by Romans, Muslims and others.
Barcelona is the capital city of the autonomous community of Catalonia in the Metropolitan Area of Barcelona, and Spain’s second largest city. The Metropolitan Area contains about 5 million inhabitants [
23], 17.4% of whom are non-indigenous [
18]. Barcelona’s climate is typical of the Mediterranean type, with mild and relatively rainy winters and hot, sunny summers. The monthly average temperature ranges from 9 °C in January to 24.5 °C in August. Barcelona was most likely founded by the Carthaginians in the 3rd century BC and promoted by the Romans. During the 13th century, Catalonia began its golden age and expansion in the Mediterranean under the Aragonese Crown, incorporating new territories, including Valencia, the Balearic Islands, Southern France, Sardinia, Sicily, and Athens. In the 19th century Catalonia developed a flourishing textile industry as well as iron and cork industries. Currently, Barcelona’s port represents an important international transport hub [
24]. Barcelona has been investing in strategic sectors such as Information and Communications Technology (ICT), sustainable mobility, biotechnology, green economy and sustainability, and aeronautics. Among the city’s most famous cultural landmarks is the Basilica of the Sagrada Familia, which is a monumental Catholic church begun in 1882 and still under construction. The Palace of Catalan Music (1905–1908) in downtown Barcelona is an icon of modernist architecture and was declared a World Heritage Site by UNESCO in 1997. Over the last century and a half Barcelona has developed according to an urban grid system, with only few exceptions such as the landmark Plaça de las Glories formed by the crossing of the Diagonal and Meridian avenues.
Bari is the second largest city in southern Italy and the capital of the Apulia region located on the Adriatic Sea. It had over 1.3 million inhabitants in 2019, including the larger metropolitan area [
25]. The Apulia region covers 19,540 km
2 and its population is ~4 million. Bari enjoys a Mediterranean climate with a seasonal pattern of hot–dry summers (mean temperature of 31.43 °C and annual precipitation of 562 mm) and wet winters. Bari’s history dates back to pre-Christian times, when the Messapii and other Italic peoples settled the region in the first millennium BC. It was dominated by the Greeks, Romans, Byzantines, Muslims, and Normans. Bari’s harbor was noted as early as 181 BC as a historical landmark in the city, since fishing was a main activity. In 1071 Bari came under the rule of the Normans and was established as the chief town of Apulia. Today, Bari is one of Italy’s top commercial and industrial cities, producing chemicals, machinery, printed materials, petroleum, and textiles and has a growing service sector. It takes pride in its seafood industry and agricultural produce, which represent hallmark sectors of the entire region. As a cultural center, Bari is quite remarkable, with theaters (e.g., Petruzzelli Theater), archeological and historical museums, and major churches of Catholic rite, like the Basilica of San Nicola from the 11th century, featuring important Renaissance artwork, and Romanesque Cathedral of San Sabino (12th–13th century), built over the ruins of the former church dating back to the 11th century, as well as the Norman Swabian Castle (12th century), all representing major cultural landmarks. The old concentric town is the hub of these historical points of interest, with the exception of the theaters, where residents and visitors meet and enjoy the local cuisine (e.g., the durum wheat handmade pasta is now a UNESCO cultural heritage item). Surrounding the old town, an urban network was developed in the early 19th century according to a N–S and E–W urban grid plan. Outside this grid system, beginning in the early 1960s, the city assumed an irregular pattern, and in some cases converges into landmarks such as churches, main squares, and public buildings and parks.
As the capital and the largest city of Laos PDR, Vientiane is positioned in the northern central part of the country, on the bend of the Mekong River bordering Thailand. With a tropical savanna climate (Köppen Aw), Vientiane is usually very hot and humid throughout the year, with an average monthly low and high temperature of 21.8 °C and 31.1 °C, respectively, and an annual average of 118 rain days and 75% relative humidity. The city has a distinct wet season (April–October) and a dry season (November–March), with cooler temperatures in the dry season than the wet season. The city became an important administrative center in 1354 after Lan Xiang (i.e., the Lao Kingdom) was established as a united kingdom and then became the capital in 1563 to avoid the invasion of Burma. The city was looted and burned to the ground in 1827 in a war with the Siamese army, causing many residents to relocate to the forest. The city in despair was eventually passed to the French and became the capital of Laos in 1899, with significant efforts to rebuild, including reconstructing and repairing many Buddhist temples. With 950,000 residents, the city hosted 13% of Lao’s population in 2020. As the capital city, Vientiane serves as the administrative and economic center for Laos. The urban expansion and sprawl of Vientiane over the past two decades occurred mainly along the major transportation corridor. Even though the city has a master plan to guide its urban growth, it does not seem to be effective in regulating development, due partially to frequent violations of the plan [
26]. In the context of cultural landmarks, though it is a small city, Vientiane hosts many Buddhist temples, including Phat That Luang—an important national monument in Lao. Other well-known religious sites include Wat Si Muang, a temple built in 1593, Buddha Park, built in 1958, and many Buddhist and Hindu sculptures, That Dam, and Wat Ong Teu Mahawihan (constructed initially by the King in the 1500s).
Beijing is located in northern China, with a land area of ~16,410 km
2 and a population of 25.54 million in 2020. This imperial city was established in 220 BC and became the capital city in the Yuan Dynasty in the mid-13th century, after the Mongols invaded China. The city has a monsoon climate of hot and humid summers but dry and cold winters. Due to the lack of a major river system, water shortages (annual precipitation is <600 mm) are becoming the major challenge for its rapidly increasing population and massive industries. It has been the capital of modern China since 1949, and it has served as the political and cultural center since then. The city was formed within a central axis of the Forbidden City that has defined urban development over the past 850 years. With mountains surrounding this inland city on three sides, Beijing was strategically poised and developed to be the perfect location for a capital. Its urbanization was confined to the areas within the current “second ring belt” before 1949, but then rapidly expanded in all directions, except to the west, especially after China adopted the Open and Reform Policy in 1978 [
27]. To promote the 2008 Olympic games, the central axis of the Forbidden City was used to extend to the north, to establish the Olympic Park. The city is renowned for its influential cultural sites (e.g., palaces, temples, well-preserved tombs, and seven impressive UNESCO World Heritage Sites). Recognizing the cohesiveness of placing Beijing in a regional context (e.g., necessary supports from the surrounding regions), the central government installed several initiatives for Beijing’s sustainable development, such as the formation of Beijing-Tianjin-Hebei (BTH) megalopolis and the national capital region for regional planning, including allocations of protected areas for the maintenance of various ecosystem services [
28].
Ulaanbaatar, which means “Red Hero” in Mongolian, is located in the north-central part of Mongolia. It is situated at the foot of the Bogd Khan Uul Mountain in the valley on the Tuul River. The city had a total population of 1.4 million in 2018, which was 42% of the national population and 64% of the urban population of Mongolia. As the capital city, it is the political, economic and cultural center, generating about two thirds of the nation’s GDP [
19]. The city is located in the middle of the Mongolia Plateau, which is dominated by typical grasslands and continental climate [
29]. It is the coldest national capital in the world. With a monsoon-influenced, cold, semi-arid climate (400 mm yr
−1 of annual rainfall), the city has long, cold and dry winters and brief warm summers. Ulaanbaatar has experienced a significant restructuring towards a service-oriented economy, with 43% of its GDP coming from the tertiary sector [
20]. The city has expanded along the north side of the Tuul River, from 82 km
2 in 1990 to 142 km
2 in 2010 [
18]. Ulaanbaatar was founded in 1639 as a mobile Buddhist monastery town and was moved 28 times before it was settled in its current location in 1778. Current Buddhist temples in Ulaanbaatar include Gandantegchinlen Khiid Monastery, Dashi-Choiling Monastery, Dambadarjaa Monastery, Naro Khachod, and Drolmaling. Ulaanbaatar has experienced unprecedented urbanization following the collapse of the Soviet Union. Lack of housing supply has led to an expansion of informal settlements, mostly in the form of Gers [
21].
Shenzhen is a coastal city in the south of Guangdong Province, neighboring Hong Kong. It was established as a special economic zone in 1979 and built from an agriculture-dominated landscape. Shenzhen, located on the east bank of the Pearl River estuary, covers 395.8 km
2 and is characterized by open plains, rolling hills, and mountains. Approximately 12.53% of the land area is used for residences, due in part to the large temporary resident population in the city; the estimated total population is over 20 million. The climate is southern subtropical, with a mean annual temperature of 22.4 °C and mean annual rainfall of 1933 mm. Benefiting from a superior location and China’s Reform and Opening-Up Policy, Shenzhen has become a modern and international metropolis. Dubbed as the ‘Chinese Silicon Valley’, Shenzhen is the hub for more than 14,000 high-tech companies, including Huawei, Lenovo, and Tencent. It also became the innovation hub, as a new generation of start-ups is emerging, which makes it the most competitive and innovative city in China. While Shenzhen does not have as many historical sites as other large cities in China, it has created a number of excellent theme parks that entertain while teaching visitors about China and the world. The Folk Culture Villages, which introduces visitors to China’s long and varied history, is an example of its cultural promotion. The area of urban land was as little as 0.49% and 0.79% of the total study area in 1973 and in 1979, respectively. By 2009 urban land increased to 32.82% [
30]. Urbanization in Shenzhen has been primarily due to industrialization. Agriculture, industry, and other services or trades contributed 37.0%, 20.5%, and 42.5% of GDP in 1979, which had grown to 0.2%, 53.2%, and 46.6% by 2005 [
17].
2.2. Experimental Design and Analysis
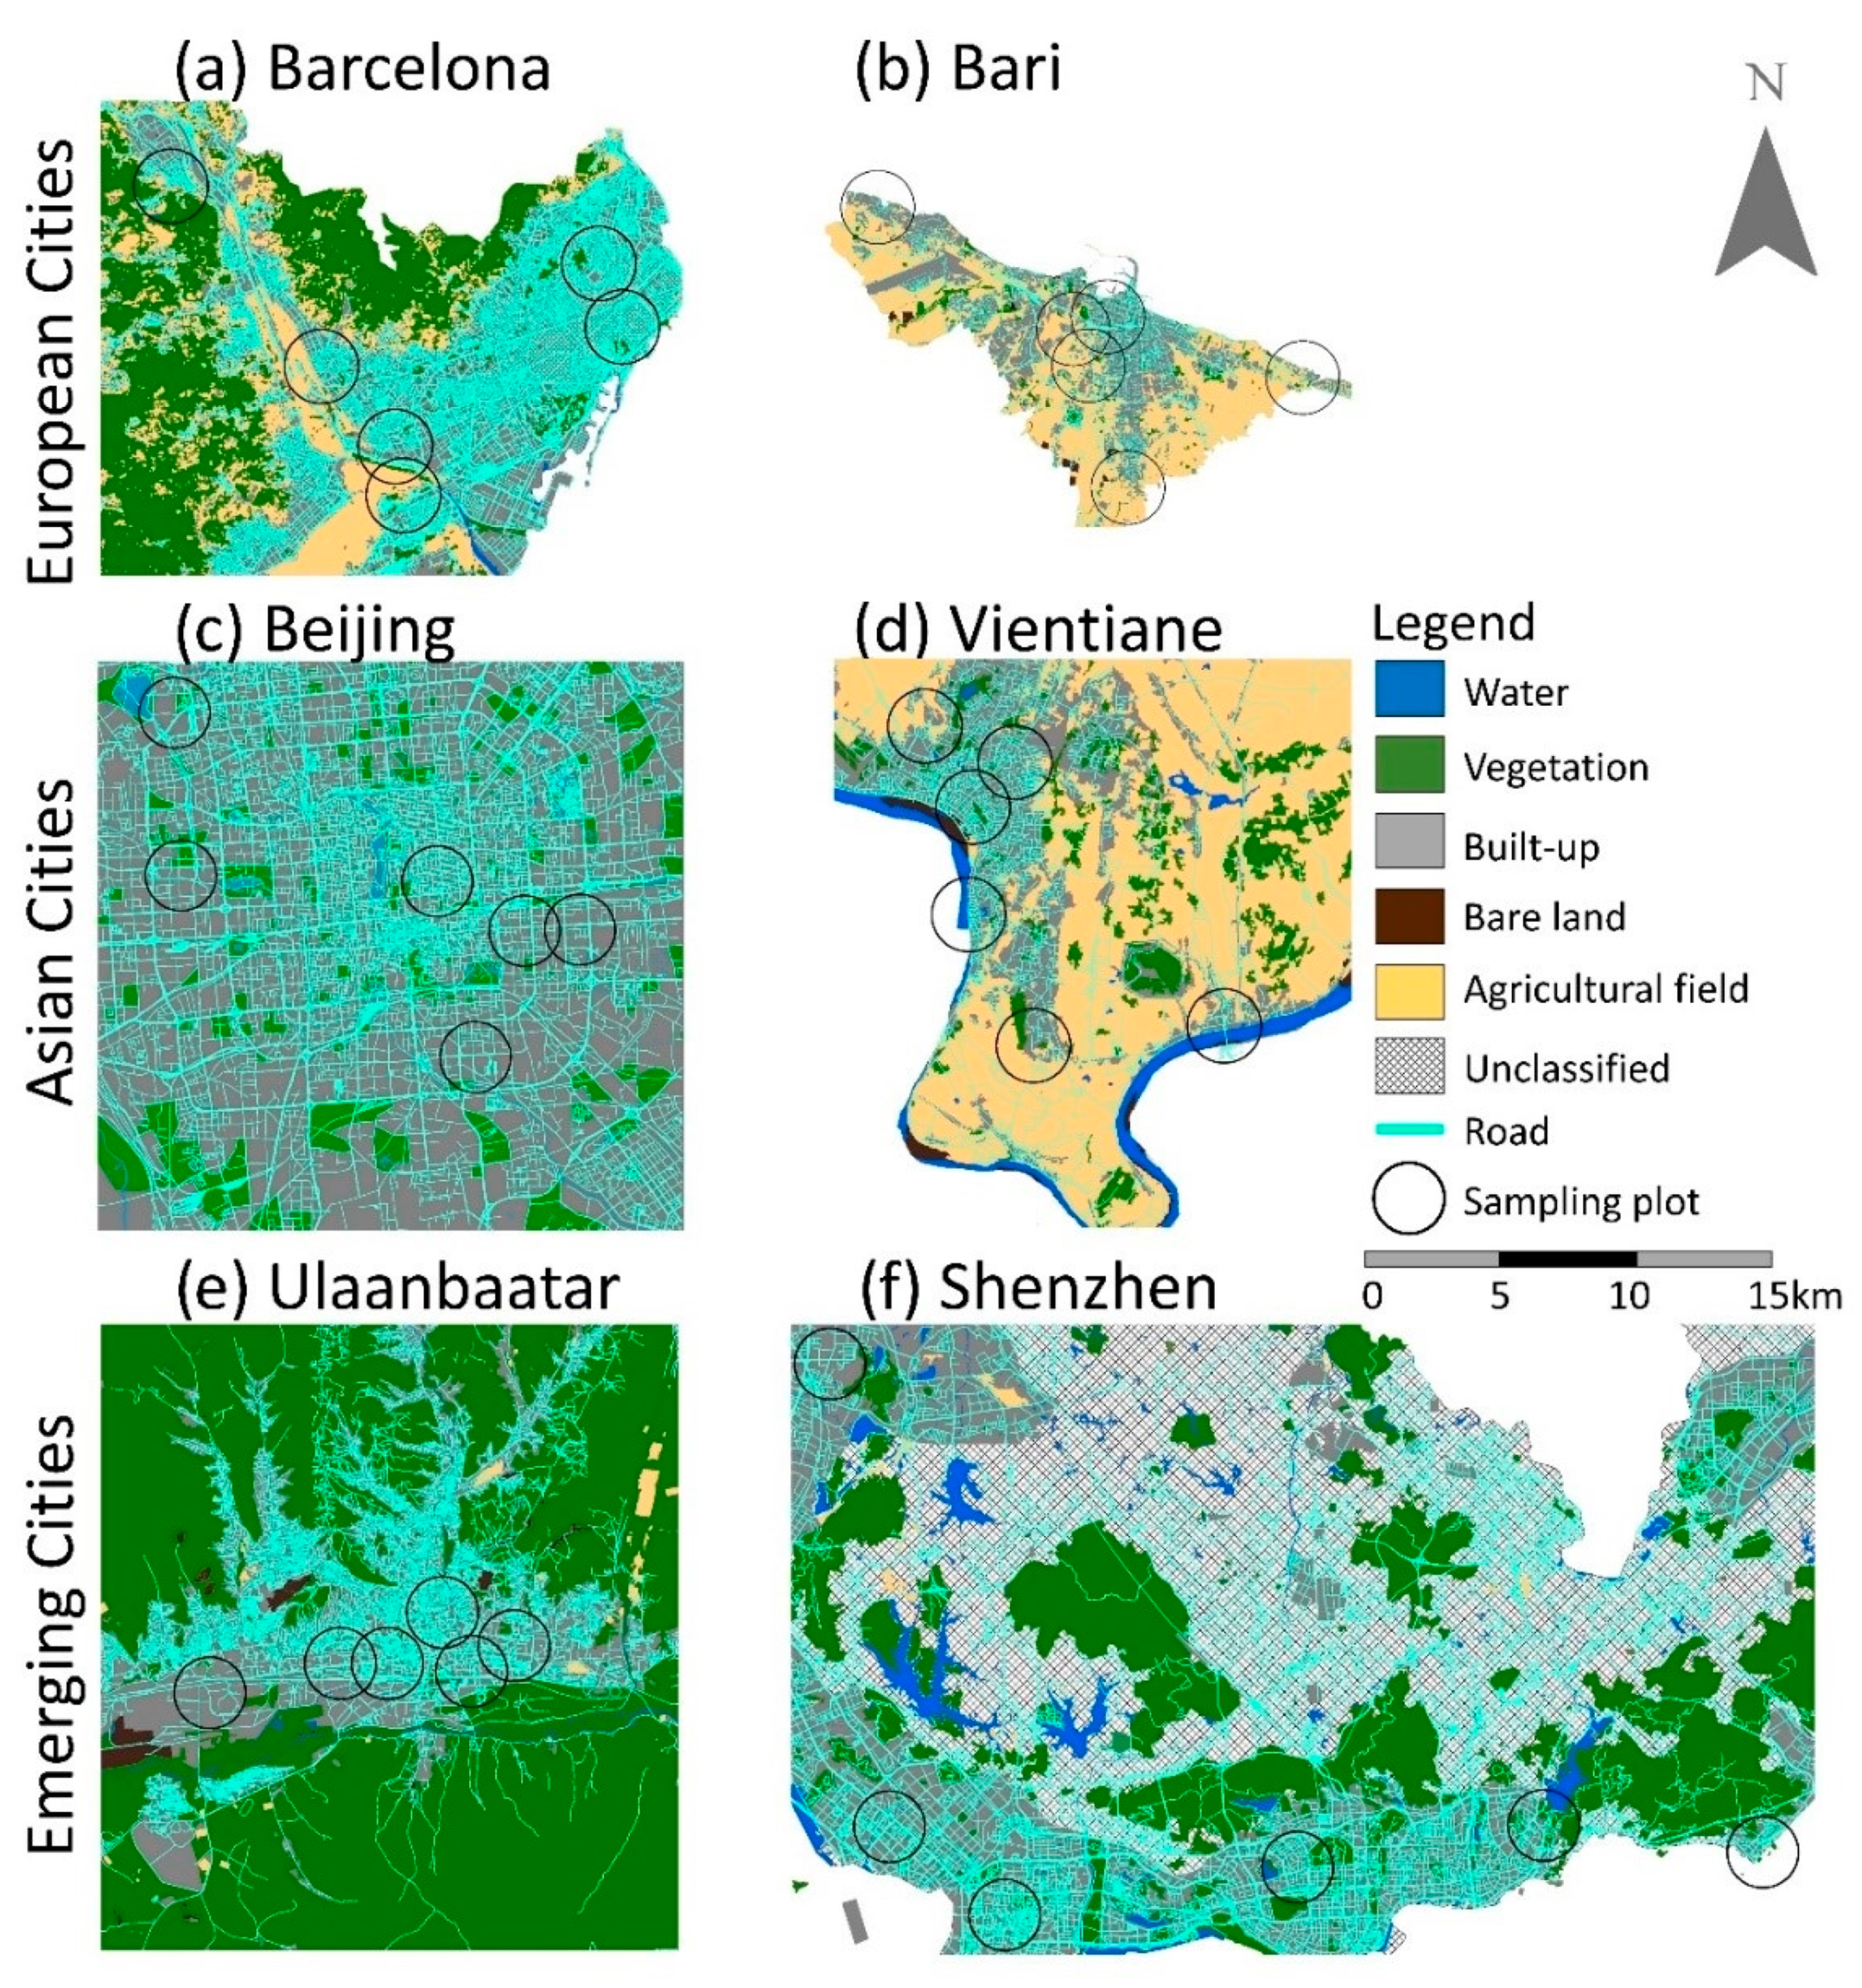
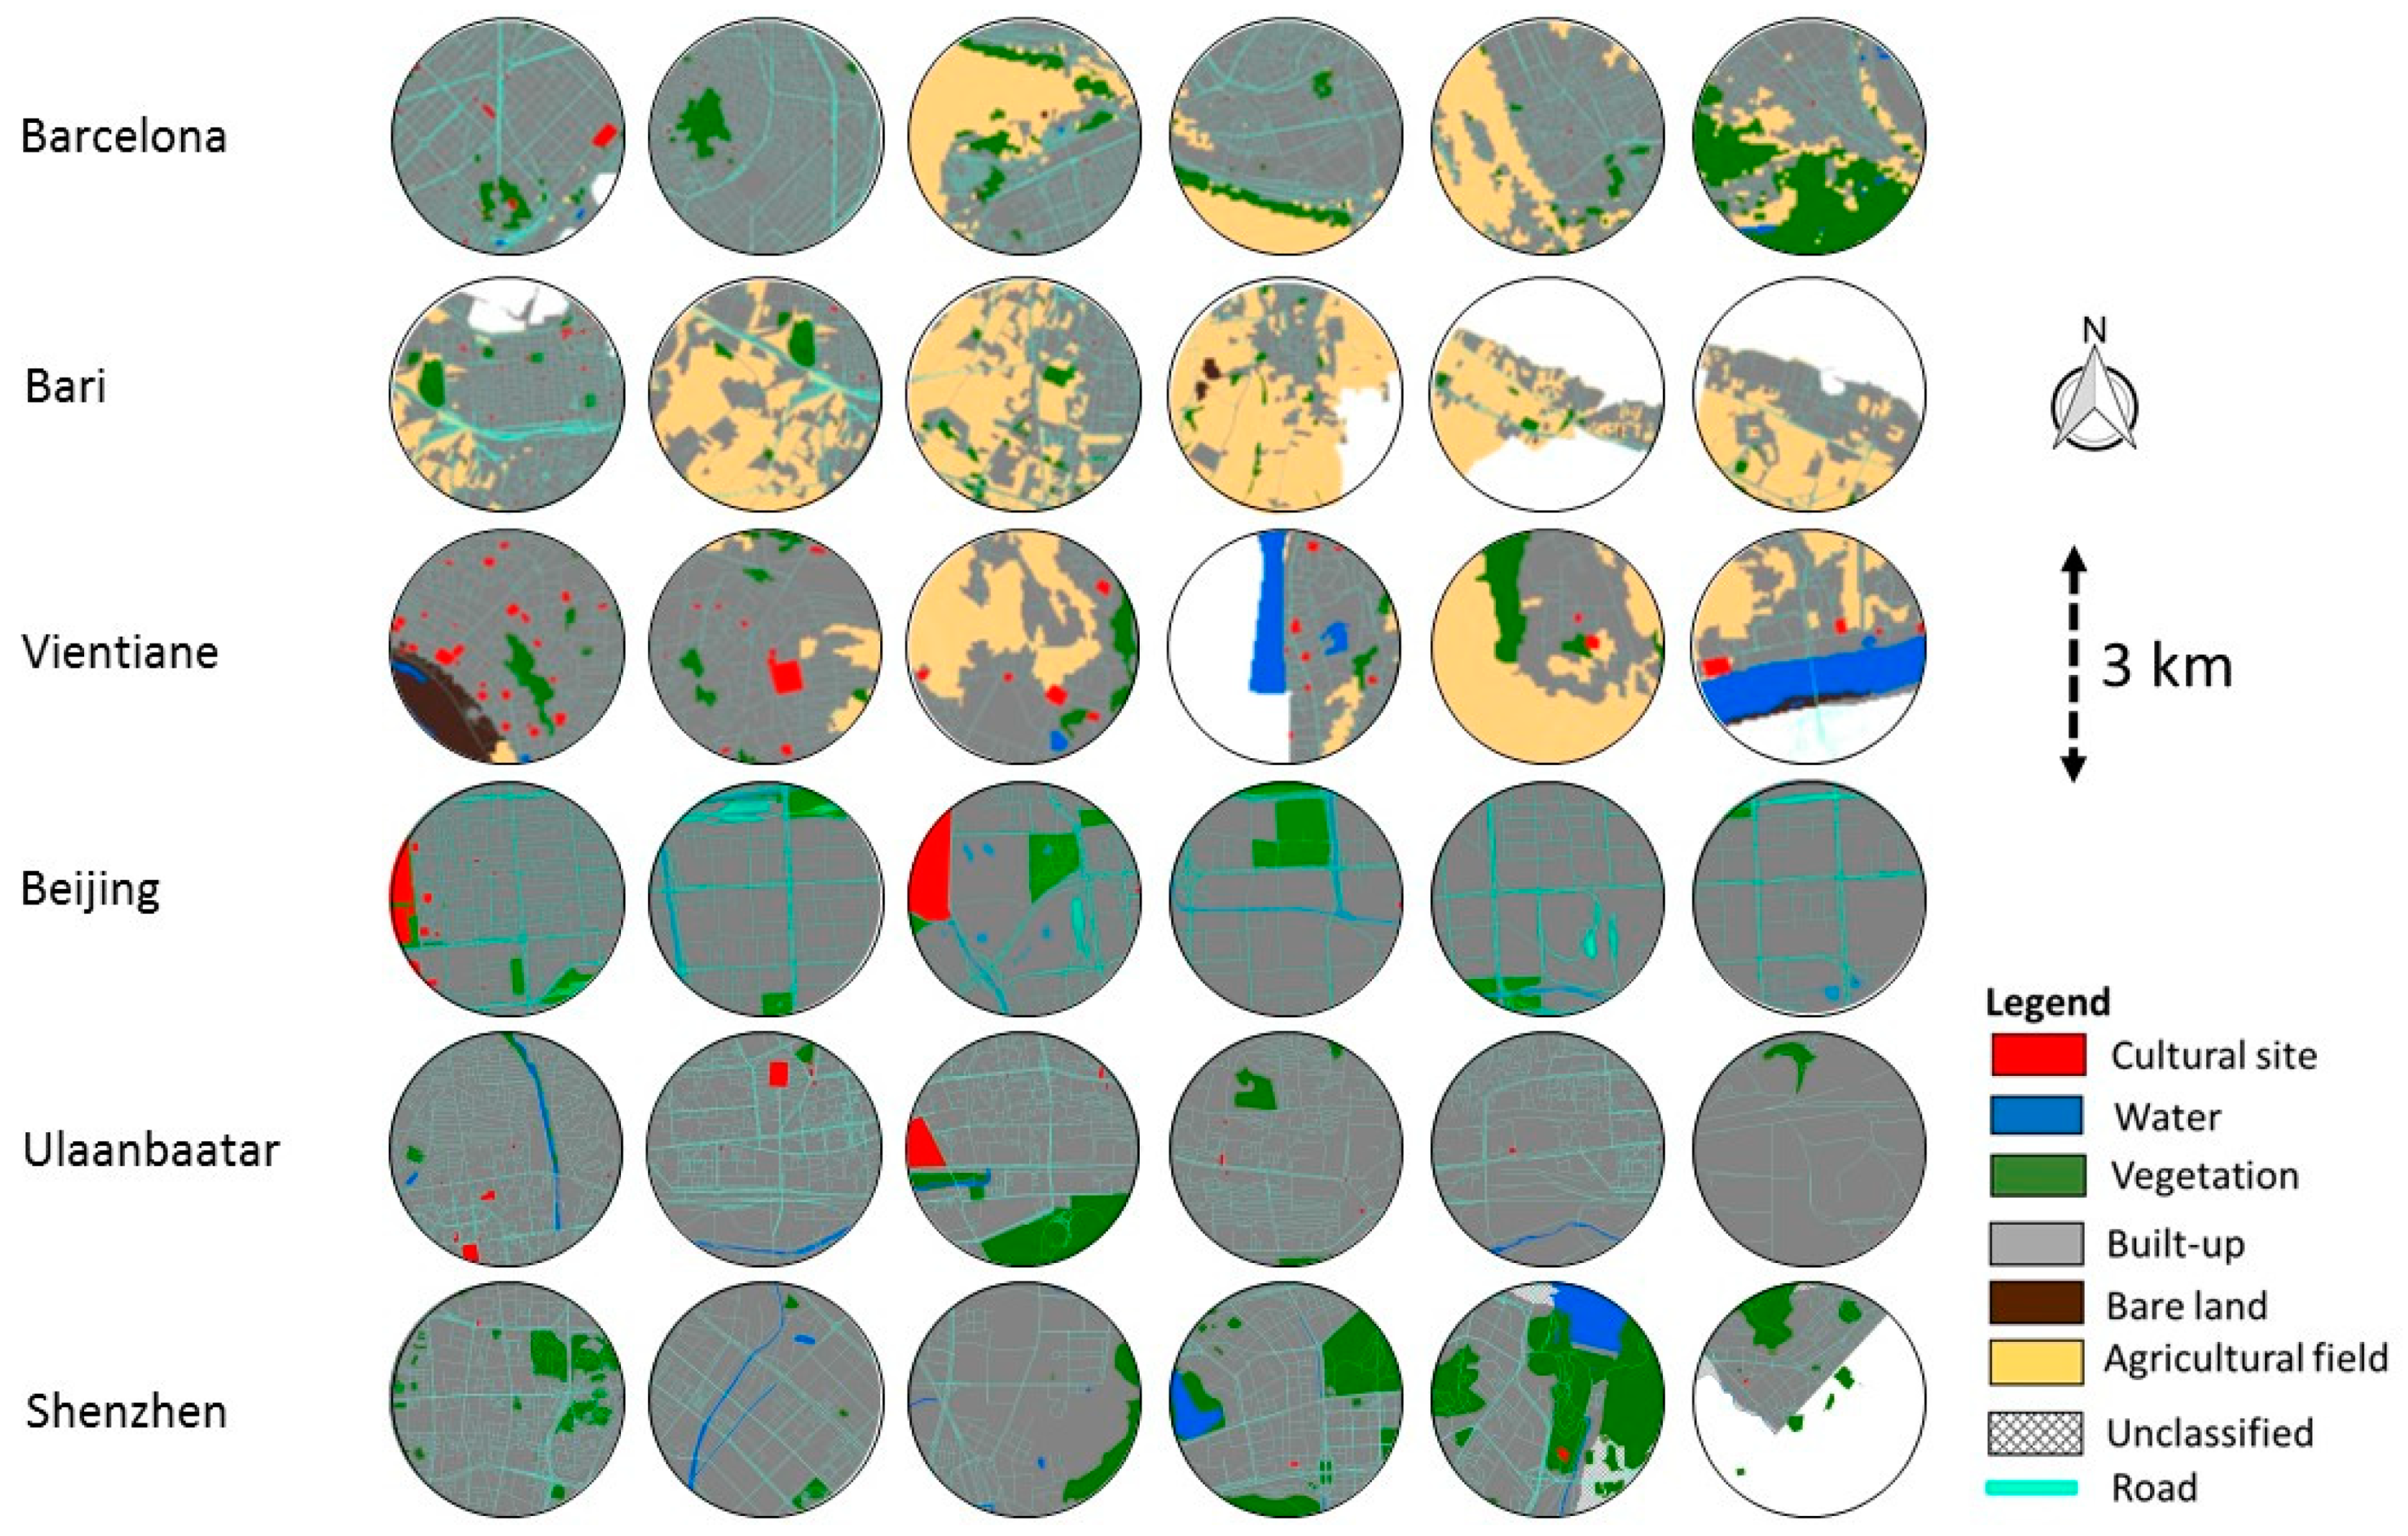
An ideal approach to disentangling the roles of cultural landmarks would be to analyze the complete coverage (i.e., land cover) of cities by digitizing all urban features into a geospatial format. However, this daunting task would take an enormous amount of work to record detailed features over a 150-year study period. Such data is also not readily available for any of the cities. Instead, we designed an unbiased sampling strategy to examine these landscapes. We first allocated twelve randomly generated circular sampling plots with 3-km diameters (i.e., 7.07 km
2). We then consulted with local experts (i.e., academics and residents) to rank the twelve sampling plots based on their cultural importance. We selected the six top-ranked plots in each city for analysis, assuring that the plots did not overlap and were entirely within the administrative boundaries of the city (
Figure 3). This decision to use six plots per city was made because of the large amount of work involved in digitizing all landmarks and identifying their features, and not to over-sample the urban landscapes (i.e., a total area of 12 sampling plots covers ~85 km
2—a relatively large portion of the Vientiane and Bari core areas which are 130 km
2 and 117 km
2, respectively). The spatial identification of cultural landmarks and landscape features (e.g., cover type, amount, roads) were then identified on a 2013 classified cover map. We focused on the number, density, and size of cultural landmarks for this study.
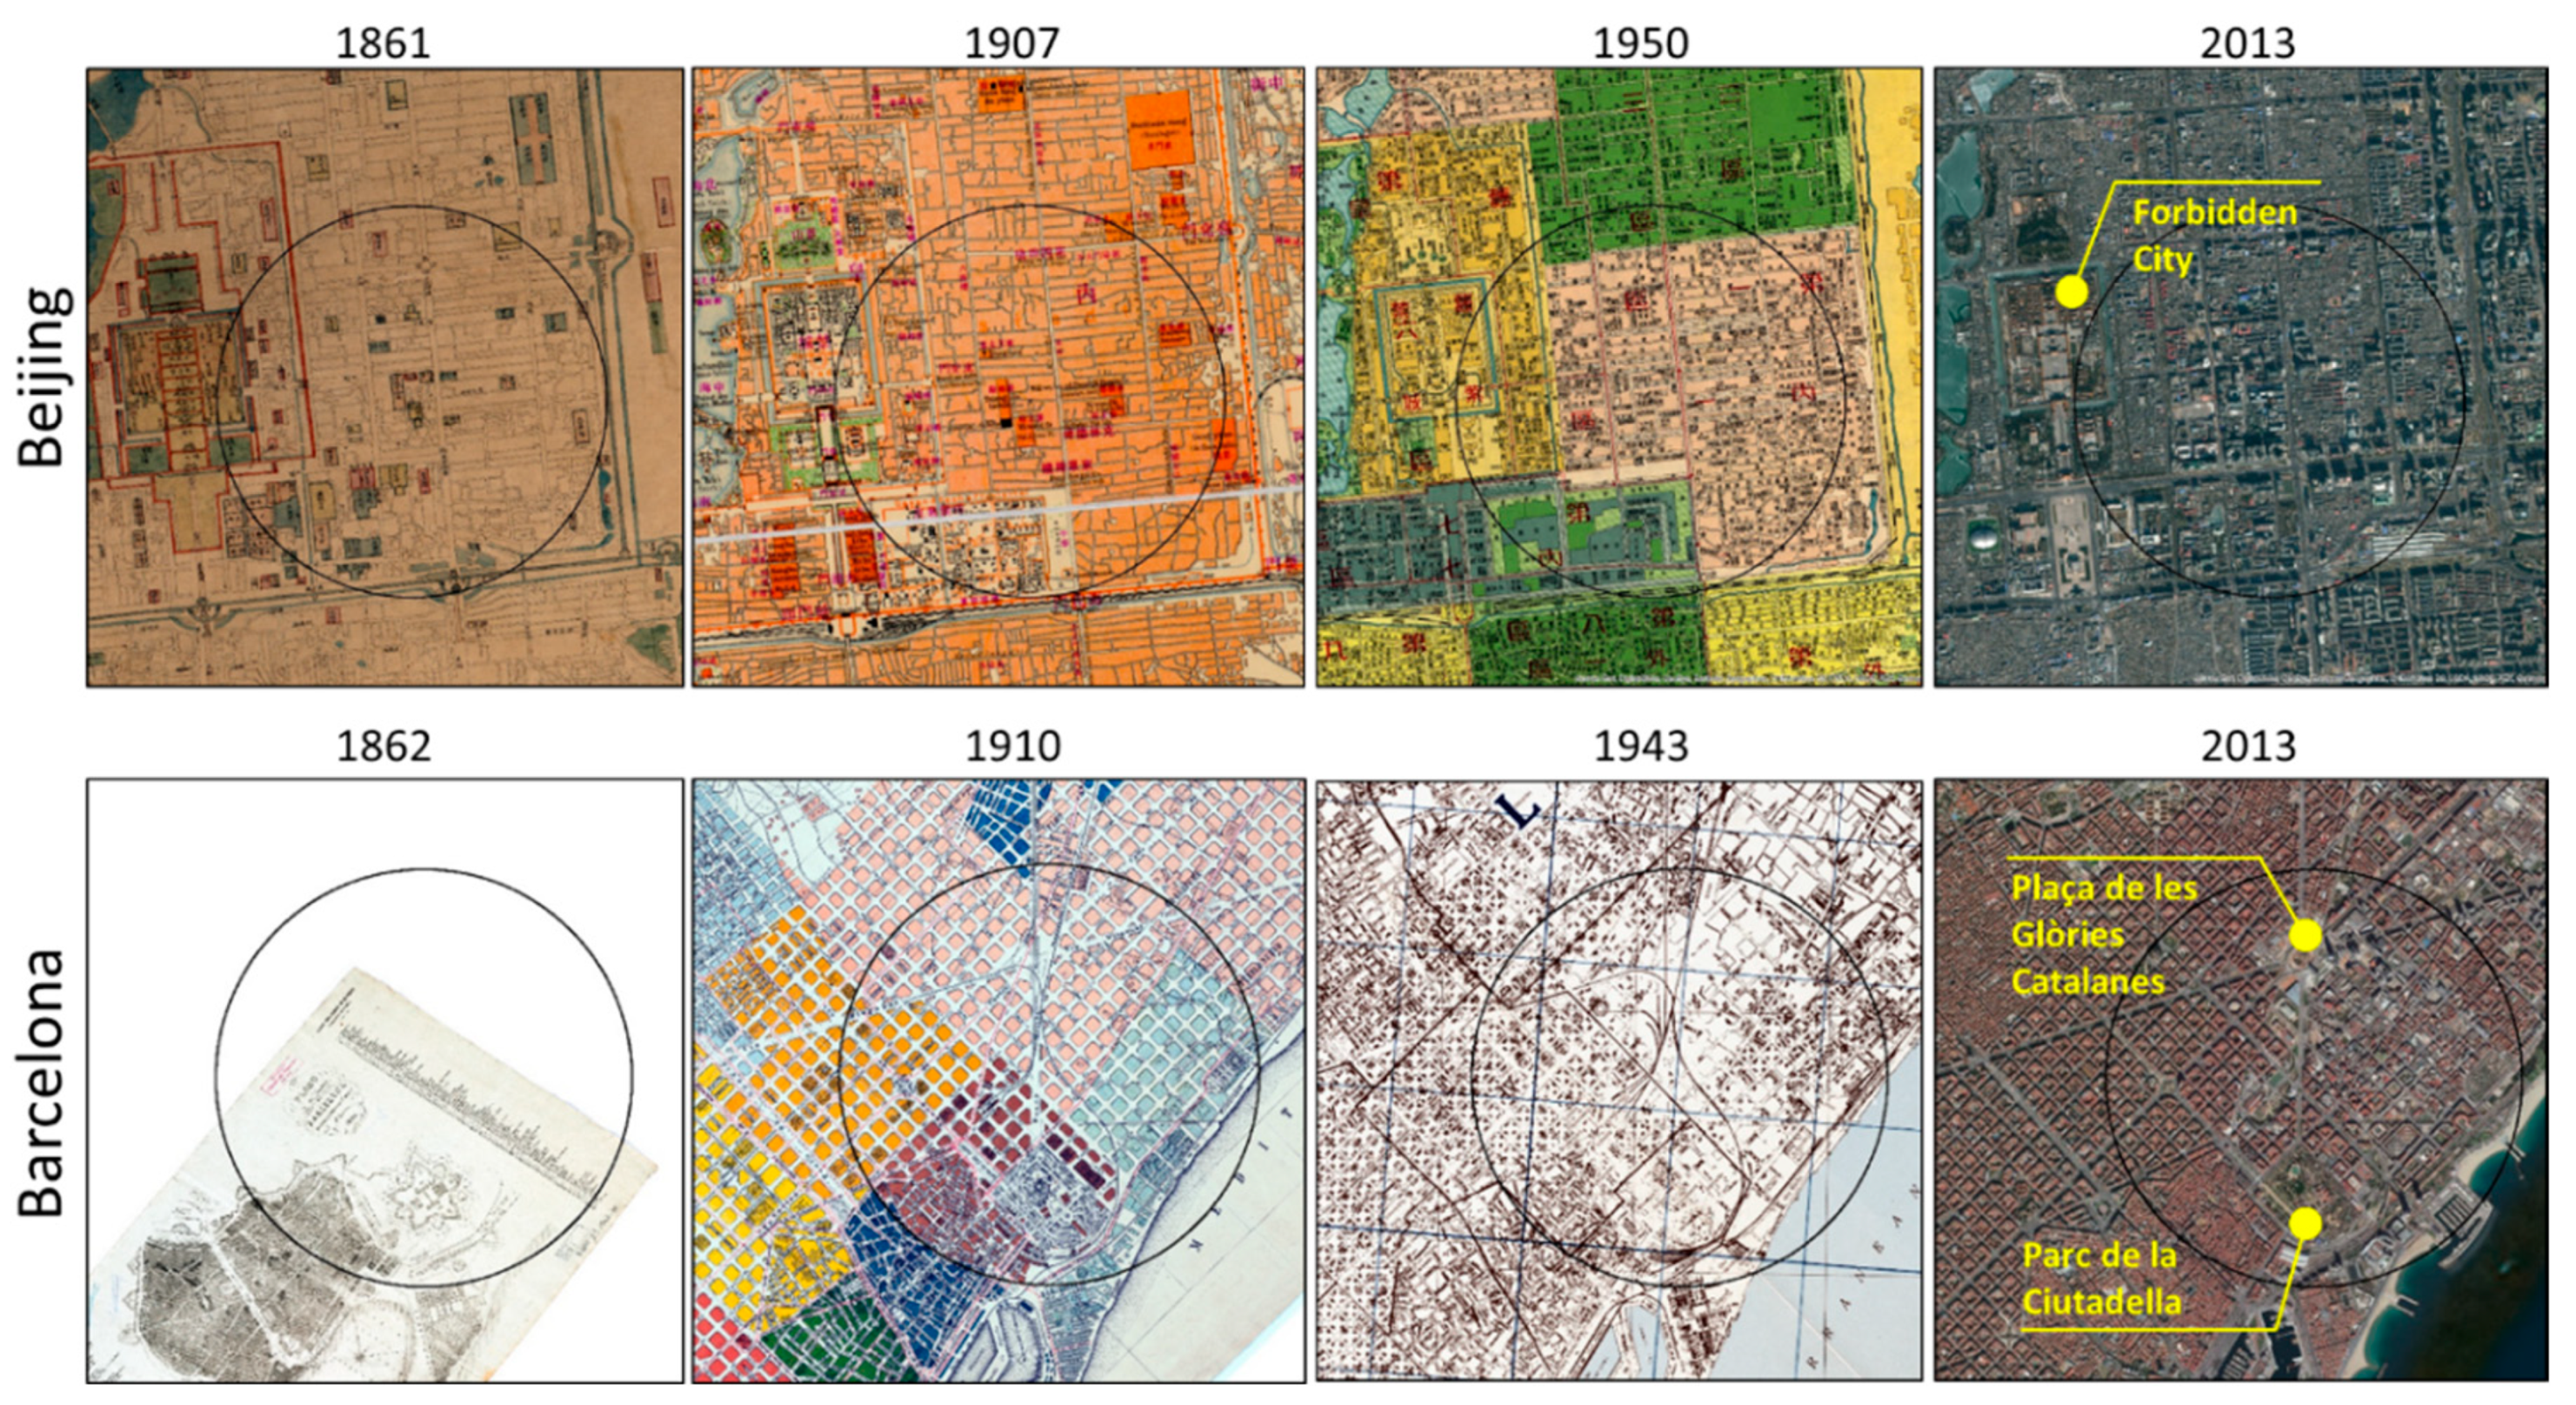
We constructed a landmark database from multiple sources, including archived maps, satellite imagery, and the UNESCO heritage sites (
https://whc.unesco.org/en/list/, accessed on 15 February 2018). The UNESCO database is generally limited to large and/or popular sites, so few smaller sites were counted. The Open Street Map (OSM) database (
https://www.openstreetmap.org/, accessed on 1 March 2018) was digitized for the cultural heritage sites for all 36 sampling plots. We defined cultural landmarks as historically and culturally relevant features at the national and local levels (e.g., churches, temples, historic buildings, and monuments). To consider historical changes in the landscapes surrounding cultural landmarks, we collected the oldest geo-referenced historical maps we could find for Beijing and Barcelona. For Beijing, we found maps from 1861, 1907, and 1950 at Beijing City Lab (
https://www.beijingcitylab.com/, accessed on 1 March 2018) of the Forbidden City—the center of Beijing for hundreds of years. For Barcelona, we located historical maps from 1862, 1910, and 1943 at the Harvard Geospatial Library (
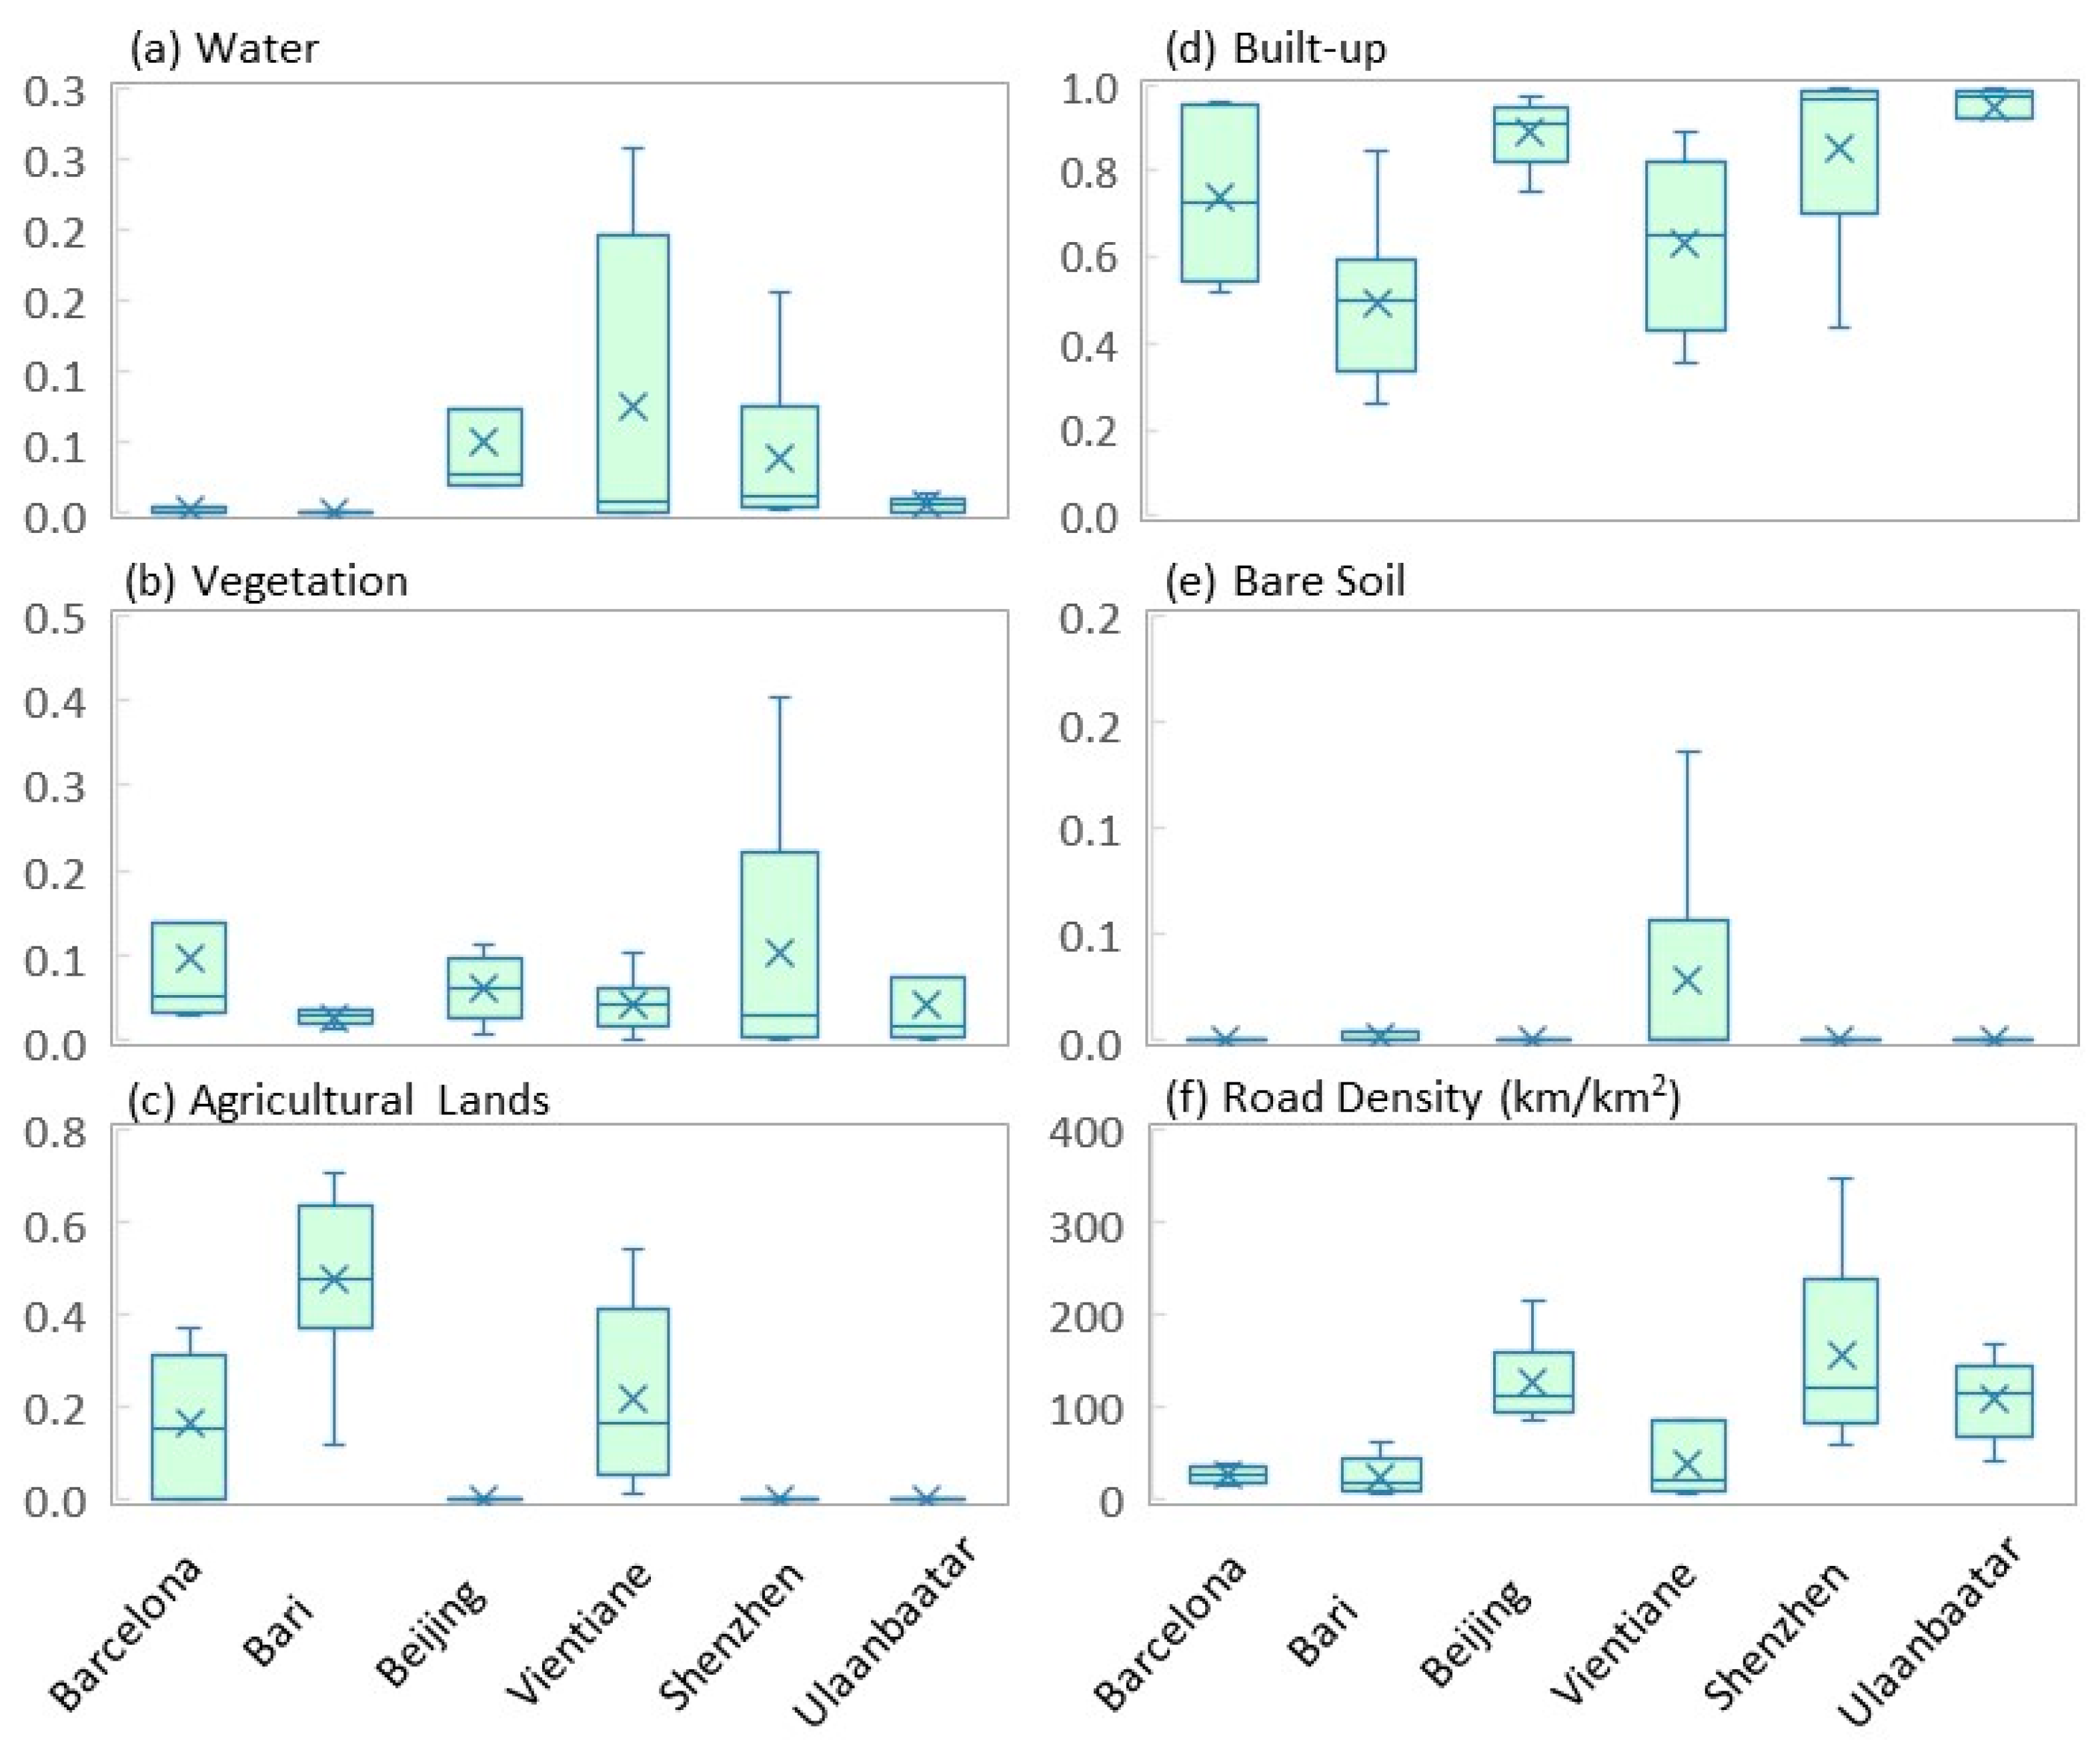
https://hgl.harvard.edu, accessed on 1 March 2018) that were mostly developed around the Plaça de les Glòries Catalanes—the converging hub of Barcelona. We digitized the landscapes of these two sampling plots for their centennial changes. We then integrated spatial data into the landmark database. The land cover data are a series of classified images retrieved from Landsat TM for Ulaanbaatar (2013), Barcelona (2010), Beijing (2010), Vientiane (2010), Shenzhen (2010), and Bari (2006) at 30 m spatial resolution. By using a supervised classification method through iterative procedures of validation with ground truths, the classified land cover maps received an overall accuracy of >0.8 Kappa statistics. To make a comparable dataset among the six cities, the land cover data were reclassified into six land cover types: water, vegetation, urban/built-up, bare soil, agricultural land, and roads. It is worth noting that “agricultural lands” among the cities vary substantially in their dominant crop species. In Bari and Barcelona, for example, they are dominated by olive tree farms, city gardens, or vegetable farms, whereas in Ulaanbaatar they are mostly grazed or harvested grasslands. We extrapolated these cover types for each of the 36 sampling plots for landscape composition and structure. Within each plot, we calculated the number of cultural landmarks, total areas, and density. Finally, we examined the relationships between measures of cultural landmarks and the amount of major cover types and road density.
4. Discussion
Cultural heritage sites–dominant cultural landmarks worldwide–in urban areas and surrounding landscapes are intuitively connected throughout human history and across global land surfaces [
33,
34,
35]. The original landscape influences the establishment and evolution of culture, which in turn can shape landscape structure and dynamics. Early humans often selected their settlements with reliable water and food supplies in mind. In the Upper Great Lakes region, for example, prehistoric Native Americans chose sites on bedrock and lowland landscapes and on south-facing slopes along the Great Lakes shorelines [
36]. This selective behavior has lasted through recent European history and into modern times. Similar coupling between culture and landscapes occurred during the origination of agriculture in the Fertile Crescent region, human dispersal across the Eurasian continent [
37,
38], settlements on the Mongolian Plateau [
21,
39], and around the world [
40].
Religions–a major measure of divergent human culture–arguably have some dependency on surrounding landscapes and direct and indirect consequences on the composition, structure, and function of physical landscapes [
41,
42]. For example, Buddhists respect for the value of all life forms may have prevented the extinction of some species (e.g.,
Gingko biloba–a species rediscovered in 1942) [
43] and protected valuable species and old trees in Asian countries [
44,
45], all of which make up part of today’s landscapes. Cultural landmarks are mostly related to native religions and national history. They are often built in populated areas, or their establishment promoted population increases around them that would increase the chances of neighboring areas becoming “urban centers” over time. These landmarks, logically, play important roles in affecting landscape structure, especially in urban areas where future planning must integrate them into future urban landscapes.
Examples of how cultural landmarks affect urban landscape structures are rapidly emerging. Among the 1121 UNESCO heritage sites, 869 (78%) are categorized as cultural landmarks (
https://whc.unesco.org/en/list/stat, accessed on 29 January 2021). A great example is the development of Olympic Park in Beijing, which was installed along the traditional north–south meridian of the Forbidden City [
46], following the tradition of having the park and major infrastructure facing south. This cultural tradition has been practiced in many Asian countries [
46], resulting in grid road networks and checkerboard landscapes (
Figure 3 and
Figure 6) [
47]. In contrast, in Europe churches and cathedrals have been used as social centers for road and landscape infrastructure (e.g., schools, business shops), resulting in spider web-type urban landscapes, such as in Barcelona (
Figure 6) [
48]. The China Heritage newsletter of the Austrian National University described Beijing’s Overall Urban Planning Program as: “Beijing in 2004 adopted a General Plan for the City of Beijing stipulating that urban planning observe the general principle that the city is crossed both by an east–west and a north–south axis. The east–west axis is demarcated by Chang’an Boulevard, while the axis from south to north runs through the center of Tian’anmen Gate and the Forbidden City, the central axis for Ming city planners. The plan also stipulates that the western part of Beijing will be retained as an “ecological area” while the eastern city will be developed into a business and high-rise residential district”. Clearly, “The exigencies of planning new Beijing in the lead-up to the 2008 Olympics have resulted in a new stress on cultural heritage, as the city scrambles to list and renovate its remaining ancient monuments” (
http://www.chinaheritagequarterly.org, accessed on 25 January 2021). In East and Southeast Asian countries, many small-to-medium Buddhist temples were intentionally distanced from residential development (e.g.,
Figure 1), posing a challenge for the planning of suburban landscapes. These examples and results from this study call for scientific investigations to emphasize the role of cultural landmarks in landscape function and dynamics, including their constraining effect on landscape architecture and planning.
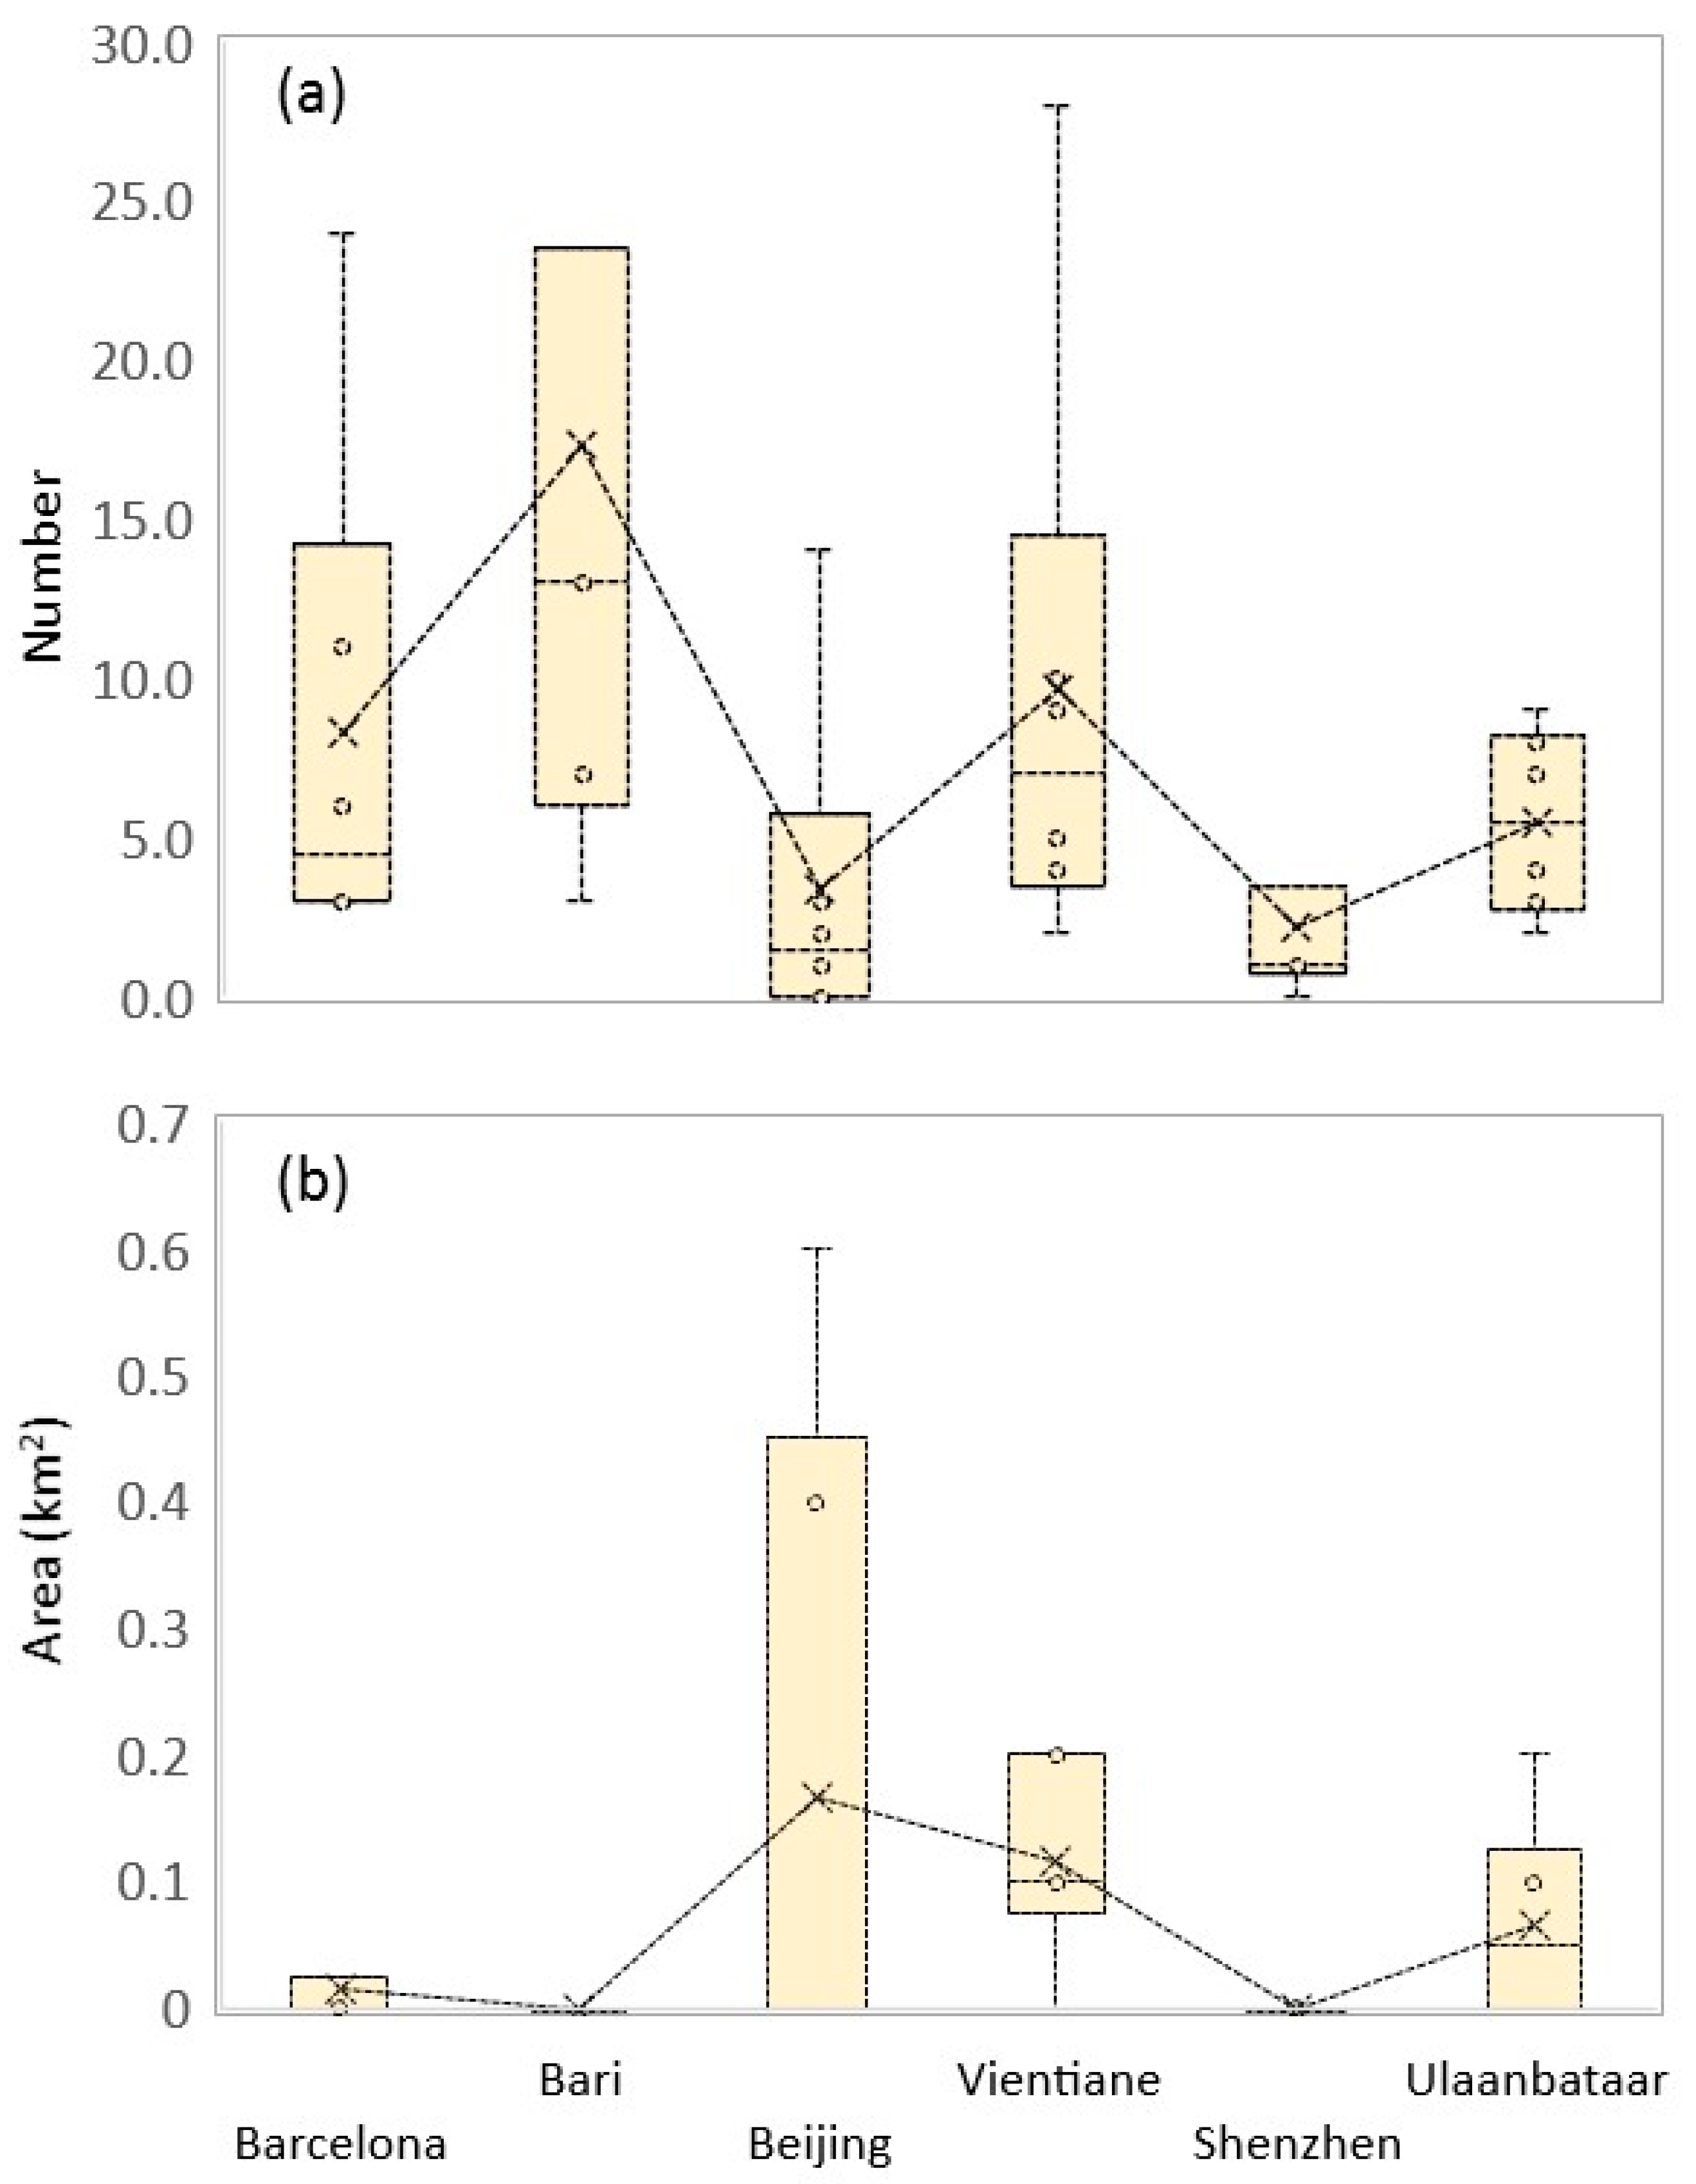
We found clear differences in the number of landmarks and surrounding landscape structures in the six cities with three contrasting cultural societies, which supports our hypothesis. The two European cities have more landmarks. Surprisingly, though Beijing’s landmarks are large, a smaller number of them exist. This could be partially due to the demolition of many historical sites after 1949, elevated demolition of cultural sites during the ten-year cultural revolution (1966–1976), and massive urban built-ups since the 1990s [
47,
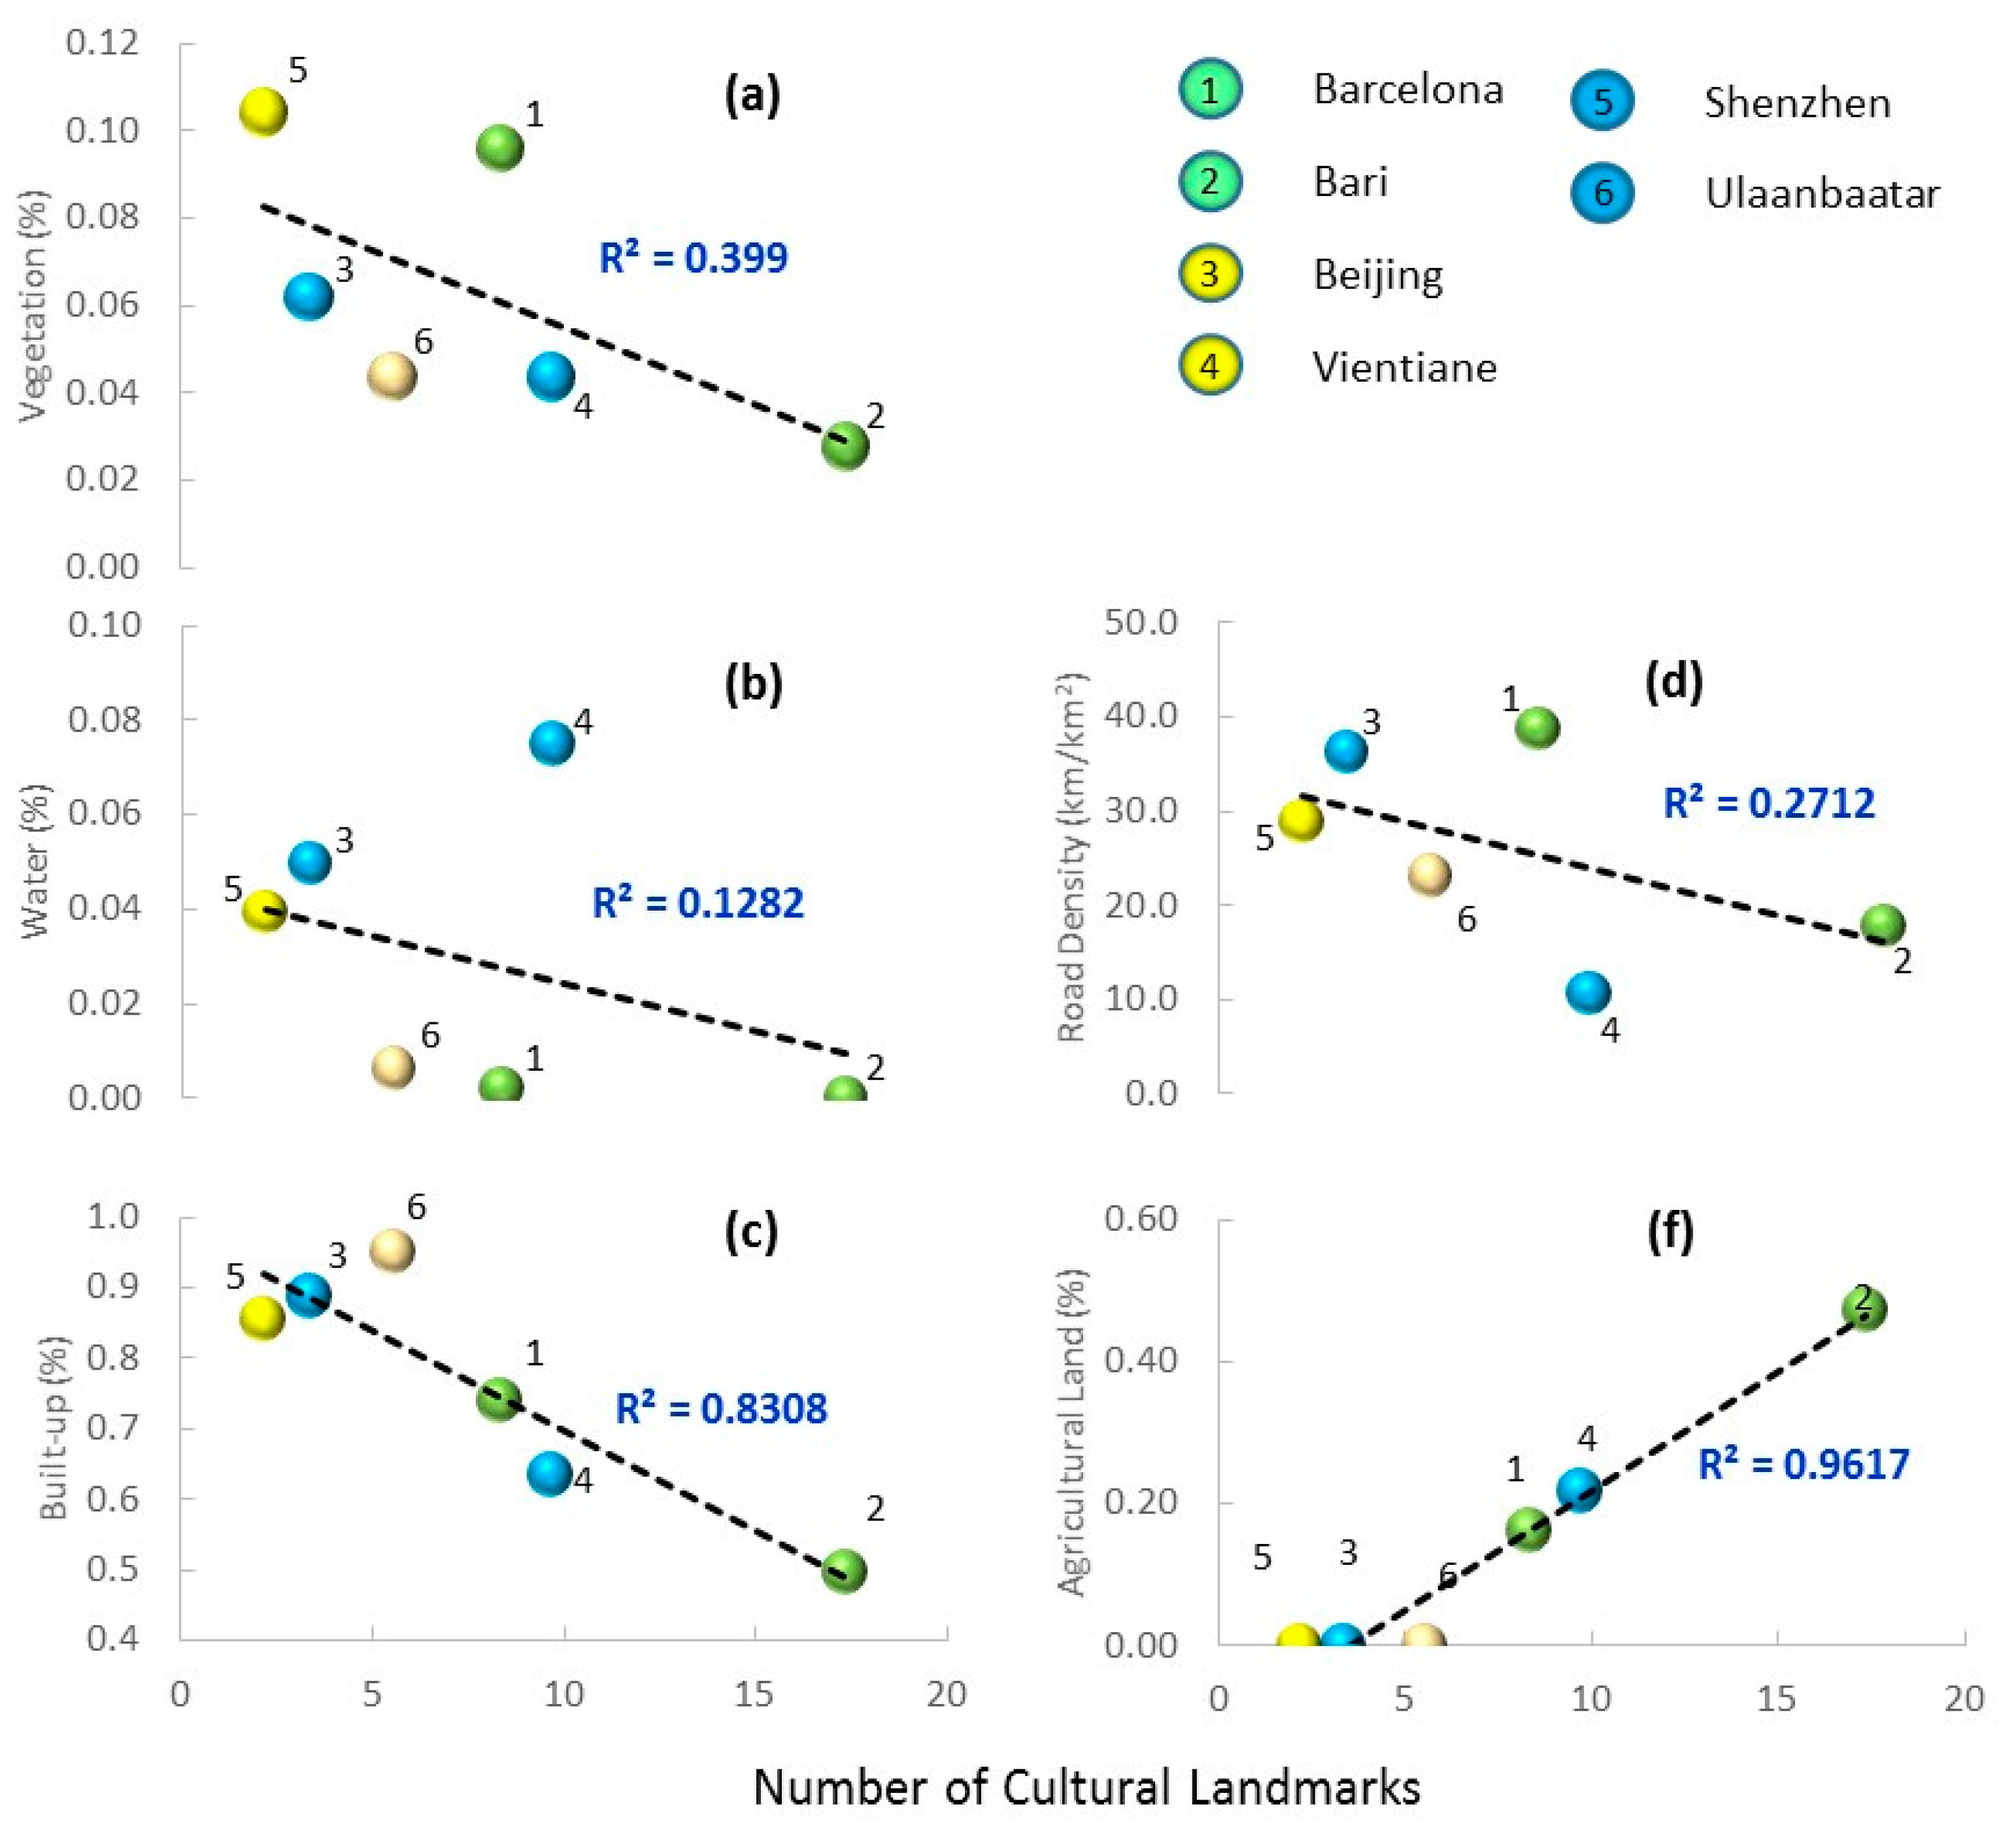
49]. Vientiane, another ancient Buddhist-dominated city, has a high number of cultural landmarks within the sampling plots, indicating a lasting effect of persistent culture over the past 3000+ years. More importantly, we found a negative relationship between the number of cultural landmarks and major cover types, including vegetation, built-ups, and road density, but a positive relationship with agricultural lands (
Figure 8). In other words, landmarks may constrain the establishment of all cover types except agricultural lands (including rangelands in Ulaanbaatar). This conclusion still needs to be confirmed through more surveys of other global cities or future urban landscapes, when a comprehensive database of cultural landmarks becomes available, and using detailed landscape structure [
50].
Back to our experience in Bagan, where the planning committee raised three specific challenges, we would urge the policy makers to consider these challenges as interconnected issues rather than independent problems. As seen in European cases, cultural heritage and modern planning can go hand-in-hand. Without destroying cultural sites, modern urban planning tools and regulations can offer incentives to preserve areas as ‘urban heritage’, and further use them as anchor facilities for the tourism industry. Because Bagan aims at significant growth in the tourism industry, the planning committee could consider the cultural sites as opportunities rather than constraints. Along the same lines, the mitigation of climate risk and the provision of public infrastructures should be embedded into urban planning and historical preservation. Without climate mitigation strategies and proper infrastructure planning, cultural and historical sites risk being degraded or demolished. Finally, the preservation of these historical sites should also be based on a mutual understanding of the importance of cultural heritages among local stakeholders, including government officials, developers, residents, and community leaders. These interconnected issues, however, may not be resolved until we have sufficient knowledge and information about the spatial distribution of the pagodas that are now under UNESCO protection. Clearly, detailed information on cultural heritage sites and urban landscape structures should be assessed first. This information (i.e., data, knowledge) would need to be integrated into urban planning, reflecting on the economic development plan, environmental plan, existing land use, and basic needs (e.g., infrastructure, services, and foods).
Even if a small city is under UNESCO auspices, reliable cultural heritage data are ironically missing. A particular challenge toward a global synthesis of the importance of cultural landmarks in global cities is to establish a geospatial database of all landmarks, including their location, type, age, size, affected buffer zones, policy for management, and future status [
4,
5,
40]. Developing such a database has been started by UNESCO through its urban initiatives. Sporadic databases exist in local cities but have not been thoroughly examined following sound QA/QC protocols. The lack of a global database prevents us from generating comprehensive investigations on the differences among cities, as well as the potential variations among cities with similar cultures. For example, Bari and Barcelona are located in southern Europe. There, historical development and urban layouts differ in many ways from other European cities, regardless of the concurrent dominance of Catholic or Christian religions. Lessons learned from the two study cites should not be interpreted for cities in north or east Europe. Another pressing need is to track historical records (e.g.,
Figure 6). A spatial and temporal database would allow us to perform a global analysis throughout the dynamic history of global urban landscapes. This task is very time-consuming and labor-intensive, and for this reason, prevents us from including more cities and limited our efforts to Barcelona and Beijing for long-term development (
Figure 6).
Landscape structure and composition are not solely influenced by cultural landmarks. Geomorphic settings (e.g., rivers, mountains), past institutional structure (e.g., policies), land tenure, current zoning, and residents’ perceptions can all be responsible for the structure of current landscapes. For example, Ulaanbaatar was limited in its spread to the north bank of the Tuul River until very recently [
18,
20,
29], whereas Vientiane urban expansion ran mostly along the west side of the Mekong River (
Figure 3). Similar constraints have been reported for Lanzhou, which was limited in its growth by the Yellow River and rugged mountains [
51]. Beijing’s urban development in the past has been constrained by the surrounding mountains, but a decreasing role of such physical factors (e.g., elevation and slope) in restricting urban expansion has been reported [
27], likely due to improving technology. Clearly, future investigations on the role of cultural landmarks in shaping urban landscapes need to factor the context of multiple forcing and multiple spatial and temporal scales.


 ,
, 


