
Influence Range and Traffic Risk Analysis of Moving Work Zones on Urban Roads


Abstract
1. Introduction
2. Literature Review
2.1. Impact Assessment of Work Zones
2.2. Management Strategy of Work Zones
3. Simulation Model
4. Analysis of Influence Range of Moving Work Zones
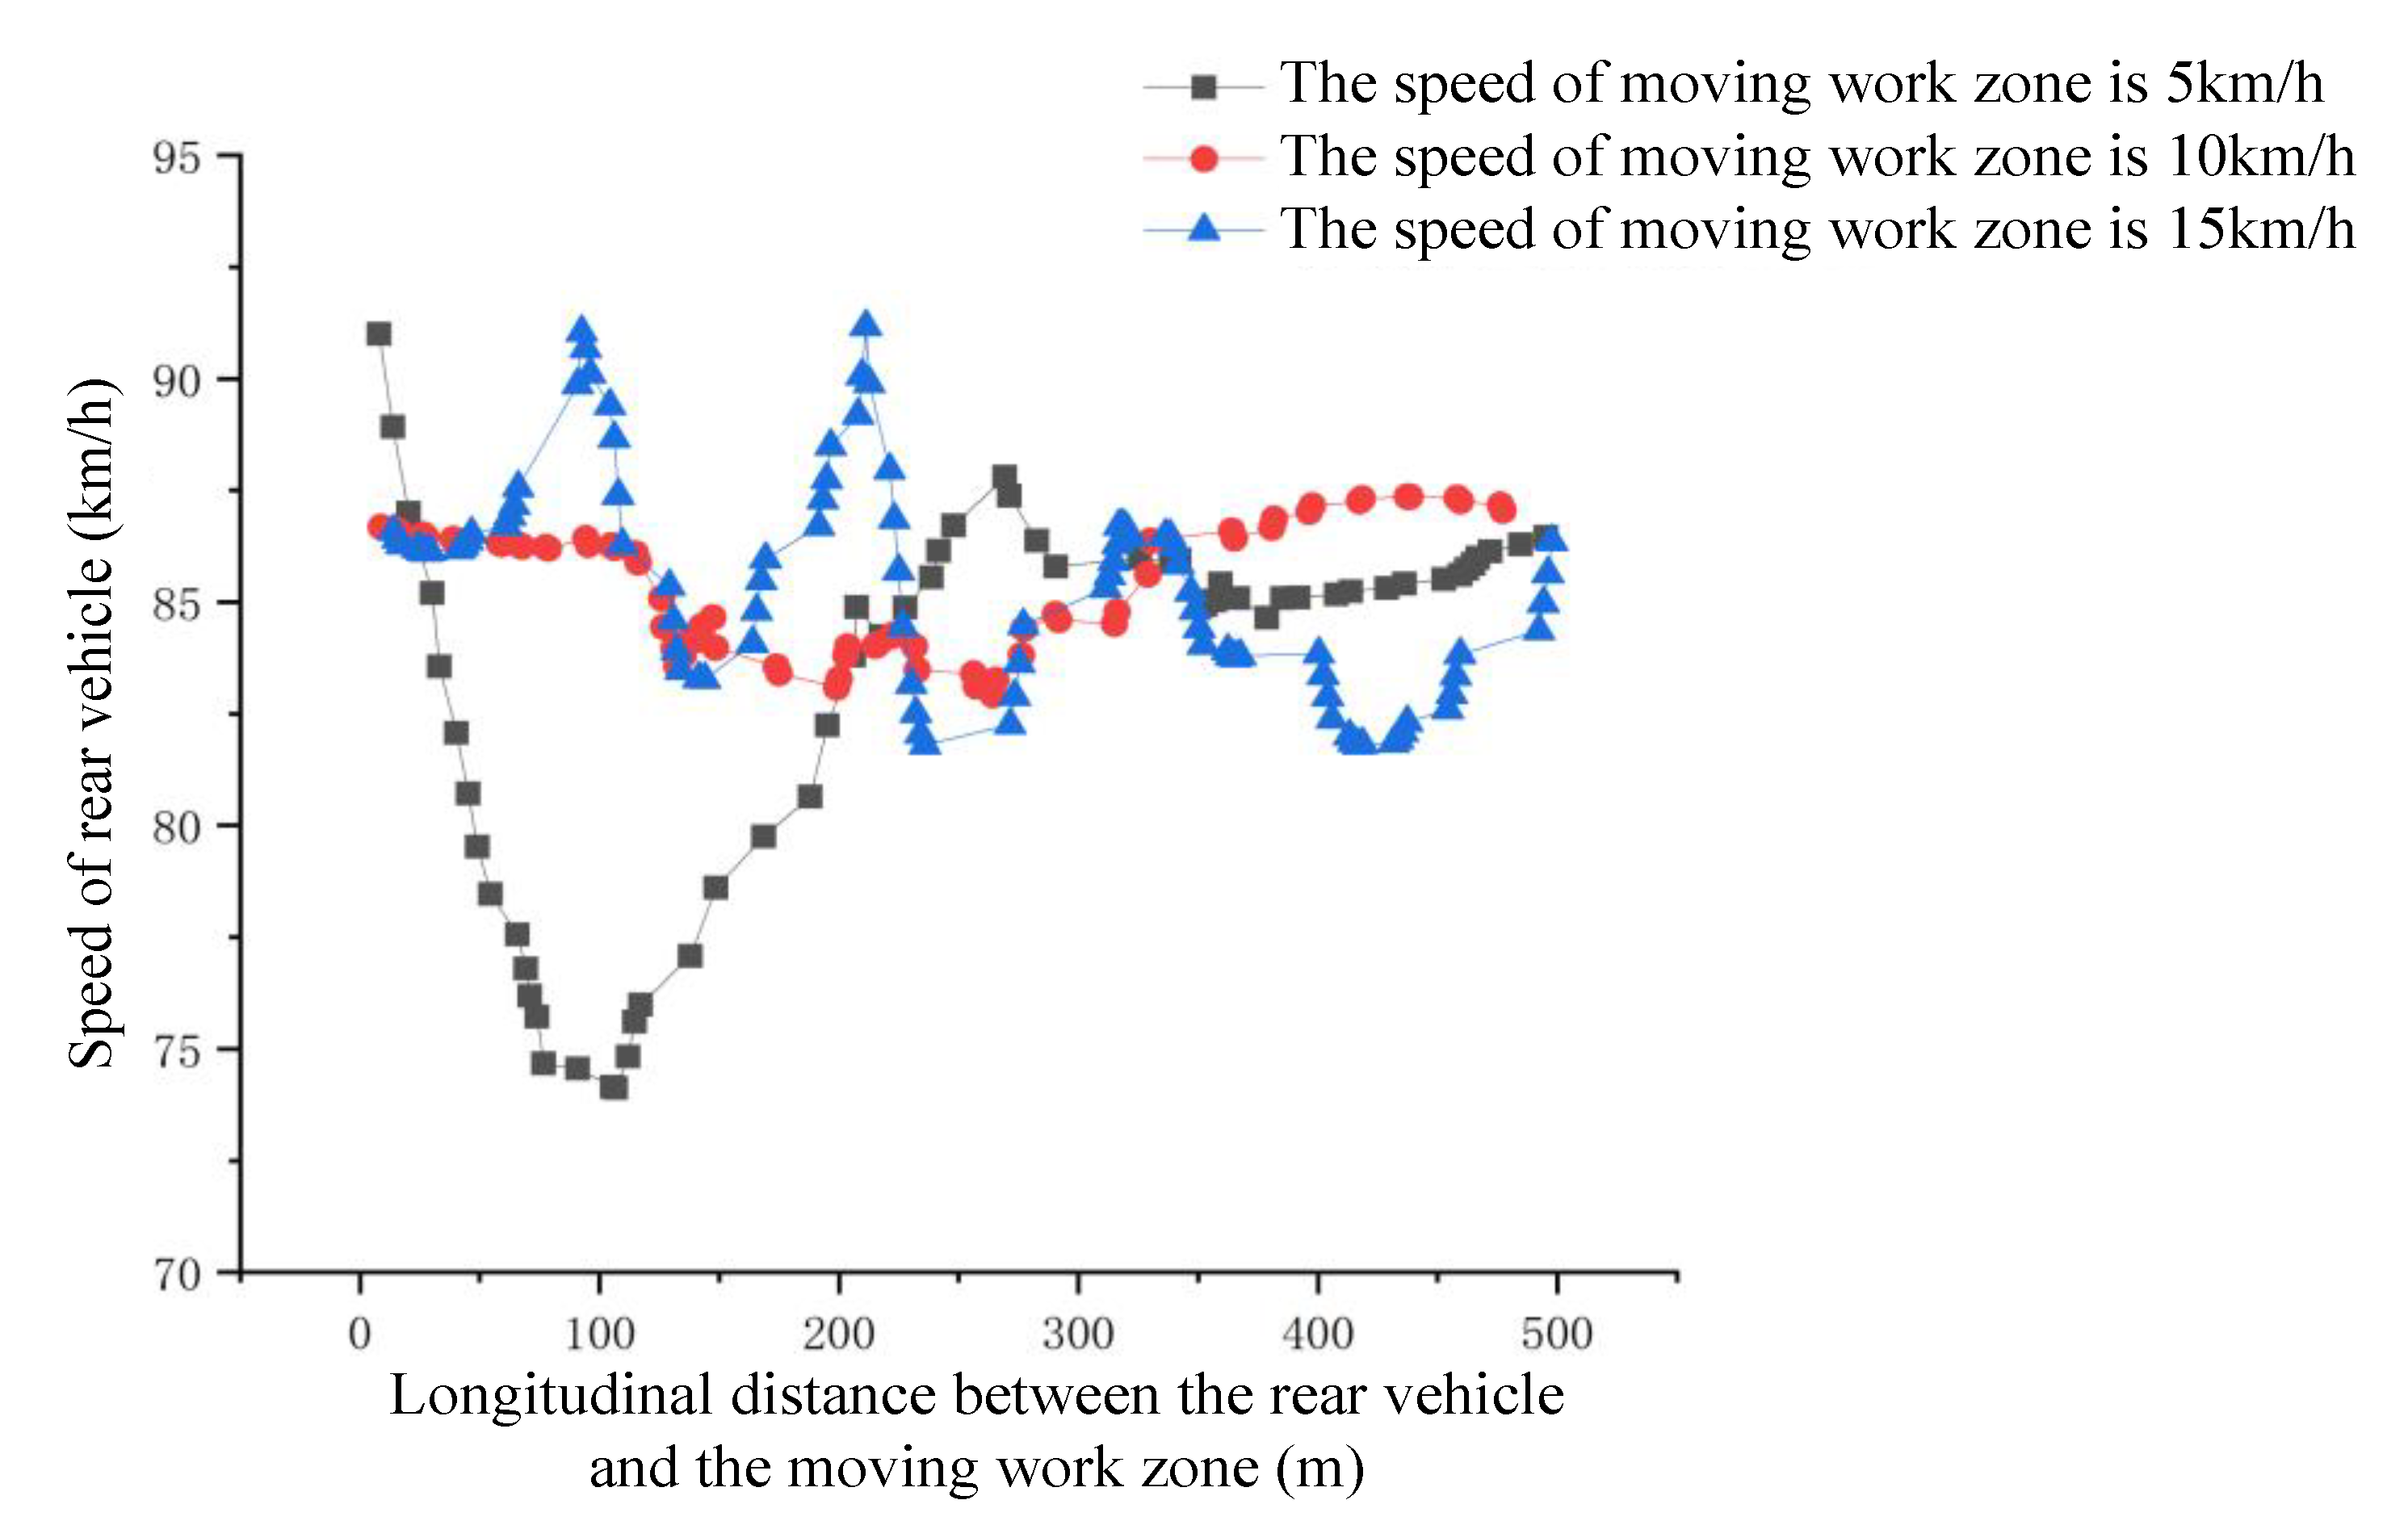
4.1. Left Lane
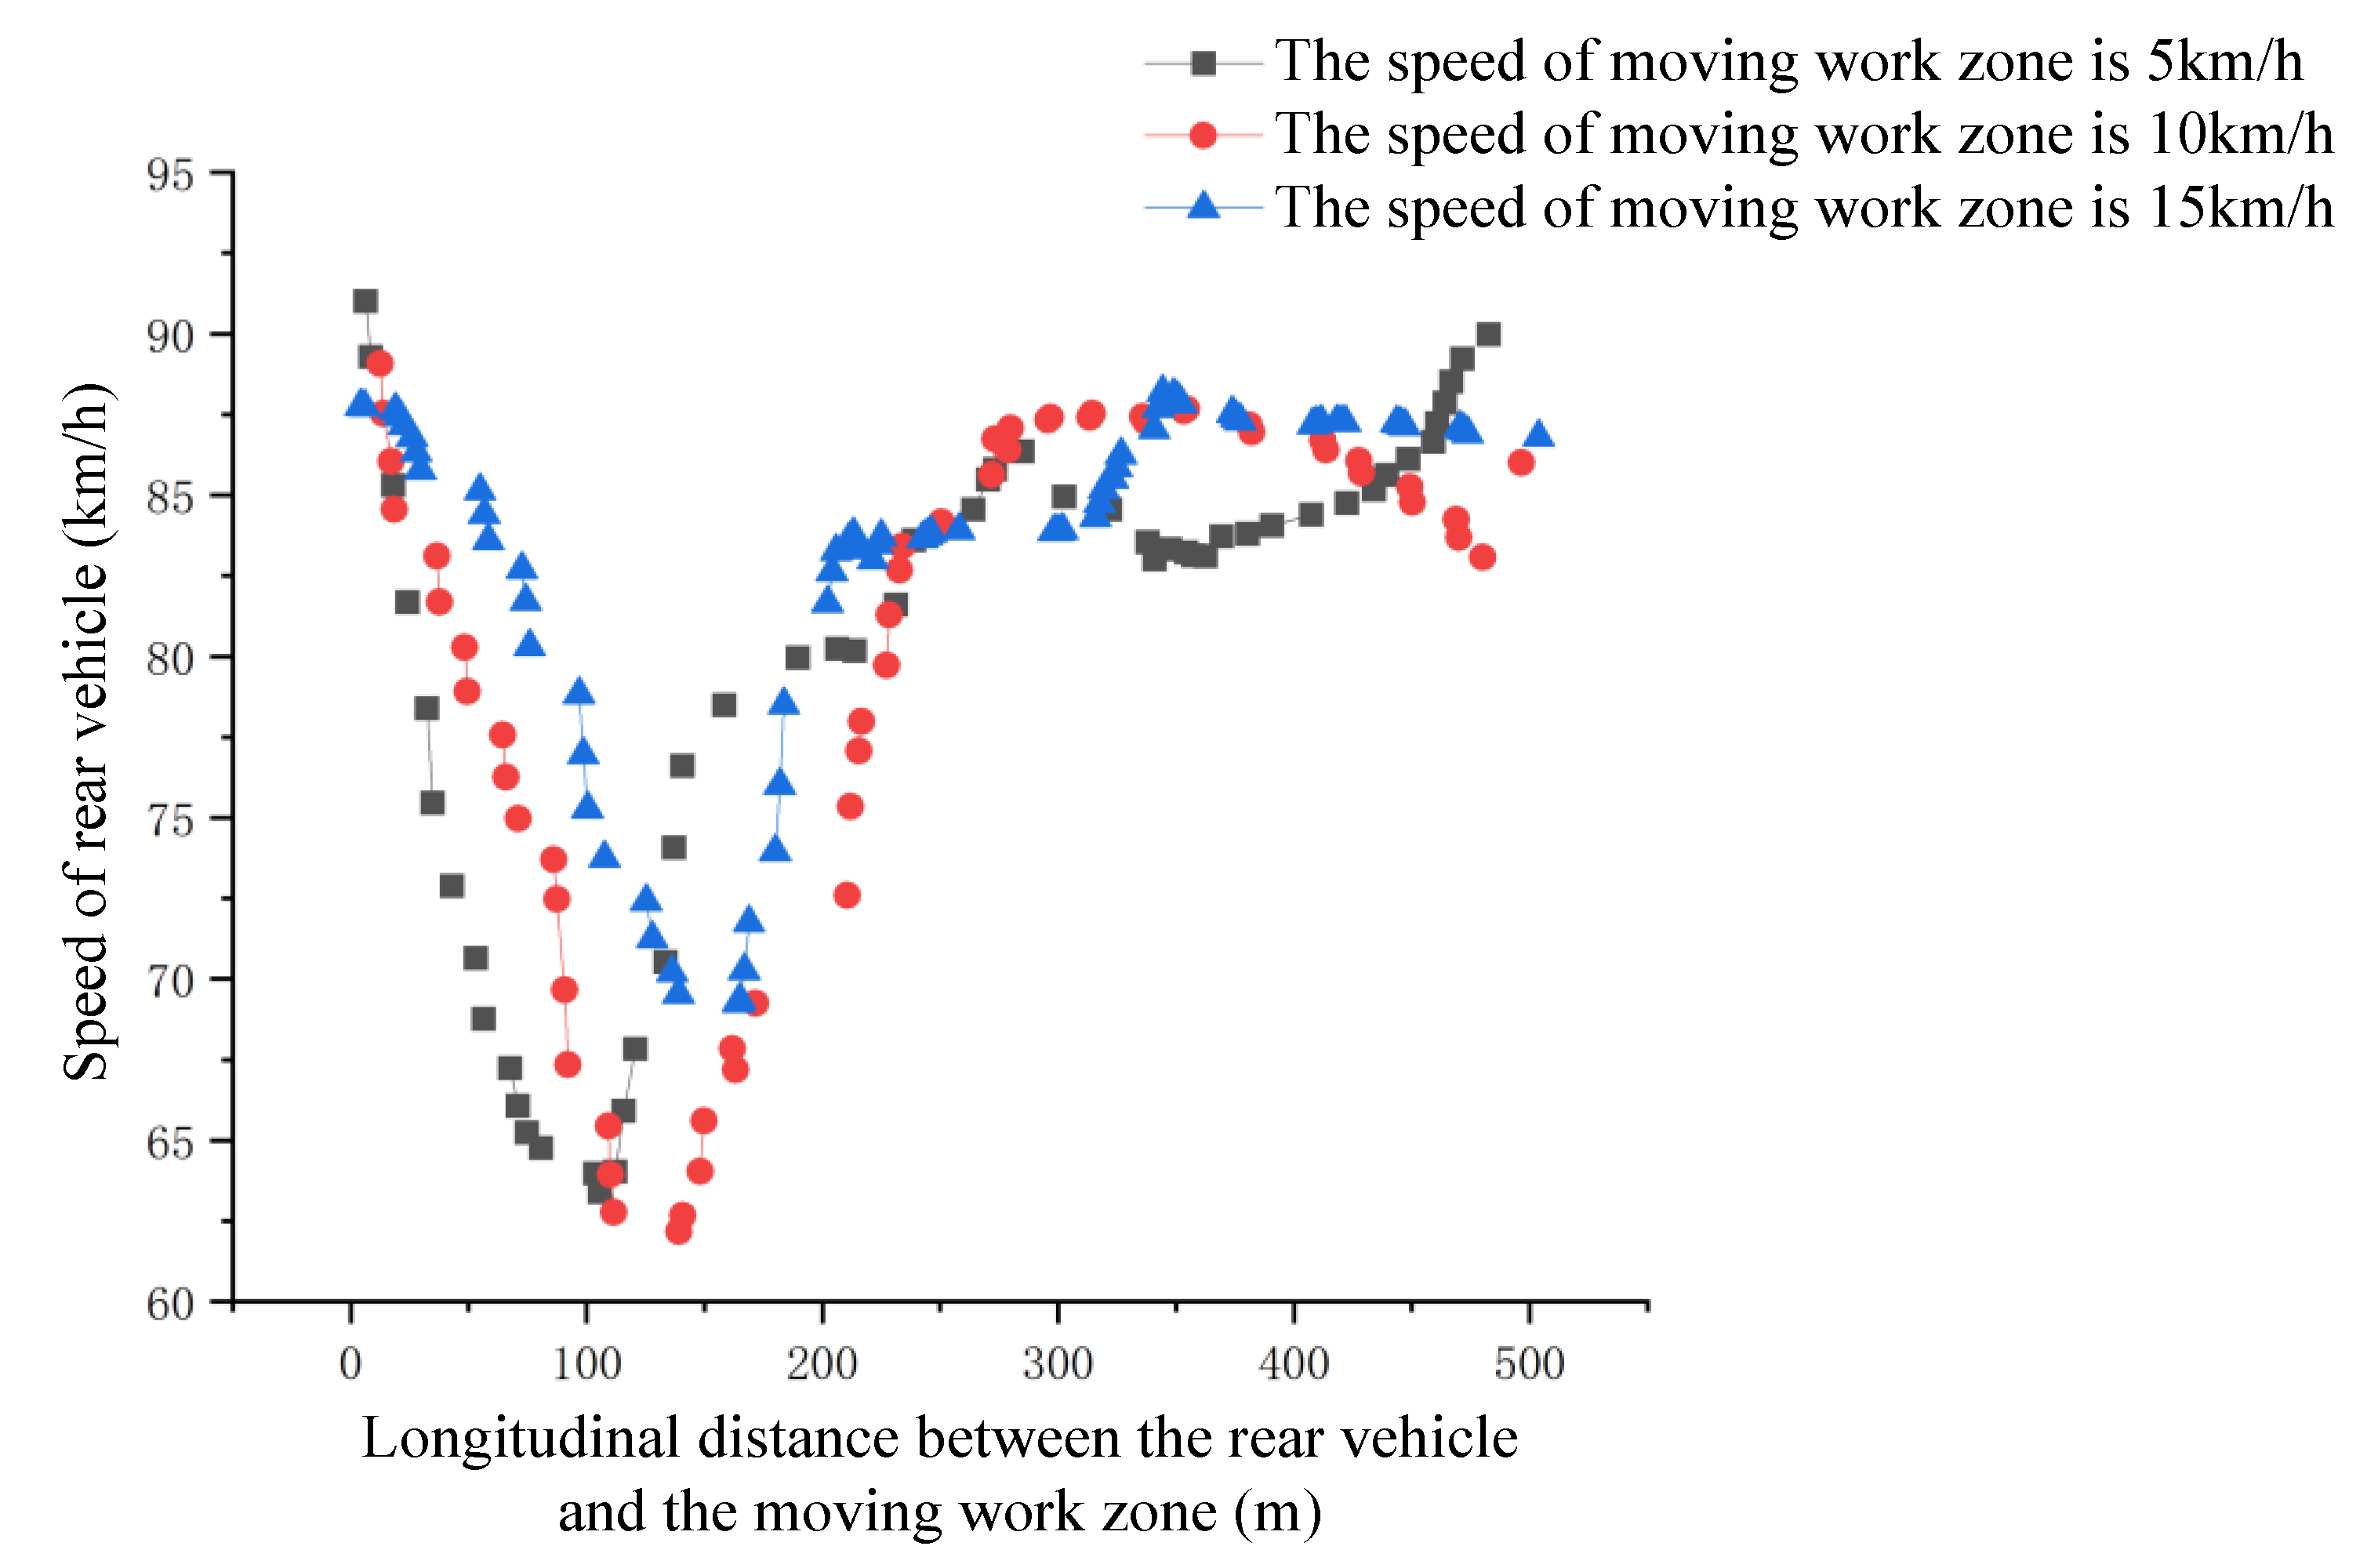
4.2. Middle Lane
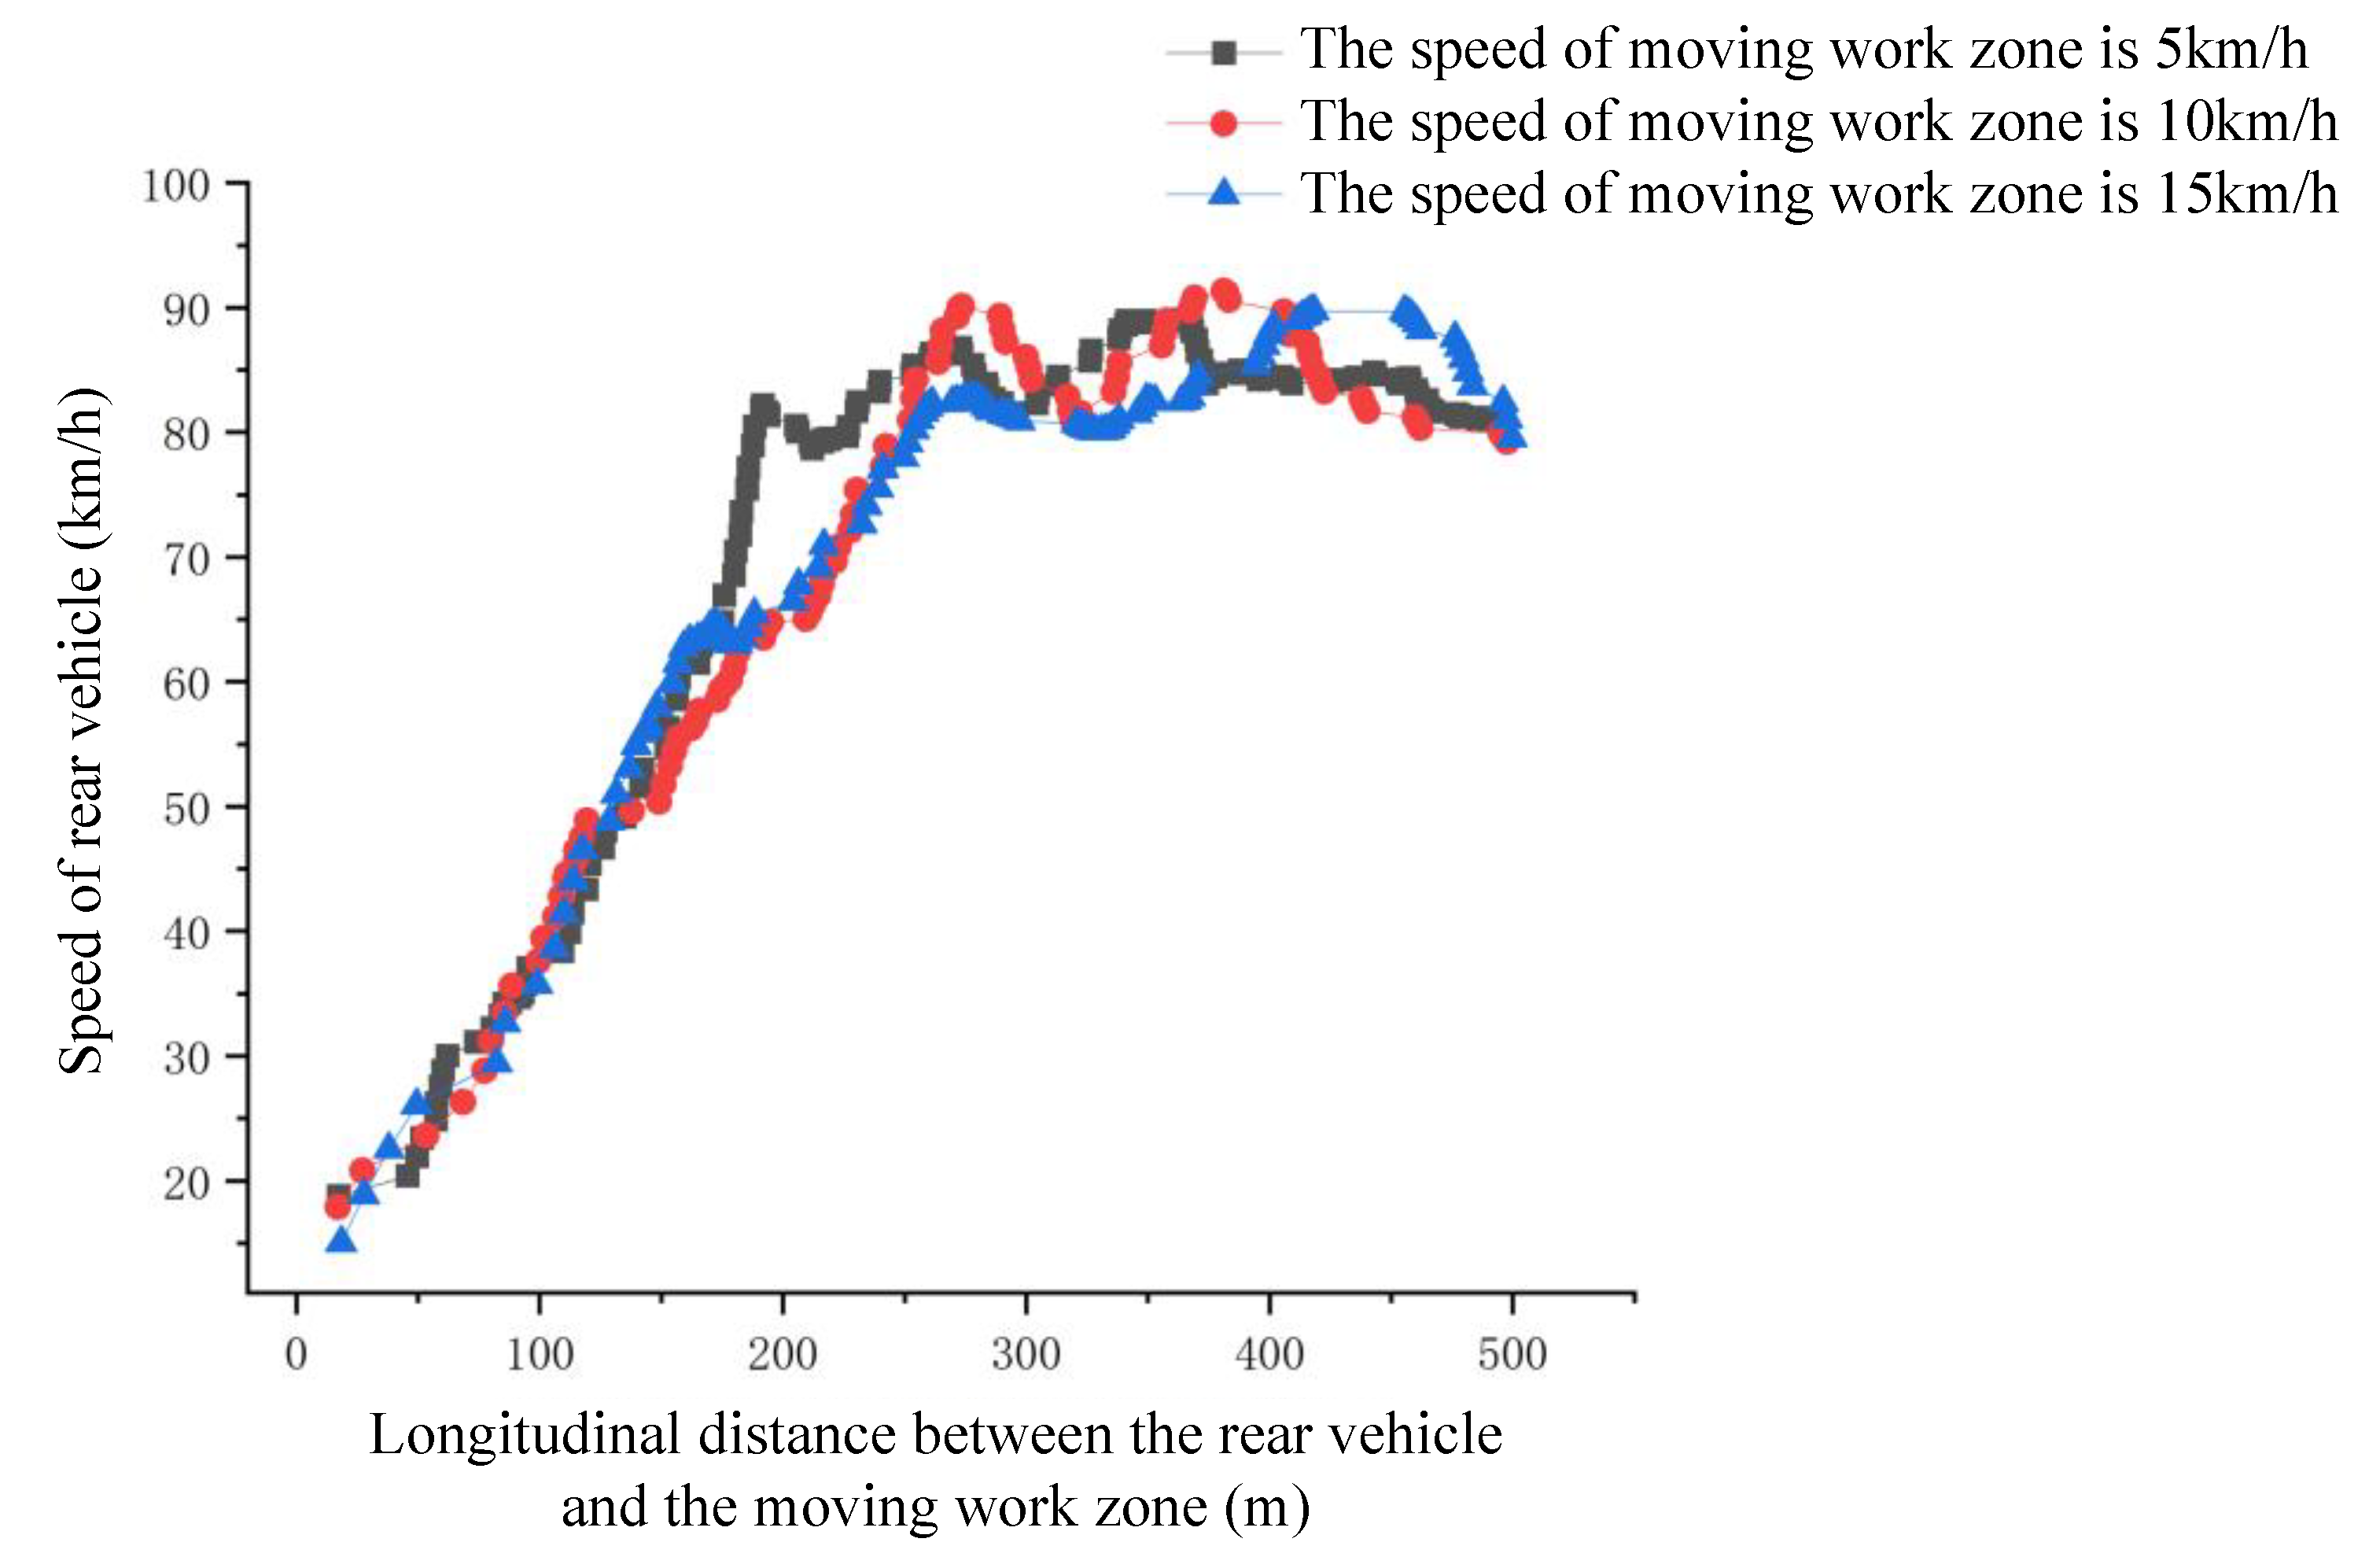
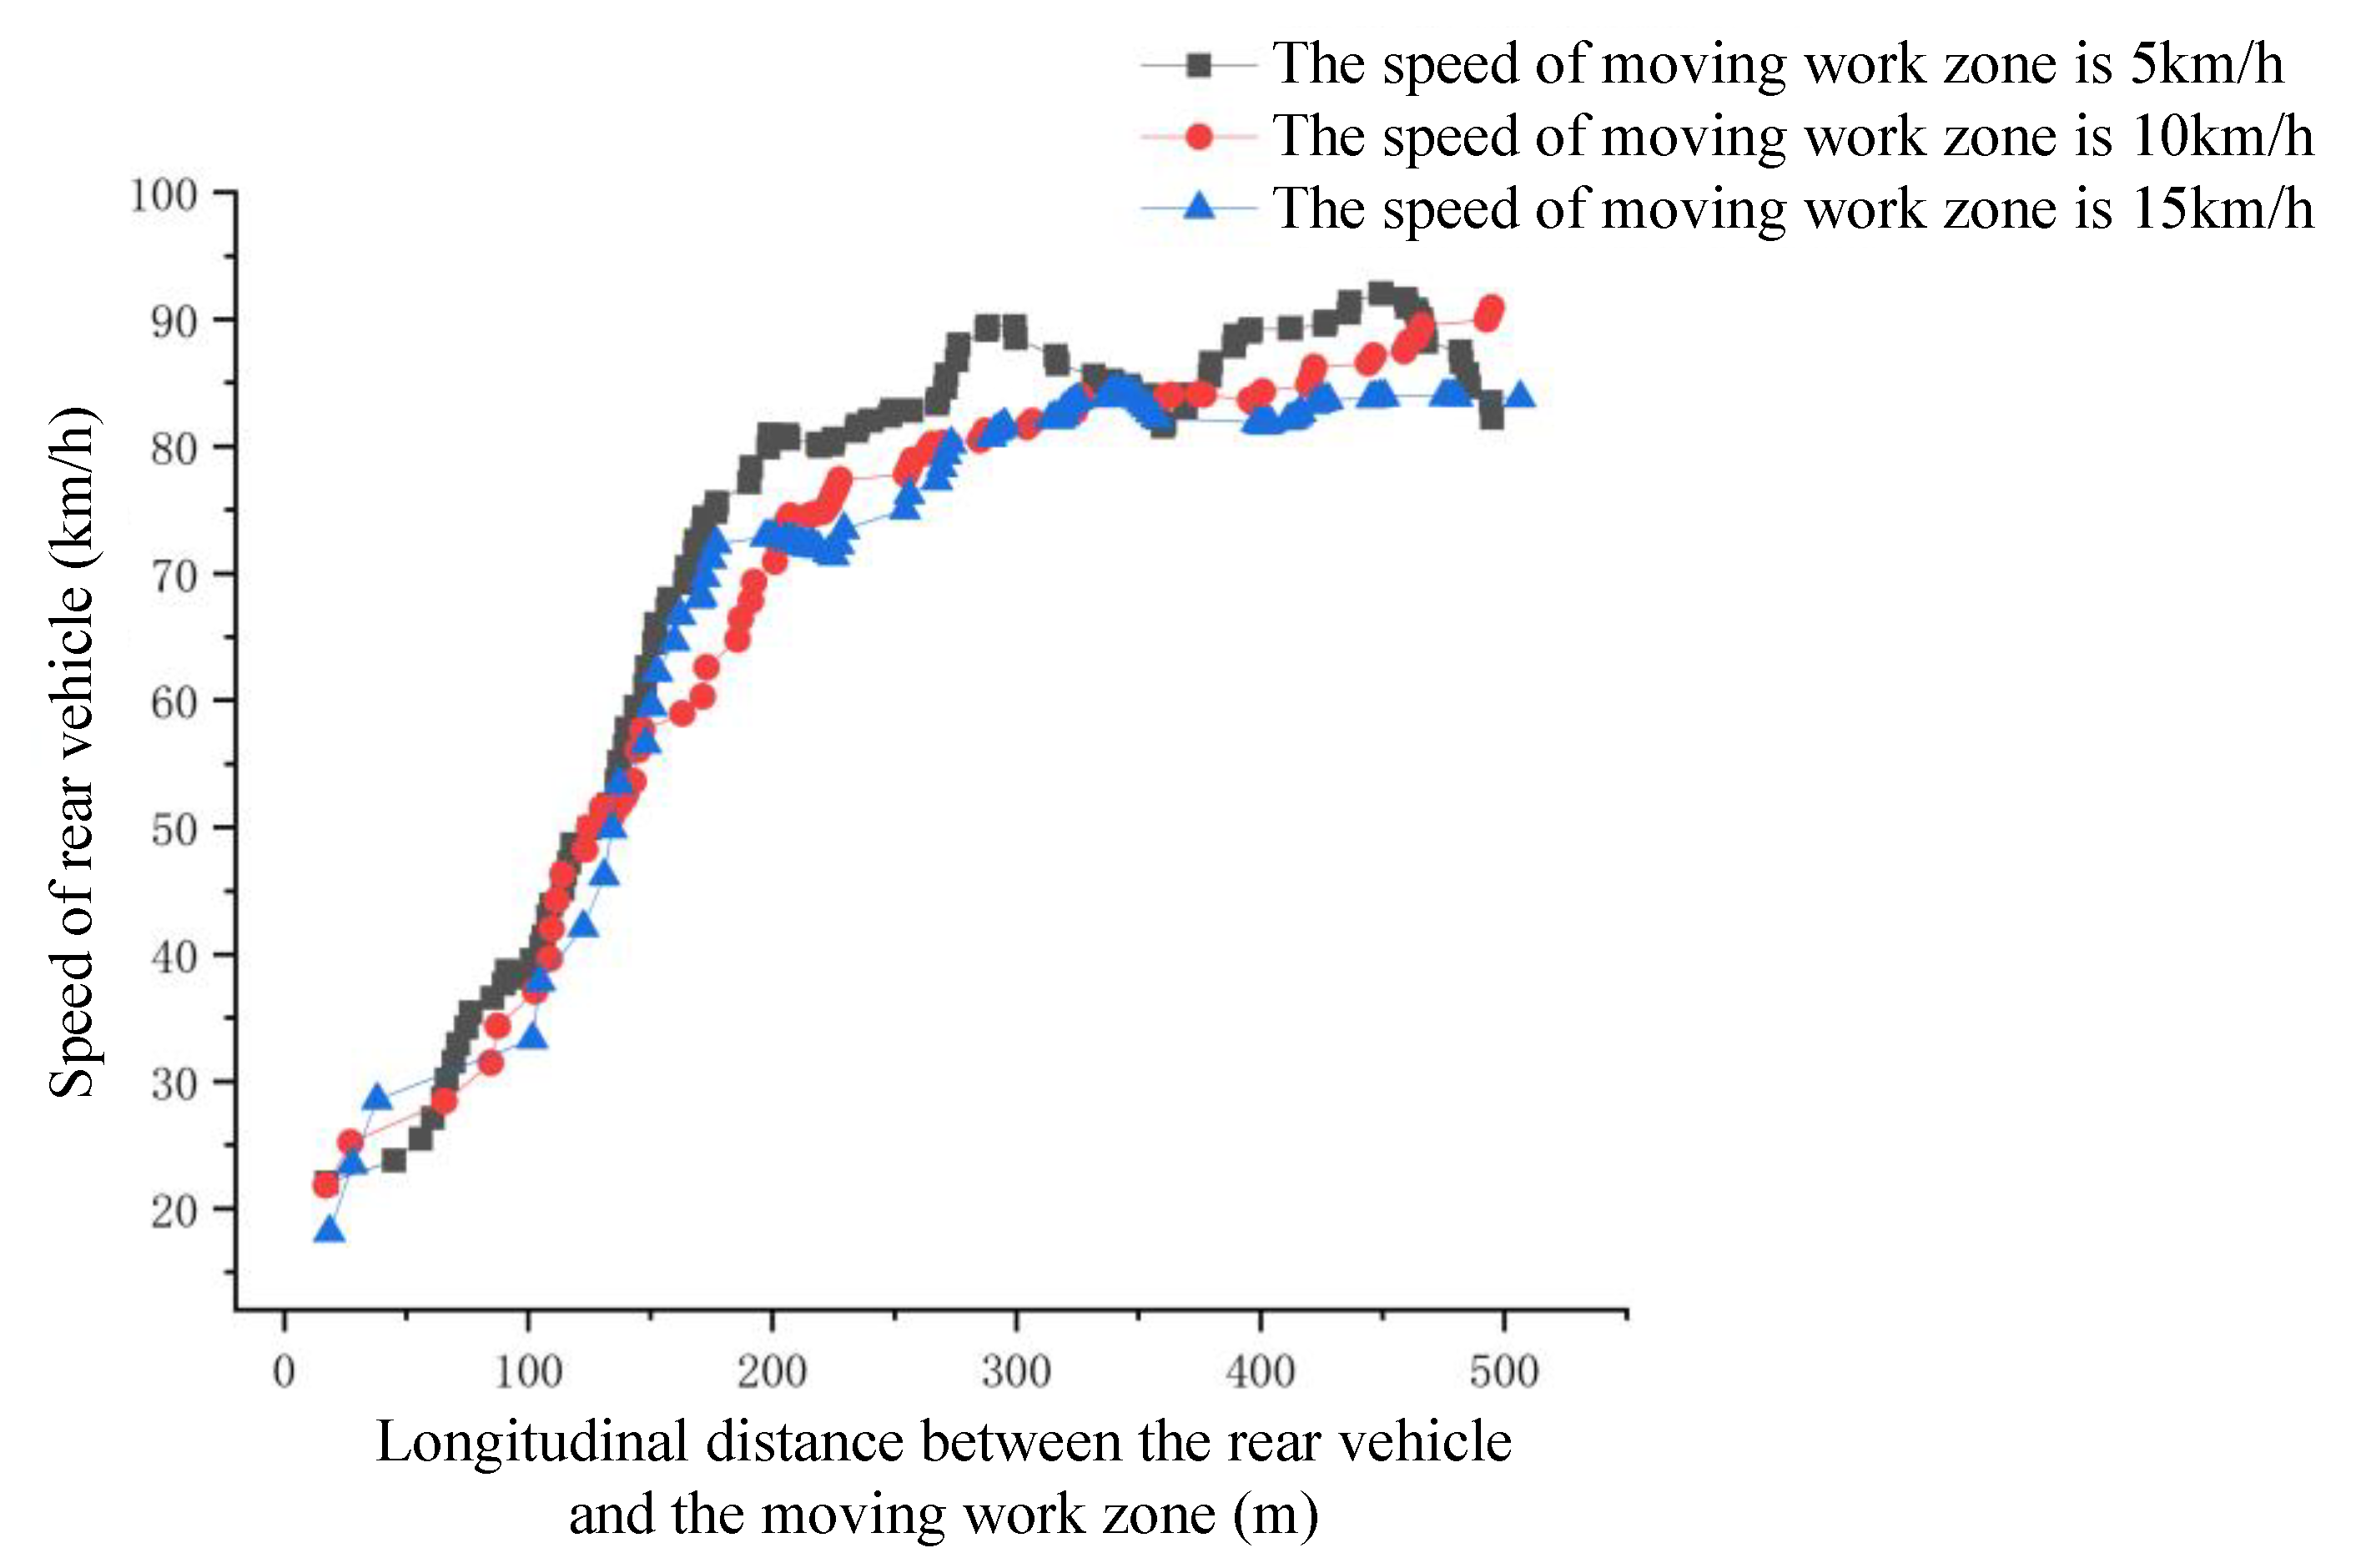
4.3. Right Lane
5. Traffic Risk Analysis of Moving Work Zone
6. Discussion and Conclusions
6.1. Discussion
6.2. Conclusions
Author Contributions
Funding
Institutional Review Board Statement
Informed Consent Statement
Data Availability Statement
Conflicts of Interest
References
- Yu, Y.; Weng, J.; Zhu, W. Optimizing strategies for the urban work zone with time window constraints. Sustainability 2019, 11, 4218. [Google Scholar] [CrossRef]
- Chief, S.I.; Goalies, D.G.; Yahalom, Y.S.; Chowdhury, S.M. Simulation-based estimates of delays at freeway work zones. J. Adv. Transp. 2002, 36, 131–156. [Google Scholar]
- Katta, S.J.; Khatam, A.J.; Council, F.M. Effects of work zone presence on injury and non-injury crashes. Accid. Anal. Prev. 2002, 34, 19–29. [Google Scholar]
- Weng, J.; Meng, Q.; David, Z.W. Tree-Based Logistic Regression Approach for Work Zone Casualty Risk Assessment. Risk Anal. 2013, 33, 1–12. [Google Scholar] [CrossRef]
- Liu, G.; Ge, Y.; Qiu, T.; Soleymani, H.R. Optimization of snow plowing cost and time in an urban environment: A case study for the City of Edmonton. NRC Res. Press 2014, 41, 667–675. [Google Scholar] [CrossRef]
- Brown, H.; Sun, C.; Cope, T. Evaluation of Mobile Work Zone Alarm Systems. Transp. Res. Rec. 2015, 2485, 42–50. [Google Scholar] [CrossRef]
- Xia, F.; Weng, J.; Zhang, J. Evaluation of travel delay and accident risk at moving work zones. J. Transp. Saf. Secur. 2019. [Google Scholar] [CrossRef]
- Fang, Y.; Chen, J.; Peng, Z. The effect of moving bottlenecks on a two-lane traffic flow. Chin. Phys. B 2013, 22, 108902. [Google Scholar] [CrossRef]
- Li, Q.; Pan, Y.; Chen, L.; Cheng, C. Influence of the Moving Bottleneck on the Traffic Flow on Expressway. Appl. Mech. Mater. 2011, 97–98, 480–484. [Google Scholar] [CrossRef]
- Osman, A.A.; Turan, A.; Wolfgang, G.; Thomas, E. Development of a precast slim temporary concrete safety barrier STCSB 50 for work zone applications. J. Transp. Saf. Secur. 2019, 11, 287–304. [Google Scholar]
- Fei, L.; Zhu, H.; Han, X. Analysis of traffic congestion induced by the work zone. Phys. A Stat. Mech. Appl. 2016, 450, 497–505. [Google Scholar] [CrossRef]
- Weng, J.; Du, G.; Li, D.; Yu, Y. Time-varying mixed logit model for vehicle merging behavior in work zone merging areas. Accid. Anal. Prev. 2018, 117, 328–339. [Google Scholar] [CrossRef]
- Li, Y.F.; Bai, Y. Development of crash-severity-index models for the measurement of work zone risk levels. Accid. Anal. Prev. 2008, 40, 1724–1731. [Google Scholar] [CrossRef]
- Meng, Q.; Weng, J. Evaluation of rear-end crash risk at work zone using work zone traffic data. Accid. Anal. Prev. 2011, 43, 1291–1300. [Google Scholar] [CrossRef]
- Shakouri, M.; Ikuma, L.H.; Aghazadeh, F.; Punniaraj, K.; Ishak, S. Effects of work zone configurations and traffic density on performance variables and subjective workload. Accid. Anal. Prev. 2014, 71, 166–176. [Google Scholar] [CrossRef]
- Wu, B.; Xu, H.; Dai, T.; Song, C. Simulation evaluation model on driving risk of expressway work zone. J. Transp. Syst. Eng. Inf. Technol. 2013, 13, 151–156. [Google Scholar]
- Zhou, Y.; Wei, J.; Chen, Z.; Wang, Y.; Zhang, M. Traffic organization of expressway maintenance work zone with multi-factors. J. Chang’an Univ. 2020, 40, 99–108. [Google Scholar]
- Meng, X.; Zheng, L.; Hai, F.; Guan, Z.; Xu, H. Research on Traffic Characteristics and Traffic Conflicts of One-way Closed Work Zone on Expressway. China J. Highw. Transp. 2013, 26, 140–146. [Google Scholar]
- Morgan, J.F.; Duley, A.R.; Hancock, P.A. Driver responses to differing urban work zone configurations. Accid. Anal. Prev. 2009, 42, 978–985. [Google Scholar] [CrossRef] [PubMed]
- Du, B.; Chien, S.; Lee, J.; Spasovic, L.; Mouskos, K. Artificial Neural Network Model for Estimating Temporal and Spatial Freeway Work Zone Delay Using Probe-Vehicle Data. Transp. Res. Rec. 2016, 2573, 164–171. [Google Scholar] [CrossRef]
- Mahmood, B.; Kianfar, J. Driver Behavior Models for Heavy Vehicles and Passenger Cars at a Work Zone. Sustainability 2019, 11, 6007. [Google Scholar] [CrossRef]
- Xu, W.; Zhao, X.; Chen, Y.; Bian, Y.; Li, H. Research on the Relationship between Dynamic Message Sign Control Strategies and Driving Safety in Freeway Work Zones. J. Adv. Transp. 2018, 2018, 1–19. [Google Scholar] [CrossRef]
- Pesti, G.; Brydia, R.E. Work Zone Impact Assessment Methods and Applications. Transp. Res. Rec. 2017, 2617, 52–59. [Google Scholar] [CrossRef]
- Waleczek, H.; Geistefeldt, J.; Middendorf, D.C. Traffic Flow at a Freeway Work Zone with Reversible Median Lane. Transp. Res. Procedia 2016, 15, 257–266. [Google Scholar] [CrossRef]
- Du, S.; Razavi, S. Variable Speed Limit for Freeway Work Zone with Capacity Drop Using Discrete-Time Sliding Mode Control. J. Comput. Civ. Eng. 2019, 33, 04019001. [Google Scholar] [CrossRef]
- Ge, H.; Yang, Y. Research on Calculation of Warning Zone Length of Freeway Based on Micro-Simulation Model. IEEE Access 2020, 76532–76540. [Google Scholar] [CrossRef]
- Wu, K.; Zhong, L. A Method for Determining Length of Freeway Work Zone Based on Classification of Service Level. Adv. Mater. Res. 2013, 779–780, 491–497. [Google Scholar] [CrossRef]
- Peng, Y.; Wang, X.; Lu, J.; Wang, W.; Zhang, H. Length determination method for expressway maintenance work zone based on service level. China J. Highw. Transp. 2016, 29, 130–136. [Google Scholar]
- Wu, J.; Zhang, S.; Singh, A.; Ma, Z.; Zhou, B. Optimum layout of freeway construction area based on crash cost control. J. Chang’an Univ. 2017, 37, 97–103. [Google Scholar]
- Yu, R.; Ma, R.; Han, H.; Yan, Y.; Wang, J. Determination method of speed-limit sign position in expressway work zone. J. Traffic Transp. Eng. 2013, 13, 91–98. [Google Scholar]
- Ramadan, O.; Sisiopiku, V. Impact of Bottleneck Merge Control Strategies on Freeway Level of Service. Transp. Res. Procedia 2016, 15, 583–593. [Google Scholar] [CrossRef]
- Edara, P.; Rahmani, R.; Brown, H.; Sun, C. Traffic Impact Assessment of Moving Work Zone Operations (Report DOT F 1700.7 (8–72)); Department of Transportation: Washington, DC, USA, 2017.
- Juran, I.; Prashker, J.N.; Bekhor, S.; Ishai, I. A dynamic traffic assignment model for the assessment of moving bottlenecks. Transp. Res. Part C 2008, 17, 240–258. [Google Scholar] [CrossRef]
- Wu, K.; Guler, S.I. Estimating the impacts of transit signal priority on intersection operations: A moving bottleneck approach. Transp. Res. Part C 2019, 105, 346–358. [Google Scholar] [CrossRef]
- Fadhloun, K.; Rakha, H.; Loulizi, A. Macroscopic analysis of moving bottlenecks. Transp. Lett. 2019, 11, 516–526. [Google Scholar] [CrossRef]
- Ou, H.; Tang, T.-Q. Impacts of moving bottlenecks on traffic flow. Phys. A Stat. Mech. Appl. 2018, 500, 131–138. [Google Scholar] [CrossRef]
- Ministry of Housing and Urban-Rural Development of the People’s Republic of China. Code for Design of Urban Road Engineering (CJJ 37–2012); China Building Industry Press: Beijing, China, 2012.
- Guo, Z.; Dai, Y.; Zhou, X. Critical safety speed and its application research on risk characteristic section of expressway tunnel (tunnel group). China J. Highw. Transp. 2010, 23, 116–122. [Google Scholar]


| Critical acceleration (m/s2) | <2 | 2–4 | 4–5 | 5–6 | 6–7 | 7–8 | >8 |
| Traffic risk index | 0 | 1 | 2 | 4 | 6 | 8 | 10 |
| Section (m) | 2000 pcu/h | 1600 pcu/h | 1200 pcu/h | ||||||
|---|---|---|---|---|---|---|---|---|---|
| 5 km/h | 10 km/h | 15 km/h | 5 km/h | 10 km/h | 15 km/h | 5 km/h | 10 km/h | 15 km/h | |
| 0–50 | 6.02 | 5.01 | 5.93 | 8.16 | 6.83 | 4.40 | 7.23 | 6.65 | 6.00 |
| 50–100 | 3.30 | 3.29 | 5.51 | 6.15 | 4.20 | 3.98 | 3.72 | 3.56 | 3.43 |
| 100–150 | 3.12 | 3.38 | 7.89 | 3.94 | 3.14 | 3.62 | 4.42 | 3.11 | 3.12 |
| 150–200 | 3.06 | 3.06 | 8.38 | 6.94 | 6.17 | 5.43 | 4.53 | 4.36 | 4.27 |
| Average value | 3.87 | 5.02 | 7.28 | 5.86 | 4.93 | 4.76 | 4.56 | 4.39 | 4.26 |
Publisher’s Note: MDPI stays neutral with regard to jurisdictional claims in published maps and institutional affiliations. |
© 2021 by the authors. Licensee MDPI, Basel, Switzerland. This article is an open access article distributed under the terms and conditions of the Creative Commons Attribution (CC BY) license (https://creativecommons.org/licenses/by/4.0/).
Share and Cite
Fang, S.; Ma, J. Influence Range and Traffic Risk Analysis of Moving Work Zones on Urban Roads. Sustainability 2021, 13, 4196. https://doi.org/10.3390/su13084196
Fang S, Ma J. Influence Range and Traffic Risk Analysis of Moving Work Zones on Urban Roads. Sustainability. 2021; 13(8):4196. https://doi.org/10.3390/su13084196
Chicago/Turabian StyleFang, Song, and Jianxiao Ma. 2021. "Influence Range and Traffic Risk Analysis of Moving Work Zones on Urban Roads" Sustainability 13, no. 8: 4196. https://doi.org/10.3390/su13084196
APA StyleFang, S., & Ma, J. (2021). Influence Range and Traffic Risk Analysis of Moving Work Zones on Urban Roads. Sustainability, 13(8), 4196. https://doi.org/10.3390/su13084196