Abstract
High-precision CO2 emission data by sector are of great significance for formulating CO2 emission reduction plans. This study decomposes low-precision energy consumption data from China into 149 sectors according to the high-precision input–output (I–O) table for 2017. An economic I–O life cycle assessment model, incorporating sensitivity analysis, is constructed to analyze the distribution characteristics of CO2 emissions among sectors. Considering production, the electricity/heat production and supply sector contributed the most (51.20%) to the total direct CO2 emissions. The top 10 sectors with the highest direct CO2 emissions accounted for >80% of the total CO2 emissions. From a demand-based perspective, the top 13 sectors with the highest CO2 emissions emitted 5171.14 Mt CO2 (59.78% of the total), primarily as indirect emissions; in particular, the housing construction sector contributed 23.97% of the total. Based on these results, promoting decarbonization of the power industry and improving energy and raw material utilization efficiencies of other production sectors are the primary emission reduction measures. Compared with low-precision models, our model can improve the precision and accuracy of analysis results and more effectively guide the formulation of emission reduction policies.
1. Introduction
With increasing global climate change, the reduction of carbon emissions whose major source is energy combustion [1] has become the focus of all countries. In 2019, China had the highest carbon emissions accounting for approximately 27.9% of global carbon emissions [2]. Therefore, it is important to reduce the country’s emissions in order to contribute to global climate change mitigation. At the 75th United Nations General Assembly in September 2020, China proposed to achieve peak CO2 emissions by 2030 and carbon neutrality by 2060. To facilitate formulation of emission reduction plans, it is necessary to study China’s carbon emissions from energy combustion based on a higher sector resolution.
The aggregation and decomposition of emission sectors are important aspects of research on CO2 emissions mitigation. The classification of sectors in the China Energy Statistical Yearbook (e.g., [3]) varies from that used in the input–output (I–O) table (e.g., [4]). The former lists approximately 40 categories, while in the latter, there are >100 sectors. To maintain consistency between the two with energy consumption data, most studies aggregate the I–O tables into approximately 40 sectors. However, this may cause inaccurate estimations and distortion of carbon emissions at the sectoral level [5,6,7,8]. Lenzen [9] proved that, in case information required for sectoral decomposition is lacking, the results of sectoral decomposition based on a small amount of actual data are better than the results of sectoral aggregation. Lindner et al. [10] demonstrated that when the power sector was disaggregated, an increased amount of information led to an increased accuracy in the carbon emission intensity of each sector obtained through sectoral decomposition. Therefore, it is necessary to further split the sectors and use higher sector resolution data to investigate carbon emissions and, thus, improve the reliability and accuracy of the analysis results.
There are two methods for sectoral disaggregation. The first method involves decomposition of the I–O table and most studies using this method usually only focus on a few typical sectors [8,11,12,13,14,15,16], such as the construction and power sectors. Meng et al. [11] divided the construction sector into 12 subsectors based on the sectoral intermediate purchases and investment data and obtained the extended I–O table of 53 sectors of Beijing city. Linder et al. [12] used regional information and cost data for operation and maintenance of power plants to split the electricity sector into transmission, distribution and eight other subsectors representing different types of technology in power plants. Moreover, some studies have used other methods to obtain power subsectors [13,15]. However, the decomposition method cannot be effectively applied to the complete I–O table. It cannot satisfy the requirement of decomposing the energy consumption table; hence, we do not employ this method in our study.
The second method is to decompose energy consumption data or carbon emission data. Few studies apply this method, as it has higher requirements for sectoral data. Insufficient sectoral data may introduce biases in this allocation method [17]. In general, energy consumption data are allocated based on the sectoral intermediate purchases or demands and carbon emissions data are allocated based on the sectoral carbon emission intensity. Minx et al. [18] and Zhang et al. [17] decomposed the carbon emission and energy consumption data, respectively, of multiple sectors to correspond to sectors in the I–O table. The allocation coefficients obtained by Minx et al. were based on the carbon emission intensity of 95 sectors derived by normalization and that of the latter, was based on sectoral direct inputs. Douglas and Nishioka [19] allocated carbon emission data based on the sectoral intermediate demands. However, these studies have their own limitations. The sector resolution of Douglas and Nishioka [18] was too low and only included 41 sectors, even after decomposition. After using the allocation method, the number of sectors in Zhang et al. [17] and Minx et al. [18] were 95 and 135, respectively. However, the latter lacks more accurate allocation coefficients than the former, because it assumed that all I–O sectors that map to the one energy sector have the same emission intensity (the number of carbon emission intensity data before normalization were only 44). Although Zhang et al. [17] is the most accurate of the three; they did not deduct the non-energy use of fuels when calculating the total carbon emissions. Moreover, the allocation method of their study also needs to be improved.
To solve the above shortcomings, the present study uses the 2017 I–O table of 149 sectors in China and decomposed energy consumption data to construct an economic I–O life cycle assessment (LCA) carbon emission analysis model [20]. The model incorporates production- and demand-based perspectives to analyze the distribution of carbon emissions from energy combustion among sectors. Most of the current studies employ structural decomposition analysis (SDA) to analyze carbon emissions [18,21,22,23]. However, the core objective of this study is to analyze the sectoral distribution characteristics of high-precision carbon emission data of China. Therefore, we utilize the economic I–O LCA (EIO–LCA) [20], even though it appears relatively simple, to analyze carbon emissions. Furthermore, as uncertainty management is indispensable to any model development and evaluation [24], we incorporated sensitivity analysis of changing number of sectors in our model to improve the reliability of our results.
There exist a few studies that apply uncertainty or sensitivity analysis in the I–O model of environmental extension [25]. However, the incorporation of sensitivity analysis into the framework of this study makes our approach a novel one. Our study improves on the allocation method used in Zhang et al. [17] by extending the number of sectors from 45 to 149. Specifically, when the distribution coefficient is 0, we modified the coefficient to make our allocation reasonable. Compared with other similar work [17,18], our results are more accurate. We achieved this accuracy by adopting more precise allocation coefficients. Additionally, we address the limitation that Zhang et al. [17] failed to deduct the non-energy use of fuels.
The rest of this paper is structured as follows: Section 2 details the methods and data sources used in this study, focusing on the method of energy consumption data allocation. Section 3 analyzes and discusses the results. Finally, Section 4 summarizes the conclusions, highlights the limitations and puts forward the main policy suggestions.
2. Method and Data
2.1. Method
2.1.1. EIO–LCA Model
This study used the EIO–LCA model [20] to analyze China’s carbon emissions. The model is expressed by Equation (1):
where B represents the sectoral carbon emission matrix; is the Leontief inverse matrix, where is an identity matrix and , which is a direct consumption coefficients matrix of the I–O table; is diagonal matrix of the final demand column in I–O table; and , which is the amount of CO2 directly emitted by a sector per unit of monetary output, where , represents sectoral carbon emissions, represents the total sectoral output.
2.1.2. Energy Consumption Data Allocation Method
Few studies completely divide the energy consumption sector according to the sector classification of the I–O table. We primarily referred to Zhang et al. [17] and Minx et al. [18] as they are more representative. The former represents the allocation of energy consumption data based on direct inputs and the latter represents the allocation of carbon emissions data based on carbon emission intensity. Minx et al. [18] obtained the carbon emission intensity of 95 sectors (the number of sectors of I–O table) in three steps. First, the output was aggregated into the sector classification used in the energy and emissions data; second, the emission intensity of 44 sectors (the number of sectors of energy consumption table) was obtained; finally, all I–O sectors that map to the one energy sector were assumed to have the identical emission intensity which was normalized to obtain the emission intensity of 95 sectors. To obtain the carbon emission inventory of 135 sectors, Zhang et al. [17] first calculated the energy consumption data allocation coefficients according the direct inputs of the fuel production sectors; then, these coefficients were multiplied with the corresponding energy consumption data to derive the energy consumption table of 135 sectors; the process can be formulated as Equation (2):
where and represent the consumption of fuel type (k) corresponding to sectors and , respectively; and represent the intermediate inputs of sector p to sectors and . Sectors are all subsectors of sector .
Thus, we split some sectors of the energy consumption table according to the “Industrial classification for national economic activities” (GB/T 4754-2017) [17,26]. There were 149 sectors after decomposition (Table A1) and for ease of presentation, the sectors in the figures are represented by their corresponding numbers. Briefly, different types of energy were correlated with 149 sectors that produce the corresponding type of energy. Then, the allocation coefficients of energy consumption data were linked to the proportion of the sectoral intermediate inputs in the I–O table. Finally, this ratio was multiplied by the energy consumption of the corresponding sector in the energy consumption table of 45 sectors to derive an energy consumption table of 149 sectors. A schematic of this method is shown in Figure 1.
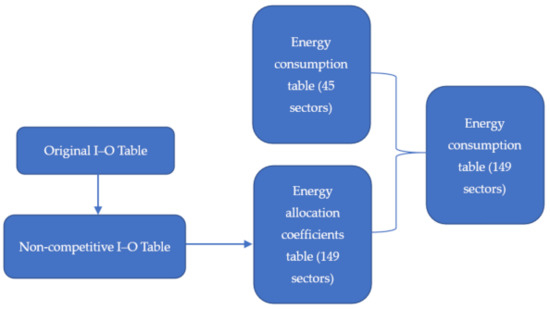
Figure 1.
Schematic of energy consumption data allocation method (I–O: input–output).
Before allocating the energy consumption data, the energy consumption data allocation coefficient of each sector was calculated using Equations (3) and (4):
where indicates the sector producing this type of fuel (energy) in the I–O table of 149 sectors (Table 1); indicates the allocation coefficient of energy production sector corresponding to sector ; and represent the intermediate inputs of sector to sector and , respectively; sectors are all subsectors of sector and 2 ≤ n < 149. The corresponding relationship is shown in Table A1. Figure 2 shows the schematic diagram that explains the attainment of allocation coefficients of energy consumption data. We considered raw coal consumed by farming (sector 01) as an example. Its allocation coefficient is equal to the intermediate input of mining and washing of coal (sector 06) to farming (sector 01), divided by the intermediate input of sector 06 to the primary industry (sectors 01–05). The parameters are appropriately represented in Figure 2. The production sector of raw coal corresponds to the mining and washing of coal (sector 06) in the I–O table, coke corresponds to the processing of coal (sector 42), natural gas corresponds to the extraction of petroleum and natural gas (sector 07) and gasoline corresponds to the processing of refined petroleum and nuclear fuel (sector 41). Finally, the energy allocation coefficients corresponding to the four fuel production sectors (sectors 06, 07, 41 and 42) can be calculated according to corresponding sectors.

Table 1.
Energy consumption data allocation (I–O: input–output).
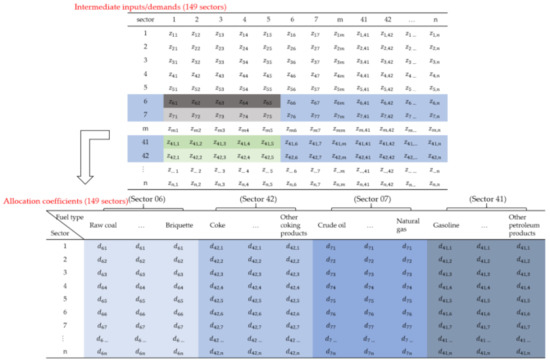
Figure 2.
Schematic diagram for deriving the energy consumption data allocation coefficients.
Then, using the allocation coefficients obtained above, the energy consumption of different energy types in the 149 sectors can be calculated by Equations (5) and (6):
where and represent the disaggregated and aggregated matrices, respectively; they correspond to a 149 × 149 and 45 × 45 matrix; represents different types of energy; indicates the consumption of corresponding to the sector in the energy consumption table of 149 sectors; and indicates the consumption of corresponding to the sector . As an example of the application of this equation: the consumption of raw coal by farming (sector 01) in the energy consumption table of 149 sectors should be equal to the consumption of raw coal by agriculture, forestry, animal husbandry and fishery (sector 01 in the 45-sector classification) multiplied by the allocation coefficient of raw coal corresponding to the farming (sector 01).
However, according to the above calculation process, there are still some energy consumption data that cannot be fully allocated. Specifically, the intermediate input of a certain energy production sector to other sectors (corresponding to one or more sectors in the I–O table of 149 sectors) may be 0. For example, in Table 1, the intermediate input of processing of coal (sector 42) to the primary industry (sectors 01–05) is 0, but agriculture, forestry, animal husbandry and fishery (sector 01 in the 45-sector classification) consume coke and other coking products. Similarly, the intermediate input of the extraction of petroleum and natural gas (sector 07) to wholesale/retail trade and catering (sectors 117–120) is also 0; however, wholesale/retail trade and catering (sector 44 in the 45-sector classification) consume natural gas.
Zhang et al. [17] did not consider the above problems. However, we provide specific solutions. In case, the intermediate input is 0 when the energy consumption data are allocated, then the allocation coefficient corresponding to processing of coal (sector 42) is updated to the allocation coefficient corresponding to the mining and washing of coal (sector 06); similarly, the allocation coefficient corresponding to the extraction of petroleum and natural gas (sector 07) is updated to the allocation coefficient corresponding to the processing of refined petroleum and nuclear fuel (sector 41). In this manner, we can use the adjusted allocation coefficients to calculate the energy consumption of 149 sectors.
After obtaining the preliminary energy consumption table of the 149 sectors according to the above-mentioned allocating method, the amount of energy loss was allocated to each sector based on the proportion of energy consumption of various sectors. Next, the energy consumption for raw materials was obtained according to the proportion of energy consumption in sectors 41–60 (except for sector 50, which does not use energy for raw material); this value was then subtracted from the total energy consumption to obtain the energy consumption for combustion. The energy consumption for power generation and heating were allocated to the production and supply of electric/heat power (sector 98) and the net international marine fuel consumption was allocated to sectors 105–116 according to the proportion of energy consumed in the sector.
2.1.3. Sectoral CO2 Emission Calculation Method
In this study, the sectoral approach was used to calculate CO2 emissions from energy combustion in order to improve the accuracy of the sub-sectoral CO2 emission data to the maximum extent. According to the energy consumption table of the 149 sectors obtained by the above method, the CO2 emissions of these sectors can be calculated by Equation (7):
where represents the CO2 emissions produced by sector consuming fuel ; represents the consumption of fuel by sector ; represents the average low calorific value of fuel ; and represents the carbon emission factor of fuel consumed by sector , which can be written as Equation (8):
represents the carbon content of fuel consumed by sector and represents the carbon oxidation rate of fuel consumed by sector .
2.2. Data
2.2.1. Non-Competitive I–O Table
This study only analyzes the impact of China’s domestic economic activities on sectoral carbon emissions. However, the 2017 I–O table of 149 sectors issued by the National Bureau of Statistics of China [4] is a competitive I–O table, which integrates domestic products and services with imported products and services in intermediate inputs. This approach may overestimate the impact of the final demands on sectoral carbon emissions [27,28]. To solve this problem, the methods of Chen et al. [29] and Tian et al. [30] were used for reference to construct the 2017 non-competitive I–O table by dividing the intermediate inputs and final demands into domestic and import parts. We assumed that the import rates of a sector’s intermediate and final demands (excluding exports) were identical and equal to the sector’s average import rate. Then, the demand for imported products were subtracted from the sector’s intermediate and final demand according to this ratio to obtain the intermediate and final demands of domestic products, as expressed by Equations (9) and (10):
where and represent the intermediate and final demands in the non-competitive I–O table, respectively; and represent the intermediate and final demands in the original competitive I–O table, respectively; represents the average import rate of sector ; represents the imports of sector ; and represents the sum of the total intermediate demand and the total final demand excluding exports of sector .
2.2.2. Energy Consumption Data and Carbon Emission Factors
The energy consumption data used in this study were obtained from the energy balance sheet and final physical energy consumption table by industry in the 2018 China Energy Statistical Yearbook [3]. The I–O data were obtained from the non-competitive I–O table of 149 sectors after processing (as in Section 2.2.1). The carbon emission factor data were from the “Provincial Greenhouse Gas Inventory Compilation Guide (Trial)” [31] and “2005 People’s Republic of China National Greenhouse Gas Inventory” [32].
3. Results and Discussion
3.1. Sectoral CO2 Emissions Based on the Production Perspective
Figure 3 shows the direct CO2 emissions of various sectors in China. The production and supply of electric/heat power (sector 98) was the sector with the highest direct CO2 emissions (4429.59 Mt), accounting for 51.20% of the total CO2 emissions from all sectors. Each of the top 10 sectors emitted >100 Mt of CO2 (Table 2), leading to a collective direct CO2 emission of 7061.11 Mt, which accounted for 81.62% of the total CO2 emissions from all sectors. As most of the CO2 emissions were generated from these 10 sectors, from a production-based perspective, emission reduction policies should focus on the production practices of them to control the corresponding direct CO2 emissions.
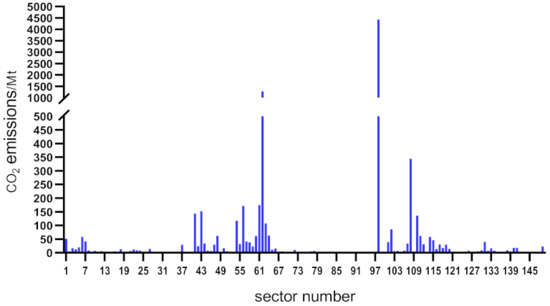
Figure 3.
Direct CO2 emissions of different sectors.
Table 2.
Sectors with the 10 highest direct CO2 emissions.
Figure 4 presents the relationship between the direct CO2 emissions of sector 98 (production and supply of electric/heat power) and the final demands of other sectors. This shows that 91.10% of CO2 emissions from sector 98 were generated by providing electricity and heat to other sectors (not including sector 98 itself). The top seven sectors (sectors 101, 98, 102, 77, 103, 141 and 149) that consumed the most electricity and heat induced 2184.19 Mt of CO2 emissions from sector 98, which is nearly half of the total direct emissions from this sector (Table 3). The highest contribution was from housing construction (sector 101), which accounted for 19.98% of the total direct emissions from the supply of electric and heat power (Table 3). Therefore, emission reduction in sector 98 could commence considering the following two aspects. First, improvement of the power generation efficiency of electric/heat power and controlling carbon emissions in the power generation process. Second, improvement of the power efficiency of other sectors, especially the six sectors listed in Table 3, to control power consumption in production activities.
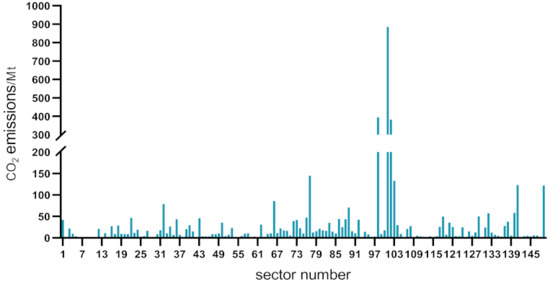
Figure 4.
Composition of direct CO2 emissions from the production and supply of electric/heat power (sector 98).
Table 3.
Direct CO2 emissions from the production and supply of electric/heat power (sector 98) caused by the electric/heat demand of the top seven sectors.
3.2. Sectoral CO2 Emissions Based on the Demand Perspective
In some cases, the production activities of upstream and downstream sectors influence the CO2 emissions of other sectors. The embodied CO2 emissions caused by the final demands of various sectors in China are displayed in Figure 5. The highest embodied emissions were caused by the final demand of housing construction (sector 101), which contributed 2073.73 Mt of CO2 (23.97% of the total emissions; Table 4), most of which was emitted by other sectors along the supply chain. The top 13 sectors with the highest embodied emissions contributed 5171.14 Mt of CO2, accounting for 59.78% of the total emissions from all sectors. The embodied CO2 emissions of most sectors were mainly indirect emissions. Therefore, from a demand-based perspective, the focus should be on formulating emission reduction policies for the final demands of these 13 sectors to control corresponding CO2 emissions.
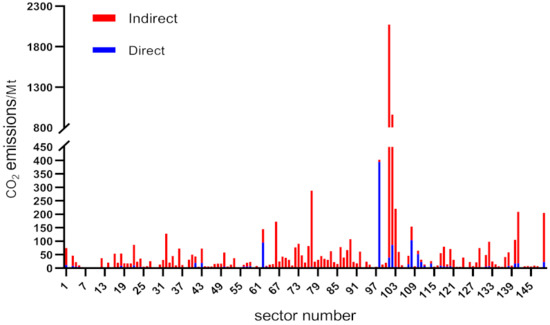
Figure 5.
Sectoral embodied CO2 emissions by final demand.
Table 4.
Embodied CO2 emissions of major sectors.
Because the embodied CO2 emissions of housing construction (sector 101) accounted for the largest proportion of the total emissions, we decomposed the CO2 emissions caused by the final demand of sector 101 to observe the contributions of various sectors to it (Figure 6). Table 5 shows that the highest contribution was from sector 98 (production and supply of electric/heat power; 884.89 Mt CO2), accounting for 42.67% of the total emissions of sector 101. The next highest contribution was from the rolling of steel subsector (sector 62; 24.91%); however, the sector itself (sector 101) accounted for only 1.88% (Table 5). Therefore, the following two key points based on the final demand of the housing construction sector for controlling the CO2 emissions caused must be considered. First, improvement of the efficiency of the use of raw materials for housing construction and reduction of the use of main raw materials while maintaining the final demand remains. Second, implementation of technological upgrades in the six sectors specified in Table 5 to control the amount of direct CO2 emissions during their production stages.
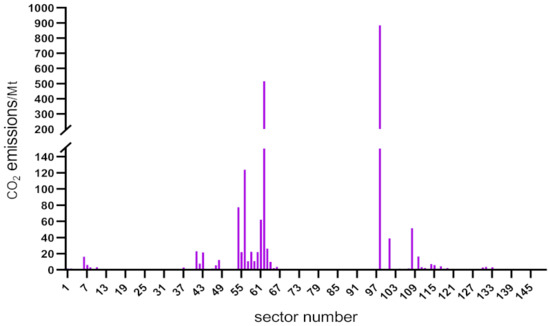
Figure 6.
Composition of embodied CO2 emissions caused by the final demand of the housing construction sector.
Table 5.
Embodied CO2 emissions of major sectors caused by the final demand of the housing construction sector.
3.3. Comparisons with Similar Studies
Chang et al. [14] and Zhang et al. [17] both used disaggregated I–O model to analyze issues in the field of energy or environment. Chang et al. [14] developed an I–O LCA model that disaggregated the construction sector of I–O tables into 14 subsectors, including 13 building types and civil engineering projects, to calculate the product chain energy of different building types in China. Their results indicated that aggregation in the construction sector led to a 15–225% overestimation of the product chain energy of buildings; the difference in material consumption of different building types cannot be sufficiently reflected in the aggregated I–O model, consequently affecting the accuracy of the calculation of the building embodied energy. This is similar to our results, which suggests that the disaggregated model has a higher-precision sectoral level and thus, can more precisely reflect the link of carbon emissions between sectors and improve the accuracy of our analysis. Zhang et al. [17] also obtained similar results, indicating that the use of aggregated models will distort the allocation of embodied carbon emissions in sectors with large carbon emissions.
However, the total carbon emissions calculated by Zhang et al. [17] were inaccurate. First, the non-energy use of fuels was incorrectly included for combustion, leading to overestimation of the total carbon emissions by double counting the carbon emissions of this part. Second, their conclusions stated that the total carbon emissions of the 135-sector classification were different from those of the 42-sector classification, which does not agree with the results of our study. According to the energy consumption data allocation method used in Zhang et al. [17], when the original energy consumption table of the 42 sectors is split into the energy consumption table of the 135 sectors, the total calculated carbon emissions in these two cases should be equal because the total energy consumption is constant. In Section 3.4, we compare China’s 2017 carbon emission inventory of 149 sectors with that of 45 sectors, whereby the total CO2 emissions in both cases were the same, but the distribution of CO2 emissions between sectors differed.
3.4. Comparison of CO2 Emission Inventories: 149 Sectors and 45 Sectors
To obtain the CO2 emission inventory of 45 sectors, we aggregated the sectors in the 2017 I–O table according to the “Industrial classification for national economic activities” (GB/T 4754-2017) [26] to make them consistent with the sectors in the energy consumption table. After processing the I–O table of 149 sectors into 45 sectors, the EIO–LCA model was used to analyze the CO2 emissions of these 45 sectors.
The results demonstrated that the sum of the direct CO2 emissions of groups of subsectors in the carbon emission matrix of the 149 sectors was the same as that of the larger sectors of the 45 sectors. For example, the sum of the direct CO2 emissions of sector 61–63 in the 149 sectors was equal to the CO2 emissions of sector 26 in the 45 sectors (Figure 7). However, the embodied CO2 emissions were inconsistent. Considering the construction industry as an example, the embodied CO2 emissions of this sector in the 45-sector classification were 3238.72 Mt, while the sum of embodied CO2 emissions of sectors 101–104 of the 149-sector classification was 3314.52 Mt (2.34% more than the former). This is because direct sectoral CO2 emissions data were used for the analysis in the EIO–LCA model. However, such differences were not distinct and had a negligible impact on the subsequent analysis; therefore, Figure 8 shows the relationship between the embodied CO2 emissions of the construction sector in the 45-sector classification and the corresponding sectors in the 149-sector classification from a demand-based perspective.
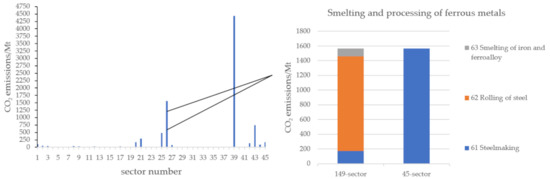
Figure 7.
CO2 emission decomposition of the smelting and processing of ferrous metals sector from the production-based perspective.
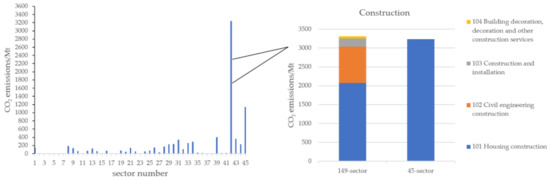
Figure 8.
Decomposition of the embodied CO2 emissions of the construction sector from the demand-based perspective.
Table 6 compares the details of the two classifications of the CO2 emission inventory. In the 45-sector classification, the ratio of direct CO2 emissions from the top 5 to the total CO2 emissions is 86.88% and the ratio of embodied CO2 emissions is 63.40%. Similarly, in the 149-sector classification, the ratios are 74.03% and 45.59%, respectively. This indicates that the sector concentration of the 45-sector CO2 emission inventory is higher. Moreover, the sectors with large CO2 emissions in the 149-sector inventory are all subsectors of the sectors in the 45-sector inventory (e.g., sectors 61 and 62 are subsectors of sector 26; sectors 101, 102 and 103 are subsectors of sector 42) suggesting that the 149-sector CO2 emission inventory is more precise and accurate. For example, the 45-sector CO2 emission inventory reveals that sector 42 contributes the most embodied CO2 emissions; however, sector 101 is the largest emitter of CO2 emissions in the 149-sector CO2 emission inventory. In contrast, other subsectors of the construction sector (e.g., sector 104, building decoration and other building services) contributed marginally (Figure 4); however, in the CO2 emission inventory of 45 sectors, it was only possible to determine that the construction sector led to the highest emissions, while it was not possible to distinguish the contributions of this sector’s subsectors.
Table 6.
Comparison of the CO2 emission inventories of the 45-sector and 149-sector classifications.
Therefore, when decomposing embodied CO2 emissions by the final demand of a certain sector, the analyses based on the CO2 emission matrix of 149 sectors are more specific and targeted. Accordingly, this approach can also help us to analyze the distribution characteristics of sectoral CO2 emissions in detail. On the contrary, the analyses of the CO2 emission matrix of 45 sectors can only provide general conclusions, which may lead to imprecise and inaccurate emission reduction policies.
3.5. Sensitivity Analysis
The number of sectors in the I–O tables published by the National Bureau of Statistics vary for different years; this may lead to unreliable results from carbon emission analyses when using the I–O model based on the classification of I–O tables. To enhance the reliability of sectoral analysis results, we performed sensitivity analysis by altering the number of sectors in the experiment and analyzing the results. We consequently obtained the 95 sector (shown in Table A2) carbon emission inventory and the 135 sector (shown in Table A3) carbon emission inventory according to the energy consumption data allocation method. The analysis results of the sectoral distribution characteristics of these two carbon emission inventories are detailed below.
In the carbon emission inventory of 95 sectors, the production and supply of electricity and heat power remains the largest contributor of direct carbon emissions, with smelting and processing of ferrous metals occupying the second place. These two sectors account for approximately 70% of the total emissions from all sectors. On decomposing carbon emissions from the production and supply of electricity and heat power, we discovered that the construction sector contributes the most to CO2 emitted by the production and supply of electricity and heat power, followed by the sector itself. Moreover, the construction sector is the largest contributor of embodied carbon emissions with production and supply of electricity and heat power sector occupying the second place. Further analysis revealed that the construction sector’s carbon emissions can be primarily attributed to the production and supply of electricity and heat power and smelting and processing of ferrous metals; the former provides electricity to the construction sector and the latter provides the main raw materials. Together, these two sectors contribute to > 70% of the total emissions from the construction sector (Figure 9). In the inventory of 135 sectors, the top two sectors with the largest direct carbon emissions are the production and supply of electricity and heat power (4429.59 Mt CO2) and rolling of steel (1283.75 Mt CO2). The rolling of steel subsector contributes to > 80% of the carbon emissions from the smelting and processing of ferrous metals sector. By analyzing the sectoral distribution characteristics, we found that the direct CO2 emissions from the production and supply of electric/heat power caused by the electric/heat demand of the construction sector is the largest, followed by the sector itself. This observation is the same for the inventory of 95 sectors. Moreover, the two sectors with the largest embodied carbon emissions are also the same as those for inventory of 95 sectors. Additionally, decomposing the embodied carbon emissions from the construction sector revealed that the supply of electricity and steel are the two major contributors, which correspond to the production and supply of electricity/heat power and the rolling of steel sector, respectively (Figure 10).
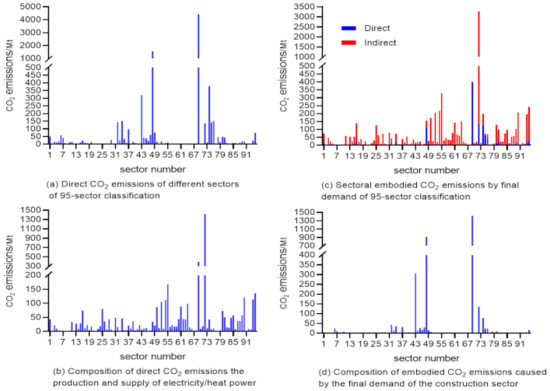
Figure 9.
CO2 emissions of 95 sectors based on the perspectives of production and demand.
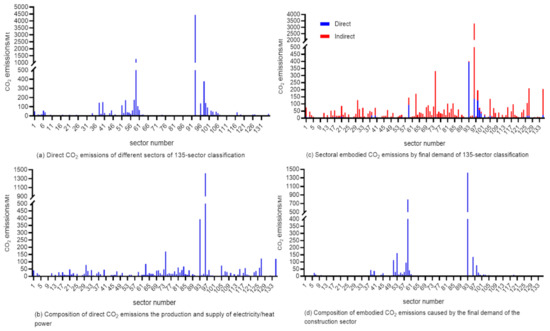
Figure 10.
CO2 emissions of 135 sectors based on production and demand perspectives.
On reducing the number of sectors to 95 and 135, we discovered that the sectoral distribution characteristics of carbon emissions vary with the number of sectors: the coarser the sector classification, the higher the sector concentration of carbon emissions. However, the classification level of sector does not affect the carbon emissions of those sectors that have not been split. These results are general and give strong support to the reliability of our analysis.
4. Conclusions and Suggestions
4.1. Conclusions
The number of sectors in the I–O table is usually more than that in the energy consumption table. Hence, most studies elect to aggregate the sectors of the I–O table to ensure that the sector classification of the energy consumption table is consistent with that of the I–O table; however, this can introduce inaccuracies to the results. In this study, we decomposed some sectors of the energy consumption table to make both tables consistent; then, we used the EIO–LCA model to analyze the decomposed energy consumption table. The following conclusions can be drawn.
The production and supply of electric/heat power (sector 98) contributed the most direct CO2 emissions, accounting for 51.20% of the total CO2 emissions from all sectors. In addition, the sectors with the 10 highest direct CO2 emissions accounted for >80% of the total CO2 emissions, indicating a high sector concentration of direct CO2 emissions, which should be the focus of emission reduction policies.
Considering the demand-based perspective, 5171.14 Mt of CO2 was emitted by the top 13 sectors with the highest embodied CO2 emissions, which accounted for 59.78% of the total CO2 emissions from all sectors. Among these 13 sectors, the highest embodied CO2 emissions corresponded to housing construction (sector 101), which accounted for 23.97% of the total CO2 emissions. Moreover, the embodied CO2 emissions of most sectors were mainly indirect emissions.
We compared the CO2 emission matrices of 45 sectors and 149 sectors; however, the results based on the 45-sector inventory were not sufficiently accurate. In contrast, the CO2 emission matrix of 149 sectors provided a more detailed perspective for the analysis of the relationship between the CO2 emissions of different sectors, which can be used for effective development of guidelines and formulation of emission reduction policies.
On performing a sensitivity analysis, we found that the results of this study are general, that is, the higher the sector resolution, the lower the sector concentration of carbon emissions. Moreover, the sector classification level does not affect the carbon emissions of those sectors that have not been split. In future studies, SDA analysis can be employed to investigate China’s high-precision carbon emission data.
It should be noted that this study had some limitations. When processing the competitive I–O table into a non-competitive I–O table, we assumed that the import rate within a sector was the same and equal to the ratio of imports/total output. This assumption may lead to two types of errors. First, the carbon intensity of imported products may be different from the carbon intensity of domestic products in China. If products are imported from developed countries, the value may be lower than that of China. Second, it is inaccurate to use only one import rate value for a certain sector. However, because we did not have adequate details on China’s import structure and import intensity by sector, we only focused on the sectoral distribution characteristics of CO2 emissions from domestic production and not those from imports. Therefore, the assumption of competitive imports was still adopted. Third, the energy consumption data allocation method based on the non-competitive I–O table of 149 sectors (Section 2.2.1) may have made the allocation coefficients of different types of energy the same, which is not the case. For example, the consumption of all petroleum products, such as gasoline and diesel, is distributed according to the allocation coefficients corresponding to the processing of refined petroleum and nuclear fuel (sector 41). The allocation method assumes that the ratio of petroleum products consumed by all sectors is constant. However, road freight transportation services may consume relatively more gasoline, while machinery supporting agricultural services may consume relatively more diesel. To solve this problem, more detailed sectoral energy consumption data from the National Bureau of Statistics of China are needed for future studies.
4.2. Policy Suggestions
From a production-based perspective, the formulation of emission reduction policies should focus on the 10 sectors with the highest CO2 emissions (Table 2). Emission reduction measures could commence by incorporating the following aspects: first, development of low-carbon energy and promotion of decarbonization of the power industry; second, improvement of energy efficiency in other sectors in order to control energy-related carbon emissions of production activities, especially in the seven sectors listed in Table 3.
From a demand-based perspective, the formulation of emission reduction policies should focus on the 13 sectors with the highest CO2 emissions (Table 4). Taking housing construction (sector 101)—with the largest embodied CO2 emissions—as an example, the CO2 emissions caused by final demand could be controlled based on the following aspects: first, improvement in raw material utilization efficiency in the housing construction sector and to reduction in the use of raw materials while maintaining the final demand; second, upgradation of technology in the six sectors (Table 5) that contribute significantly to embodied CO2 emissions to control direct emissions during the production stage of these sectors.
Author Contributions
Conceptualization, J.J.; data curation, F.H. and Y.Y.; formal analysis, F.H. and Y.Y.; funding acquisition, J.J., D.W. and Z.Y.; investigation, F.H. and X.L.; methodology, F.H. and J.J.; project administration, F.H. and Y.Y.; resources, J.J.; software, F.H. and X.L.; supervision, J.J.; validation, F.H., Y.Y. and X.L.; visualization, F.H.; writing—original draft, F.H.; writing—review & editing, Y.Y., X.L., D.W., J.J., Z.Y. All authors have read and agreed to the published version of the manuscript.
Funding
This work was funded by the Starting Research Fund from Harbin Institute of Technology, Shenzhen (No. GD45001017), the Low-carbon Economics Development Program of Harbin Institute of Technology, Shenzhen (SZDRC [2018] No. 725) and the National Key Research and Development Program of China (No. 2019YFC0507505).
Institutional Review Board Statement
Not applicable.
Informed Consent Statement
Not applicable.
Data Availability Statement
The data presented in this study are available on request from the corresponding author.
Conflicts of Interest
The authors declare no conflict of interest.
Appendix A
Table A1.
Sector correspondence between input–output table and energy consumption table.
Table A1.
Sector correspondence between input–output table and energy consumption table.
| Consumption of Energy by Sector | Input–Output Table by Sector | ||
|---|---|---|---|
| Sector | Sector | ||
| 01 | Agriculture, forestry, animal husbandry and fishery | 01 | Farming |
| 02 | Forestry | ||
| 03 | Animal husbandry | ||
| 04 | Fishery | ||
| 05 | Service in support agriculture, forestry, animal husbandry and fishery | ||
| 02 | Mining and washing of coal | 06 | Mining and washing of coal |
| 03 | Extraction of petroleum and natural gas | 07 | Extraction of petroleum and natural gas |
| 04 | Mining and processing of ferrous metal ores | 08 | Mining and processing of ferrous metal ores |
| 05 | Mining and processing of non-ferrous metal ores | 09 | Mining and processing of non-ferrous metal ores |
| 06 | Mining and processing of nonmetal ores | 10 | Mining and processing of nonmetal ores |
| 07 | Support activities for mining and mining of other ores | 11 | Support activities for mining and mining of other ores |
| 08 | Processing of food from agricultural products | 12 | Grinding of grains |
| 13 | Processing of forage | ||
| 14 | Refining of vegetable oil | ||
| 15 | Manufacture of sugar | ||
| 16 | Slaughtering and processing of meat | ||
| 17 | Processing of aquatic products | ||
| 18 | Processing of vegetables, fruits, nuts, and other foods | ||
| 09 | Manufacture of foods | 19 | Manufacture of instant foods |
| 20 | Manufacture of dairy products | ||
| 21 | Manufacture of condiments and fermented products | ||
| 22 | Manufacture of other foods | ||
| 10 | Manufacture of liquor, beverages, and refined tea | 23 | Manufacture of alcohol and liquor |
| 24 | Manufacture of beverages | ||
| 25 | Manufacture of refined tea | ||
| 11 | Manufacture of tobacco | 26 | Manufacture of tobacco |
| 12 | Manufacture of textile | 27 | Manufacture of cotton, chemical fiber textile, and dyeing finishing products |
| 28 | Manufacture of wool spinning and dyeing finishing products | ||
| 29 | Manufacture of hemp, silk spun textiles, and processed products | ||
| 30 | Manufacture of knitting or crocheting and related products | ||
| 31 | Manufacture of textile products | ||
| 13 | Manufacture of textile, clothing apparel, and accessories | 32 | Manufacture of textile, clothing apparel, and accessories |
| 14 | Manufacture of leather, fur, feather, footwear, and related products | 33 | Manufacture of leather, fur, feathers, and related products |
| 34 | Manufacture of footwear | ||
| 15 | Processing of timber, manufacture of wood, bamboo, rattan, palm, and straw products | 35 | Processing of timber, wood, bamboo, rattan, palm, and straw products |
| 16 | Manufacture of furniture | 36 | Manufacture of furniture |
| 17 | Manufacture of paper and paper products | 37 | Manufacture of paper and paper products |
| 18 | Printing and reproduction of recording media | 38 | Printing and reproduction of recording media |
| 19 | Manufacture of articles for culture, education, arts and crafts, sports and entertainment activities | 39 | Manufacture of Arts and crafts |
| 40 | Manufacture of articles for culture, education, sports and entertainment activities | ||
| 20 | Processing of petroleum, coking and processing of nuclear fuel | 41 | Processing of refined petroleum and nuclear fuel |
| 42 | Processing of coal | ||
| 21 | Manufacture of raw chemical materials and chemical products | 43 | Manufacture of basic raw chemical materials |
| 44 | Manufacture of fertilizers | ||
| 45 | Manufacture of pesticides | ||
| 46 | Manufacture of paints, printing inks, pigments, and similar products | ||
| 47 | Manufacture of synthetic materials | ||
| 48 | Manufacture of special chemical products and explosives, pyrotechnics, fireworks products | ||
| 49 | Manufacture of chemical products for daily use | ||
| 22 | Manufacture of medicines | 50 | Manufacture of medicines |
| 23 | Manufacture of chemical fibers | 51 | Manufacture of chemical fiber |
| 24 | Manufacture of rubber and plastic products | 52 | Manufacture of rubber |
| 53 | Manufacture of plastic | ||
| 25 | Manufacture of non-metallic mineral products | 54 | Manufacture of cement, lime, and gypsum |
| 55 | Manufacture of gypsum, cement products, and similar products | ||
| 56 | Manufacture of brick, stone, and other building materials | ||
| 57 | Manufacture of glass and glass products | ||
| 58 | Manufacture of ceramic products | ||
| 59 | Manufacture of refractory products | ||
| 60 | Manufacture of graphite and other non-metallic mineral products | ||
| 26 | Smelting and processing of ferrous metals | 61 | Steelmaking |
| 62 | Rolling of steel | ||
| 63 | Smelting of iron and ferroalloy | ||
| 27 | Smelting and processing of non-ferrous metals | 64 | Smelting of non-ferrous metals and manufacture of alloys |
| 65 | Rolling of non-ferrous metals | ||
| 28 | Manufacture of metal products | 66 | Manufacture of metal products |
| 29 | Manufacture of general purpose machinery | 67 | Manufacture of boiler and prime mover |
| 68 | Processing of metal machinery | ||
| 69 | Manufacture of material handling equipment | ||
| 70 | Manufacture of pump, valve, compressor, and similar machinery | ||
| 71 | Manufacture of machinery for culture activity and office work | ||
| 72 | Manufacture of other general purpose equipment | ||
| 30 | Manufacture of special purpose machinery | 73 | Manufacture of special purpose machinery for mining, metallurgy and construction |
| 74 | Manufacture of special purpose machinery for chemical industry, processing of timber and nonmetals | ||
| 75 | Manufacture of special purpose machinery for agriculture, forestry, animal husbandry and fishery | ||
| 76 | Manufacture of other special purpose machinery | ||
| 31 | Manufacture of automobiles | 77 | Manufacture of cars |
| 78 | Manufacture of auto parts and accessories | ||
| 32 | Manufacture of railway, ship, aerospace, and other transport equipment | 79 | Manufacture of railroad transport and urban rail transit equipment |
| 80 | Manufacture of ships and related equipment | ||
| 81 | Manufacture of other transport equipment | ||
| 33 | Manufacture of electrical machinery and apparatus | 82 | Manufacture of generators |
| 83 | Manufacture of equipment for power transmission and distribution and control | ||
| 84 | Manufacture of wire, cable, optical cable, and electrical appliance | ||
| 85 | Manufacture of batteries | ||
| 86 | Manufacture of household appliances | ||
| 87 | Manufacture of other electrical machinery and equipment | ||
| 34 | Manufacture of computers, communication and other electronic equipment | 88 | Manufacture of computer |
| 89 | Manufacture of communication equipment | ||
| 90 | Manufacture of radar, broadcasting and television equipment and its supporting equipment | ||
| 91 | Manufacture of audiovisual apparatus | ||
| 92 | Manufacture of electronic component | ||
| 93 | Manufacture of other electronic equipment | ||
| 35 | Manufacture of measuring instruments machinery | 94 | Manufacture of measuring instruments machinery |
| 36 | other manufacture | 95 | Manufacture of other products |
| 37 | Utilization of waste resources | 96 | Recycling and processing of waste resources and material products |
| 38 | Repair service of metal products, machinery and equipment | 97 | Repair service of metal products, machinery and equipment |
| 39 | Production and supply of electric and heat power | 98 | Production and supply of electric and heat power |
| 40 | Production and supply of gas | 99 | Production and supply of gas |
| 41 | Production and supply of water | 100 | Production and supply of water |
| 42 | Construction | 101 | Housing construction |
| 102 | Civil engineering construction | ||
| 103 | Construction and installation | ||
| 104 | Building decoration, decoration and other construction services | ||
| 43 | Transport, storage and post | 105 | Passenger transport via railway |
| 106 | Cargo transport via railway and support activities | ||
| 107 | Urban public traffic and highway passenger transport | ||
| 108 | Cargo transport via road and support activities | ||
| 109 | Water passenger transport | ||
| 110 | Water cargo transport and support activities | ||
| 111 | Air passenger transport | ||
| 112 | Air cargo transport and support activities | ||
| 113 | Transport via pipeline | ||
| 114 | Multimodal transport and shipping agent | ||
| 115 | Handling and storage | ||
| 116 | Post | ||
| 44 | Wholesale and retail trade and catering | 117 | Wholesale |
| 118 | Retail | ||
| 119 | Hotels | ||
| 120 | Catering services | ||
| 45 | Others | 121 | Telecommunications |
| 122 | Broadcast television and satellite transmission services | ||
| 123 | Internet and related services | ||
| 124 | Software service | ||
| 125 | Information Technology service | ||
| 126 | Monetary finance and other financial Services | ||
| 127 | Capital market services | ||
| 128 | Insurance | ||
| 129 | Real estate | ||
| 130 | Leasing | ||
| 131 | Business services | ||
| 132 | Research and experimental development | ||
| 133 | Professional technical service | ||
| 134 | Technology promotion and application services | ||
| 135 | Management of water conservancy | ||
| 136 | Ecological protection and environment management | ||
| 137 | Management of public facilities and land | ||
| 138 | Residential services | ||
| 139 | Other services | ||
| 140 | Education | ||
| 141 | Health | ||
| 142 | Social work | ||
| 143 | Journalism and publishing activities | ||
| 144 | Broadcasting, movies, televisions and audiovisual activities | ||
| 145 | Cultural and art activities | ||
| 146 | Sports activities | ||
| 147 | Entertainment | ||
| 148 | Social security | ||
| 149 | Public management and social organization | ||
Table A2.
The 95-sector classification for I–O table.
Table A2.
The 95-sector classification for I–O table.
| Sector | Sector | ||
|---|---|---|---|
| 01 | Farming | 49 | Smelting and processing of non-ferrous metals |
| 02 | Forestry | 50 | Metal products |
| 03 | Animal husbandry | 51 | Boiler and prime mover |
| 04 | Fishery | 52 | Metalworking machinery and other general machinery |
| 05 | Service in support agriculture, forestry, animal husbandry and fishery | 53 | Cultivation, forestry, animal husbandry and fishery machinery |
| 06 | Mining and washing of coal | 54 | Other special equipment |
| 07 | Extraction of petroleum and natural gas | 55 | Manufacture of automobiles |
| 08 | Mining and processing of ferrous metal ores | 56 | Manufacture of railroad transport and urban rail transit equipment |
| 09 | Mining and processing of non-ferrous metal ores | 57 | Manufacture of ships and related equipment |
| 10 | Mining and processing of non-metallic minerals and other mining | 58 | Manufacture of other transport equipment |
| 11 | Grain mill products, feeding stuff production and vegetable oil | 59 | Generators |
| 12 | Sugar refining | 60 | Household appliances |
| 13 | Slaughtering and meat processing | 61 | Other electric machinery and equipment |
| 14 | Prepared fish and seafood | 62 | Electronic computer |
| 15 | Other food processing and production | 63 | Electronic appliances and elements |
| 16 | Manufacture of foods | 64 | Other electronic and communication equipment |
| 17 | Wines, spirits and liquors | 65 | Measuring instruments machinery |
| 18 | Non-alcoholic beverage and refined tea | 66 | Other manufacturing products |
| 19 | Tobacco products | 67 | Utilization of waste resources |
| 20 | Cotton textiles | 68 | Repair service of metal products, machinery and equipment |
| 21 | Woolen textiles | 69 | Production and supply of electric and heat power |
| 22 | Hemp textiles | 70 | Production and supply of gas |
| 23 | Knitted mills | 71 | Production and supply of water |
| 24 | Manufacture of textile products | 72 | Construction |
| 25 | Manufacture of textile, clothing apparel, and accessories | 73 | Railway transport |
| 26 | Manufacture of leather, fur, feather, footwear, and related products | 74 | Highway transport |
| 27 | Processing of timber, manufacture of wood, bamboo, rattan, palm, and straw products | 75 | Water transport |
| 28 | Manufacture of furniture | 76 | Air transport and other transport |
| 29 | Manufacture of paper and paper products | 77 | Pipeline transport |
| 30 | Printing and reproduction of recording media | 78 | Warehousing |
| 31 | Manufacture of articles for culture, education, arts and crafts, sports and entertainment activities | 79 | Post |
| 32 | Processing of refined petroleum and nuclear fuel | 80 | Wholesale and retail trade |
| 33 | Processing of coal | 81 | Catering |
| 34 | Basic raw chemical materials | 82 | Finance |
| 35 | Fertilizers | 83 | Insurance |
| 36 | Pesticides | 84 | Real estate |
| 37 | Manufacture of other chemical products | 85 | Scientific research and experiment |
| 38 | Manufacture of chemical products for daily use | 86 | Technology promotion and application services |
| 39 | Medical and pharmaceutical products | 87 | Water conservancy , environmental management and public infrastructure management |
| 40 | Chemical fibers | 88 | Residential services |
| 41 | Rubber products | 89 | Education |
| 42 | Plastic products | 90 | Health |
| 43 | Cement, lime, plaster and other building materials | 91 | Social work |
| 44 | Glass and glass products | 92 | Culture, arts, radio, television, film and audio-video |
| 45 | Ceramic products | 93 | Sports activities |
| 46 | Fireproof products | 94 | Public administration and social organization |
| 47 | Graphite and other non-metallic mineral products | 95 | Other services |
| 48 | Smelting and processing of ferrous metals | ||
Table A3.
The 135-sector classification for I–O table.
Table A3.
The 135-sector classification for I–O table.
| Sector | Sector | ||
|---|---|---|---|
| 01 | Farming | 69 | Manufacture of other general purpose equipment |
| 02 | Forestry | 70 | Manufacture of special purpose machinery for mining, metallurgy and construction |
| 03 | Animal husbandry | 71 | Manufacture of special purpose machinery for chemical industry, processing of timber and nonmetals |
| 04 | Fishery | 72 | Manufacture of special purpose machinery for agriculture, forestry, animal husbandry and fishery |
| 05 | Service in support agriculture, forestry, animal husbandry and fishery | 73 | Manufacture of other special purpose machinery |
| 06 | Mining and washing of coal | 74 | Manufacture of automobiles |
| 07 | Extraction of petroleum and natural gas | 75 | Manufacture of railroad transport and urban rail transit equipment |
| 08 | Mining and processing of ferrous metal ores | 76 | Manufacture of ships and related equipment |
| 09 | Mining and processing of non-ferrous metal ores | 77 | Manufacture of other transport equipment |
| 10 | Mining and processing of non-metallic minerals and other mining | 78 | Manufacture of generators |
| 11 | Grinding of grains | 79 | Manufacture of equipment for power transmission and distribution and control |
| 12 | Processing of forage | 80 | Manufacture of wire, cable, optical cable, and electrical appliance |
| 13 | Refining of vegetable oil | 81 | Manufacture of batteries and household appliances |
| 14 | Manufacture of sugar | 82 | Manufacture of other electrical machinery and equipment |
| 15 | Slaughtering and processing of meat | 83 | Manufacture of computer |
| 16 | Processing of aquatic products | 84 | Manufacture of communication equipment |
| 17 | Processing of vegetables, fruits, nuts, and other foods | 85 | Manufacture of radar, broadcasting and television equipment and its supporting equipment |
| 18 | Manufacture of instant foods | 86 | Manufacture of audiovisual apparatus |
| 19 | Manufacture of dairy products | 87 | Manufacture of electronic component |
| 20 | Manufacture of condiments and fermented products | 88 | Manufacture of other electronic equipment |
| 21 | Manufacture of other foods | 89 | Manufacture of measuring instruments machinery |
| 22 | Manufacture of alcohol and liquor | 90 | Manufacture of other products |
| 23 | Non-alcoholic beverage and refined tea | 91 | Recycling and processing of waste resources and material products |
| 24 | Manufacture of tobacco | 92 | Repair service of metal products, machinery and equipment |
| 25 | Manufacture of cotton, chemical fiber textile, and dyeing finishing products | 93 | Production and supply of electric and heat power |
| 26 | Manufacture of wool spinning and dyeing finishing products | 94 | Production and supply of gas |
| 27 | Manufacture of hemp, silk spun textiles, and processed products | 95 | Production and supply of water |
| 28 | Manufacture of knitting or crocheting and related products | 96 | Construction |
| 29 | Manufacture of textile products | 97 | Railway transport |
| 30 | Manufacture of textile, clothing apparel, and accessories | 98 | Highway transport |
| 31 | Manufacture of leather, fur, feather, footwear, and related products | 99 | Water transport |
| 32 | Processing of timber, manufacture of wood, bamboo, rattan, palm, and straw products | 100 | Air transport |
| 33 | Manufacture of furniture | 101 | Pipeline transport |
| 34 | Manufacture of paper and paper products | 102 | Multimodal transport and shipping agent |
| 35 | Printing and reproduction of recording media | 103 | Handling and storage |
| 36 | Manufacture of Arts and crafts | 104 | Post |
| 37 | Manufacture of articles for culture, education, sports and entertainment activities | 105 | Wholesale and retail trade |
| 38 | Processing of refined petroleum and nuclear fuel | 106 | Hotels |
| 39 | Processing of coal | 107 | Catering services |
| 40 | Manufacture of basic raw chemical materials | 108 | Telecommunications and other information transmission services |
| 41 | Manufacture of fertilizers | 109 | Internet and related services |
| 42 | Manufacture of pesticides | 110 | Software service |
| 43 | Manufacture of paints, printing inks, pigments, and similar products | 111 | Information Technology service |
| 44 | Manufacture of synthetic materials | 112 | Monetary finance and other financial Services |
| 45 | Manufacture of special chemical products and explosives, pyrotechnics, fireworks products | 113 | Capital market services |
| 46 | Manufacture of chemical products for daily use | 114 | Insurance |
| 47 | Manufacture of medicines | 115 | Real estate |
| 48 | Manufacture of chemical fiber | 116 | Leasing |
| 49 | Manufacture of rubber | 117 | Business services |
| 50 | Manufacture of plastic | 118 | Research and experimental development |
| 51 | Manufacture of cement, lime, and gypsum | 119 | Professional technical service |
| 52 | Manufacture of gypsum, cement products, and similar products | 120 | Technology promotion and application services |
| 53 | Manufacture of brick, stone, and other building materials | 121 | Management of water conservancy |
| 54 | Manufacture of glass and glass products | 122 | Ecological protection and environment management |
| 55 | Manufacture of ceramic products | 123 | Management of public facilities and land |
| 56 | Manufacture of refractory products | 124 | Residential services |
| 57 | Manufacture of graphite and other non-metallic mineral products | 125 | Other services |
| 58 | Steelmaking | 126 | Education |
| 59 | Rolling of steel | 127 | Health |
| 60 | Smelting of iron and ferroalloy | 128 | Social work |
| 61 | Smelting of non-ferrous metals and manufacture of alloys | 129 | Journalism and publishing activities |
| 62 | Rolling of non-ferrous metals | 130 | Broadcasting, movies, televisions and audiovisual activities |
| 63 | Manufacture of metal products | 131 | Cultural and art activities |
| 64 | Manufacture of boiler and prime mover | 132 | Sports activities |
| 65 | Processing of metal machinery | 133 | Entertainment |
| 66 | Manufacture of material handling equipment | 134 | Social security |
| 67 | Manufacture of pump, valve, compressor, and similar machinery | 135 | Public management and social organization |
| 68 | Manufacture of machinery for culture activity and office work | ||
References
- Ardakani, M.K.; Seyedaliakbar, S.M. Impact of energy consumption and economic growth on CO2 emission using multivariate regression. Energy Strateg. Rev. 2019, 26, 100428. [Google Scholar] [CrossRef]
- Friedlingstein, P.; O’Sullivan, M.; Jones, M.W.; Andrew, R.M.; Hauck, J.; Olsen, A.; Peters, G.P.; Peters, W.; Pongratz, J.; Sitch, S.; et al. The Global Carbon Budget 2020. Earth Syst. Sci. Data 2020, 12, 3269–3340. [Google Scholar] [CrossRef]
- NBSC. China Energy Statistical Yearbook 2018; China Statistics Press: Beijing, China, 2019. (In Chinese) [Google Scholar]
- NBSC. Input-Output Tables of China 2017; China Statistics Press: Beijing, China, 2019. (In Chinese) [Google Scholar]
- Steen-Olsen, K.; Owen, A.; Hertwich, E.G.; Lenzen, M. Effects of Sector Aggregation on CO2 Multipliers in Multiregional Input–Output Analyses. Econ. Syst. Res. 2014, 26, 284–302. [Google Scholar] [CrossRef]
- De Koning, A.; Bruckner, M.; Lutter, S.; Wood, R.; Stadler, K.; Tukker, A. Effect of aggregation and disaggregation on embodied material use of products in input–output analysis. Ecol. Econ. 2015, 116, 289–299. [Google Scholar] [CrossRef]
- Su, B.; Huang, H.C.; Ang, B.W.; Zhou, P. Input–output analysis of CO2 emissions embodied in trade: The effects of sector aggregation. Energy Econ. 2010, 32, 166–175. [Google Scholar] [CrossRef]
- Li, J.; Wei, W.; Zhen, W.; Guo, Y.; Chen, B. How Green Transition of Energy System Impacts China’s Mercury Emissions. Earth’s Future 2019, 7, 1407–1416. [Google Scholar] [CrossRef]
- Lenzen, M. Aggregation versus Disaggregation in Input–Output Analysis of the Environment. Econ. Syst. Res. 2011, 23, 73–89. [Google Scholar] [CrossRef]
- Lindner, S.; Legault, J.; Guan, D. Disaggregating Input–Output Models with Incomplete Information. Econ. Syst. Res. 2012, 24, 329–347. [Google Scholar] [CrossRef]
- Meng, F.; Liu, G.; Chang, Y.; Su, M.; Hu, Y.; Yang, Z. Quantification of urban water-carbon nexus using disaggregated input-output model: A case study in Beijing (China). Energy 2019, 171, 403–418. [Google Scholar] [CrossRef]
- Lindner, S.; Legault, J.; Guan, D. Disaggregate the electricity sector of China’s input-output table for improved environmental life-cycle assessment. Econ. Syst. Res. 2013, 25, 300–320. [Google Scholar] [CrossRef]
- Luo, F.; Guo, Y.; Yao, M.; Cai, W.; Wang, M.; Wei, W. Carbon emissions and driving forces of China’s power sector: Input-output model based on the disaggregated power sector. J. Clean. Prod. 2020, 268, 121925. [Google Scholar] [CrossRef]
- Chang, Y.; Ries, R.J.; Man, Q.; Wang, Y. Disaggregated I-O LCA model for building product chain energy quantification: A case from China. Energ. Buildings 2014, 72, 212–221. [Google Scholar] [CrossRef]
- Langarita, R.; Duarte, R.; Hewings, G.; Sánchez-Chóliz, J. Testing European goals for the Spanish electricity system using a disaggregated CGE model. Energy 2019, 179, 1288–1301. [Google Scholar] [CrossRef]
- Liu, L.; Huang, G.; Baetz, B.; Cheng, G.; Pittendrigh, S.M.; Pan, S. Input-output modeling analysis with a detailed disaggregation of energy sectors for climate change policy-making: A case study of Saskatchewan, Canada. Renew. Energ. 2020, 151, 1307–1317. [Google Scholar] [CrossRef]
- Zhang, Q.; Nakatani, J.; Moriguchi, Y. Compilation of an Embodied CO2 Emission Inventory for China Using 135-Sector Input-Output Tables. Sustainability 2015, 7, 8223–8239. [Google Scholar] [CrossRef]
- Minx, J.C.; Baiocchi, G.; Peters, G.P.; Weber, C.L.; Guan, D.; Hubacek, K. A “Carbonizing Dragon”: China’s Fast Growing CO2 Emissions Revisited. Environ. Sci. Technol. 2011, 45, 9144–9153. [Google Scholar] [CrossRef]
- Douglas, S.; Nishioka, S. International differences in emissions intensity and emissions content of global trade. J. Dev. Econ. 2012, 99, 415–427. [Google Scholar] [CrossRef]
- Hendrickson, C.; Horvath, A.; Joshi, S.; Lave, L.B. Economic Input–Output Models for Environmental Life-Cycle Assessment. Environ. Sci. Technol. 1998, 32, 184A–191A. [Google Scholar] [CrossRef]
- Wu, S.; Li, S.; Lei, Y.; Li, L. Temporal changes in China’s production and consumption-based CO2 emissions and the factors contributing to changes. Energy Econ. 2020, 89, 104770. [Google Scholar] [CrossRef]
- Li, Q.; Wu, S.; Lei, Y.; Li, S. Dynamic features and driving forces of indirect CO2 emissions from Chinese household: A comparative and mitigation strategies analysis. Sci. Total Environ. 2020, 704, 135367. [Google Scholar] [CrossRef]
- Wang, Z.; Su, B.; Xie, R.; Long, H. China’s aggregate embodied CO2 emission intensity from 2007 to 2012: A multi-region multiplicative structural decomposition analysis. Energy Econ. 2020, 85, 104568. [Google Scholar] [CrossRef]
- Eker, S.; Rovenskaya, E.; Obersteiner, M.; Langan, S. Practice and perspectives in the validation of resource management models. Nat. Commun. 2018, 9, 5359. [Google Scholar] [CrossRef] [PubMed]
- Sajid, M.J.; Qiao, W.; Cao, Q.; Kang, W. Prospects of industrial consumption embedded final emissions: A revision on Chinese household embodied industrial emissions. Sci. Rep. 2020, 10, 1–20. [Google Scholar] [CrossRef] [PubMed]
- NBSC. 2017 Industrial Classification for National Economic Activities (GB/T 4754—2017). Available online: http://www.stats.gov.cn/tjsj/tjbz/hyflbz/201710/t20171012_1541679.html (accessed on 29 September 2017).
- Liu, Y.; Chen, S.; Chen, B.; Yang, W. Analysis of CO2 emissions embodied in China’s bilateral trade: A non-competitive import input–output approach. J. Clean. Prod. 2017, 163, S410–S419. [Google Scholar] [CrossRef]
- Su, B.; Ang, B.W. Input–output analysis of CO2 emissions embodied in trade: Competitive versus non-competitive imports. Energy Policy 2013, 56, 83–87. [Google Scholar] [CrossRef]
- Chen, B.; Li, J.S.; Chen, G.Q.; Wei, W.D.; Yang, Q.; Yao, M.T.; Shao, J.A.; Zhou, M.; Xia, X.H.; Dong, K.Q.; et al. China’s energy-related mercury emissions: Characteristics, impact of trade and mitigation policies. J. Clean. Prod. 2017, 141, 1259–1266. [Google Scholar] [CrossRef]
- Tian, Y.; Xiong, S.; Ma, X.; Ji, J. Structural path decomposition of carbon emission: A study of China’s manufacturing industry. J. Clean. Prod. 2018, 193, 563–574. [Google Scholar] [CrossRef]
- Chinese Development and Reform Commission. Provincial Greenhouse Gas Inventory Compilation Guide (Trial). Available online: http://www.cbcsd.org.cn/sjk/nengyuan/standard/home/20140113/download/shengjiwenshiqiti.pdf (accessed on 1 December 2020).
- Sector of Climate Change, National Development and Reform Commission. 2005 People’s Republic of China National Greenhouse Gas Inventory; China Environmental Science Press: Beijing, China, 2014. (In Chinese) [Google Scholar]


Publisher’s Note: MDPI stays neutral with regard to jurisdictional claims in published maps and institutional affiliations. |
© 2021 by the authors. Licensee MDPI, Basel, Switzerland. This article is an open access article distributed under the terms and conditions of the Creative Commons Attribution (CC BY) license (https://creativecommons.org/licenses/by/4.0/).