Abstract
Smart and automated maintenance could make the system and its parts more sustainable by extending their lifecycle, failure detection, smart control of the equipment, and precise detection and reaction to unexpected circumstances. This article focuses on the analysis of data, particularly on logs captured in several Czech tunnel systems. The objective of the analysis is to find useful information in the logs for predicting upcoming situations, and furthermore, to check the possibilities of predictive diagnostics and to design the process of predictive maintenance. The main goal of the article is to summarize the possibilities of optimizing system maintenance that are based on data analysis as well as expert analysis based on the experience with the equipment in the tunnel. The results, findings, and conclusions could primarily be used in the tunnels; secondarily, these principles could be applied in telematics and lead to the optimization and improvement of system sustainability.
1. Introduction
Operation and maintenance are essential to ensure the proper function of technological and technical systems, telematics, and tunnel systems as well. It is necessary to monitor, track, and take control over the whole system, its partial components and to check if the system is operable or not. The assessment of proper functioning of the system can be determined by error detection together with checking that all components of the system are working as expected. The process that involves a set of these detection methods is known as diagnostics.
Two main approaches can be applied in diagnostics. The first approach is a direct method, which consists of measuring the technical parameters of the components and its comparison with the expected values. The changes of processes and parameters are important during their measurement. Any animosity or instability can negatively affect the system—the lifetime can be shortened, equipment malfunctions can appear more frequently, etc. Usually, there is a direct proportion between these parameters and conditions.
The second approach of error detection is the indirect method, which is based on the parameter measurement and its comparison with historical data. The prediction of damage or any negative impact on the system is based on the computing and estimation of suspected conditions. The values measured in real time are compared with recalculated values. Thus, it is possible to monitor the functional behavior of the system and its lifetime characteristics [1,2,3,4]. The forecasting of failure can be used for the reinforcement learning of neural networks, but their performance cannot be guaranteed, and it requires a large amount of data to obtain plausible results [5,6].
The main goal of diagnostics is to collect all relevant data and information about the system processes and evaluate these data in an appropriate way. By comparing historical data, prescribed requirements, expected behavior, and real-time data measurements, it is possible to determine the current state and actual conditions of the system and the estimation of upcoming conditions can be carried out as the next step-expected trends during a specific time period and the anticipated lifetime cycle can be predicted, which thus would lead to an improvement of error detection and make the process of diagnostics and system maintenance smarter and cheaper. Diagnostics must consider the error model of each component, especially when the component is safety-related. Usually, safety-related components have self-diagnostics and/or redundancy which allows one to increase their safety integrity level. Since the probability of the failure of a single component is usually very low, the behavior in case of failure must be simulated [7,8]. Providing the complete error model for the whole system is extremely difficult due to the computational complexity and the lack of required parameters. The communication interface between the components is also a possible source of failures, which also should be considered [9].
In general, to ensure proper operation and function of a telematic system, such as a tunnel, it is necessary to ensure facility management and regular maintenance. Maintenance can be basically divided into operative maintenance, usually based on information mainly from the operator ensuring control and operation of the equipment, or scheduled maintenance, which is carried out in regular cycles several times a year. The maintenance can be categorized based on the failures, e.g., according to [3,10].
Important approaches in failure maintenance are predictive maintenance (PdM), which is based on continuous diagnostics and evaluation of the current state and of the prediction of the trends that forecast the future state of the device. Automated maintenance that is based on data and the device status in real time with the use of information systems and total productive maintenance (TPM), where the emphasis is on all parts on all levels of components, systems and management. This is often used in automotives, where methods such as Six Sigma are introduced not only on the level of equipment analysis but also for other processes. A big motivation for introducing new trends in maintenance and diagnostics are the cost, namely the effort to reduce operating costs [10].
As already mentioned, a proper functioning system should be operated and controlled, but the service and maintenance are also required. The maintenance, which includes error identification and troubleshooting, is an essential part of correctly operating systems and this fact should be considered within cost analyses. [3,10]. The example of annual tunnels’ operating costs is illustrated in Figure 1 below.
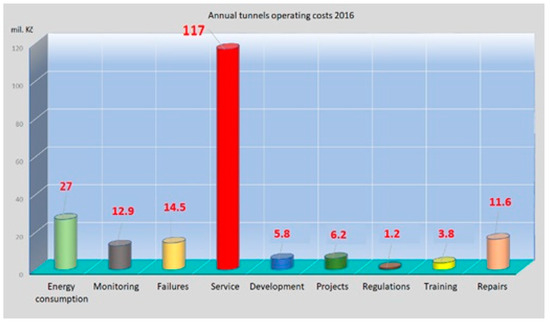
Figure 1.
Annual costs of tunnel operation [11].
This article focuses specifically on the information about the tunnel equipment that could be useful for the prediction of services. The hypothesis stated throughout the research is mainly about the elimination of the service innervation at the end of the equipment life cycle and the possibility of how to predict or detect some errors in advance. This challenge towards predictive maintenance is based on the detection of failures, unexpected states or the strange behavior of the system throughout its life cycle (the schematic illustration is in Figure 2), especially until the equipment could be maintained instead of being replaced in the case that its damage cannot be avoided in advance.
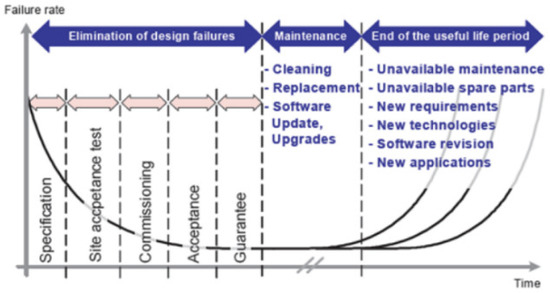
Figure 2.
Bathtub curve of failure rate [12].
The tunnels and their equipment are a specific telematic system and the functional architecture of this system is complex. It is necessary to consider that the type of equipment may influence the life cycle and different behavior is expected on particular parts and subsystems. Due to the fact that the analysis was made over the data and information about the equipment placed in the Czech tunnels, it should be mentioned that the scope is limited by Czech standards. Several parts of the system and its important requirements are defined in the Technical Standards (TS—Technical Standard is approved by the Ministry of Transport in the Czech Republic) for the tunnels in the Czech Republic, such as TS 98 [13], TS 154 [14], TS 229 [15]. Although the technical conditions define how to install the equipment and describe the service of the tunnels [13], the parts of the system are very specific and make the telematic tunnel system heterogenous and varied [14,15]. This fact led to the research question, whether the data logs captured in Czech tunnels are sufficient for predicting failures and error detection or not.
The next research question is related to the variety of equipment as well as installations and circumstances in a specific tunnel. The goal of the investigation is to determine whether the smart, automated and predictive maintenance is replicable from one tunnel system to another. Regular monitoring of the tunnel construction, including technology, is important for the maintenance and diagnostics of the construction and the identification of safety functions [16]. For the predictive maintenance of equipment in a tunnel, the continuous collection of quality data [3] is necessary, including the search for mutual correlations. Older or existing tunnel technologies have sent defined alarm messages [13,14,15], but often in an on/off form, which is not optimal for life cycle diagnostics. Therefore, it is necessary to focus on obtaining suitable data, their use for analysis and recommendations for standards creators that will allow a better definition of the requirements for the tunnel design for self-diagnostics.
It is necessary to mention the background of maintenance in the tunnels [17]. The research found that the field of failure and error detection is already investigated and applied worldwide in several tunnels as well as tunnel construction reparations [18] and inspection, for example, in the underground [19]. The inspection rate can be optimized with respect to the overall cost using semi-Markov process modeling [20].
Several publications focus on data-based maintenance, and others describe the general inspection of the equipment and service of the tunnels by inspectors [16]. Predictive failure detection has not been researched [21] in detail yet, especially in tunnels; however, several articles describe how to use predictive maintenance for specific systems in mechanical engineering, manufacturing processes, and other fields, for example, [22,23,24,25,26].
The main goal of this article is to assess the approaches and possibilities that could be applied for tunnel systems in the future, in particular on the basis of data captured in tunnels.
2. Material and Methods
This article is based on the data captured in specific tunnel systems in the Czech Republic. These data contain several types of information; specifically, information about alarms, warnings, traffic events, and timestamps as well as other specific notifications such as the type or class of the record. Furthermore, the dataset and the logs have been analyzed based on the expert’s unique know-how and knowledge of the tunnel systems.
The article and the research analysis leading to the improvement of the tunnel maintenance are based on several steps. Regarding the facts mentioned in the introductory part, the research of tunnel maintenance, diagnostics methods, and approaches, how to predict failures and detect the errors were analyzed. Furthermore, unique analyses over the dataset captured in specific tunnels in Prague and its surroundings were performed. Some outputs are described as well as suggestions of how to proceed and follow the performed steps in the future, with the main goal to implement prediction and improve maintenance and tunnel services by automated processes [3].
The data were collected during operation and during maintenance. Based on historical data and experience, these technologies have the most alarms and require regular and extraordinary service interventions. To verify the functions, common statistical approaches were used to look for potential failures based on data frequency or increased component group failures. Correlation and concurrency searches on the data helped to decide on potential future use in predictive diagnostics, which could lead to the use of statistical ARIMA models (AutoRegressive Integrated Moving Average) and an exponential smoothing model [10,11]. Correspondingly, it was assessed whether to use seasonal and nonseasonal model variants, as some factors, e.g., traffic intensity, are subject to seasonal trends during the year and may affect the results. For the actual implementation of these approaches, it is recommended to have sufficient quality data and historical time series to perform a basic analysis and monitor activities and their strong relationships. If we have enough data and correlations, we can use standard reliability methods based on the investigation of fault trees such as FTA (Failure Tree Analysis) or the more appropriate method FMEA (Failure Mode and Effects Analysis) [25], that is used as a support method for the safety evaluation of electronic systems [8] or use the neural network predictions or fuzzy methodology. However, the condition is quality data from technological equipment, including other information such as regular inspection once a year or in defined cycles [15] with electronic outputs for subsequent mathematical processing. Many data for analysis are unavailable or do not have a sufficient time series for processing [3], and thus only an expert assessment and proposal of measures is possible [15].
The goal was to find the necessary important markers that could be interpreted and to try to find correlations for the application of the above methods or approaches to fault and risk analysis [8,25]. The basic steps of obtaining the necessary information and data from specific devices and components of tunnel technology were followed. As some data information is not sufficiently known and available in older tunnel technologies, the applicability of suitable methods is limited [3,11]. Some data and information about the device are not available, other data from inspections and revisions are only in text form, and the quality of description does not allow to set the values of the probability of failure directly. Therefore, expert and statistical approaches were used, including correlations, to compare different tunnels with similar components and for the objectivity of the source data, mainly alarm messages were used.
Several outputs of the article are described as a frequency of notifications such as alarms or traffic events. In this article, the quantity is generally mentioned as N, where N is the count of the notifications captured in the log of the system behavior. These values are based on an immense data analysis which was performed as a basis for this article.
3. Results
From the definition of telematics, there are many systems and their types that can be analyzed and evaluated. The focus of this project was on tunnel devices and components, which have different natures, lifetimes, maintenance requirements, etc. This complex nature of tunnel devices is the reason to consider various approaches and ways of predictive diagnostics and thus the need for the detailed analysis of data from tunnel systems. Within the analysis, the check of notifications in the log was performed from the statistical view. The data contains:
- Logs of selected tunnel technologies for a certain period;
- Text list describing faults and errors in the specific tunnel;
- Inspection reports.
On the other hand, not only data and their processing should be the approach to how to achieve and find the way and processes that could be implemented for improving maintenance and failure prediction. Furthermore, the knowledge of tunnel systems is required for its implementation. For this reason, the proposal of the model is presented in the next part. This model could be a way towards smart dispatching and improving the detection of errors in advance and especially in real time. The last part deals with the expert analysis that has been performed. Its main goal was to find correlations among the parts of the tunnel system and relations among the equipment and state notifications that could lead to the prediction of failures at the same time. This expert analysis might be improved and automated by using system cognitive functions in the future. All these approaches are mentioned in the following Figure 3.
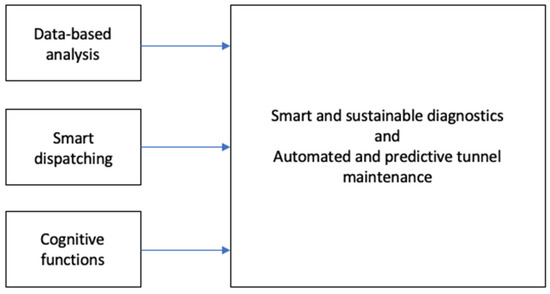
Figure 3.
Necessary and required inputs for predictive maintenance.
The following sections describe these three approaches to improving the maintenance, outputs and usability of the foundation. These approaches have been identified along with further suggestions on how to implement more advanced improvements to tunnel systems.
3.1. Data Analysis
3.1.1. Captured Data and Their Evaluation
The data were logged in the tunnels on the Czech highways as well as in the cities. The Lochkov tunnel located at the Prague Ring Road has been chosen for the analysis. That is the reason why the visualizations of this tunnel are below figured. The log from the Lochkov tunnel archives data for 4 months and contains several types of notifications with a specific meaning. Fault and error notifications are logged, and operational and traffic information is added. The notifications are split into the following groups:
- A0–A2—Alarm Notification;
- D0–D2—Traffic Events;
- E—Energetics;
- Sys—System Notifications.
The daily average of notifications was around 10,000 in the Lochkov tunnel during the analyzed period (from October 2018 to January 2019). The frequency of notifications was very diverse day to day, ranging from 4000 to over 20 000 notifications per day. This average is counted for all groups of notifications. It is necessary to mention that each notification should be generated and reset. This fact has an impact on the number of notifications—each notification is written in the log at least twice (generating a notification and resetting it).
The trend of generated notification frequency in November 2018 is illustrated below (Figure 4).
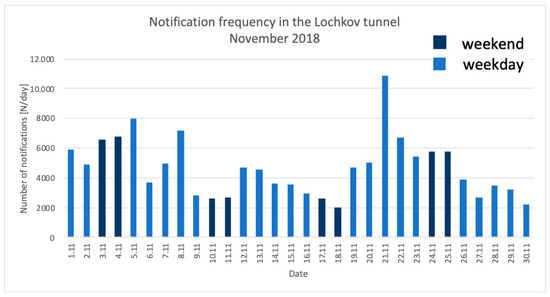
Figure 4.
Frequency of notifications in the Lochkov tunnel [3].
For the analysis, the frequency of notifications over time was performed for each specific group of notifications. For example, the alarm notifications are mentioned and analyzed in detail. All generated alarm notifications are mentioned in Figure 5. The trend during the analyzed period was very stable. The daily average generated alarm notifications was over 1500 samples. Figure 5 shows the total number of messages per day regardless of other parameters such as type of information, related events, specific device, etc.
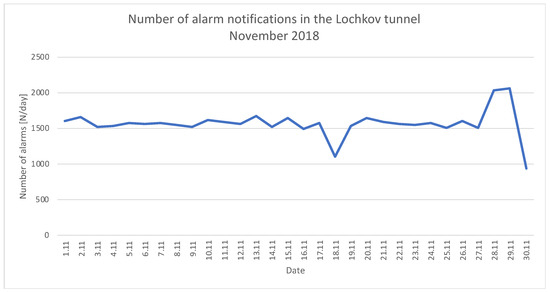
Figure 5.
Number of alarm messages per day [3].
Whereas the trend of alarm notifications is relatively stable, the notifications about traffic events change over time in easily distinguishable periods. These periods correspond to working days and weekends. The daily average usually ranged in the interval from 100 to 300 notifications per day. During the analyzed period, the number of notifications per day was sometimes out of the interval. This is probably caused by increased or decreased traffic volume in the Lochkov tunnel.
As is known in the transportation sciences, the traffic volume in general is lower during the weekends. The same tendency is observable in Figure 6. Extreme values below 100 notifications per day are recorded during the weekends as well as extreme values over 300 during the working days. This dependency is repeated many times with some regularity.
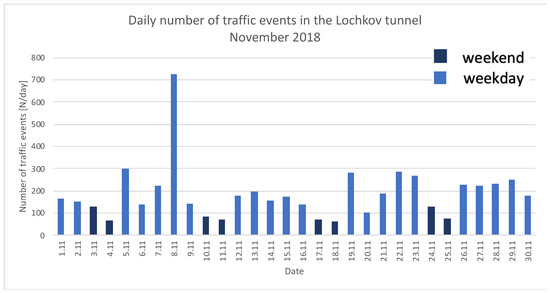
Figure 6.
Course of traffic reports in terms of their frequency per day [3].
The highest value in the group of traffic notifications was reported on November 8th, 2018 (Figure 7). An unusual situation was logged between 7 a.m. and 9 a.m. During the two hours, the number of notifications rapidly increased (several times higher than the normal daily average).
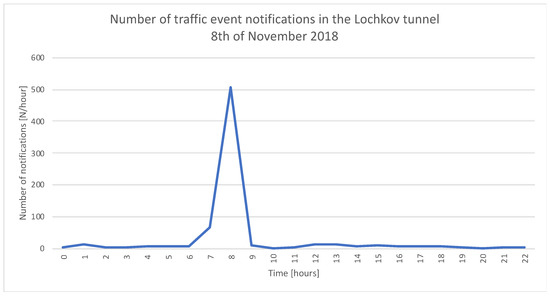
Figure 7.
Course of traffic reports in terms of their frequency on 8 November 2018 [3].
Detailed analysis of the log showed that many unexpected events and alarms happened from 7 a.m. to 9 a.m. Several unforeseen situations are listed below:
- Vehicle driving in opposite direction;
- Stationary vehicle;
- Unspecific objects on the road;
- Slow moving vehicle;
- Traffic jam;
- Dangerous cargo in the tunnel;
- Move to alarm monitor;
- Pedestrians in the tunnel;
- Fire or smoke danger;
- Dangerous cargo did not leave the tunnel direction.
Although during this time these unexpected events increased traffic alerts, the number of alarm notifications was not affected. This meant we had to confirm the research prerequisite that the alarms and failure detection are not affected by the traffic in the tunnel.
3.1.2. Traffic Events in the Tunnel
It is clear from these traffic event notifications that only two traffic events are the most important in terms of duration. Both notifications are related to dangerous cargo in the tunnel without leaving it. The longest ongoing situation is “dangerous goods in the right tunnel tube (RTT)” and same information about left tunnel tube (LTT) stands for the second longest notification. These two notifications took 90% of all notifications in terms of duration time. The pie chart below represents this ratio (Figure 8).
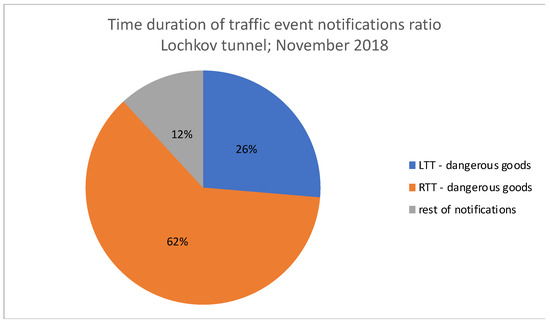
Figure 8.
Ratio of selected traffic reports in terms of their time duration [3]. LTT: left tunnel tube; RTT: right tunnel tube.
The notification about the left tube is continuously generated and reset over time, while the notification about the right tube was generated firstly on November 21st, but the duration time is much longer. This is caused by the methodology on how to count the duration time. Duration time is calculated based on the difference between the record and occurrence. Notice the progression of these notifications. The trend of notification frequency is shown below (Figure 9).
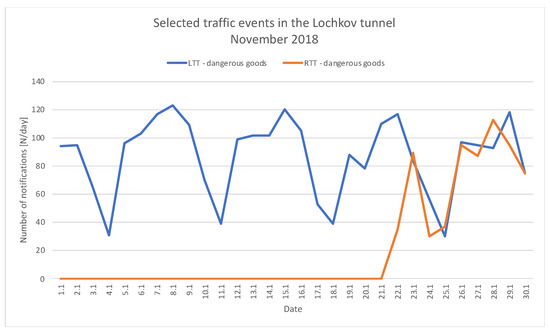
Figure 9.
Course of selected traffic reports in terms of their frequency per day [3].
Figure 9 shows that the number of notifications related to the left tube of the tunnel periodically repeats every week. The peak values are logged in correlation with the traffic volume during the working days. All periods are similar. The decrease appears during the weekends. These trends and correlations with traffic are clearer with this notification than all traffic reports in the log from the tunnel system.
3.1.3. Tunnels Comparison
The data from the Strahov tunnel were compared with the chosen notifications from the Lochkov tunnel to ensure an objective view on the log analysis. The selection process of notifications was based on the statistical basics. The most frequent and the longest (time duration) notifications were selected. A list of the ten most important notifications related to the specific report in the log, specific event or equipment was prepared for each specific group: alarms, traffic or energetical events, and system notifications.
For example, the ten most important notifications about traffic events are listed in Table 1 below. The figure shows the most frequent notifications from the Lochkov Tunnel that were logged in November 2018.

Table 1.
Selected reports [3].
The most important notifications are listed for each group of notifications as well as for each time interval by month. This list is used as a set of suspicious notifications for comparison with other tunnels in the Czech Republic. Selected notifications were compared with the Strahov tunnel, which is in the city center of Prague.
Similar to the Lochkov tunnel, the Mrázovka and the Strahov tunnels were evaluated to find correlations between the reports and tunnel failures. Unfortunately, having a half-year sample, it was not possible to find a similar fault report, which may be due to different technology, the age of the technology and other influences resulting in equipment failure such as humidity, the frequency of use of the equipment, service interventions, etc., larger samples of data, but also comparable technology in detail. Regarding the results of individual tunnel failures, it seems that the differences vary significantly.
All the above-mentioned information proves the fact that there was no match found. Every single notification is a specific one and related to a specific event or equipment in the tunnel. This conclusion was not expected. Nevertheless, it shows that each tunnel is unique, and the analysis of logs should be carried out separately. This also affects the wholesale implementation of predictive diagnostics—at least in the field of statistical-based diagnostics. The difference between notifications from other tunnels can be caused by the fact that the information part of the notification contains not only a description of the event or current state but also the code of the equipment, specific devices or location in the tunnel.
3.2. Analytical Model
An analytical model was designed as part of the data analysis and its conclusion was that each specific tunnel must be evaluated and diagnosed separately. It can be implemented in an online environment and used in real-time as a solution for tunnel operators and dispatchers. The model could be used for error detection, the prediction of suspicious notifications, or to warn of upcoming danger situations. The dispatcher´s knowledge can be used to detect relations between notifications. The model allows one to analyze a specific period or specific notifications and their occurrence individually [3].
The same reference was used for the implementation of the model and for its analytical methods as well. The analytical model consists of two user interfaces. The first interface is shown in Figure 10. The list of the time period and notification classes is on the left. The user chooses a specific time interval and notification type to be analyzed in the tunnel system. The choice of time interval can be omitted in online use. For example, the time interval may be fixed to last 60 min.
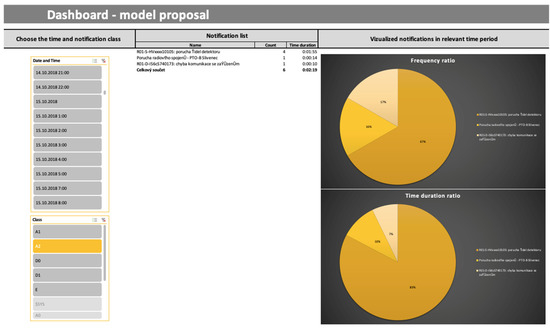
Figure 10.
First part of model design (1st interface) [3].
Selected notifications are listed in detail, e.g., specific names, their frequency and the time duration. The same parameters are visualized by graphs that show the ratio of all listed notifications during the selected time interval (time interval is set up to 60 min) from the archive data of alarms and devices.
A qualified user who has know-how about the system and notifications can determine important notifications for a detailed analysis. The information from the first interface can be supportive for both visualization and report content. In summary, the first part of the model is used to check the actual conditions. It is also helpful to choose specific notifications for further analysis in the following part of the model.
In the second interface (Figure 11), the user is supposed to make a choice of specific notification(s) based on the notification list from the first part of the model. Afterwards, these chosen notifications are graphically visualized. The first graph shows the frequency of chosen notifications during the last month and the second one shows the trends of time duration per day.
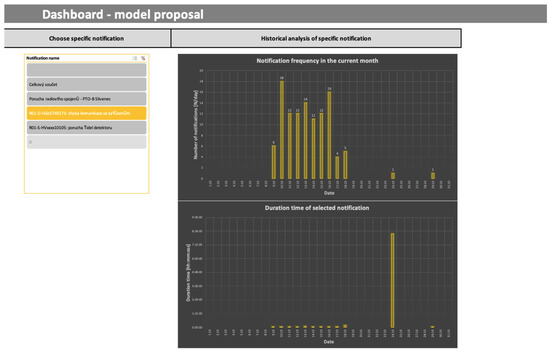
Figure 11.
Second part of the model design (2nd interface) [3].
The screenshot of the second interface (Figure 11) presents an identification of a specific event (communication failure with the device) that is generated multiple times in a short time interval, respectively with the relatively short duration time. For example: this selected event was repeated 10 days in a row and afterwards the same event is logged only once but with a longer duration time. Such a long outage of communication could very significantly affect the other equipment in the tunnel. By all accounts, this undesirable condition could be predicted in advance and thus the operation of the tunnel could be more sustainable.
In the case of a real implementation of the model, some additional features can be added. For example, the possibility to mark a suspicious notification can be applied to immediately inform the user about these notifications. This might make the process in the first interface considerably faster and easier for the dispatchers.
3.3. Expert Analysis
An expert analysis was performed in addition to the data analysis and model design proposal. The expert analysis was focused on specific failures and notifications that had been logged before the incident. The purpose of the analysis was to investigate specific events individually and to find the correlation or interfaces that might be affected by the event or vice versa, the reason or the error source that impacted the particular system device and other equipment.
The expert analysis was performed regarding the knowledge of the specific tunnel equipment implemented in the tunnel, know-how of the system and its maintenance, taking into account the weather conditions during the analyzed time intervals, etc.
It has been found that specific failures or errors on the devices have been detected before, or communication errors have been detected on particular devices before the failure. Subsequently, the device should be repaired, replaced, or at least maintained.
Within this expert analysis, only one case is shown and described as an example for this contribution. This example (Table 2) is related to the variable message signs in the tunnel, specifically the LED diodes in this equipment.
Table 2.
Analyzed variable message signs (VMS) failure [3,11].
The analysis showed that the state of the equipment changes over time. The failure of the VMS (variable message signs) happened on December 28th. Nevertheless, some of the errors or at least warnings were detected more than two weeks before the failure of the same device. This fact clearly confirms that the failure of the equipment is avoidable in a specific time interval and the impact on the final user (in this case, drivers see an unreadable message on the VMS due to a fault in the active LED) might be eliminated completely.
The analysis showed that the detection of faults in control circuits or voltage and temperature measurements could be the basis for error detection, but also it could be the approach for the prediction of upcoming errors or failures before it happens.
3.4. Usability and Output from the Analysis
Several results and outputs were found from the previous part of the analysis. The analysis was performed in three specific steps and each of them brought different findings and outputs.
The first part focused on the data and captured logs that were evaluated and delivered the following outputs:
- Each tunnel is specific, and the findings are not replicable on other tunnel systems because of different equipment as well as the data structure.
- The classification of notifications sometimes does not make sense and some classes contain similar notifications.
- The traffic event notifications and their frequency are highly related to the traffic flow.
- No relations between traffic event notification and alarm notifications were observed; the failures and errors are probably not influenced by traffic and the range of alarm notifications is similar during the entire investigation.
- Notification frequency and time duration of events, alarms or failures show some differences; some correlations might probably be found.
- The data analysis shows that smart maintenance should focus on every specific equipment and the analysis should be performed individually in the first step, then the big analysis could be applied after the knowledge about the system behavior that has been gained.
- If there is enough quality data, it is possible to use appropriate methods for the predictive diagnosis and determination of the life cycle of the selected device [3,10,11,25].
The second part was focused on the model proposal that could be used during the dispatching activities. It could be the way to find and study the system behavior in real time together with the knowledge of the actual state of the system. This part could also be the way to observe the process and detect the failures by humans. These activities might lead to the automation of the processes in the future.
The third and last part of the analysis was performed by the individual checking of failures in the dataset. It was found that the captured logs contained strange behavior that was detected before the error. It shows that the way to smart and predictive maintenance is possible and probably this individual approach combined with smart dispatching could be the first step. Then, the automation and cognitive functions could be used, and data-based maintenance will be efficient. Moreover, the service and maintenance cost could decrease in the future.
The results of all mentioned approaches can be subsequently processed by an automatic expert system, because due to the specifics of technology, equipment, and components in the tunnel, it is not appropriate to generate warnings without knowledge and the expert setting of the local situation. The possible individual procedures and steps of the described approaches can be illustrated in the fault analysis procedure (Figure 12) [11].
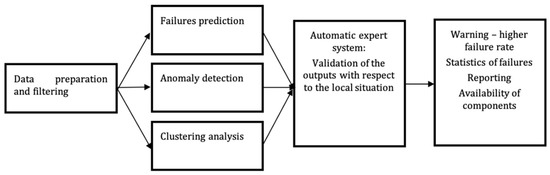
Figure 12.
Failure analysis process [11].
4. Discussion
A detailed analysis of communication logs was performed. Statistical and analytical methods were used for evaluation, especially on the Lochkov tunnel on the Prague Ring Road. This tunnel was chosen because of the amount of relevant data, and particularly the possibility to group it by the type of notification. All notification groups were analyzed in detail for each month.
One of the conclusions is the fact that each tunnel is specific, and it is necessary to analyze them independently. Although there is a strong relationship between the generated notifications in tunnels, potential correlations were found between other relationships. This could be verified based on more detailed data. This fact shows that predictive maintenance is a possible approach towards sustainability and is suitable as a service by the facility provider.
Each device requires an individual approach and the investigation of possibilities of how to detect the failures in advance, especially in the first trails. This individual approach can be applied as a training dataset that could be verified during the system operation.
It is necessary to have a suitable historical database with reports from tunnels and other telematics systems to ensure the quality of diagnostics with eventual usage for predictive maintenance and error detection. The knowledge about the lifetime characteristics and required functions of the equipment is a prerequisite necessary for actual state determination. One of the important requirements is sufficient knowledge of the entire system and its subsystems and other components which have specific relations.
Subsequently, suitable methods for data prediction, probabilistic and own models for online use were considered. ARIMA models, neural networks, and Bayesian approaches to data analysis seem to be the most progressive [10,26,27]. Additionally, using standard reliability methods based on the investigation of fault trees or the more appropriate method, FMEA [8,25], were considered.
The analysis faces some limitations. It is based only on the statistical methods and the specific meaning of the notification is neglected. Some knowledge is required to ensure the understanding of each notification and its information. For this purpose, the analytical model was designed, and expert analysis was performed.
The proposed model allows one to make the analysis in time. The knowledge of notifications can be ensured by the dispatcher or administrator of the system. The combination of both can provide a solution that helps to improve the approach of analysis and this improvement can be the method of how to find relations between the notifications, specific events, and occurring conditions. All the above-mentioned steps show the way to use analytical methods for diagnostics and maintenance enhancement. These findings can be replicated to other systems in ITS Smart City and Critical Infrastructure to eliminate potential emergency risks [28].
After the implementation of diagnostic methods for use in predictive maintenance, it is necessary to optimize the whole process and improve prediction. The system might be supplemented by cognitive functions that automize the system, decrease the maintenance cost and extend the life cycle of the equipment.
Another recommendation is to set up a database with technical information about each piece of equipment or device and add information about the device life and operation cycle. It would be appropriate to have awareness about the equipment that should be replaced. These processes will lead to system automation.
5. Conclusions
Predictive maintenance is one of the ways to make a step forward towards smart and sustainable traffic systems. This article presents the results of the research on predictive maintenance of technological devices in tunnel systems. Even though tunnel systems are the subject of analysis for maintenance purposes, this analysis usually focuses on the structural part instead of on the technological part. Currently, the technological part of tunnel system is complex, which consists of many different devices and technologies. Some of them are critical elements for tunnel safety. This is the reason to concentrate the research on this topic. This investigation has shown that predictive maintenance for technological devices in tunnel systems might bring benefits. On the contrary, it often deals with insufficient or incompatible data from different tunnels. There are differences in technology and in various approaches to the description of system failures, their frequency, and duration. The data often lack accurate information and sufficient frequency for predictive applications and tools.
This fact results in the conclusion that predictive maintenance should be a part of the design of the tunnel system architecture in case of new tunnels. An interface using data analysis and expert systems are introduced to support data analysis for existing tunnel systems, e.g., a tunnel control system, data from revisions and inspections enabling the identification of suspicious notifications and devices which need increased supervision.
The proposed approach including interfaces and potentials can be applied in new methods as mentioned in the discussion above. Furthermore, technical standards [13,14,15] for smart and sustainable traffic systems which are used in Czech Republic standards might be modified based on this approach.
Author Contributions
Data curation, J.B.; Methodology, T.T., J.B., Z.B. and R.P.; Project administration, T.T.; Formal analysis, J.B. and T.T.; Resources, T.T., J.B., Z.B. and R.P.; Writing—original draft preparation, T.T. and J.B.; Writing—review and editing, T.T., J.B., Z.B. and R.P. All authors have read and agreed to the published version of the manuscript.
Funding
This research was funded by the Technology Agency of the Czech Republic (grant number TH04010481), and by the Department of Transport Telematics CTU in Prague, Faculty of Transportation Sciences.
Institutional Review Board Statement
“Not applicable” for studies not involving humans or animals.
Informed Consent Statement
Informed consent was obtained from all subjects involved in the study.
Data Availability Statement
Restrictions apply to the availability of these data. Data were obtained from the company Eltodo and it is available from the authors after the official request. These data would be available only with the permission of the third party—company Eltodo from the Czech Republic.
Acknowledgments
The research was supported by the technology Agency of the Czech Republic under the research project “Reliability diagnostics of technological equipment” No. TH04010481. [3] and this article was created with the support of the project APVV−17–0014, “Smart tunnel: telematic support in case of emergencies in the road tunnel” as well.
Conflicts of Interest
The authors declare no conflict of interest. The funders had no role in the design of the study; in the collection, analyses, or interpretation of the data; in the writing of the manuscript, or in the decision to publish the results.
References
- Vachtsevanos, G.; Lewis, F.; Roemer, M.; Hess, A.; Wu, B. Intelligent Fault Diagnosis and Prognosis for Engineering Systems; John Wiley & Sons, Inc.: Hoboken, NJ, USA, 2006; p. 434. ISBN 978-0-471-72999-0. [Google Scholar]
- Saxebna, A.; Celaya, J.; Saha, B.; Saha, S.; Gobel, K. Evaluating prognostics performance for algorithms incorporating uncertainty estimates. In Proceedings of the 2010 IEEE Aerospace Conference, Big Sky, MT, USA, 6–13 March 2010; pp. 1–11, ISBN 978-1-4244-3887-7, ISSN 1095-323X. [Google Scholar]
- Tichy, T.; Broz, J. Reliability Diagnostics of Technological Equipment, CTU FTS Research Report for Technology Agency of the Czech Republic; Project No. TH04010481; CTU FTS: Prague, Czech Republic, 2020. [Google Scholar]
- Cachada, A.; Barbosa, J.; Leitño, P.; Gcraldcs, C.A.S.; Deusdado, L.; Costa, J.; Teixeira, C.; Teixeira, J.; Moreira, A.H.J.; Moreira, P.M. Maintenance 4.0: Intelligent and Predictive Maintenance System Architecture. In Proceedings of the 2018 IEEE 23rd International Conference on Emerging Technologies and Factory Automation (ETFA), Turin, Italy, 4–7 September 2018; pp. 139–146. [Google Scholar] [CrossRef]
- Martinez, C.; Perrin, G.; Ramasso, E.; Rombaut, M. A Deep Reinforcement Learning Approach for Early Classification of Time Series. In Proceedings of the 2018 26th European Signal Processing Conference (EUSIPCO), Rome, Italy, 3–7 September 2018; pp. 2030–2034. [Google Scholar] [CrossRef]
- Gregor, M.; Spalek, J. Novelty detector for reinforcement learning based on forecasting. In Proceedings of the 2014 IEEE 12th International Symposium on Applied Machine Intelligence and Informatics (SAMI), Herl’any, Slovakia, 23–25 January 2014; pp. 73–78. [Google Scholar] [CrossRef]
- Sekiou, S.; Chiremsel, Z.; Drid, S.; Said, R.N. Failures diagnostic of safety instrumented system: Simulation and experimental study. In Proceedings of the 2013 International Conference on Control, Decision and Information Technologies (CoDIT), Hammamet, Tunisia, 6–8 May 2013; pp. 776–781. [Google Scholar] [CrossRef]
- Rastocny, K.; Zdansky, J.; Balak, J.; Holecko, P. Diagnostics of an output interface of a safety-related system with safety PLC. Electr. Eng. 2017, 99, 1169–1178. [Google Scholar] [CrossRef]
- Rastocny, K.; Franekova, M.; Zolotova, I.; Rastocny, K., Jr. Quantitative assessment of safety integrity level of message transmission between safety-related equipment. Comput. Inform. 2014, 33, 343–368. [Google Scholar]
- Tichy, T.; Broz, J.; Belinova, Z.; Kouba, P. Predictive diagnostics usage for telematic systems maintenance. In 2020 Smart City Symposium Prague; IEEE Press: New York, NY, USA, 2020; ISBN 978-1-7281-6821-0. [Google Scholar] [CrossRef]
- Tichy, T.; Stefan, J.; Pixa, R.; Miklosik, I. System for technology control, diagnostics and simulation in tunnels. In Proceedings of the 14th International Conference Underground Construction Prague 2019, Prague, Czech Republic, 3–5 June 2019; pp. 1–8, ISBN 978-80-906452-3-3. [Google Scholar]
- PIARC. Life Cycle Aspects of Electrical Road Tunnel Equipment; PIARC Technical Commitee C.4: Paris, France, 2012. [Google Scholar]
- Technical Standard in CZ—TS 98—Technological Equipment of Road Tunnels; Ministry of Transport of Czech Republic: Prague, Czech Republic, 2004.
- Technical Standard in CZ—TS 154—Operation, Management and Maintenance of Road Tunnels; Ministry of Transport of Czech Republic: Prague, Czech Republic, 2004.
- Technical Standard in CZ—TS 229—Safety in Road Tunnels; Ministry of Transport of Czech Republic: Prague, Czech Republic, 2010.
- Farahani, B.V.; Barros, F.; Sousa, P.J.; Tavares, P.J.; Moreira, P.M. A railway tunnel structural monitoring methodology proposal for predictive maintenance. Struct. Control Health Monit. 2020, 27, e2587. [Google Scholar] [CrossRef]
- Richards, J. Inspection, maintenance and repair of tunnels: International lessons and practice. Tunn. Undergr. Space Technol. 1998, 13, 369–375. [Google Scholar] [CrossRef]
- Asakura, T.; Kojima, Y. Tunnel maintenance in Japan. Tunn. Undergr. Space Technol. 2003, 18, 161–169. [Google Scholar] [CrossRef]
- Hu, M.; Liu, Y.; Sugumaran, V.; Liu, B.; Du, J. Automated structural defects diagnostics in underground transportation tunnels using semantic technologies. Autom. Constr. 2019, 107, 102929. [Google Scholar] [CrossRef]
- Wang, N.; Sun, S.; Si, S.; Li, J. Research of predictive maintenance for deteriorating system based on semi-markov process. In Proceedings of the 2009 16th International Conference on Industrial Engineering and Engineering Management, Beijing, China, 21–23 October 2009; pp. 899–903. [Google Scholar] [CrossRef]
- Jimenez, J.J.M.; Schwartz, S.; Vingerhoeds, R.; Grabot, B.; Salaün, M. Towards multi-model approaches to predictive maintenance: A systematic literature survey on diagnostics and prognostics. J. Manuf. Syst. 2020, 56, 539–557. [Google Scholar] [CrossRef]
- Quatrini, E.; Costantino, F.; Di Gravio, G.; Patriarca, R. Machine learning for anomaly detection and process phase classification to improve safety and maintenance activities. J. Manuf. Syst. 2020, 56, 117–132. [Google Scholar] [CrossRef]
- Angius, A.; Colledani, M.; Yemane, A. Impact of condition based maintenance policies on the service level of multi-stage manufacturing systems. Control Eng. Pract. 2018, 76, 65–78. [Google Scholar] [CrossRef]
- Motaghare, O.; Pillai, A.S.; Ramachandran, K.I. Predictive Maintenance Architecture. In Proceedings of the 2018 IEEE International Conference on Computational Intelligence and Computing Research (ICCIC), Madurai, India, 13–15 December 2018; pp. 1–4. [Google Scholar] [CrossRef]
- Sun, Y.; Hu, M.; Zhou, W.; Xu, W. A Data-Driven Framework for Tunnel Infrastructure Maintenance. In Proceedings of the International Conference on Applications and Techniques in Cyber Security and Intelligence, Shanghai, China, 11–13 July 2018; Springer: Cham, Switzerland, 2018; pp. 495–504. [Google Scholar]
- Lasia, A. Electrochemical Impedance Spectroscopy and Its Applications, Modern Aspects of Electrochemistry; Conway, B.E., Bockris, J., White, R.E., Eds.; Kluwer Academic/Plenum Publishers: New York, NY, USA, 1999; Volume 32, pp. 143–248. [Google Scholar]
- Wang, P.; Vachtesvanos, G. Fault prognosis using dynamic wavelet neural networks. In Proceedings of the Sixteenth National Conference on Artificial Intelligence, Orlando, FL, USA, 18–22 July 1999; ISBN 978-0-262-51106-3. [Google Scholar]
- Ruzicka, J.; Navratilova, K. Crisis management as the part of smart traffic control in cities. In Proceedings of the 2020 Smart City Symposium Prague (SCSP), Prague, Czech Republic, 25 June 2020; pp. 1–5. [Google Scholar] [CrossRef]
Publisher’s Note: MDPI stays neutral with regard to jurisdictional claims in published maps and institutional affiliations. |
© 2021 by the authors. Licensee MDPI, Basel, Switzerland. This article is an open access article distributed under the terms and conditions of the Creative Commons Attribution (CC BY) license (https://creativecommons.org/licenses/by/4.0/).