Abstract
Mobility as a Service (MaaS) is often proposed as a tool for achieving sustainable mobility and, in particular, increasing the share of public transport trips in cities. In this paper we conduct a rapid review of the literature on MaaS and, using Moovit as a case study, we explore the association between the popularity of searches in Google using the term “Moovit” and the share of workers that commute by public transport. The exercise focuses on metropolitan areas in the United States over the period 2010 to 2019. We find a positive correlation, and we speculate that metropolitan areas with pre-existing higher shares of workers commuting by public transport tend to be metropolitan areas where use of Moovit is more likely.
1. Introduction
Mobility as a Service (MaaS), understood as an app-based service that allows users to plan, and, according to what definition is used, book and pay for journeys involving one or more modes of transport, is often referred to as a tool that could help increase the sustainability of transport systems [1,2,3]. Public transport should be the backbone of any sustainable transport system [4]. Some limited, small-scale MaaS trials show some reduction in private car use, and an increase in car sharing and/or public transport use [5,6,7].
In the present paper, we review some of the latest literature on MaaS and we then focus on Moovit as a case study. For this, we explore the association between the popularity of searches in Google using the term “Moovit” and the share of workers that commute by public transport. We do this for metropolitan areas in the United States over the period 2010 to 2019 and find a positive correlation. The integration of public transport modes amongst themselves and with other modes and the MaaS provider, which may be of high relevance [8] (p. 10), is not a feature that Moovit offers. Having said that, even combining different transport services into one service, which Moovit does not do in any case, may not be enough to change travel behaviour [9] (p. 326). MaaS, even in its most sophisticated forms, can support a change in travel behaviour, rather than trigger one on its own [6] (pp. 70–71).
The rest of the paper proceeds as follows. Section 2 critically reviews some of the latest literature. Section 3 introduces Moovit. Section 4 explores the association between Moovit use, proxied by searches in Google, and the share of workers that commute by public transport. Section 5 concludes and provides some policy recommendations.
2. A Rapid Literature Review
Mobility as a Service (MaaS) is a relatively new concept that has already attracted considerable attention. A search in Scopus using the expression “Mobility as a Service” yielded 1 paper in 2013, 1 paper in 2014, 4 papers in 2015, 19 papers in 2016, 36 papers in 2017, 75 papers in 2018, 101 papers in 2019 and 167 papers in 2020. This academic work spans a range of issues to do with MaaS, some of which are summarised below. There are also a number of reviews already [6,8,10,11,12,13,14,15].
2.1. Our Approach
Our rapid literature review followed some of the principles of a systematic search. We reviewed mainly academic sources, although we included some “grey” literature too, such as for example some think-tank and international organisations’ reports and reports produced by Moovit. The initial database was compiled over June–September 2020, and this was followed by several iterations over October 2020–February 2021.
The steps followed were:
- The Google search engine (UK-based, with a UK-ending) was used to identify relevant grey literature.
- The search term “Mobility as a Service” was input into Scopus without any restrictions of language or type of output (article, conference paper, book chapter, review, or conference review). It was set to “search within” article title, abstract, and keywords.
- The purging exercise consisted of keeping only articles, reviews and book chapters written in English.
- Relevant outputs were identified by examining titles, abstracts and keywords. Since this was intended to be a succinct, rapid review concentrating on definitions, levels of integration, MaaS as an ecosystem, and links between MaaS and sustainable mobility, articles were deemed relevant if they considered (a) definitions of MaaS, (b) levels of integration of MaaS, (c) MaaS as an ecosystem, and (d) links between MaaS and sustainable mobility. This exercise produced a final list of 75 articles, reviews and book chapters indexed in Scopus, and 11 grey literature outputs.
- Abstracts and executive summaries from this list were reviewed a second time, and the most relevant outputs were downloaded and read in detail. Some of these outputs led us to additional material, such as unpublished papers and websites. Most of the academic articles and grey literature reports touching on the themes detailed in (4) were cited, as were some additional materials.
2.2. MaaS Definitions
Despite the substantial amount of work that has been done, there is still some ambiguity regarding the concept of MaaS [10] and no one definition has been universally accepted yet [6,16]. The most refined conceptual MaaS frameworks, however, differ from the “present state of affairs” [17]. Figure 1 presents three relatively similar definitions of MaaS.
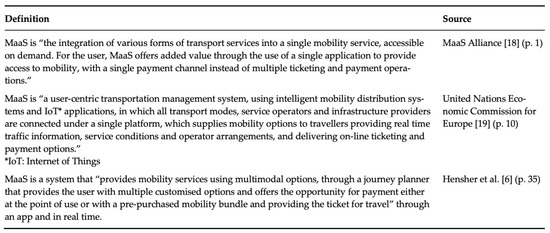
Figure 1.
Definitions of MaaS. Source: Compiled by the authors on the basis of MaaS Alliance [18], United Nations Economic Commission for Europe [19], and Hensher et al. [6].
These definitions presume that MaaS adds value by providing not just information to help plan a trip, but the convenience of one single payment that will cover all segments of the trip by different transport modes, regardless of whether these are provided by a private or a public operator. In this sense, to “qualify for MaaS, the scheme or product first must offer a mobility service with the user at the centre of the offer; second the mobility options offered must be selected from a multimodal portfolio and finally, the offer must provide the integration of transport service starting from providing the information for travel, enabling a payment option (either at the point of use or with a pre-purchased mobility bundle) and providing the ticket for travel” [6] (p. 41).
MaaS is therefore a centralised platform that combines all services and allows its customers to interact with, pay for, and choose among one or more of them [20,21]. It is a “user-centric, intelligent mobility distribution model in which all mobility service providers’ offerings are aggregated by a sole mobility provider, the MaaS provider, and supplied to users through a single digital platform” [22] (p. 4). As such, MaaS providers can also be described as brokers, as they obtain services from transport operators or transport suppliers and sell them to consumers. Therefore, mobility operators can be seen as stakeholders in a business model as part of an ecosystem for delivering MaaS [6], with MaaS being a “technology-enabled Mobility Management” [16] (p. 247). The idea of mobility management is essentially based on matching demand and supply, via a “clearinghouse mechanism for information and financial transactions” [6] (pp. 15–16).
Considering the MaaS definitions presented above, a journey planner that integrates information only should not be considered a MaaS provider. Moovit, however, defines itself as “a leading Mobility as a Service (MaaS) solutions provider” [23], and others define MaaS as “services that facilitate moving from one place to another using different modes of transport”, where the services can range from “multimodal journey planners” to “full-service subscriptions” [24] (p. 7). The level of integration seems to be key in the understanding of MaaS, and so we discuss this in the next section.
2.3. Levels of Integration
There are different levels of integration [25], and this has led to the (simultaneous) development of a topology model [8] and a taxonomy model [12]. The main similarity between these two models is that the different levels are defined in terms of “integration”. The main difference between the two models is that the taxonomy model considers operational integration and cognitive effort, in addition to the integration of information on different modes and routes and the integration of payment and ticketing [12]. A traveller can be assumed to aim for a seamless journey, convenient to “plan, book, pay for and execute successfully” [12] (p. 29). In this sense, the higher the integration offered by MaaS, the lower the cognitive effort required [12]. Figure 2 summarises and compares both models.
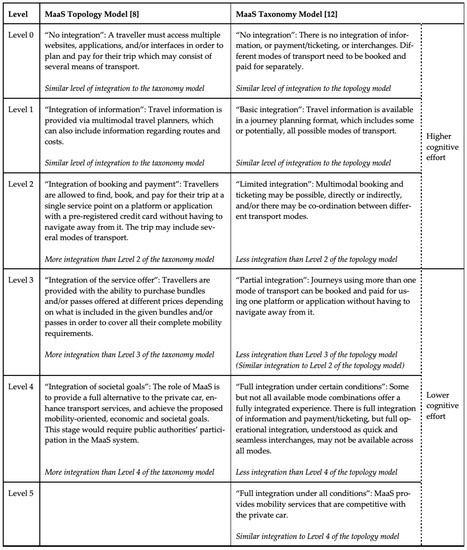
Figure 2.
Comparison of MaaS topology and taxonomy models. Source: Compiled by the authors on the basis of Sochor et al. [8] and Lyons et al. [12].
2.4. The MaaS Ecosystem
Just like in ecology, where a community of interacting organisms and their physical environment is considered an ecosystem, MaaS can also be considered an ecosystem. This is because MaaS is a community of different actors in the public and private sectors that interact with each other, and furthermore, can be integrated and coordinated in order to provide mobility services to the public, namely the end-users. The actors and environment that are part of the MaaS ecosystem range from the MaaS provider, to transport operators, data providers, technology and platform providers, users, Information and Communication Technology infrastructure, insurance companies, media, marketing, and advertising firms, amongst others [13,22].
Public transport operators are key, and they seem to be unable to adapt to MaaS, probably because of their inflexible model, which is not customer-focused and contradicts the main idea of MaaS [26]. As already hinted above, transport operators do not just include traditional public transport, but they also include taxis and new mobility providers such as those engaged in shared mobility (shared cars, scooters and bicycles). Most MaaS definitions and real-world start-ups seem to focus on the idea of people replacing their privately-owned cars with other options, without necessarily being inconvenienced [27]. The idea of shared mobility is that cars and other assets, such as bicycles or scooters, can be accessed when needed, rather than owned. There are a number of models of car sharing [28]. These include “peer-to-peer car rental”, where car-owners rent their cars to other consumers, “modern car club or modern car-sharing”, where individuals rent a car on a short-term basis, with these cars being available either from a (car) station or from certain roads/areas within a city, “ride-hailing, ride-sourcing, e-hailing, Transportation Network Companies (TNC)”, where companies own no cars themselves, but sign up ordinary car owners who act as drivers, and “ride-sharing, ride-splitting, micro-transit, new public transport on demand”, where passengers going in the same direction are matched with each other [28]. All four models of shared mobility have two features: (a) there is an element of sharing an asset, i.e., a vehicle, instead of owning it, and (b) they rely on technology, i.e., a digital platform [28]. Car-sharing, especially ride-hailing, can complement public transport by providing first-mile/last-mile legs [4]. Moreover, car-sharing could also support public transport by supplementing it during off-peak hours or reaching areas of low density where frequent public transport is not financially sustainable [4].
2.5. MaaS and Sustainable Mobility
Since the expectations placed on MaaS are linked to an increase in sustainable mobility, understood as a reduction in car use, and/or an increase in public transport use and/or active transport, it would be very interesting to know if MaaS can indeed deliver any of that.
A study comparing the results of surveys conducted in Sydney, Australia and Tyneside, England, concluded that there could be great potential to increase public transport use if there was an option of subscription to a MaaS provider offering unlimited trips by public transport [29].
At the end of a trial of UbiGo, a MaaS app in Gothenburg, Sweden, which took place between November 2013 and April 2014, participants reported a reduction in private car use and an increase in car sharing and public transport use [5] (p. 60). The app, however, offered an advanced level of integration across modes [8] (p. 10), as well as tailored subscription plans, which included reduced public transport fares and free membership of the bicycle sharing system in Gothenburg [6] (p. 61).
Another MaaS trial, which targeted employees in a big workplace outside Stockholm, showed that the MaaS they were offered, which combined different transport services into one service, did not fulfil customer needs, and changes in travel behaviour were, as a consequence, limited [9] (p. 326).
A review of the outcomes of a handful of MaaS trials conducted in Sweden, Finland, Germany and Australia, concluded that it was not possible to draw any conclusions regarding long-term impacts, because the trials had been small-scale and short in duration [6] (Chapter 4). In addition, there had been great variation in terms of integration of transport services [6]. The review found that MaaS may not be a feasible option for all population segments given that, at least in most trials, access and use of MaaS required proficiency in using a smart phone app, a bank card for payment, and, when booking some types of shared mobility, such as the “peer-to-peer car rental”, or the “modern car club or modern car-sharing” discussed above, a driver’s licence [6] (p. 69–70). Another finding was that, although the evidence on the impact of MaaS on travel behaviour is limited, some trials showed that MaaS can affect travel behaviour towards a reduction in car use [6] (p. 70). However, “MaaS can influence travel behaviour, but not on its own”, and when car use was reduced, this was probably more due to a “decrease in the relative attractiveness of private car use” than to the availability of a MaaS app [6] (p. 70). We note that all the MaaS trials reviewed by Hensher et al. [6] entailed a relatively advanced level of integration of transport services, which included booking and payment. In a more recent study focusing specifically on the Sydney MaaS trial, MaaS was found to reduce car use [7]. These findings contrast with those of a MaaS pilot study in Belgium, which found no drastic reduction in car use, and concluded that MaaS can act as a complement rather than a substitute of the car [30].
2.6. Final Thoughts
What we have learnt in this section is that MaaS refers to the integration of mobility services, which may range from simple information integration to full integration of information, payment, ticketing, and operation of transport services, with quick and seamless interchanges across all modes. We have also learnt that MaaS can be considered an ecosystem, with different actors in the public and private sectors, that together work to provide mobility services to end-users. Finally, we have learnt that MaaS can support a change in travel behaviour away from the private car, towards public transport, but may not be enough to achieve this on its own. We now turn our attention to a basic MaaS provider, Moovit.
3. Moovit
Moovit was launched in 2012 as a free app [23]. They define themselves as a MaaS provider [23]. Moovit, however, only falls under Level 1 in the taxonomy and topology models presented in Figure 2 because it lacks a single ticketing functionality. It is essentially a journey planner, as it integrates information [8] (p. 10). The Moovit app can be added as an application on any electronic device with access to the Web. It integrates information on travel times, timetables and costs on all forms of transport including public transport, taxis, car-sharing, bike-sharing and scooter-sharing.
The application combines information from private and public transport operators and hosts a repository of real-time public transport data [23]. The data are collected from users via crowdsensing, a technique where a large group of individuals collectively share data. The process relies entirely on the goodwill of (public transport) users and the sensing and computing capabilities of their mobile devices [31,32]. Users do not receive any payments or discounts for providing data to the company. Moovit allows users to build their reputation via gamification features such as a point-level system. For each contribution, users receive points and eventually gain levels intended to stimulate their reputation in the community, resulting in increased motivation for using the app [32]. Users can also report misleading information or missing data such as, for example, incorrect route or schedule. However, Moovit does not have the technology to predict any potential delays caused by unexpected traffic jams or road closures [32].
As of 2021, Moovit is available in over 3400 cities across 112 countries and in 45 languages [23]. Moovit’s data repository consists of information on 7500 public transport operators, 360 micro-mobility service providers, and more than six million stops and stations [23].
Although Moovit does not offer the option of a single payment/ticket for a multimodal journey, it is possible to pay, in some cases, for some trip segments, such as for example in Israel, and in Ohio and Northern Kentucky in the United States, where users can purchase public transport tickets [33,34]. When planning a trip which includes booking of a service, such as for example, Uber or Lyft, users are redirected to the given provider’s webpage where the transaction is finalised.
Moovit claims that they attempt to help governments and public transport agencies with solutions for reducing congestion, and shifting car drivers to public transport and shared mobility [23]. We note, however, that it is still unclear whether shared mobility reduces congestion and emissions [4,28]. Now, providing information per se can only help achieve a modal shift when there are indeed practical, feasible, and reliable transport alternatives. The association between the use of Moovit and the use of public transport is the subject of the next section, where we focus on metropolitan areas in the United States.
4. Moovit’s Usage and Share of Workers That Commute by Public Transport in US Metropolitan Areas
Moovit does not share data on the number of users per city so we proxied this variable with the Google Trends Index. Google Trends is a tool provided by Google which analyses the popularity of top search queries in Google search. Google Trends normalises search data to the time and location of a query, and produces an index that ranges from 0 to 100 based on a topic’s proportion to all searches on all topics for that time and location [35]. Different regions that show the same search interest for a term do not always have the same total search volumes [35], and often total search volumes differ quite significantly.
The use of Google Trends is now widespread in academic research. Two well-known examples are those in the fields of health and finance. The analysis of Google search queries has allowed researchers to track influenza and influenza-like illness in different regions of the United States [36] and the identification of “early warning signs” of stock market changes [37,38].
Searching for “Moovit” on Google does not mean that the application would have been downloaded and subsequently used. However, using “Moovit” search queries as a proxy for Moovit use can be justified by the fact that search usually accompanies “purchase of a product or acceptance of innovation” and “statistics on search activities are good resources for monitoring, analysing, and even predicting acceptance of a product or an innovative new technology by individuals” [39] (p. 70).
The only problem with Google Trends, however, is that the same request can result in different outcomes. Defining the search term (Moovit), the search period (2019) and the geographical scale to metropolitan areas should yield the exact same list of metropolitan areas, the same ranking, and the same indices. This is not the case, as can be seen on Figure 3, which shows the results from Google Trends using these parameters. We downloaded those sets of results from Google Trends on 6 February, 14 February, and 25 February 2021. If Google Trends were consistent, indices with data from the past, for a specific search term and location, would be the same. This is a widely known problem in the Google support community [40], and one that was highlighted by Preis et al. [38]. The reason behind is that the public version of Google Trends analyses a sample of Google’s global search volume, and the sample changes over time. A possible solution when the differences are only slight ones is to use the average of three sets of indices, based on three independent data requests in consecutive weeks [38] (p. 2). However, the variability of the indices seems to be greater the lower the popularity of the search term used, and in those cases, using an average may not help much. In relative terms, “Moovit” is not a very popular search term in Google. This can be easily seen by comparing “Moovit” with a popular search term, such as for example, “Uber”, on Google Trends. For that reason, rather than using an average, we use the three sets of results presented in Figure 3.
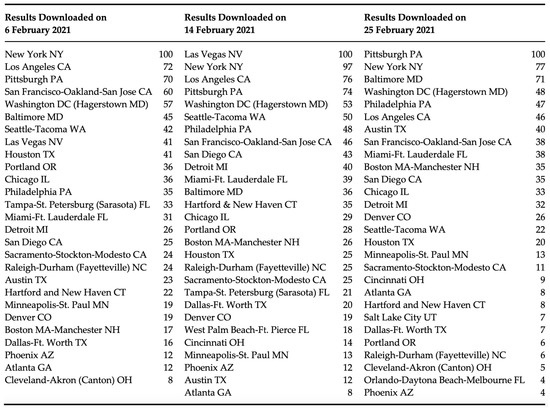
Figure 3.
Results from Google Trends for the search term “Moovit”, the year 2019, and metropolitan areas in the United States. Source: Google Trends.
A quick inspection of Figure 3 reveals that 23 metropolitan areas appear in all three sets of results from Google Trends, although with a different index and ranking, 6 appear in two sets of results, and 3 appear in only one set of results. Despite this inconsistency of the Google Trends tool, there are 23 metropolitan areas which appear on three sets of results, so these 23 metropolitan areas could be considered metropolitan areas where Moovit had a high number of searches relative to total number of searches in those metropolitan areas in 2019. Although to a lesser extent, the other nine metropolitan areas are also likely to be metropolitan areas with a relatively high number of searches.
An interesting question is whether the metropolitan areas from Figure 3 are areas with high use of public transport. In order to explore this issue, we focused on the share of workers that commute by public transport. The data on share of workers that commute by public transport was retrieved from the American Community Survey, which is conducted every year by the United States Census Bureau [41].
The American Community Survey data generally reflect the Office of Management and Budget delineations of metropolitan and micropolitan statistical areas, as shown on Figure A1 in Appendix A. These are different from the metropolitan areas in Google Trends. To solve this problem, the metropolitan areas as defined in Google Trends and in the American Community Survey were matched as shown on Figure A2 in Appendix A.
Figure 4, Figure 5 and Figure 6 show the Google Trends indices and shares of workers that commute by public transport for the metropolitan areas from Figure 3. The data correspond to the year 2019. All three figures show some positive correlation. The coefficients of correlation are 0.69 in Figure 4, 0.52 in Figure 5, and 0.53 in Figure 6. None of those coefficients can be deemed more or less accurate, given the variability of results from the Google Trends tool.
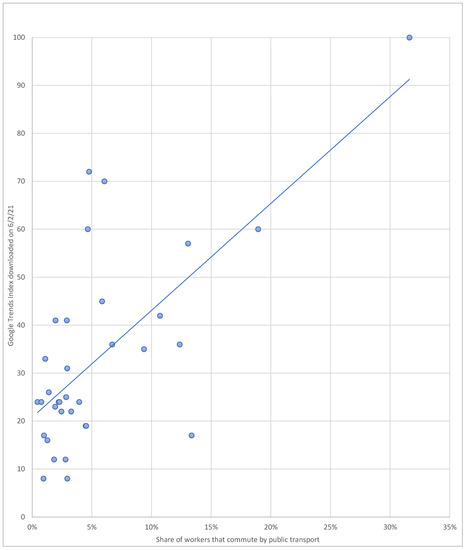
Figure 4.
Google Trends Index and percentage of workers that commute by public transport in metropolitan areas in the United States exhibiting a Google Trends Index equal to or greater than 1. Source: Google Trends and United States Census Bureau [41]. Note: Google Trends Index data downloaded on 6 February 2021.
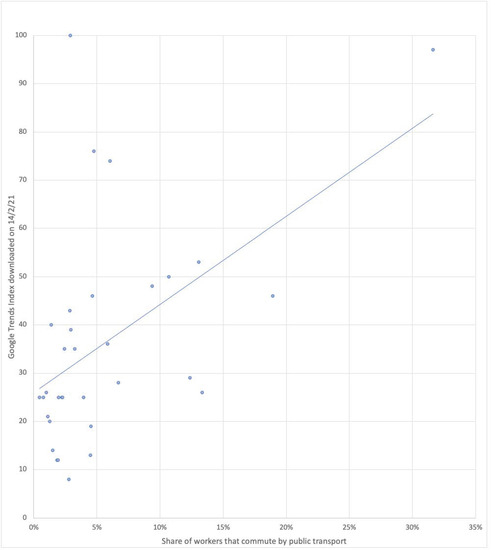
Figure 5.
Google Trends Index and percentage of workers that commute by public transport in metropolitan areas in the United States exhibiting a Google Trends Index equal to or greater than 1. Source: Google Trends and United States Census Bureau [41]. Note: Google Trends Index data downloaded on 14 February 2021.
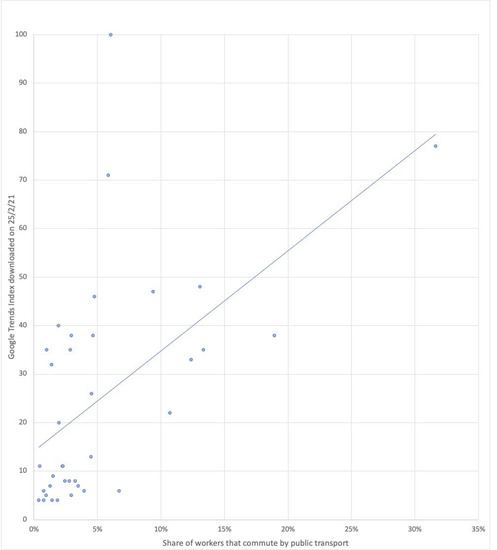
Figure 6.
Google Trends Index and percentage of workers that commute by public transport in metropolitan areas in the United States exhibiting a Google Trends Index equal to or greater than 1. Source: Google Trends and United States Census Bureau [41]. Note: Google Trends Index data downloaded on 25 February 2021.
This positive correlation does not entail causality. In fact, it is likely that metropolitan areas with higher shares of workers commuting by public transport are metropolitan areas where people are more likely to use the search term “Moovit” in Google, and probably also more likely to use the Moovit app.
When the metropolitan areas from the American Community Survey are ranked by share of workers that commute by public transport, the five that always come at the top for the period 2010 to 2019, are New York-Newark-Jersey City NY-NJ-PA, San Francisco-Oakland-Berkeley CA, Washington-Arlington-Alexandria DC-VA-MD-WV, Boston-Cambridge-Newton MA-NH, and Chicago-Naperville-Elgin IL-IN-WI. The second five metropolitan areas vary somewhat, but, for most years, these are Philadelphia-Camden-Wilmington PA-NJ-DE-MD, Bridgeport-Stamford-Norwalk CT, Seattle-Tacoma-Bellevue WA, Bremerton-Silverdale-Port Orchard WA, and Trenton-Princeton NJ.
Even for these ten metropolitan areas, which we have identified as those with the highest shares of workers that commute by public transport, the numbers are relatively low. Except for New York-Newark-Jersey City, which has a share of just over 30%, all the other areas have shares of roughly between 7% and 19%. The share of workers commuting by car in these metropolitan areas is above 70% in most cases, except for New York-Newark-Jersey City and San Francisco-Oakland-Berkeley. Figure 7 and Figure 8 show the share of workers commuting by public transport and by car, respectively, in the ten metropolitan areas with the highest shares of workers that commute by public transport, over the period 2010 to 2019. Not surprisingly, seven of those ten metropolitan areas feature in Figure 3.
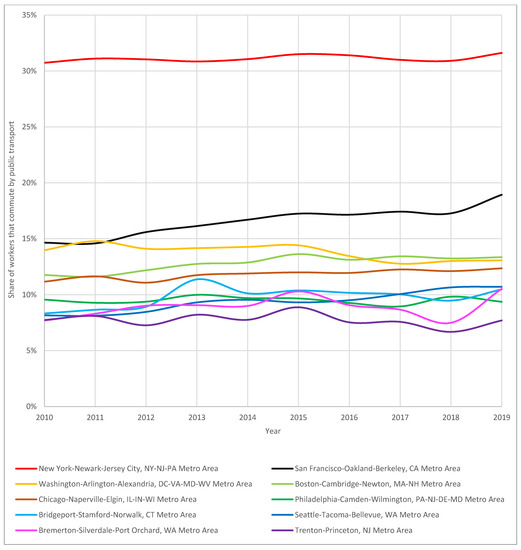
Figure 7.
Share of workers 16 years old and over that commute by public transport, in metropolitan areas where this share is highest, 2010 to 2019. Source: United States Census Bureau [41].
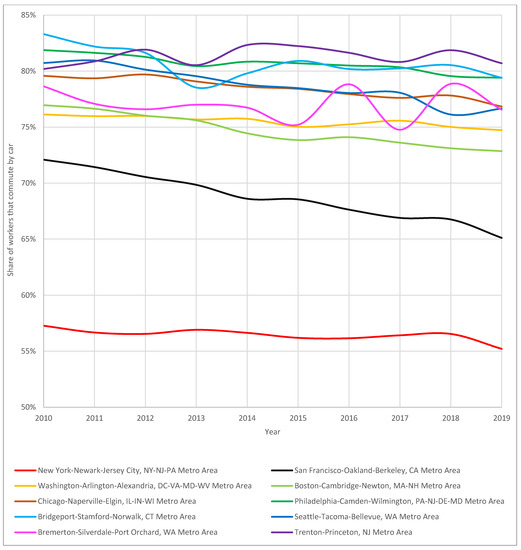
Figure 8.
Share of workers 16 years old and over that commute by car, truck or van, in metropolitan areas with the highest shares of workers that commute by public transport, 2010 to 2019. Source: United States Census Bureau [41].
Over that period, the share of commuters using public transport decreased in Washington-Arlington-Alexandria, Philadelphia-Camden-Wilmington, and Trenton-Princeton metropolitan areas, and increased in all others. The share of commuters using the car decreased in all metropolitan areas except for Trenton-Princeton, where it increased.
The shares of workers commuting by public transport and by car in the ten metropolitan areas with the highest share of workers commuting by public transport, seem to follow long-term trends. Moovit was launched in 2012 [23], so the earliest it could have covered any metropolitan area in the United States would have been 2012. Although there is no information readily available of when Moovit arrived in each metropolitan area, we managed to locate a news article published in December 2012 by a Canadian company specialising in smartphone and mobile technology reviews [42], reporting that Moovit covered “New York City, New Jersey, Chicago, Boston, Washington DC, Portland, Philadelphia and San Francisco.” We can therefore safely assume that Moovit arrived to those metropolitan areas some time in 2012, and we can also assume that in 2012 it did not arrive to any other metropolitan area in the United States. An inspection of Figure 7 and Figure 8 does not reveal any substantial change in the trends in 2012 for any of the metropolitan areas. This suggests that the arrival of Moovit in the United States did not do anything to change the share of workers that commute by public transport or by car. These shares seem to be dependent on other factors, not on the availability of Moovit. This analysis, however, is mainly descriptive. A possible extension of this work would entail using a difference-in-differences model controlling for factors likely to explain public transport use, and the date of arrival of Moovit in each metropolitan area.
5. Conclusions and Policy Recommendations
In this paper we have conducted a rapid review of the latest literature on MaaS. There are a number of different definitions of MaaS, mainly linked to different levels of integration, ranging from simple information integration to full integration of information, payment, ticketing, and operation of transport services. MaaS, as an ecosystem, has a number of actors in the public and private sectors that interact with each other. These include not just the MaaS provider, but also transport operators, data providers, technology and platform providers, Information and Communication Technology infrastructure, and insurance companies, amongst others.
One important conclusion that comes from the literature is that the number of MaaS trials and applications worldwide is, as of 2021, small. The characteristics of the MaaS systems trialled differ. Therefore, it is difficult to derive conclusions, let along make predictions. There is, however, some limited evidence that MaaS can support a reduction of travel by car and an increase of travel by public transport.
We explored the association between the use of Moovit and the share of workers that commute by public transport in metropolitan areas in the United States. Moovit is a Level 1 MaaS provider, according to the topology and taxonomy models presented in Section 2.3. It only integrates information, so the results are not transferable to MaaS providers with high levels of integration.
We found that the metropolitan areas with the highest shares of workers commuting by public transport remained virtually the same over the period 2010 to 2019, and that the shares, in general, seem to follow long-term trends. Moovit became available in some of these metropolitan areas in 2012 but no substantial change can be detected in these trends around 2012 or just after 2012, or indeed at any point in the years that followed. There seems to be, however, a positive correlation between Moovit use, proxied by the popularity of searches of the term “Moovit” in Google, and the share of workers that commute by public transport. We speculate that metropolitan areas with higher shares of workers commuting by public transport, are metropolitan areas where people, including workers, are more likely to use Moovit.
The evidence reviewed and the case of Moovit point towards MaaS supporting rather than triggering a change in travel behaviour. Being able to access a MaaS app at the touch of a button does not in any way guarantee that car commuters will switch mode. Being able to access a MaaS app at the touch of a button in a metropolitan area that has an extensive, accessible, public transport network, may help with that last push needed to switch mode. As shown by the literature reviewed, the potential to switch also depends on the characteristics of the MaaS system offered, including, for example, the level of integration and the subscription options.
The percentage of people who commute by car decreases as the percentage of people who live within 1 km of a mass rapid public transport station increases [43], so interventions such as improving public transport coverage and/or access, may be more effective than the introduction of MaaS if the desired outcome is a shift towards public transport.
Policy makers interested in meeting targets of public transport use should consider investment in public transport to increase coverage and accessibility first, and then support this offer with a MaaS system.
Author Contributions
Conceptualization: G.S., methodology: G.S., N.N., acquisition of data: G.S., N.N., analysis of data: G.S., N.N., writing: G.S., reviewing and editing: G.S. All authors have read and agreed to the published version of the manuscript.
Funding
The authors did not receive any funding for this work.
Institutional Review Board Statement
Not applicable.
Informed Consent Statement
Not applicable.
Data Availability Statement
All the data used in this study are secondary data freely available as stated in the sources.
Acknowledgments
The authors are grateful to Tobias Preis, from University of Warwick, for advice regarding the use of Google Trends.
Conflicts of Interest
Nikolay Nikolaev is a Senior Community Ambassador for Moovit in Bulgaria, which is not a remunerated role, but a role that receives benefits in kind.
Appendix A
The American Community Survey data reflect the Office of Management and Budget definitions of metropolitan and micropolitan statistical areas, although in some cases these differ from those definitions due to differences in the effective date of the geographic entities. In addition, the Office of Management and Budget definitions of metropolitan and micropolitan statistical areas do change from time to time, and so do those in the American Community Survey, as shown on Figure A1. In 2012, the American Community Survey data followed the December 2009 Office of Management and Budget definitions of metropolitan and micropolitan statistical areas. In 2013, 2014, 2015, and 2016, it followed the February 2013 Office of Management and Budget definitions of metropolitan and micropolitan statistical areas. In 2017 and 2018, it followed the July 2015 definitions, and in 2019, the September 2018 ones.

Figure A1.
Delineations of metropolitan and micropolitan statistical areas followed in the American Community Survey, 2012 to 2019. Source: United States Census Bureau [41].

Figure A2.
Matching of metropolitan areas from Google Trends and metropolitan areas from the American Community Survey. Source: Authors’ own. Note: The areas in Italics were split and matched with their closest counterparts.
References
- Cruz, C.O.; Sarmento, J.M. “Mobility as a Service” Platforms: A Critical Path towards Increasing the Sustainability of Transportation Systems Sustainability. Sustainability 2020, 12, 6368. [Google Scholar] [CrossRef]
- Jang, S.; Caiati, V.; Rasouli, S.; Timmermans, H.; Choi, K. Does MaaS contribute to sustainable transportation? A mode choice perspective. J. Sustain. Transp. 2020, 15, 351–363. [Google Scholar] [CrossRef]
- Lopez-Carreiro, I.; Monzon, A.; Lopez, E.; Lopez-Lambas, M.E. Urban mobility in the digital era: An exploration of travellers’ expectations of MaaS mobile-technologies. Technol. Soc. 2020, 63, 101392. [Google Scholar] [CrossRef]
- Crozet, Y.; Santos, G.; Coldefy, J. Shared Mobility and MaaS: The Regulatory Challenges of Urban Mobility, Brussels, September. Available online: www.cerre.eu/publications/shared-mobility-and-maas-regulatory-challenges-urban-mobility (accessed on 25 September 2020).
- Sochor, J.; Karlsson, I.C.M.; Strömberg, H. Trying out Mobility as a Service: Experiences from a field trial and implications for understanding demand. Transp. Res. Rec. 2016, 2542, 57–64. [Google Scholar] [CrossRef]
- Hensher, D.; Ho, C.; Mulley, C.; Nelson, J.; Smith, G.; Wong, Y. Understanding Mobility as a Service (MaaS): Past, Present and Future, 1st ed.; Elsevier: Amsterdam, The Netherlands, 2020. [Google Scholar]
- Hensher, D.; Ho, C.Q.; Reck, D.J. Mobility as a Service and private car use: Evidence from the Sydney MaaS trial. Transp. Res. Part A Policy Pract. 2021, 145, 17–33. [Google Scholar] [CrossRef]
- Sochor, J.; Arby, H.; Karlsson, I.C.M.; Sarasini, S. A topological approach to mobility as a service: A proposed tool for understanding requirements and effects, and for aiding the integration of societal goals. Res. Transp. Bus. Manag. 2018, 27, 3–14. [Google Scholar] [CrossRef]
- Hesselgren, M.; Sjöman, M.; Pernestal, A. Understanding user practices in mobility service systems: Results from studying large scale corporate MaaS in practice. Travel Behav. Soc. 2020, 22, 318–327. [Google Scholar] [CrossRef]
- Jittrapirom, P.; Caiati, V.; Feneri, A.-M.; Ebrahimigharehbaghi, S.; Alonso-González, M.J.; Narayan, J. Mobility as a Service: A critical review of definitions, assessments of schemes, and key challenges. Urban Plan. 2017, 2, 13–25. [Google Scholar] [CrossRef]
- Utriainen, R.; Pöllänen, M. Review on mobility as a service in scientific publications. Res. Transp. Bus. Manag. 2018, 27, 15–23. [Google Scholar] [CrossRef]
- Lyons, G.; Hammond, P.; Mackay, K. The importance of user perspective in the evolution of MaaS. Transp. Res. Part A Policy Pract. 2019, 121, 22–36. [Google Scholar] [CrossRef]
- Arias-Molinares, D.; García-Palomares, J.C. The Ws of MaaS: Understanding mobility as a service from a literature review. IATSS Res. 2020, 44, 253–263. [Google Scholar] [CrossRef]
- Calderón, F.; Miller, E.J. A literature review of mobility services: Definitions, modelling state-of-the-art, and key considerations for a conceptual modelling framework. Transp. Rev. 2020, 40, 312–332. [Google Scholar] [CrossRef]
- Butler, L.; Yigitcanlar, T.; Paz, A. Barriers and risks of Mobility-as-a-Service (MaaS) adoption in cities: A systematic review of the literature. Cities 2021, 103036. [Google Scholar] [CrossRef]
- Mulley, C. Mobility as a Services (MaaS)–does it have critical mass? Transp. Rev. 2017, 37, 247–251. [Google Scholar] [CrossRef]
- Smith, G.; Hensher, D. Towards a framework for Mobility-as-a-Service policies. Transp. Policy 2020, 89, 54–65. [Google Scholar] [CrossRef]
- MaaS Alliance. White Paper: Guidelines & Recommendations to Create the Foundations for a Thriving MaaS Ecosystem. Available online: https://maas-alliance.eu/wp-content/uploads/sites/7/2017/09/MaaS-WhitePaper_final_040917-2.pdf (accessed on 25 September 2020).
- United Nations Economic Commission for Europe. Transport Trends and Economics 2018-2019: Mobility as A Service. Available online: https://unece.org/transport/publications/transport-trends-and-economics-2018-2019-mobility-service (accessed on 25 September 2020).
- Kamargianni, M.; Matyas, M.; Li, W.; Schäfer, A. Feasibility Study for “Mobility as a Service” Concept in London FS-MaaS Project. UCL Energy Institute, London, May. Available online: https://www.ucl.ac.uk/bartlett/energy/sites/bartlett/files/fs-maas-compress-final.pdf (accessed on 25 September 2020).
- Kamargianni, M.; Li, W.; Matyas, M.; Schäfer, A. A critical review of new mobility services for urban transport. Transp. Res. Procedia 2016, 14, 3294–3303. [Google Scholar] [CrossRef]
- Kamargianni, M.; Matyas, M. The Business Ecosystem of Mobility as a Service, 96th Transportation Research Board Annual Meeting, Washington DC, 8–12 January 2017. Available online: https://discovery.ucl.ac.uk/id/eprint/10037890/1/a2135d_445259f704474f0f8116ccb625bdf7f8.pdf (accessed on 9 October 2020).
- Moovit 2021. About Moovit. Available online: https://moovit.com/about-us/ (accessed on 9 October 2020).
- Samtrafiken 2017. Förarbete—Swedish Mobility Program (SMP). Available online: https://samtrafiken.se/wp-content/uploads/2017/02/F%C3%B6rarbete-Swedish-Mobility-Program.pdf (accessed on 15 October 2020).
- Casady, C. Customer-led mobility: A research agenda for Mobility-as-a-Service (MaaS) enablement. Case Stud. Transp. Policy 2020, 8, 1451–1457. [Google Scholar] [CrossRef]
- Hensher, D.A. Future bus transport contracts under a mobility as a service (MaaS) regime in the digital age: Are they likely to change? Transp. Res. Part A Policy Pract. 2017, 98, 86–96. [Google Scholar] [CrossRef]
- Matyas, M. Opportunities and barriers to multimodal cities: Lessons learned from in-depth interviews about attitudes towards mobility as a service. Eur. Transp. Res. Rev. 2020, 12. [Google Scholar] [CrossRef]
- Santos, G. Sustainability and Shared Mobility Models. Sustainability 2018, 10, 3194. [Google Scholar] [CrossRef]
- Ho, C.Q.; Mulley, C.; Hensher, D.A. Public preferences for mobility as a service: Insights from stated preference surveys. Transp. Res. Part A Policy Pract. 2020, 131, 70–90. [Google Scholar] [CrossRef]
- Storme, T.; De Vos, J.; De Paepe, L.; Witlox, F. Limitations to the car-substitution effect of MaaS. Findings from a Belgian pilot study. Transp. Res. Part A Policy Pract. 2020, 131, 196–295. [Google Scholar] [CrossRef]
- Ganti, R.K.; Ye, F.; Lei, H. Mobile crowdsensing: Current state and future challenges. IEEE Commun. Mag. 2011, 49, 32–39. [Google Scholar] [CrossRef]
- Heiskala, M.; Jokinen, J.P.; Tinnilä, M. Crowdsensing-based transportation services—An analysis from business model and sustainability viewpoints. Res. Transp. Bus. Manag. 2016, 18, 38–48. [Google Scholar] [CrossRef]
- Gutman, L. Public Transit Fare Payment Apps to Start Operating in Israel in Q3 2020. 2020. Available online: https://www.calcalistech.com/ctech/articles/0,7340,L-3849539,00.html (accessed on 25 September 2020).
- METRO 2020. Moovit Partners with NEORide, Masabi. Available online: https://www.metro-magazine.com/10125429/moovit-partners-with-neoride-masabi (accessed on 25 September 2020).
- Google Support 2021. FAQ about Google Trends Data. Available online: https://support.google.com/trends/answer/4365533?hl=en (accessed on 5 January 2021).
- Ginsberg, J.; Mohebbi, M.; Patel, R.; Brammer, L.; Smolinski, M.; Brilliant, L. Detecting influenza epidemics using search engine query data. Nature 2009, 457, 1012–1014. [Google Scholar] [CrossRef] [PubMed]
- Preis, T.; Reith, D.; Stanley, H.E. Complex dynamics of our economic life on different scales: Insights from search engine query data. Philos. Trans. R. Soc. A 2010, 368, 5707–5719. [Google Scholar] [CrossRef] [PubMed]
- Preis, T.; Moat, H.; Stanley, H.E. Quantifying Trading Behavior in Financial Markets Using Google Trends. Sci. Rep. 2013, 3, 1684. [Google Scholar] [CrossRef]
- Jun, S.-P.; Yoo, H.S.; Choi, S. Ten years of research change using Google Trends: From the perspective of big data utilizations and applications. Technol. Forecast. Soc. Chang. 2018, 130, 69–87. [Google Scholar] [CrossRef]
- Google Support 2021. Google Trends-Exact Same Keywords and Timeline-Inconsistent Trends Provided. Available online: https://support.google.com/google-ads/thread/8389370?msgid=26184434 (accessed on 20 January 2021).
- United States Census Bureau 2020. American Community Survey-Table B08006: Sex of Workers by Means of Transportation to Work, 2010 to 2019. Available online: https://data.census.gov/cedsci/table?q=B08&d=ACS%201-Year%20Estimates%20Detailed%20Tables&tid=ACSDT1Y2019.B08006&hidePreview=false (accessed on 5 January 2021).
- Bader, D. Moovit Provides Crowdsourced Transit Information in Toronto, Montreal and Vancouver, mobilesyrup.com: News. Available online: https://mobilesyrup.com/2012/12/31/moovit-provides-crowdsourced-transit-information-in-toronto-montreal-and-vancouver/ (accessed on 18 September 2020).
- Verbavatz, V.; Barthelemy, M. Critical factors for mitigating car traffic in cities. PLoS ONE 2019, 14, e0219559. [Google Scholar] [CrossRef]
Publisher’s Note: MDPI stays neutral with regard to jurisdictional claims in published maps and institutional affiliations. |
© 2021 by the authors. Licensee MDPI, Basel, Switzerland. This article is an open access article distributed under the terms and conditions of the Creative Commons Attribution (CC BY) license (http://creativecommons.org/licenses/by/4.0/).