Abstract
This study analyzed the characteristics of the environmental impacts of apartment buildings, a typical housing type in South Korea, as part of a research project supporting the streamlined life cycle assessment (S-LCA) of buildings within the G-SEED (Green Standard for Energy and Environmental Design) framework. Three recently built apartment building complexes were chosen as study objects for the quantitative evaluation of the buildings in terms of their embodied environmental impacts (global warming potential, acidification potential, eutrophication potential, ozone layer depletion potential, photochemical oxidant creation potential, and abiotic depletion potential), using the LCA approach. Additionally, we analyzed the emission trends according to the cut-off criteria of the six environmental impact categories by performing an S-LCA with cut-off criteria 90–99% of the cumulative weight percentile. Consequently, we were able to present the cut-off criterion best suited for S-LCA and analyze the effect of the cut-off criteria on the environmental impact analysis results. A comprehensive environmental impact analysis of the characteristics of the six environmental impact categories revealed that the error rate was below 5% when the cut-off criterion of 97.5% of the cumulative weight percentile was applied, thus verifying its validity as the optimal cut-off criterion for S-LCA.
1. Introduction
With the emergence of global environmental issues such as global warming and resource depletion as an important part of the international agenda, securing eco-friendly technologies conducive to reducing the environmental load at the national level is becoming a major determinant of national competitiveness. During the 2015 United Nations Framework Convention on Climate Change (UNFCCC) in Paris, South Korea participated in the 21st Conference of the Parties (COP21) and proposed the Intended Nationally Determined Contributions (INDC). According to the INDC, the country has committed itself to reducing 37% of the greenhouse gas (GHG) emissions projected for 2030. In the process of achieving this target, the construction sector has garnered attention as a core area with a high potential for GHG reduction [1,2,3,4,5]. Specifically, in South Korea, the construction industry is the second-largest cause of GHG emissions, contributing to 197.2 million tons of the national total of 850.8 million tons, which is why the reduction target of the construction industry is significantly higher than those of the other industries (32.7% versus 20.5%) [6,7].
In an effort to achieve the targeted reduction, the construction sector uses the life cycle assessment (LCA) method to quantitatively assess and manage the potential environmental impacts caused by materials and buildings throughout their LCA stages. Countries worldwide are evaluating the LCA environmental load, for individual construction materials, using the Environmental Product Declaration (EPD) system adapted to their respective situations and providing information on the environmental profiles of construction materials. Regarding buildings, various LCA methodologies and programs have been developed to enable the quantitative assessment of the environmental load of buildings throughout their LCA stages. Recently, a green building certification system has been gaining a foothold under conventional building standards by their LCA results [8,9,10,11].
In particular, LCA is reflected in the Leadership in Energy and Environmental Design (LEED), a green building rating system widely used in the United States, through MR credit (i.e., Building Life-Cycle Impact Reduction, option 4: Whole building life-cycle assessment). This system is used to conduct building LCA using external programs such as the Athena Impact Estimator or One Click LCA and considers at least three relevant environmental impact categories, including global warming [12,13,14]. Japan’s Comprehensive Assessment System for Built Environment Efficiency (CASBEE) also considers the LCA of major building materials under “L2.2.2 Continuing Use of Existing Structural Frame etc.,” whereby the major building materials are concrete, blast furnace cement concrete, steel frame, rebar, and wood, and only the global warming potential is evaluated [15,16]. Britain’s Building Research Establishment’s Environmental Assessment Method (BREEAM) considers the LCA credits Mat01 “Life Cycle Impacts” for each building/unit using the BREEAM Green Guide Calculator database or the external IMPACT program based on 13 environmental impact categories [17,18,19]. Korea’s Green Standard for Energy and Environmental Design (G-SEED) adopted LCA results as a certification item in its 2016 revision of the certification standards. Currently, a full LCA credit (two points) is awarded when LCA is performed on 99% of the total input material weight for at least three relevant environmental impact categories, including GHG emissions, and a streamlined life cycle assessment (S-LCA) Credit (1 point) when one or more environmental impact categories are assessed for 10 or more major building materials. However, a successful LCA implementation cannot be ensured by the adherence to regulations alone, meaning a special measure needs to be taken to improve this situation. Specifically, the estimation of the environmental load emitted by a building involves the energy consumption required for the operation of the building and also the environmental impacts of all building materials used for construction [20,21]. A real-time LCA is thus a significant challenge, given the complicated construction steps and diverse types of building materials as opposed to general products or systems. When estimating the production stage LCA during the design phase, it is difficult to fix the quantities and types of building materials to be used for construction because of the frequent changes in the draft design, limited information, and time and cost constraints. In particular, S-LCA is likely to become a formal reporting standard unless cut-off criteria for input materials are specified (e.g., two-point items) because it can otherwise be interpreted that one–two or five–six items are possible if counted among the 10 major materials [22,23,24].
To address these challenges, this study examines the characteristics of the environmental impacts of building materials according to cut-off criteria as part of a research project supporting building S-LCA within the G-SEED framework. To implement the proposed method, we chose apartment buildings because they make up more than one-third of all buildings constructed in Korea every year. Specifically, we performed a quantitative evaluation of environmental impacts for three recently constructed apartment building complexes using the LCA method. In compliance with the EN 15804 and G-SEED Guidelines for Building LCA Methods, we performed S-LCA by applying cut-off criteria of 90–99% of the cumulative weight percentile according to six environmental impact potentials, identified the cut-off criterion best suited for S-LCA, and analyzed the effects of cut-off criteria on the S-LCA results.
2. Literature Review
2.1. Life Cycle Assessment
LCA is a tool to assess the potential environmental impacts of a product or service throughout its life cycle by performing a scientific and quantitative analysis of inputs (resources and energy consumed) and outputs (pollutants emitted) in each life cycle stage, from raw material extraction through production, use, and disposal. LCA comprises four main stages: (1) goal and scope definition, (2) life cycle inventory analysis (LCI), (3) life cycle impact assessment (LCIA), and (4) life cycle interpretation. The four stages are interconnected (see Figure 1) [25].
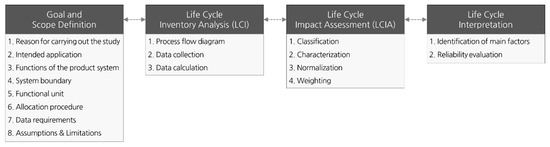
Figure 1.
Main stages of life cycle assessment (LCA).
The goal of the study and the scope of the system to be studied are defined. The integral components of this stage are the reasons for carrying out the study, intended application, functions of the product system, system boundary, functional unit, allocation procedure, data requirements, and assumptions and limitations. During the LCI stage, the types of raw materials with environmental impact included in the product system are derived from calculations based on the collected data on the product system set from the goal and scope definition stage, and the input and output materials are quantified. LCI involves a process flowchart, data collection, and data calculation.
In the LCIA stage, the potential environmental impact of the product system is evaluated, with a focus on the materials with a higher impact identified in the LCI stage. LCIA comprises three processes: (i) classification, in which the collected materials are classified according to their environmental impact index; (ii) characterization, in which the impact of each classified item on the environmental impact index is quantified and converted into standard material; (iii) weighting, in which the relative importance of the impact categories is determined. The process of normalization, under which the environmental impact exerted on each environmental category is divided into local or global environmental impact, can be included between (ii) and (iii). During the life cycle interpretation stage, the evaluation results obtained in the LCI and LCIA stages are analyzed and the final conclusions are drawn, from which strategies for reducing environmental impacts can be derived. Additionally, the major determinants of environmental impacts can be identified, and a reliability evaluation of the research results can be conducted.
2.2. Environmental Impact
ISO 14044 defines environmental impact as a complete or partial change to the environment, whether adverse or beneficial, arising from environmental aspects. Environmental impacts generally include global warming potential (GWP), acidification potential (AP), eutrophication potential (EP), ozone layer depletion potential (ODP), photochemical oxidant creation potential (POCP), and abiotic depletion potential (ADP), which can be quantified using various LCIA methods [26,27].
ISO 21931–1 [28] provides methods for assessing the environmental performance of a building and proposes GWP, AP, EP, ODP, and POCP as international and interregional environmental impact potentials. Additionally, considering the growing interest in resource efficiency throughout the building industry (e.g., mixed materials and recycled aggregates), we added ADP and analyzed the six environmental impact categories.
Global warming is an abnormal increase in Earth’s average temperature causing changes in soil and water ecosystems and gradually raising the sea level, thus posing environmental problems. The GWP can be quantified for a 100-year timeframe as a metric of its impact, as proposed in the Intergovernmental Panel on Climate Change (IPCC) guidelines. Among a total of 42 impact materials, such as carbon dioxide (CO2), methane (CH4), and nitrogen oxide (N2O), CO2 is the reference material because it has, by definition, a GWP value of one [29]. Acidification is an environmental phenomenon caused by acidified soil and oceans, mainly due to air pollutants. Toxic heavy metals are leached into the soil and oceans, threatening the survival of living organisms such as fish, plants, and animals. AP can be quantified using the CML 2002 method proposed by Hauschild and Wenzel. Among the 36 acidifying substances, including SO2, hydrogen sulfide (H2S), and hydrogen fluoride (HF), SO2 is considered as the reference [30,31]. Eutrophication is an environmental phenomenon caused by the excessive nutrient enrichment of coastal waters by the inflow of inland waters loaded with nutrients, pesticides, and chemicals, causing pollution problems such as red tides. EP can also be quantified using the CML 2002 method proposed by Hauschild and Wenzel. Among the 39 eutrophying substances, including phosphate (PO43−), ammonia (NH3), and nitrogen oxides (NOx), PO43− is considered as the reference [32]. Ozone layer depletion is a global phenomenon during which the ozone layer (15–30 km above the Earth’s surface) in the stratosphere is destroyed and its concentration declines, causing health hazards such as skin cancer due to the increased level of ultraviolet radiation. ODP can be quantified using the method proposed by the World Metrological Organization (WMO). Among the 23 ozone-depleting substances, including chlorofluorocarbon 11 (CFC-11), bromide trifluoride methane (Halon-1301), and chlorofluorocarbon 114, CFC-11 is considered as the reference substance [32,33]. Photochemical ozone creation is a reaction that refers to the formation of reactive chemical compounds such as ozone (O3) by the action of solar light on air pollutants, causing damage to human health and the ecological balance, such as the inhibition of crop development. POCP can be quantified using the CML 2002 method proposed by Jenkin et al. Among the 128 ozone-forming substances, including ethylene (C2H4), non-methane hydrocarbons (NMVOC), and ethanol (C2H5OH), ethylene is considered as the reference [34,35]. Abiotic depletion, or the depletion of nonliving (abiotic) resources, is a major cause of environmental pollution and destroys the balance of the ecosystem due to excessive resource collection and consumption. ADP can be quantified using the CML 2002 standard suggested by Guinée [36] and considers 89 types of natural resources, including crude oil, natural gas, and uranium (U).
3. Method
This chapter describes the research procedure in three steps, namely goal and scope definition, LCI, and LCIA, as per the LCA methodology, and the evaluation of the embodied environmental impacts of three recently constructed apartment building complexes in Korea. In selecting the study objects, only those with reinforced concrete (RC) structures were considered because, according to the Korean Statistical Information Service of Statistics Korea, more than 98% of all apartment buildings built within the last 10 years are RC buildings [37].
The RC structure is divided into a wall column structure, beam column structure, and flat plate structure [38]. The wall column structure is composed of a floor system, support column, and load-bearing wall. In the beam column structure, which is composed of columns, beams, and floors, loads are transferred through the beams and supported by the columns. The flat plate structure consists of columns and thick concrete slabs that transfer loads directly to the supporting columns without the aid of beams. Among these three types, the wall column structure was mostly used for the construction of apartment buildings in Korea in the earlier years to save cost and time. In recent years, however, driven by the incentives and legal provisions for long-life buildings allowing easy renovation [39], an increasing number of buildings have been built using the more flexible beam column and flat plate structures [40]. Therefore, in this study, three apartment buildings each built with wall columns, beam columns, and flat plate structures, were selected as evaluation targets.
3.1. Goal and Scope Definition
The LCA conducted in this study aimed to analyze the characteristics of the embodied environmental impacts of apartment buildings based on the cumulative weight percentiles of six environmental impact potentials in accordance with the cut-off criteria. We analyzed the three residential apartment building complexes in Table 1. To compile a list of the building materials used for construction by ton, we selected three apartment building complexes: Jangnyang (Buk-gu, Pohang; APT-A), Magok (Gangseo-gu, Seoul. APT-B), and Shinnae (Jungnang-gu, Seoul; APT-C), built using wall column, beam column, and flat plate structures, respectively. They were built around the same period and slightly differed in the number of units and unit gross floor area.

Table 1.
LCA study objects (three apartment building complexes).
The system boundary was set to include only the production stage of building materials, drawing on a study that stated the production stage accounts for over 90% of the LCA embodied environmental impacts of building materials, and the six environmental impact potentials (i.e., GWP, AP, EP, ODP, POCP, and ADP) were considered [41]. Materials used for temporary structures, such as formwork, shoring, access stairs, falsework, and safety structures, were excluded from the analysis because they were all collected after use and reused for other construction projects. In fact, in Korea’s EPD, such materials are excluded from data collection, lest they should be calculated in more than one LCA (see Table 2) [42,43]. The functional unit was set to the unit gross floor area (m2), which represents the minimum function of apartment housing.
Given that the final product unit is an apartment building, the allocation of the LCA results under physical or economic aspects was judged as redundant. As outlined in Table 3, we categorized the data quality requirements, by which the quality of the LCA results can be divided into temporal, regional, and technical scopes. To analyze the change in the environmental impact assessment for each cut-off criterion, 19 cut-off criteria of 90–99% (0.5% interval) were set. However, we assumed that the apartment building, which was the subject of the evaluation, does not change the type and quantity of building materials in accordance with the bill of quantities (BOQ) prepared at the time of construction and that the entire amount is used for the building. Additionally, we did not consider the environmental impact of the generation and recycling of construction waste due to the premium rate of building materials.
To analyze the variations in the environmental impact assessment, 19 cut-off criteria were set in the range of 90–99% with increments of 0.5%. Regarding the apartment buildings to be evaluated, we assumed that the types and quantities of building materials listed on the BOQ were completely used for construction without any changes. Additionally, the environmental impact of construction waste and reuse due to the extra material factor of building materials was set as non-existent [44].
Table 2.
LCI database names of building materials.
Table 2.
LCI database names of building materials.
| Building Material | LCI Database Name | Source |
|---|---|---|
| Ready mix concrete (25-21-12) | Ready mix concrete 25-210-12 | A |
| Ready mix concrete (25-21-15) | Ready mix concrete 25-210-15 | A |
| Ready mix concrete (25-24-12) | Ready mix concrete 25-210-15 | A |
| Ready mix concrete (25-24-15) | Ready mix concrete 25-240-15 | A |
| Deformed rebar, High-strength rebar | Electric arc furnace steel reinforcing bar | A |
| Cement brick, Cement block, Concrete brick | Concrete brick | B |
| Sand, Crushed sands, Crushed gravels | Sand | B |
| Ordinary Portland cement, white cement | Cement | A |
| Clear float glass, Normal (annealed) glass | Sheet glass | A |
| Tile | Tile | B |
| Marble | Artificial marble | B |
| Gypsum board, Waterproof gypsum board | Gypsum board | A |
| Wallpaper, PVC wallpaper | PVC wallpaper | B |
| Styrofoam, Expanded polystyrene | Expanded polystyrene plate | B |
| Water-based paint, White water-based paint | Paint_Water soluble paint | A |
A: Korea LCI Database Information Network (LCI DB) [45]; B: Environmental Information of Building Products of the Ministry of Land, Infrastructure, and Transport [46].
Table 3.
Data quality requirements.
Table 3.
Data quality requirements.
| Category | Quality Requirements | |
|---|---|---|
| Internal data | Temporal scope | At the time of break ground |
| Regional scope | Site data | |
| Technical scope | Building materials used for each evaluation object | |
| External data | Temporal scope | Application of the latest database |
| Regional scope | Application of the LCI database for Korea | |
| Technical scope | Application of the same or similar building material database | |
3.2. Life Cycle Inventory Analysis (LCI)
We collected design documents, including the BOQ for each evaluation object to identify the types and quantities of building materials necessary for the construction of the apartment building. In particular, we analyzed the types of building materials on the BOQ and identified the input quantity, specification, weight, and product name for each building material (see Table 4).
Table 4.
Input materials by unit weight.
Based on the unit weight conversion table, the input building materials were organized based on weight. Based on unit weight, data such as the standard part calculation for construction work, the Korea Passive Building Association, POSCO Corporation, Daebo Tile, and Noru Paint were used. For ready-made products, unit conversion was performed based on their weight. Table 4 outlines the input materials by unit weight using the unit weight conversion table. The unit weight of each input material was set based on the relevant source documents available from the Standard Construction Cost Estimate, Passive House Institute Korea, Posco International Corporation, Daebo Tile, and Noru Paint, or product specifications [47].
3.3. Life Cycle Impact Assessment (LCIA)
In the LCIA stage, the embodied environmental impacts of the buildings were calculated by multiplying the quantities of input materials in each impact category by their characterization factors: GWP, ADP, AP, EP, ODP, and POCP, as established in a previous study [47,48] and expressed as per Equation (1).
The embodied environmental impacts of the building:
= Σ (Quantity of building material × Characterization factor)
Impact substances were identified and correlated to the impact categories through classification, but there were limitations to quantitatively identifying their impact levels because each impact substance has different potentials. The fact-based LCIA methodology in the scientific literature made it possible to clearly identify the influence of each impact material on the global environment [48,49].
For example, according to IPCC guidelines, the reference substance of global warming is CO2, and the impact substances include CFC-11, CFC-114, and CFC-12. The classification results for the ready-mixed concrete 25-240-15 using the national LCI DB were 4.20 × 10² kg-CO2/m3, 2.05 × 10⁻⁹ kg-CFC-11/m3, 2.10 × 10⁻⁹ kg-CFC-114/m3, and 4.40 × 10⁻¹⁰ kg-CFC-12/m3.
Impact substances were identified and correlated to the impact categories through classification, but there were limitations to quantitatively identifying their impact levels because each impact substance has different potentials.
The environmental impacts of construction materials can be quantitatively calculated through specialization, in which the emission of each impact substance and its potential by impact category are multiplied and added. For example, the GWPs of CO2, CFC-11, CFC-114, and CFC-13 are 1.00 × 100 kg-CO2/kg-CO2, 4.00 × 10³ kg-CO2/kg-CFC-11, 9.30 × 10³ kg-CO2/kg-CFC-114, and 8.50 × 10³ kg-CO2/kg-CFC-13, respectively. These can be multiplied by the classification results for the ready-mixed concrete (25-240-15) (4.20 × 10² kg-CO2/m3, 2.05 × 10⁻⁹ kg-CFC-11/m3, 2.10 × 10⁻⁹ kg-CFC-114/m3, 4.40 × 10⁻¹⁰ kg-CFC-12/m3) and added to calculate the impact of the ready-mixed concrete (25-240-15) on global warming (4.29× 10² kg-CO2eq/m3). Here, the characterization factor database of building materials refers to the database for the environmental impact factors of building materials incurred during the production stage and established based on data provided by the Korea LCI Database Information Network (LCI DB) [45] and the Environmental Information of Building Products of the Ministry of Land, Infrastructure, and Transport [46] (Table 5).
Table 5.
Characterization factors of the LCI DB materials by impact category.
4. Results
4.1. Weight and LCA Result on Baseline Apartment Buildings
G-SEED in Korea recognizes that full LCA was performed when assessing the entire building process for cut-off criteria of 99% of the cumulative weight percentile. In this study, weight and environmental impact characteristics were analyzed based on cut-off criteria of 99% of the cumulative weight percentiles (see Figure 2, Figure 3 and Figure 4).
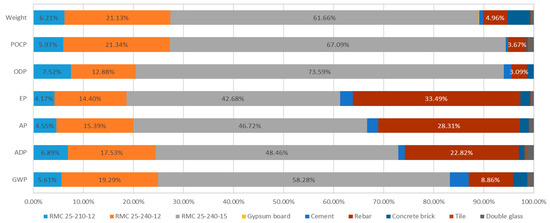
Figure 2.
Percentiles of the environmental impact assessment results according to the cut-off criteria for APT-A.
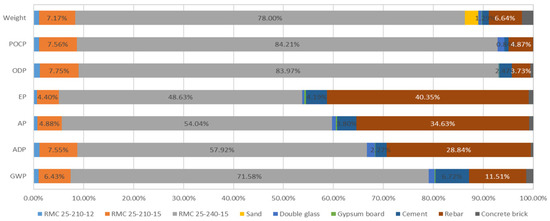
Figure 3.
Percentiles of the environmental impact assessment results according to the cut-off criteria for APT-B.
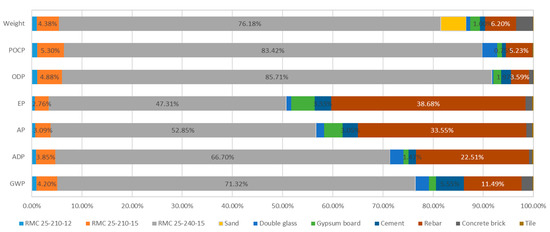
Figure 4.
Percentiles of the environmental impact assessment results according to the cut-off criteria for APT-C.
To compare analysis results, the emission amount was calculated by dividing into target unit gross floor area. Upon comparing the embodied environmental impact assessment results of the building structures, the GWP and POCP were high, in contrast, for wall and beam column structure, these results were in decreasing order which was due to an increase in the use of ready-mixed concrete and concrete, which greatly affected GWP and POCP, despite increasing the use of rebar, which is sensitive to AP, EP, ODP, as the building structure evolved from wall column structure to beam column structure. Of the analyzed apartment building complexes, APT-A and APT-B showed the greatest difference, whereby the ready-mixed concrete input decreased by 9.1% and rebar input increased by 25.4% for APT-B compared to APT-A.
Meanwhile, comparing the results of the embodied environmental impact assessments of the building structures, the GWP, ADP, AP, EP, ODP, and POCP were in increasing order of wall column structure and flat plate structure. Of the analyzed apartment building complexes, APT-A and APT-C showed a difference, whereby the ready-mixed concrete input decreased by 1.2% and rebar input increased by 34.6% for APT-C compared to APT-A(see Table 6).
Table 6.
Weight and LCA Result on apartment buildings.
4.2. Materials Falling under the Cut-Off Criteria
Table 7 lists the names, weights, weight percentiles, and cumulative weight percentiles of the input materials that fall under the cut-off criteria of 90–99% of the weights converted to tons. Ready-mixed concrete accounts for up to 80% of the cumulative weight contribution in all three complexes. When the cut-off criterion of 90% was applied, ready-mixed concrete, steel bar, and cement block were mainly included, being used in all three complexes; gypsum board was also included in APT-C (Shinnae).
Table 7.
Materials falling under the cut-off criteria for the apartment building complexes.
At the cut-off criterion of 93%, ready-mixed concrete, steel bar, and cement block were mainly included, as it was for cut-off criterion of 90%. At the cut-off criterion of 96%, ready-mixed concrete, sand, steel bar, and glass were mainly included. At the cut-off criterion of 97.5% ready-mixed concrete, sand, steel bar, glass, and gypsum board were mainly included, as it was for the cut-off criterion of 96%. At the cut-off criterion of 99%, materials necessary for frame construction such as sand, ready-mixed concrete, cement, and rebar were included.
Except for glass, gypsum board, and floor tiles, most of the input materials were used for frame construction, verifying that over 90% of the total material weight for the construction of an apartment building is represented by materials for frame construction. Large-volume light-weight materials (e.g., insulator, wallpaper, and paint) and heavy-weight small-volume materials (e.g., tile, stone, and artificial stone) were not included in the 99% cut-off criterion.
4.3. Results of Environmental Impact Analysis According to the Cut-Off Criteria
Table A1 outlines the results of the environmental impact assessment (unit area/m2) of each apartment building complex, calculated by applying the characterization factor of each input material using the cut-off criteria of 99% to 90%. Since we only consider the environmental impact assessment results, it is difficult to discern the differences caused by different cut-off criteria. Therefore, the percentiles of GWP, ADP, AP, EP, ODP, and POCP were calculated by applying the cut-off criteria of 90–99% (0.5% interval) with 99% as the reference value, as outlined in Table A2. The results presented in Table A2 are visualized by diagrams in Figure 5.
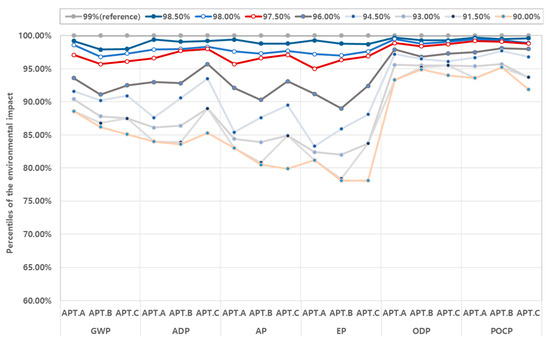
Figure 5.
Percentiles of the environmental impact assessment results according to the cut-off criteria.
Figure 5 shows the LCIA results for an apartment building complex obtained in this study, indicating that apartment houses (APT-A, APT-B, and APT-C) with different structures exhibited similar embodied environmental impacts. This result is derived because the types and input of building materials used in the Korean apartment houses are similar according to the building structure type.
Ready-mixed concrete, which has a high characterization factor and input weight percentile at all cut-off criteria, accounted for over 50% of all environmental impacts in the three apartment building complexes, with ready-mixed concrete and rebar used for frame construction and accounting for 80–95%.
To identify the differences according to the cut-off criteria for each environmental impact category, we analyzed the changes in environmental impact assessment results according to the cut-off criteria by obtaining the mean percentiles of environmental impact categories for the cut-off criteria of 90–99%, with 99% as the reference value, based on Table A2.
As illustrated in Figure 6, for the cut-off criterion of 97.5%, a general high validity of approximately 95% was shown (GWP = 96.30%, ADP = 97.46%, AP = 96.51%, EP = 96.11%, ODP = 98.66%, and POCP = 99.03%). At the cut-off criterion of 90%, the validities of the six categories were significantly lower (GWP = 86.63%, ADP = 84.43%, AP = 81.10%, EP = 79.05%, ODP = 94.07%, POCP = 93.58%). Meanwhile, at the cut-off criterion of 93%, ODP and POCP showed high validities of 95.55% and 94.93%, respectively, compared to the 99% cut-off. However, the validities of the remaining four categories were significantly lower (GWP = 88.54%, ADP = 87.38%, AP = 84.41%, and EP = 82.73%). The mean percentiles of ADP, AP, and EP decreased sharply from the cut-off of 97% to that of 93%.
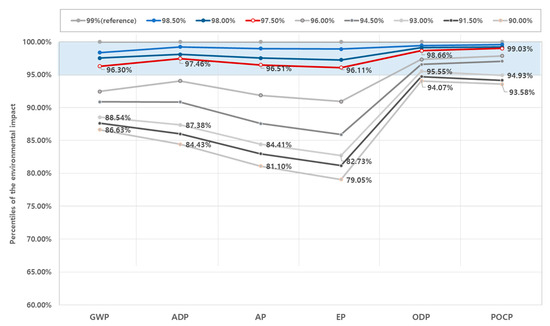
Figure 6.
Mean percentiles of the environmental impact assessment results according to the cut-off criteria.
From these results, it can be inferred that while the environmental impact assessment results of ODP and POCP have a higher validity of over 95%, even when the 93% cut-off is applied, the environmental impact assessment results of ADP, AP, and EP sharply decreased at a cut-off of 93% compared to 97.5%, such that their validities cannot be verified. The comprehensive analysis of the characteristics of six environmental impact categories revealed that the error rate of environmental impact analysis results was below 5% when the cut-off criterion of 97.5% of the cumulative weight percentile was applied, thereby verifying its validity as the optimal cut-off criterion for S-LCA.
The importance of embodied environmental impact assessments of building materials is being increasingly emphasized in line with the trend toward green building construction. To reduce the embodied environmental impacts of a building, it is necessary to develop technologies to assess these impacts since the building design stage. The application of such technology should be preceded by a cut-off criteria study that supports the assessment technology. The results of this study are significant because they can be applied to various structural types of apartment buildings in Korea and they can also identify the optimal cut-off criterion applicable to an S-LCA of apartment buildings in Korea by comprehensively reflecting six environmental impact categories.
In particular, the results can be extended to the technology development research for assessing the embodied environmental impacts of apartment buildings in Korea throughout their life cycle, i.e., from design to evaluation. However, for this research stream to advance, it is necessary to develop methods for unifying the metrics of cut-off criteria analyses depending on the type of building use and for assessing the embodied environmental impacts. One of the limitations of this study is the lack of generalizability because the sample consists of only apartment buildings. This will be addressed by extending the cut-off analysis to different building types, such as office buildings and schools. Another limitation is the application of the same weight of one to all the six environmental impact potentials and deriving all cut-off criteria within an error rate of 5% relative to the 99% cumulative weight percentile of environmental impact potentials. As such, the application of a single cut-off criterion by assigning weights reflecting the state policy or regional environmental emphasis would enable a more intuitive assessment of the embodied environmental impacts.
5. Conclusions
This study analyzed the characteristics of six major environmental impact categories according to cut-off criteria, as part of a project aimed at supporting the S-LCA of apartment buildings in Korea. The results can be summarized as follows:
- The structural types of apartment building complexes were categorized as wall column structure, beam column structure, and flat plate structure, and the embodied environmental impacts of building materials were assessed for these three types of buildings. We found that the input weight of rebar increased as the building type evolved from wall column to beam column and flat plate structure, whereas it decreased in ready-mixed concrete and concrete products.
- An analysis of the cut-off criteria-dependent environmental impact potentials for wall column, beam column, and flat plate structures revealed that over 90% of the material weight consisted of structural materials, such as ready-mixed concrete, rebar, and sand, and most interior and exterior finishing materials could not be included.
- The environmental impacts of six environmental impact categories (GWP, AP, EP, ODP, POCP, and ADP) per unit area were calculated based on the analysis data of input materials according to the cumulative weight percentile and the cut-off criteria.
- Based on the unit-area environmental load data, we calculated the percentiles of the cut-off criteria of 99% and 90% relative to the cut-off criterion of 99%, as well as the percentiles of the cut-off criteria-dependent environmental impact categories, and thus, we analyzed the trends of environmental impact categories according to the cut-off criteria.
- The comprehensive analysis of the characteristics of six environmental impact categories revealed that the error rate of the environmental impact analysis results was below 5% when the cut-off criterion of 97.5% of the cumulative weight percentile was applied, thus verifying its validity as the optimal cut-off criterion for S-LCA.
- The validities of GWP, ADP, AD, and EP assessment results sharply decreased to approximately 86.28%, 82.24%, 78.46%, and 75.57%, respectively, when the cut-off criterion of 93% was applied instead of the 97.5%. In other words, the 93% cut-off criterion was found insufficient.
- In contrast, ODP and POCP maintained high validities (95.55% and 94.93%, respectively) at the cut-off criterion of 93%, allowing for an environmental impact assessment within an error rate of 5%.
Author Contributions
Conceptualization, S.R. and R.K.; methodology, S.R. and R.K.; formal analysis, R.K.; data curation, S.R.; writing—original draft preparation, M.-K.L. and R.K.; writing—review and editing, W.-J.P. and S.R.; supervision, W.-J.P.; project administration, M.-K.L.; funding acquisition, W.-J.P. All authors have read and agreed to the published version of the manuscript.
Funding
This work was supported by the National Research Foundation of Korea (NRF) grant funded by the Korea government (NRF-2018R1D1A1B07049390).
Institutional Review Board Statement
Not applicable.
Informed Consent Statement
Not applicable.
Data Availability Statement
The data used in this study are available from the corresponding author upon request.
Conflicts of Interest
The authors declare no conflict of interest.
Appendix A
Table A1.
Environment impact assessment results according to the cut-off criteria.
Table A1.
Environment impact assessment results according to the cut-off criteria.
| Cut-Off Criteria | GWP | ADP | AP | EP | ODP | POCP | ||||||||||||
|---|---|---|---|---|---|---|---|---|---|---|---|---|---|---|---|---|---|---|
| kg-CO2eq/m2 | kg/m2 | kg-SO2eq/m2 | kg-PO43−eq/m2 | kg-CFCeq/m2 | kg-C2H4eq/m2 | |||||||||||||
| APT-A | APT-B | APT- C | APT-A | APT-B | APT-C | APT-A | APT-B | APT-C | APT-A | APT-B | APT-C | APT-A | APT-B | APT-C | APT-A | APT-B | APT-C | |
| 99.0%(reference) | 4.89 × 10² | 4.74 × 10² | 5.10 × 10² | 1.51 × 100 | 1.50 × 100 | 2.06 × 100 | 1.01 × 100 | 1.03 × 100 | 1.15 × 100 | 1.28 × 10⁻¹ | 1.34 × 10⁻¹ | 1.50 × 10⁻¹ | 4.15 × 10⁻⁵ | 4.33 × 10⁻⁵ | 4.82 × 10⁻⁵ | 1.15 × 100 | 1.09 × 100 | 1.09 × 100 |
| 98.5% | 4.85 × 10² | 4.64 × 10² | 5.00 × 10² | 1.50 × 100 | 1.49 × 100 | 2.05 × 100 | 1.00 × 100 | 1.02 × 100 | 1.13 × 100 | 1.27 × 10⁻¹ | 1.32 × 10⁻¹ | 1.48 × 10⁻¹ | 4.14 × 10⁻⁵ | 4.30 × 10⁻⁵ | 4.79 × 10⁻⁵ | 1.14 × 100 | 1.08 × 100 | 1.08 × 100 |
| 98.0% | 4.82 × 10² | 4.59 × 10² | 4.96 × 10² | 1.48 × 100 | 1.47 × 100 | 2.03 × 100 | 9.81 × 10⁻¹ | 1.01 × 100 | 1.12 × 100 | 1.24 × 10⁻¹ | 1.30 × 10⁻¹ | 1.46 × 10⁻¹ | 4.13 × 10⁻⁵ | 4.28 × 10⁻⁵ | 4.78 × 10⁻⁵ | 1.14 × 100 | 1.08 × 100 | 1.07 × 100 |
| 97.5% | 4.75 × 10² | 4.54 × 10² | 4.90 × 10² | 1.46 × 100 | 1.46 × 100 | 2.02 × 100 | 9.62 × 10⁻¹ | 9.99 × 10⁻¹ | 1.11 × 100 | 1.22 × 10⁻¹ | 1.29 × 10⁻¹ | 1.45 × 10⁻¹ | 4.11 × 10⁻⁵ | 4.26 × 10⁻⁵ | 4.76 × 10⁻⁵ | 1.14 × 100 | 1.08 × 100 | 1.07 × 100 |
| 97.0% | 4.69 × 10² | 4.40 × 10² | 4.83 × 10² | 1.43 × 100 | 1.45 × 100 | 2.01 × 100 | 9.55 × 10⁻¹ | 9.82 × 10⁻¹ | 1.10 × 100 | 1.21 × 10⁻¹ | 1.26 × 10⁻¹ | 1.43 × 10⁻¹ | 4.11 × 10⁻⁵ | 4.21 × 10⁻⁵ | 4.73 × 10⁻⁵ | 1.12 × 100 | 1.07 × 100 | 1.07 × 100 |
| 96.5% | 4.66 × 10² | 4.36 × 10² | 4.72 × 10² | 1.41 × 100 | 1.42 × 100 | 1.98 × 100 | 9.36 × 10⁻¹ | 9.58 × 10⁻¹ | 1.07 × 100 | 1.18 × 10⁻¹ | 1.23 × 10⁻¹ | 1.38 × 10⁻¹ | 4.10 × 10⁻⁵ | 4.20 × 10⁻⁵ | 4.69 × 10⁻⁵ | 1.12 × 100 | 1.07 × 100 | 1.06 × 100 |
| 96.0% | 4.58 × 10² | 4.32 × 10² | 4.72 × 10² | 1.40 × 100 | 1.39 × 100 | 1.98 × 100 | 9.26 × 10⁻¹ | 9.34 × 10⁻¹ | 1.07 × 100 | 1.17 × 10⁻¹ | 1.19 × 10⁻¹ | 1.38 × 10⁻¹ | 4.07 × 10⁻⁵ | 4.19 × 10⁻⁵ | 4.69 × 10⁻⁵ | 1.12 × 100 | 1.06 × 100 | 1.06 × 100 |
| 95.5% | 4.58 × 10² | 4.32 × 10² | 4.68 × 10² | 1.40 × 100 | 1.39 × 100 | 1.94 × 100 | 9.26 × 10⁻¹ | 9.34 × 10⁻¹ | 1.04 × 100 | 1.17 × 10⁻¹ | 1.19 × 10⁻¹ | 1.34 × 10⁻¹ | 4.07 × 10⁻⁵ | 4.19 × 10⁻⁵ | 4.68 × 10⁻⁵ | 1.12 × 100 | 1.06 × 100 | 1.06 × 100 |
| 95.0% | 4.48 × 10² | 4.32 × 10² | 4.65 × 10² | 1.32 × 100 | 1.39 × 100 | 1.93 × 100 | 8.59 × 10⁻¹ | 9.34 × 10⁻¹ | 1.04 × 100 | 1.07 × 10⁻¹ | 1.19 × 10⁻¹ | 1.34 × 10⁻¹ | 4.04 × 10⁻⁵ | 4.19 × 10⁻⁵ | 4.66 × 10⁻⁵ | 1.11 × 100 | 1.06 × 100 | 1.05 × 100 |
| 94.5% | 4.48 × 10² | 4.28 × 10² | 4.64 × 10² | 1.32 × 100 | 1.36 × 100 | 1.93 × 100 | 8.59 × 10⁻¹ | 9.06 × 10⁻¹ | 1.03 × 100 | 1.07 × 10⁻¹ | 1.15 × 10⁻¹ | 1.32 × 10⁻¹ | 4.04 × 10⁻⁵ | 4.18 × 10⁻⁵ | 4.64 × 10⁻⁵ | 1.11 × 100 | 1.06 × 100 | 1.05 × 100 |
| 94.0% | 4.42 × 10² | 4.24 × 10² | 4.52 × 10² | 1.30 × 100 | 1.32 × 100 | 1.88 × 100 | 8.49 × 10⁻¹ | 8.78 × 10⁻¹ | 1.01 × 100 | 1.05 × 10⁻¹ | 1.10 × 10⁻¹ | 1.31 × 10⁻¹ | 3.97 × 10⁻⁵ | 4.16 × 10⁻⁵ | 4.63 × 10⁻⁵ | 1.10 × 100 | 1.06 × 100 | 1.02 × 100 |
| 93.5% | 4.42 × 10² | 4.19 × 10² | 4.46 × 10² | 1.30 × 100 | 1.30 × 100 | 1.84 × 100 | 8.49 × 10⁻¹ | 8.71 × 10⁻¹ | 9.73 × 10⁻¹ | 1.05 × 10⁻¹ | 1.10 × 10⁻¹ | 1.25 × 10⁻¹ | 3.97 × 10⁻⁵ | 4.16 × 10⁻⁵ | 4.61 × 10⁻⁵ | 1.10 × 100 | 1.04 × 100 | 1.02 × 100 |
| 93.0% | 4.42 × 10² | 4.16 × 10² | 4.46E × 102 | 1.30 × 100 | 1.30 × 100 | 1.84 × 100 | 8.49 × 10⁻¹ | 8.67 × 10⁻¹ | 9.73 × 10⁻¹ | 1.05 × 10⁻¹ | 1.09 × 10⁻¹ | 1.25 × 10⁻¹ | 3.97 × 10⁻⁵ | 4.13 × 10⁻⁵ | 4.61 × 10⁻⁵ | 1.10 × 100 | 1.04 × 100 | 1.02 × 100 |
| 92.5% | 4.42 × 10² | 4.12 × 10² | 4.46 × 10² | 1.30 × 100 | 1.26 × 100 | 1.84 × 100 | 8.49 × 10⁻¹ | 8.36 × 10⁻¹ | 9.73 × 10⁻¹ | 1.05 × 10⁻¹ | 1.05 × 10⁻¹ | 1.25 × 10⁻¹ | 3.97 × 10⁻⁵ | 4.12 × 10⁻⁵ | 4.61 × 10⁻⁵ | 1.10 × 100 | 1.03 × 100 | 1.02 × 100 |
| 92.0% | 4.33 × 10² | 4.12 × 10² | 4.46 × 10² | 1.27 × 100 | 1.26 × 100 | 1.84 × 100 | 8.35 × 10⁻¹ | 8.36 × 10⁻¹ | 9.73 × 10⁻¹ | 1.04 × 10⁻¹ | 1.05 × 10⁻¹ | 1.25 × 10⁻¹ | 3.88 × 10⁻⁵ | 4.12 × 10⁻⁵ | 4.61 × 10⁻⁵ | 1.07 × 100 | 1.03 × 100 | 1.02 × 100 |
| 91.5% | 4.33 × 10² | 4.12 × 10² | 4.46 × 10² | 1.27 × 100 | 1.26 × 100 | 1.84 × 100 | 8.35 × 10⁻¹ | 8.36 × 10⁻¹ | 9.73 × 10⁻¹ | 1.04 × 10⁻¹ | 1.05 × 10⁻¹ | 1.25 × 10⁻¹ | 3.88 × 10⁻⁵ | 4.12 × 10⁻⁵ | 4.61 × 10⁻⁵ | 1.07 × 100 | 1.03 × 100 | 1.02 × 100 |
| 91.0% | 4.33 × 10² | 4.12 × 10² | 4.39 × 10² | 1.27 × 100 | 1.26 × 100 | 1.78 × 100 | 8.35 × 10⁻¹ | 8.36 × 10⁻¹ | 9.24 × 10⁻¹ | 1.04 × 10⁻¹ | 1.05 × 10⁻¹ | 1.18 × 10⁻¹ | 3.88 × 10⁻⁵ | 4.12 × 10⁻⁵ | 4.59 × 10⁻⁵ | 1.07 × 100 | 1.03 × 100 | 1.01 × 100 |
| 90.5% | 4.33 × 10² | 4.12 × 10² | 4.39 × 10² | 1.27 × 100 | 1.26 × 100 | 1.78 × 100 | 8.35 × 10⁻¹ | 8.36 × 10⁻¹ | 9.24 × 10⁻¹ | 1.04 × 10⁻¹ | 1.05 × 10⁻¹ | 1.18 × 10⁻¹ | 3.88 × 10⁻⁵ | 4.12 × 10⁻⁵ | 4.59 × 10⁻⁵ | 1.07 × 100 | 1.03 × 100 | 1.01 × 100 |
| 90.0% | 4.33 × 10² | 4.09 × 10² | 4.34 × 10² | 1.27 × 100 | 1.25 × 100 | 1.76 × 100 | 8.35 × 10⁻¹ | 8.32 × 10⁻¹ | 9.16 × 10⁻¹ | 1.04 × 10⁻¹ | 1.04 × 10⁻¹ | 1.17 × 10⁻¹ | 3.88 × 10⁻⁵ | 4.11 × 10⁻⁵ | 4.53 × 10⁻⁵ | 1.07 × 100 | 1.03 × 100 | 9.99 × 10⁻¹ |

Table A2.
Percentiles of the environment impact assessment results according to the cut-off criteria.(Unit:%)
Table A2.
Percentiles of the environment impact assessment results according to the cut-off criteria.(Unit:%)
| Cut-Off Criteria | GWP | ADP | AP | EP | ODP | POCP | ||||||||||||
|---|---|---|---|---|---|---|---|---|---|---|---|---|---|---|---|---|---|---|
| APT-A | APT-B | APT- C | APT-A | APT-B | APT-C | APT-A | APT-B | APT-C | APT-A | APT-B | APT-C | APT-A | APT-B | APT-C | APT-A | APT-B | APT-C | |
| 99.0%(reference) | 100.0 | 100.0 | 100.0 | 100.0 | 100.0 | 100.0 | 100.0 | 100.0 | 100.0 | 100.0 | 100.0 | 100.0 | 100.0 | 100.0 | 100.0 | 100.0 | 100.0 | 100.0 |
| 98.5% | 99.2 | 97.9 | 98.0 | 99.4 | 99.1 | 99.2 | 99.4 | 98.8 | 98.8 | 99.3 | 98.8 | 98.7 | 99.7 | 99.3 | 99.3 | 99.7 | 99.5 | 99.6 |
| 98.0% | 98.6 | 96.8 | 97.3 | 97.9 | 98.0 | 98.3 | 97.6 | 97.3 | 97.7 | 97.2 | 97.0 | 97.6 | 99.5 | 98.8 | 99.1 | 99.5 | 99.3 | 98.9 |
| 97.5% | 97.1 | 95.7 | 96.1 | 96.6 | 97.7 | 98.0 | 95.7 | 96.6 | 97.1 | 95.0 | 96.3 | 96.9 | 98.9 | 98.4 | 98.7 | 99.2 | 99.1 | 98.8 |
| 97.0% | 96.0 | 92.7 | 94.7 | 95.0 | 96.7 | 97.5 | 94.9 | 95.0 | 96.0 | 94.6 | 94.4 | 95.6 | 98.8 | 97.3 | 98.0 | 98.0 | 98.8 | 98.5 |
| 96.5% | 95.4 | 91.9 | 92.5 | 93.6 | 94.8 | 95.8 | 93.1 | 92.7 | 93.1 | 92.4 | 91.7 | 92.4 | 98.6 | 97.1 | 97.3 | 97.8 | 98.4 | 98.0 |
| 96.0% | 93.6 | 91.1 | 92.5 | 93.0 | 92.8 | 95.7 | 92.1 | 90.3 | 93.1 | 91.2 | 89.0 | 92.4 | 97.9 | 96.8 | 97.3 | 97.5 | 98.1 | 98.0 |
| 95.5% | 93.6 | 91.1 | 91.7 | 93.0 | 92.8 | 94.2 | 92.1 | 90.3 | 90.8 | 91.2 | 89.0 | 89.6 | 97.9 | 96.8 | 97.0 | 97.5 | 98.1 | 97.6 |
| 95.0% | 91.6 | 91.1 | 91.2 | 87.6 | 92.8 | 93.7 | 85.4 | 90.3 | 90.4 | 83.3 | 89.0 | 89.3 | 97.2 | 96.8 | 96.5 | 96.7 | 98.1 | 97.0 |
| 94.5% | 91.6 | 90.2 | 90.9 | 87.6 | 90.6 | 93.5 | 85.4 | 87.6 | 89.5 | 83.3 | 85.9 | 88.1 | 97.2 | 96.5 | 96.1 | 96.7 | 97.7 | 96.8 |
| 94.0% | 90.4 | 89.3 | 88.6 | 86.1 | 88.3 | 91.1 | 84.4 | 84.9 | 88.1 | 82.4 | 82.7 | 87.3 | 95.6 | 96.2 | 95.9 | 95.4 | 97.3 | 94.2 |
| 93.5% | 90.4 | 88.3 | 87.5 | 86.1 | 87.0 | 89.0 | 84.4 | 84.3 | 84.9 | 82.4 | 82.3 | 83.7 | 95.6 | 96.1 | 95.5 | 95.4 | 96.3 | 93.7 |
| 93.0% | 90.4 | 87.8 | 87.5 | 86.1 | 86.4 | 89.0 | 84.4 | 83.9 | 84.9 | 82.4 | 82.0 | 83.7 | 95.6 | 95.5 | 95.5 | 95.4 | 95.7 | 93.7 |
| 92.5% | 90.4 | 86.8 | 87.5 | 86.1 | 83.9 | 89.0 | 84.4 | 80.9 | 84.9 | 82.4 | 78.5 | 83.7 | 95.6 | 95.2 | 95.5 | 95.4 | 95.2 | 93.7 |
| 92.0% | 88.6 | 86.8 | 87.5 | 84.0 | 83.9 | 89.0 | 83.0 | 80.9 | 84.9 | 81.2 | 78.5 | 83.7 | 93.3 | 95.2 | 95.5 | 93.6 | 95.2 | 93.7 |
| 91.5% | 88.6 | 86.8 | 87.5 | 84.0 | 83.9 | 89.0 | 83.0 | 80.8 | 84.9 | 81.2 | 78.4 | 83.7 | 93.3 | 95.2 | 95.5 | 93.6 | 95.2 | 93.7 |
| 91.0% | 88.6 | 86.8 | 86.0 | 84.0 | 83.8 | 86.2 | 83.0 | 80.8 | 80.6 | 81.2 | 78.4 | 78.8 | 93.3 | 95.2 | 95.1 | 93.6 | 95.2 | 93.0 |
| 90.5% | 88.6 | 86.8 | 86.0 | 84.0 | 83.8 | 86.2 | 83.0 | 80.8 | 80.6 | 81.2 | 78.4 | 78.8 | 93.3 | 95.2 | 95.1 | 93.6 | 95.2 | 93.0 |
| 90.0% | 88.6 | 86.2 | 85.1 | 84.0 | 83.6 | 85.3 | 83.0 | 80.5 | 79.9 | 81.2 | 78.1 | 78.1 | 93.3 | 94.9 | 94.0 | 93.6 | 95.2 | 91.9 |

References
- Oh, J.O. Comparative analysis of the 2030 GHG reduction target for eleven major countries and its implications. J. Clim. Chang. Res. 2018, 9, 357–368. [Google Scholar] [CrossRef]
- Hulme, M. 1.5 °C and climate research after the Paris Agreement. Nat. Clim. Chang. 2016, 6, 222–224. [Google Scholar] [CrossRef]
- O’Neill, B.C.; Oppenheimer, M. Dangerous Climate Impacts and the Kyoto Protocol. Am. Assoc. Adv. Sci. 2002, 14, 1971–1972. [Google Scholar]
- Rogelj, J.; Elzen, M.G.D.; Höhne, N.; Fransen, T.; Fekete, H.; Winker, H.; Schaeffer, R.; Sha, F.; Riahi, K.; Meinshausen, M. Paris Agreement climate proposals need a boost to keep warming well below 2 °C. Nature 2016, 534, 631–639. [Google Scholar] [CrossRef] [PubMed]
- Trovato, M.R.; Nocera, F.; Giuffrida, S. Life-Cycle Assessment and Monetary Measurements for the Carbon Footprint Reduction of Public Buildings. Sustainability 2020, 12, 3460. [Google Scholar] [CrossRef]
- Wang, H.; Chen, W. Gaps between pre-2020 climate policies with NDC goals and long-term mitigation targets: Analyses on major regions. Energy Procedia 2019, 158, 3364–3369. [Google Scholar] [CrossRef]
- Ministry of Environment. The Korean Government, Roadmap for Achieving the National Greenhouse Gas Reduction Target (Plan), Korea; Ministry of Environment: Sejong City, Korea, 2018.
- Kim, K.T.; Jang, M.K.; Song, I.H.; Kim, S.M. A study on the energy self-sufficiency rate based on the analysis of building energy efficiency rating system. Korean Inst. Archit. Sustain. Environ. Build. Syst. 2017, 11, 331–341. [Google Scholar]
- Tan, M.Q.B.; Tan, R.B.H.; Khoo, H.H. Prospects of carbon labelling a life cycle point of view. J. Clean. Prod. 2014, 72, 76–88. [Google Scholar] [CrossRef]
- Park, W.-J.; Kim, R.; Roh, S.; Ban, H. Analysis of Major Environmental Impact Categories of Road Construction Materials. Sustainability 2020, 12, 6951. [Google Scholar] [CrossRef]
- Oh, M.; Jang, M.; Moon, J.; Roh, S. Evaluation of Building Energy and Daylight Performance of Electrochromic Glazing for Optimal Control in Three Different Climate Zones. Sustainability 2019, 11, 287. [Google Scholar] [CrossRef]
- Veselka, J.; Nehasilová, M.; Dvořáková, K.; Ryklová, P.; Volf, M.; Růžička, J.; Lupíšek, A. Recommendations for Developing a BIM for the Purpose of LCA in Green Building Certifications. Sustainability 2020, 12, 6151. [Google Scholar] [CrossRef]
- Kucukvar, M.; Egilmez, G.; Tatari, O. Life Cycle Assessment and Optimization-Based Decision Analysis of Construction Waste Recycling for a LEED-Certified University Building. Sustainability 2016, 8, 89. [Google Scholar] [CrossRef]
- Park, W.-J.; Kim, R.; Roh, S.; Ban, H. Identifying the Major Construction Wastes in the Building Construction Phase Based on Life Cycle Assessments. Sustainability 2020, 12, 8096. [Google Scholar] [CrossRef]
- Piasecki, M. Practical Implementation of the Indoor Environmental Quality Model for the Assessment of Nearly Zero Energy Single-Family Building. Buildings 2019, 9, 214. [Google Scholar] [CrossRef]
- Cappai, F.; Forgues, D.; Glaus, M. The Integration of Socio-Economic Indicators in the CASBEE-UD Evaluation System: A Case Study. Urban Sci. 2018, 2, 28. [Google Scholar] [CrossRef]
- Qtaishat, Y.; Adeyeye, K.; Emmitt, S. Eco-Cultural Design Assessment Framework and Tool for Sustainable Housing Schemes. Urban Sci. 2020, 4, 65. [Google Scholar] [CrossRef]
- Carvalho, J.P.; Bragança, L.; Mateus, R. A Systematic Review of the Role of BIM in Building Sustainability Assessment Methods. Appl. Sci. 2020, 10, 4444. [Google Scholar] [CrossRef]
- Saldaña-Márquez, H.; Gámez-García, D.C.; Gómez-Soberón, J.M.; Arredondo-Rea, S.P.; Corral-Higuera, R.; Gómez-Soberón, M.C. Housing Indicators for Sustainable Cities in Middle-Income Countries through the Residential Urban Environment Recognized Using Single-Family Housing Rating Systems. Sustainability 2019, 11, 4276. [Google Scholar] [CrossRef]
- Kim, K.H.; Jeon, S.-S.; Irakoze, A.; Son, K.-y. A Study of the Green Building Benefits in Apartment Buildings According to Real Estate Prices: Case of Non-Capital Areas in South Korea. Sustainability 2020, 12, 2206. [Google Scholar] [CrossRef]
- Kim, H.; Park, W. A Study of the Energy Efficiency Management in Green Standard for Energy and Environmental Design (G-SEED)-Certified Apartments in South Korea. Sustainability 2018, 10, 3402. [Google Scholar] [CrossRef]
- Roh, S.; Kim, R.; Park, W.-J.; Ban, H. Environmental Evaluation of Concrete Containing Recycled and By-Product Aggregates Based on Life Cycle Assessment. Appl. Sci. 2020, 10, 7503. [Google Scholar] [CrossRef]
- No, S.; Won, C. Comparative Analysis of Energy Consumption between Green Building Certified and Non-Certified Buildings in Korea. Energies 2020, 13, 1049. [Google Scholar] [CrossRef]
- Cho, S.-H.; Chae, C.-U. A Study on Life Cycle CO2 Emissions of Low-Carbon Building in South Korea. Sustainability 2016, 8, 579. [Google Scholar] [CrossRef]
- ISO. ISO 14040: Environmental Management—Life Cycle Assessment—Principles and Framework; ISO: Geneva, Switzerland, 1997. [Google Scholar]
- ISO. ISO 14044: Environmental Management—Life Cycle Assessment—Requirements and Guidelines; ISO: Geneva, Switzerland, 2006. [Google Scholar]
- Guinee, J.B. Handbook on Life Cycle Assessment Operational Guide to the ISO Standards. CML, Leiden University: Leiden, The Netherlands, 2002. [Google Scholar]
- ISO. ISO 21931-1: Sustainability in Building Construction—Framework for Methods of Assessment of the Environmental Performance of Construction Works—Part 1: Buildings; ISO: Geneva, Switzerland, 2010. [Google Scholar]
- IPCC. 2006 IPCC Guidelines for National Greenhouse Gas. Expert Meet. Rep. 2006, 2, 1–20. [Google Scholar]
- Heijungs, R.; Guinee, J.B.; Huppes, G.; Lankreijer, R.M.; Udo, D.H.; Sleeswijk, A.W.; Ansems, A.M.M.; Eggels, P.G.; Duit, R.; Goede, H.P. Environmental Life Cycle Assessment of Products—Vol. 1: Guide; The Institute of Environmental Sciences: Leiden, The Netherlands, 1992. [Google Scholar]
- Hauschild, M.Z.; Wenzel, H. Environmental Assessment of Products. Vol. 2—Scientific background; Chapman & Hall: London, UK, 1998. [Google Scholar]
- WMO; UNEP. Scientific Assessment of Ozone Depletion: 2006; Global Ozone Research and Monitoring Project—Report No. 50; WMO: Geneva, Switzerland; UNEP: Nairobi, Kenya, 2010. [Google Scholar]
- Albritton, D.L. Scientific Assessment of Ozone Depletion: 1991; World Meteorological Organization: Geneva, Switzerland, 1991. [Google Scholar]
- Jenkin, M.E.; Hayman, G.D. Photochemical ozone creation potentials for oxygenated volatile organic compounds: Sensitivity to variations in kinetic and mechanistic parameters. Atmos. Environ. 1999, 33, 1275–1293. [Google Scholar] [CrossRef]
- Derwent, R.G.; Jenkin, M.E.; Saunders, S.M.; Pilling, M.J. Photochemical ozone creation potentials for organic compounds in northwest Europe calculated with a master chemical mechanism. Atmos. Environ. 1998, 32, 2429–2441. [Google Scholar] [CrossRef]
- Guine, J.B. Development of a Methodology for the Environmental Life-Cycle Assessment of Products—With a Case Study on Margarines; The Institute of Environmental Sciences: Leiden, The Netherlands, 1995; p. 225. [Google Scholar]
- Statistics Korea, Korea Statistical Information Service. Available online: http://kosis.kr/eng (accessed on 26 January 2021).
- Seoul Housing Corporation. Environmental-Friendly Building System for the Low-Carbon and Green Growth; Seoul Housing Corporation: Seoul, Korea, 2010. [Google Scholar]
- Korea Housing Act. Korea Ministry of Land, Infrastructure and Transport. Available online: http://elaw.klri.re.kr/kor_service/lawView.do?hseq=25579&lang=ENG (accessed on 26 January 2021).
- Seoul Metropolitan Government. Apartment Housing Design Review Guideline in Seoul; Seoul Metropolitan Government: Seoul, Korea, 2011.
- Shin, S.W. Environmental Performance Evaluation and Design Techniques for Environment Friendly Buildings; Kimoondang Publishing: Seoul, Korea, 2007. [Google Scholar]
- Korea Environmental Declaration of Product. Korea Environmental Industry & Technology Institute. Available online: http://www.epd.or.kr/ (accessed on 26 January 2021).
- Korea Ministry of Environment. Method for Environmental Impact Assessment Index in Korea; Korea Ministry of Environment: Seoul, Korea, 2003.
- Korea Institute of Construction Technology. Standard of Estimate for Construction Works; Korea Institute of Construction Technology: Goyang, Korea, 2019. [Google Scholar]
- Korea Life Cycle Inventory Database. Korea Environmental Industry & Technology Institute. Available online: http://www.edp.or.kr/lci/lci_db.asp (accessed on 26 January 2021).
- Korea Institute of Civil Engineering and Building Technology. The Final Report of National DB on Environmental Information of Building Materials; Korea Institute of Civil Engineering and Building Technology: Goyang, Korea, 2008. [Google Scholar]
- Korea Institute of Civil Engineering and Building Technology (KICT). Green Standard for Energy and Environmental Design (G-SEED); 2016 v1.2; Korea Institute of Civil Engineering and Building Technology: Goyang, Korea, 2016. [Google Scholar]
- European Committee for Standardization. EN 15804:2012+A1:2013. Sustainability of Construction Works—Environmental Product Declarations—Core Rules for the Product Category of Construction Products; European Committee for Standardization: Brussels, Belgium, 2013. [Google Scholar]
- Park, S.W. Post-2020 climate regime and Paris Agreement. Environ. Law Policy 2016, 16, 285–322. [Google Scholar]


Publisher’s Note: MDPI stays neutral with regard to jurisdictional claims in published maps and institutional affiliations. |
© 2021 by the authors. Licensee MDPI, Basel, Switzerland. This article is an open access article distributed under the terms and conditions of the Creative Commons Attribution (CC BY) license (http://creativecommons.org/licenses/by/4.0/).