Article

Integrated Testing of Building Fabric Thermal Performance for Calibration of Energy Models of Three Low-Energy Dwellings in the UK

Low Carbon Building Research Group, School of Architecture, Oxford Brookes University, Oxford OX3 0BP, UK
*
Author to whom correspondence should be addressed.
Sustainability 2021, 13(5), 2784; https://doi.org/10.3390/su13052784
Submission received: 12 December 2020 / Revised: 17 February 2021 / Accepted: 26 February 2021 / Published: 4 March 2021

Abstract

:
This paper presents the methodology and results of in situ testing of building fabric thermal performance to calibrate as-built energy models of three low-energy dwellings in the UK, so as to examine the gap between as-designed and as-built energy performance. The in situ tests included repeat testing of air permeability (AP) integrated with thermal imaging survey and heat flux measurements of the building fabric elements, along with concurrent monitoring of indoor temperature during the pre-occupancy stage. Despite being designed to high thermal standards, wall and roof U-values were measured to be higher than expected. Thermal imaging surveys revealed air leakage pathways around door/window openings, penetrations and junctions between walls and ceilings, indicating poor detailing and workmanship. AP was found to have increased after the initial test due to post-completion alteration to the building fabric. Though the results did not meet design expectation, they were within the UK Building Regulations. Calibration of energy models with temperature monitoring provided a less extreme energy performance gap than simply replacing the designed values with test results. Insights from this study have reinforced the need for building regulations to require integrated testing of building fabric as part of housing delivery to ensure performance targets are realised.

1. Introduction

In June 2019, the UK became the first major nation to legislate for a net-zero target for carbon emissions by 2050 [1]. For the period 2008–2019, UK emissions have reduced by 30% as the economy grew. According to the Committee on Climate Change (CCC), despite having the strongest record of emissions reduction in the G20 over the last decade and a position on track to meet the third carbon budget (2018–2022), the UK is currently not on track to meet fourth and fifth carbon budgets (2023–2032). Furthermore, these carbon budgets were based on the previous over-arching goal of reducing emissions to 80% below 1990 levels, not net-zero emissions [2]. By December 2020, the CCC released the sixth carbon budget [3] as required under the UK Climate Change Act. The report provides ministers with advice on the volume of greenhouse gases the UK can emit during the period 2033–2037. The report proposes that in order to meet the net-zero target, the average annual reductions in UK emissions should be a minimum of 21 MtCO2e. This is just a little more than what has been achieved since 2012 (19 MtCO2e). The report demonstrates that this is highly feasible and the net costs of meeting the budget would be low, equivalent to less than 1% of gross domestic product.
The success with emissions reductions to date in the UK is largely attributed to progress in electricity generation, waste and the industrial sector [2,4]; however, the residential sector, down only 0.5% for the same period, will need to do much more to meet its share of reductions. The carbon budgets have driven the need for new dwellings to be built with high standards of insulation and airtightness with managed ventilation, high efficiency heating systems, and renewables. Currently, the priority recommendations for the residential sector is ultra-energy efficient construction and low-carbon heat. Furthermore, no new homes built from 2025 should be connected to the gas grid [4]. According to the sixth carbon budget, to meet its part of the net-zero target, the housing sector must, among other things, build 100% of new dwellings with high levels of energy efficiency and low-carbon heating by 2025 at the latest. All of these recommendations will require effective policies [3].
In response to the call for higher standards and verification of performance, the 2019 Consultation on changes to the UK Building Regulations for new dwellings, The Future Homes Standard [5], set forth the commitment that, by 2025, the UK government will introduce a new standard for new-build homes to be future proofed with low-carbon heating and world-leading levels of energy efficiency. The new standard would require minimum fabric standards (e.g., improve on the U-value minimum for each building element). Additionally, in 2019, just before the net-zero target was signed into law, the CCC released a report entitled UK housing: Fit for the future? [6]. The report assessed whether the UK’s housing stock is adequately prepared for the challenges of climate change. The report found that both new and retrofitted existing homes often fall short of design standards. The report suggested that standards required more enforcement and would need to focus on ‘as-built’ performance certification. Without this, “further tightening of building standards will have little impact...” ([6], p. 12). The report also highlighted a skills gap in the construction sector which would need to be addressed through a nationwide training program and incentivisation of gap-less as-built performance. This need for verification has also been recognised in the Future Homes Standard consultation, as the document proposes addition of U-value evaluation through in situ measurement to the new standard [5].
The task to achieve all of this will be difficult since over a decade in the UK there has been growing evidence (as is recognised by policy makers above) that low/zero-energy dwellings often underperform as compared to the design specifications. This is due to discrepancy in building fabric thermal performance, systems efficiency and occupant behaviour. Recent performance evaluation studies [7,8] have demonstrated that energy use can be up to three-five times more than design predictions. This performance gap between the predicted energy performance of a building (domestic or non-domestic) and its measured performance has been highlighted by several studies [9,10,11,12,13,14,15,16,17,18,19]. Corresponding with the findings of Zero Carbon Hub [20], studies that evaluated the in-use energy performance of new dwellings [11,18,19,21,22] indicated that the reasons for the performance gap can generally be attributed to discrepancies that arise across the building process, from the design and modelling tools used to design the building, through build-ability, materials and build quality (as-designed and as-built), systems integration and commissioning but also handover and operation, as well as the understanding, comfort and behaviour of the residents.
For these reasons, systematic investigation of the performance gap through real-world building performance evaluation (BPE) studies should be a high priority. BPE is a process of systematically comparing the actual performance of buildings and their systems to explicitly documented criteria for their expected performance. It offers a range of methods to evaluate the effectiveness of design and construction in meeting expected performance. BPE is based on the post-occupancy evaluation (POE) process model developed by Preiser, et al. [23,24]. There have been several studies undertaken over the last 10 years to understand the performance of new-build homes addressing issues such as energy consumption and outcomes for residents and building owners.
The post-construction/pre-occupancy stage of building allows front-end intensive and invasive evaluation of the as-built condition of a dwelling as there are no occupants to disrupt. At this stage, these evaluations are generally concerned with the building fabric performance of the dwelling though there is also an opportunity for the evaluation of the proper installation and commissioning of systems. For new dwellings in the UK, 20–30% of total heat loss can be attributed to thermal bridging [25] and up to 50% from air leakage [26]. These heat losses have an impact on space heating which is the bulk of energy consumption in UK homes, generally approximately 60% [27]. For this reason, there have been several studies in the UK to evaluate the as-built fabric performance.
To contribute to this growing body of research, this paper presents the methodology and results of in situ testing of building fabric thermal performance to calibrate as-built energy models of three low-energy dwellings in the UK, so as to examine the gap between the as-designed and as-built energy performance. The in situ tests included repeat testing of air permeability (AP), integrated with thermal imaging survey and heat flux measurements of the building fabric elements, along with concurrent monitoring of the indoor temperature during the pre-occupancy stage (no occupancy) for three low-energy dwellings in the UK, designed to high thermal standards. The empirical data collected are further used to calibrate the as-designed energy models. This study is part of a research project, funded by the European Union’s Horizon 2020 Research and Innovation programme, called Zero Plus project (2015–2020) which seeks to achieve net-regulated energy use of less than 20 kWh/m2/year.

2. Evidence to Date

In the UK, the Innovate UK-funded BPE Programme led to large-scale in situ measurement of building fabric thermal performance of new-build housing although most of the tests conducted were one-offs [28,29,30,31,32,33]. A cross-project meta-study [34] of mostly projects in the BPE programme statistically analysed the building fabric thermal performance data from 188 new-build low-energy dwellings and found that the probability of a performance gap was highest in AP testing. The gap in whole house heat loss testing (co-heating) and thermal transmittance testing was much smaller and often within expectations. Furthermore, thermal imaging surveys revealed that thermal defects could occur anywhere within the building fabric, from junctions/joints and roofs to slab/ground level and service penetrations. The conclusion highlighted the need to inform as-built energy models with in situ performance testing.
In one such as-built study of 44 retrofitted cavity masonry dwellings [19], complexity in building form has been shown to result in higher AP results. The faults tend to be around the junctions between the wall and sloping ceilings in occupiable roofs where continuity of the air barrier can more be difficult to detail. The same study identified party walls as a challenging area to seal and insulate during retrofit where thermal imaging showed that a large discrepancy in modelled vs. as-built results was from thermal bypass through the party wall cavity between dwellings. The authors considered this a significant technical finding as design and regulatory practice assumed heat loss from party walls were insignificant and therefore ignored in regulatory calculations. Though one-third of the 44 dwellings did not meet the AP target, the mean AP for the dwellings was 0.5 m3/(h·m2) @50pa (pascals) lower than design target. This is a notable success especially for retrofitted dwellings; whereas otherwise, the AP performance gap can be common and significant even in new-build high performance dwellings [21,35,36,37].
In the literature there is limited evidence of integrated testing. For example, thermal imaging during air permeability testing [31,33] allows for accentuation of air leakage on the images; and smoke tests during air permeability tests [19,36] provide an immediate non-infrared visualisation of air leakage. Longitudinal, or repeated building fabric tests, are rare since these can be costly and disruptive to perform when occupants are in the dwellings (depending on the test). Longitudinal testing can be insightful in measuring the degradation and impact of any repairs on the thermal performance of building fabric over time. AP tests and thermographic surveys offer this possibility since they can be performed while the dwelling is occupied. Though co-heating tests and heat flux measurements are in some respect longitudinal in nature, understandably, repeated instances of these tests are rare occurrence due to the length of time required to obtain useful results and the level of disruption required. There are a few case studies from the Innovate UK BPE programme which performed multiple AP tests on individual dwellings. One study performed AP tests before and after the co-heating test [31]; another, three years apart noting only a slight increase (+~9%) attributed to degradation of seals around doors and windows [32]; and another, three tests at 12 months and six months apart noting an increase (+~30%) attributed to wear and tear on door seals. In the case of the latter study, the 30% increase is more significant due to the tighter starting point of the fabric (1.0 m3/(h·m2) @50pa) in the Passivhaus dwellings. In the former case, the degradation of the fabric of 9% was a change from 4.5 m3/(h·m2) @50pa.
Guerra-Santin, et al. [38] performed multiple tests on two dwellings designed for Passivhaus certification. Most notably, the researchers performed a total of six air permeability tests, two ‘preliminary tests’, one post-repairs test, one Passivhaus certification test, and two follow-up tests approximately six months later. The various tests allowed for identification of faults, assessment of the impact of repairs and identification airtightness decay over time. Iordache, et al. [39] also set out to observe the impact of completion of the airtightness layer in two Passivhaus semi-detached dwellings. The findings revealed that even among semi-detached dwellings sharing a party wall, the results can be significantly different wherein one dwelling improved post-air sealing and in the other dwelling, constructors experienced difficulty attaining the desired result due to failure in proper air sealing around HVAC penetrations. The findings reinforce that testing a sample of dwellings in a development will not guarantee desired results amongst all dwellings. Another study took an interesting approach by following two initial AP tests with a year-long assessment of air change rates using an automated tracer gas injection and detection system. Temperature, relative humidity (RH) and wind speed and direction were also measured during the longevity of the study [40]. One study calibrated the as-designed energy model with building fabric performance results [37].
Table 1 lists relevant studies that measure as-built performance of dwellings, along with their methods and key findings. The studies demonstrate the prevalence of performance gap but also demonstrate an inconsistency in build quality. Interestingly Passivhaus dwellings have a much smaller difference between predicted and measured heat loss, thermal transmittance, and AP [34,41]. This is possibly because the designers and builders are more dedicated to the success in performance of the dwellings due to the stringent parameters of the Passivhaus standard. Considering the findings from literature above, this paper seeks to present repeat and integrated testing of in situ fabric thermal performance. Furthermore, in consideration of lack of studies using concurrent temperature measurements and building fabric performance testing to calibrate as-designed energy models, this paper presents the methodology and findings of using the fabric thermal performance data to inform and calibrate as-designed energy models of three case study dwellings designed to high thermal standards.
Table 1. Empirical studies that have undertaken in situ testing of building fabric.
CitationNo. of Dwellings and LocationMethods DetailedMain Findings
[19]44 dwellings, Altrincham, EnglandThermographic survey, heat flux test, AP test, co-heatingSpecial attention to external wall changes and party walls are needed during retrofit as heat loss via party wall and other construction cavities, unnecessary air leakage and thermal bridging are common issues
[36]3 dwellings, undisclosed location, UKThermographic surveys, heat flux tests, AP tests, smoke tests‘Performance gap’ best described as a ‘knowledge gap’ between off-site designers and on-site constructors and policy makers and administrators
[37]6 dwellings,
York, England
Thermographic surveys, heat flux tests, AP tests, smoke testsPerformance well below design standard; design of party wall prone to thermal bypass—recommendations to change
[38]2 Passivhaus dwellings, undisclosed locations, UKCo-heating, tracer gas decay, heat flux test, AP tests (6 each dwelling), thermographic surveyTests help identify where remedial works had to be undertaken several times to meet the expected performance; the targets were achieved due to commitment of the design team, the amount and variety of fabric performance tests carried out, and length of time for study
[39]2 Passivhaus dwellings, Bucharest, RomaniaAP testsPenetration of the airtightness layer after air sealing can lead to aggravation of results
[41]7 Passivhaus dwellings, undisclosed locations, UKCo-heatingMarginal performance gap in heat loss for all but one dwelling (range from +6 to +17%; one dwelling −15% better performance); The Passivhaus standard delivers relatively predictable results
[42]2 dwellings, Middlesbrough, EnglandThermographic survey, heat flux tests, AP tests, co-heating test, system commissioning checksU-values and AP higher than expected; AP too high to justify mechanical ventilation with heat recovery (MVHR); quality control measures during construction could have improved results
[43]2 dwellings, Southeast EnglandThermographic survey, heat flux tests, AP test, smoke test, system commissioning checksThermal transmittance as designed; AP double design expectation (too high for MVHR); air leakage paths found behind electrical cupboards, below skirting boards, around external doors and windows
[44]4 dwellings, various, EnglandCo-heating testRange from 0% to 23% higher heat loss parameter (HLP) than modelled
[45]3 dwellings, undisclosed location, UKThermographic surveys, heat flux tests, AP tests, co-heating tests, smoke testSmall HLP gap despite some significant U-value gaps—though potentially overstated due to heat flux sensor location
[46]6 dwellings, Southeast EnglandThermographic surveys, heat flux tests, AP testsAll dwellings AP rate at least double design value; one dwelling’s AP rate 8x design value; U-values similar to design values
[47]25 dwellings, undisclosed locations, UKCo-heating, whole building U-valueConsiderable performance gap in majority of dwellings; mid-terraced dwellings tend to have a much larger ‘performance gap’ than other dwelling forms, likely attributable to additional heat losses associated with the party wall bypass
[48]39 dwellings, York, EnglandThermographic survey, heat flux test, AP test, co-heatingA major factor in the performance gap is likely due specifically to the quality of insulation materials and their installation; (gap range observed: −9 to +58%)

3. Methods and Case Study Dwellings

3.1. Description of Case Study Dwellings and Their Design Energy Models

The UK case study dwellings are in a new-build development, consisting of 489 dwellings, located in the city of York, England. The region experiences a temperate climate; average winter temperatures are between 1 and 5 °C, while average summer temperatures are between 11 and 18 °C. There is generally a focus on heating demand in dwellings, with a total of 1975 heating degree days compared to 298 cooling degree days. The three case study dwellings are shown in Figure 1. The form and layout of the dwellings are representative of typical UK homes. The house numbering is from right to left in the images. ZP1 and ZP2 are both 2-bedroom semi-detached properties, consisting of two stories. These two properties are mirrored, and both share the party wall along the lounge wall. ZP3 is a 3-bedroom, plus study detached property, with an attached garage, also with two stories.
All three dwellings were constructed to meet Code for Sustainable Homes (CSH) Level 4. Though CSH is no longer a standard used in the UK, it is the standard that was used when the development began design. Even to this day, though CSH has been abandoned, the standard fabric parameters used in the development to meet it still surpass the current UK Building Regulations Part L (BRUKL) limiting fabric parameters (U-values and air permeability) as shown in Table 2. For the Zero Plus project, the three properties were slightly altered in delivery to meet the project targets. Following an optimisation phase of cost over energy reductions to meet the Zero Plus target, the case study dwellings retained the originally planned fabric parameters and focused on a net reduction in energy consumption through smart home controls, photovoltaic (PV) panels, and battery storage (Table 3). The base target for the dwellings was to achieve net-regulated energy use of less than 20 kWh/m2/year.

3.2. Details of As-Designed Energy Models

Throughout the design process, dynamic thermal simulation models were developed and maintained using the Integrated Environmental Solutions Virtual Environment (IES VE) suite of software, specifically ModelIT for modelling the external physical characteristics of the dwellings and Apache for setting thermal parameters and running simulations. IES VE thermal calculation and dynamic simulation software was selected since it is an approved industry standard, audited by the Chartered Institution of Building Services Engineers (CIBSE) and the United Kingdom Accreditation Service as well as being an accredited software for producing Energy Performance Certificates (EPCs) by the Building Research Establishment (BRE).
For modelling purposes ZP1 and ZP2 are a single model (semi-detached type), i.e., type ‘B3’ (Figure 2) and ZP3 is a model of the detached type, ‘C4’ (Figure 3). ZP1 and ZP2 have a common energy model in the design stage since the only physical difference was the mirroring of the plan along the party wall. Furthermore, the Standard Assessment Procedure (SAP) model used the same building fabric, energy system, and occupancy inputs for both dwellings leading to same outputs in terms of energy consumption. Finally, as will be seen later, single heat flux measurements were taken to represent wall and roof thermal transmittance in both dwellings. The difference in measured air permeability results between the two dwellings is also negligible. The as-designed energy models used the U-values and AP values listed in Table 2 above. Occupancy for the B3 model included two adults and one child; for C4 this was two adults and two children. In all models, the set point for the living room was set at 21 and 19 °C for all other rooms. The daily heating pattern for all dwellings was set for 06:00–10:00 and 18:00–23:00. Hourly weather data are typical meteorological year data (TMY) for Leeds, England located 38 km from the site. Table 4 shows more detail on how the models were constructed.

3.3. Building Fabric Thermal Performance Testing during Pre-Occupancy Stage

The objective of the pre-occupancy stage testing was to check the actual thermal performance of the building fabric and identify any areas of air leakage, thermal bridging or less than adequate insulation in the external fabric. The approach was to use integrated building fabric performance tests with some degree of longitudinal evaluation. The BPE methods included the use of a blower door test to measure air permeability (twice), heat flux measurement to measure thermal transmittance (U-value) for two weeks, and thermal imaging survey to qualitatively document heat loss during pressurisation and depressurisation
Air permeability (AP) tests were performed immediately following construction for compliance purposes (January–February 2019) and again in April 2019. The tests were conducted on each of the three dwellings in accordance with ATTMA TSL1 (Air Tightness Testing and Measurement Association Technical Standard L1) recommendations, using a blower door and depressurisation pressures up to 50 Pa. All ventilation openings were closed and or sealed with an adhesive membrane. Measurements of air flow rate through the fan of a blower door fitted to the front door were recorded with fan speed varied to give pressures of approximately 10 to 60 Pa. Calculations were then made to produce a figure for AP at a pressure difference of 50 Pa.
Thermal imaging was carried out on the 3 April 2019. At the time, the weather conditions were not ideal due to limited cloud cover, allowing some incident solar radiation on the building fabric. For this reason, the survey was restricted to interiors only. Thermal imaging was performed twice for each property, before and during depressurisation. Depressurisation was used to highlight further areas of air leakage. A blower door was used and a pressure of approximately −50 Pa was maintained for a period of 15 min before a second thermographic survey was undertaken. A 19 °C difference was maintained between interior and exterior except for ZP2 where the heating was inoperable. In ZP2, temporary convection heaters were installed approximately four hours prior to the survey. Unfortunately, the length of time in which this property was being heated was too short.
In the thermal images, thermal bridges are quantitatively assessed using thermal index (TI) values. TI is the ratio of temperature differences in the anomaly, external temperature and internal temperature calculated for each image. According to BRE Information Paper IP1/06 [50], where the TI is less than 0.75 (~1.92 W/(m2·K) ± 0.15) in dwellings, it is likely that condensation will form on the surface at some time in a typical year. The value can be applied to areas of air leakage and air movement as well as thermal bridging and missing insulation because all these conditions result in reduced surface temperature.
Heat flux plates were installed for 14 days (3 April to 24 April 2019) to measure variations in thermal transmittance (U-value) following the detailed test method outlined in International Standard ISO 9869-1. A quasi steady-state method was used for the heat flux measurements in ZP1 and ZP3; however, ZP2 internal temperatures could not be pre-conditioned due to the inoperable heating system. Portable heaters were deployed in ZP2 just before the heat flux measurement devices were installed. The quasi steady-state environment is attributed to the heated but unoccupied condition of the dwellings with no heat gains from occupants or window opening during the measurement period. Given time and material limitations, the project was limited to three paired simultaneous heat flux measurements. For this reason, wall measurements were prioritised in the two dwelling types with operable heating, that is ZP1 and ZP3. External wall measurements on ZP1 and ZP3 were on North walls. The roof measurement was done on ZP2 in the first-floor bathroom as the west wall temperature measurement adjacent to the roof measurement point showed high peak temperatures in the evening.
The locations were first selected by preferring northerly orientation, avoiding facades exposed to solar radiation and avoiding heat sources. Paired heat flux plates were used to observe the difference between what was observed to be ‘good’ and ‘poor’ areas of building fabric as assessed through the thermal imaging assessment. For each surface area selected for heat flux measurement, the ‘good’ refers to the warmer surface temperature that covers most of the surface as seen through thermal imaging (Figure 4). ‘Poor’ refers to areas that stand out with notably lower surface temperatures. These are areas of thermal bypass and the results of expected thermal bridges. In ZP1 the surface temperature difference between good and poor areas on the thermal image were 3 °C during depressurisation. In ZP3, the difference was 2.9 °C. The aim was to measure between the largest surface temperature difference (approximately 3 °C) between the ‘good’, majority of wall and ‘poor’, anomaly location of wall area as reported through thermal imaging assessment. Figure 2 shows the heat flux measurement location on stairway wall in ZP1 as dictated by thermography. AR02 is the “good” spot and AR01 is the “poor” spot.
The process of quantifying the thermal transmittance involves data logging of the temperature on each side of the fabric element and the heat flow through the heat flux sensors. Air temperatures were measured in the respective rooms and outside the fabric as near as possible to the same part of the fabric. U-value W/(m2·K) of a wall is heat flux (in W/m2) divided by temperature difference (K). This is calculated from the average value of heat flux divided by the average temperature difference. Because temperatures and heat flow vary during the test, average values of each parameter need to be taken over an extended test period. Pre-occupancy test limitations: ZP2 had inoperable heating, thereby limiting the temperature difference between the interior and the exterior. Additionally, the heat flux measurements were only taken on north walls in two instances and a ceiling in one instance. The worst areas were sought out for taking heat flux measurements; therefore, the thermal transmittance results from the assessment may be higher than the thermal transmittance of each element in the dwellings overall.

3.4. Revision/Calibration of the Thermal Model

The models were calibrated using the results of the building fabric thermal performance testing during the pre-occupancy stage to observe potential performance gap issues, specifically where the building fabric may be performing differently from as-designed expectations. In general, the thermal simulation models are revised with changed air permeability rates and changed resultant U-values through reducing the thickness of the insulation in the model. The assumption in the model is that the variation in thermal transmittance from design to as-built is a result of a failure with respect to the installation of the insulation. The specified thickness is known but the actual installed thickness or the change in effectiveness due to compressing or damaging the insulation cannot be known. All other material thicknesses and thermal conductivity are assumed to be the same as those specified in design. Two model calibration methods were explored as described below:

3.4.1. Method 1 (M1)—U-Values Change Based on Heat Flux Measurements

M1 takes the fabric thermal performance measurements at face value. This method used the heat flux measurements and latter air permeability results to revise the model. To do this, the new U-value and AP results from these tests were used as revised parameters in the model. That is, the only parameters changed in the models for M1 are the thermal transmittance values for wall and roof and the AP rate. Note, the origin of the measurements is outlined later in the results; however, the calculations of the wall thermal transmittances are explained here. Table 5 lists the parameters changed for the model in M1. An external wall thermal transmittance of 0.65 W/(m2·K) was used for ZP1 and ZP2 and 0.84 W/(m2·K). These are calculated by taking the ‘good’ and ‘poor’ heat flux measurements in ZP1 and ZP3, respectively. Though the actual percentage of ‘good’ and ‘poor’ surface area could not be calculated for the dwellings onsite, an estimation was applied by using ‘good’ as 80% of wall and ‘poor’ as 20% of the wall (see Equation (1)). This borrows from the theory that thermal bridges can account for 20–30% of the heat loss in a typical new-build home in the UK [25]. The concept of the ‘good’ and ‘poor’ measurements, along with the theory that 20–30% of heat loss from thermal bridging were used to create the effective U-values used in the revised simulation models. This is how the impact of thermal bridges (as measured through the heat flux measurements) were integrated into the model. A roof thermal transmittance for all dwellings of 0.41 W/(m2·K) was calculated in the same way. This applies to all dwellings due to only a single location being measured for the roof. The measurements referred to here are presented in Section 4.
Thermal transmittance = (‘good reading’ × 0.8) + (‘poor reading’ × 0.2)
The limitations of this method are as follows: in situ AP measurements that are significantly different from previous AP tests are used in the model, ideally, a third AP test would be used to validate either the first or second test results as they are so different; in situ thermal transmittance values were limited to only one test per dwelling and were used to represent all wall and roof elements in the dwellings. Regarding Equation (1), (a) the estimation of the impact of thermal bridges are limited to the ‘poor’ readings and (b) the actual percentage of each wall and roof element that qualified as ‘good’ (majority of the surface area—as seen in the thermal images) and ‘poor’ (likely thermal bridges) were not measured onsite in totality; therefore, these had to be estimated based on existing theory [25] regarding new domestic construction in the UK. The limitation of this generalisation is that it is not the proportion of surface area that are thermal bridges, but the proportion of heat loss attributed to thermal bridges. The generalisation is, therefore, projected as percentage of heat loss from each element attributed to thermal bridges to arrive at a hypothetical but useful proportioning of each U-value reading. Finally, though the simulation model takes into consideration the specific heat capacity of every material, the effect of thermal mass on the effective thermal transmittance of the building elements [51] is not considered in the fabric assessment. This is because the project did not aim to establish an optimal level of thermal mass for the elements of the building or to measure the impact of the thermal mass on the as-built space heating.

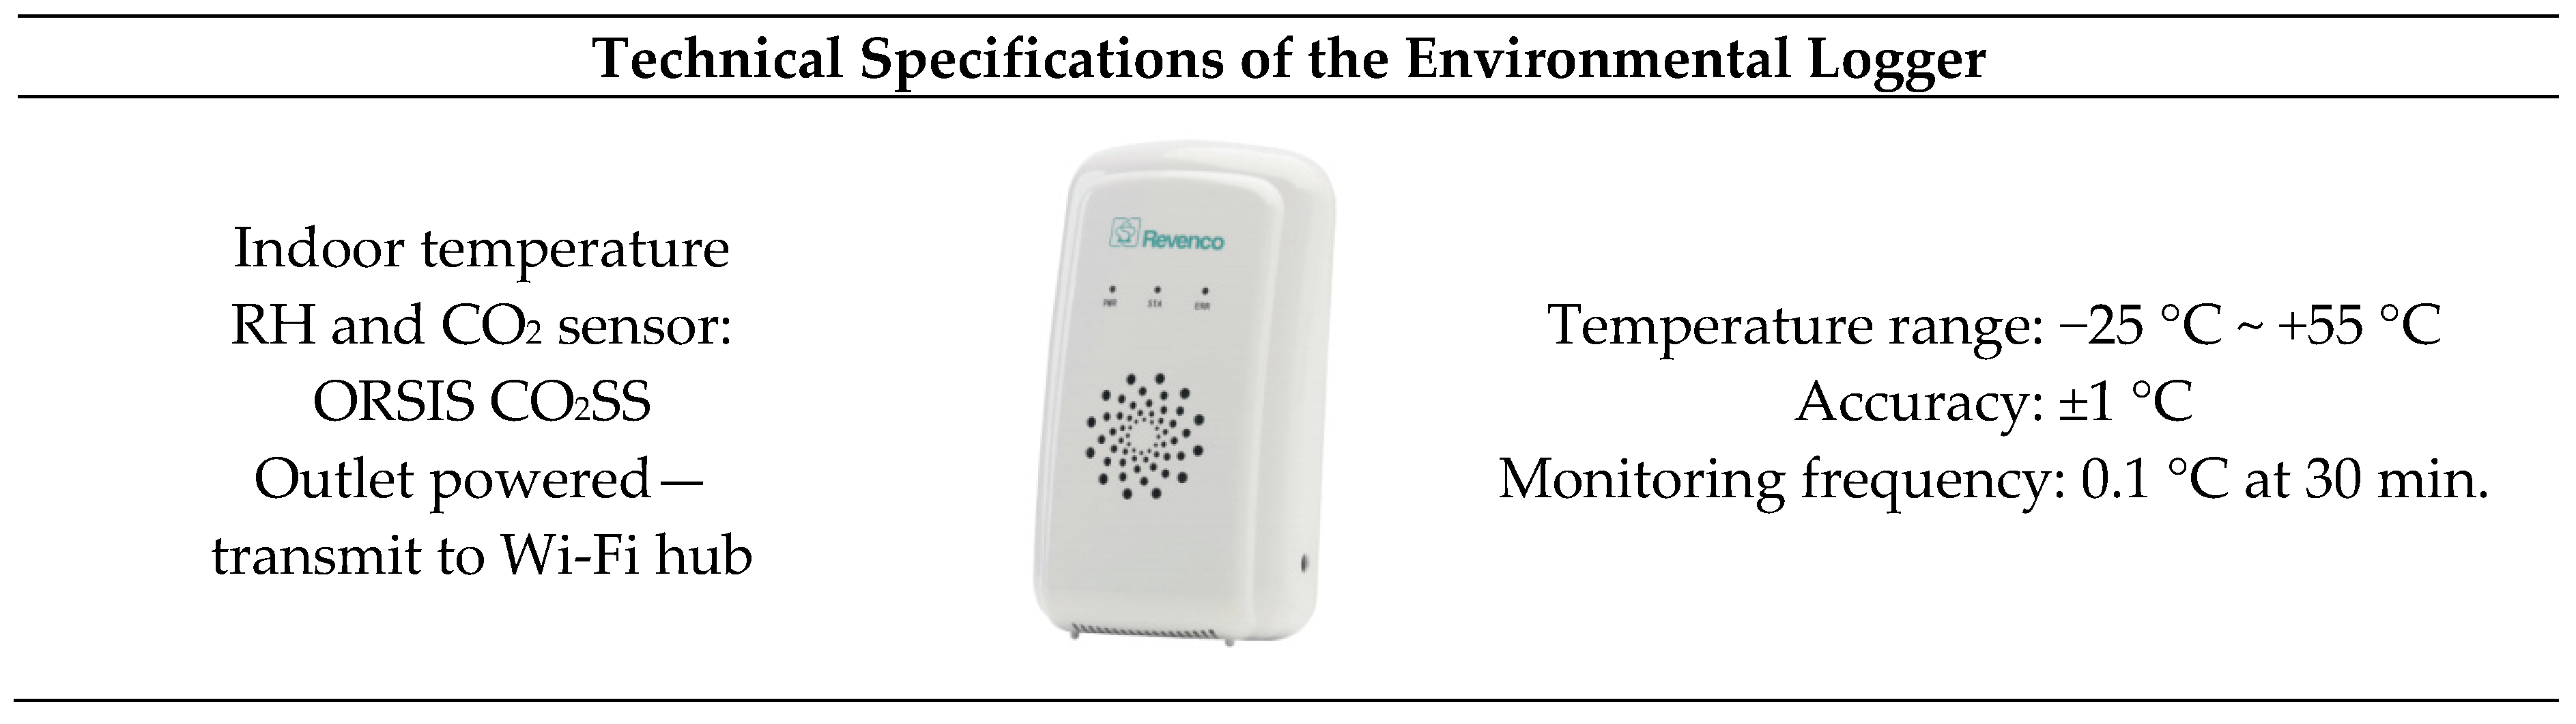
3.4.2. Method 2 (M2)—U-Values Estimation through Temperature Monitoring

An alternate method was explored for contrast. This method used temperature data to estimate the external wall U-value. The temperature data were measured at the end of summer in ZP2, an unoccupied, unheated period (4–12 September 2019) for the dwelling. As ZP2 was the only dwelling that remained unoccupied during the non-heating period, this dwelling was used to calibrate the model, specifically the external wall U-value, using internal temperature data (Figure 5). First, as the dwelling was unoccupied, all internal gains from occupant activity were removed from the model, that is, occupant body heat, appliance energy, domestic hot water energy, and lighting energy. In addition, occupant window opening patterns and heating patterns were removed from the model.
Second, the ‘good’ roof thermal transmittance was used from fabric testing results in ZP2. This is done for two reasons. One, because this is closer to the specified U-values in design, and two, the method theorises that the ‘poor’ thermal transmittance is skewing the results given that, as will be seen later, the space heating for M1 is significantly higher than as designed. Additionally, the AP rate was changed to the latter reading for ZP2 (same as M1). At this point, the model is free-running to match the dwelling in its actual state and the roof U-value and whole house AP match those gathered during the in situ measurements.
Third, hourly external temperature data from Weather Underground (www.wunderground.com/history/daily/gb/leeds/EGNM/date/2019-9-10, accessed on 28 July 2020) were used to align with external temperatures in the model, that is, the TMY data. Similar temperature patterns were aligned from the same period for the day with the lowest temperature in the model. That is, at a point in time where the model’s external data matched the actual external data, the model’s internal temperature response was matched with the actual internal measurements. Observing the lowest temperature is helpful in observing the greatest strain on the external fabric albeit this evaluation was performed in the end of summer/shoulder season and the lowest temperature was 6 °C. In summary, this second method was employed to find the wall thermal transmittance through temperature pattern alignment and validation. As will be seen, this method was explored due to the extraordinarily high results from the fabric testing.
Fourth, after the model was revised to mimic the pre-occupancy state of the unoccupied ZP2 dwelling, the thermal transmittance of the exterior walls was adjusted to find the best match between monitored and simulated internal temperature data in the lounge. Fifth, following the validation of the model (Section 3.5) through testing for external wall U-value, the occupancy and behaviour impacts were returned to as designed and the simulation was executed to find the new space heating estimation. Table 6 lists the parameters changed for the model in M2.
The limitations of this method are as follows: same limitations as M1, parameters of AP and roof U-value are assumed to be correct; temperature alone, as it was the only available external parameter, was used to estimate the U-value of the external wall.

3.5. ASHRAE Validation Indices Method to Model Uncertainty

ASHRAE validation was performed to check the error of the model calibration for method 2. Two validation indices were used to quantify the model’s accuracy: Normalised Mean Bias Error (NMBE) and Coefficient of Variation of the Root-Mean-Square Error (CV[RMSE]) [52].
NMBE =   i = 1       n y i y ^ i n p   ×   y ¯
CV RMSE =   i = 1   n   y i y ^ i 2 n p   ÷   y ¯
where hourly calibration data are used, the requirements for NMBE is 10% and for CV(RMSE) is 30%. As the weather data did not include solar radiation, the temperature data for a north-facing bedroom in the dwelling was tested to avoid amplification of solar gain in the space on temperature data either measured or modelled. For the UK2 dwelling this is the upstairs front bedroom. Validation was not applied to M1 as the fabric variables for these models under this method were directly revised with the measured U-value and AP data found during the fabric testing phase. However, change in total space heating is shown to demonstrate the difference in the models’ outcomes.

4. Results

4.1. Air Permeability Testing

The results of the air permeability tests are compared with the design AP, as shown in Table 7. Interestingly all three dwellings were found to have better AP results than design targets when they were first tested upon completion for building regulation compliance. The latter tests, however, showed that none of the three dwellings met the design target of 4 m3/(h·m2) @50pa, although all dwellings remained below the UK Building Regulations requirement of 10 m3/(h·m2) @50pa. ZP3 had deteriorated most significantly, and it was noted that there were holes in the kitchen wall where waste pipes had been fitted and the gaps around the pipes were not sealed properly. Other areas that had deteriorated included holes cut in the first floor, presumably to trace pipes or cables in the void and not properly filled, and cracks at the edges of the stairs and under the skirtings. These anomalies were re-confirmed in the thermal imaging survey under depressurisation. According to the developer, some work had been done on the properties to fix defects between the first and second test.

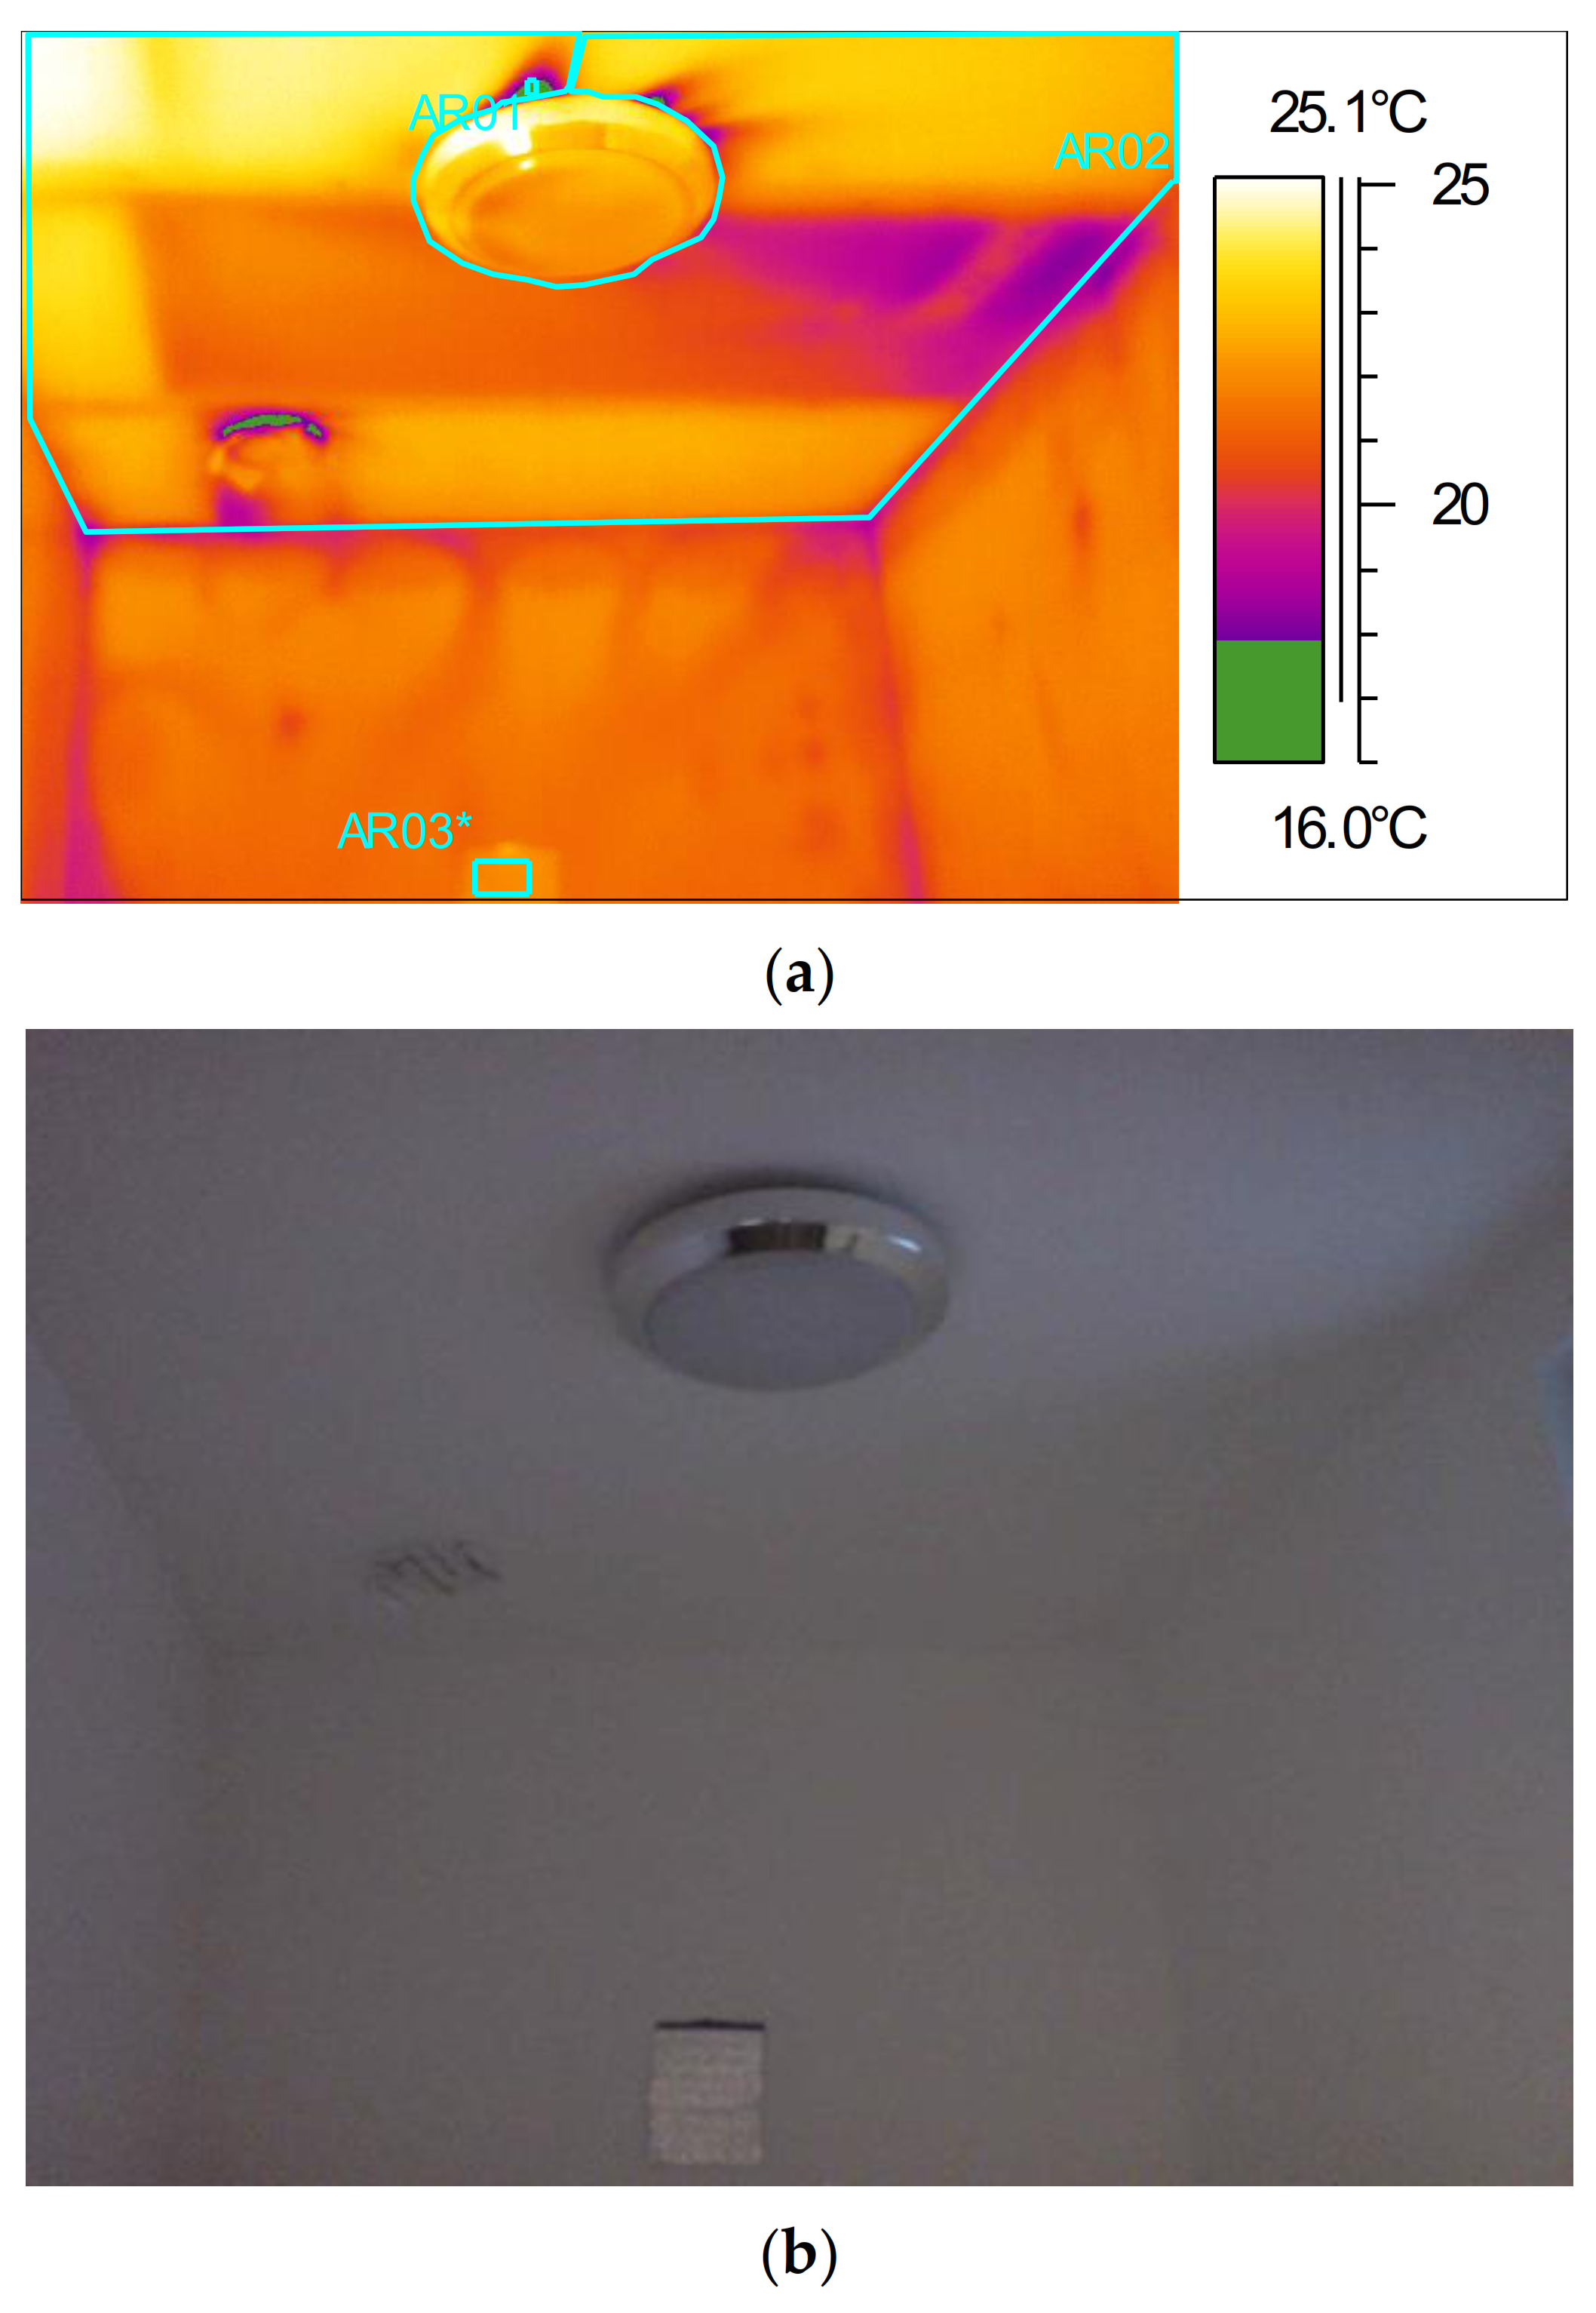
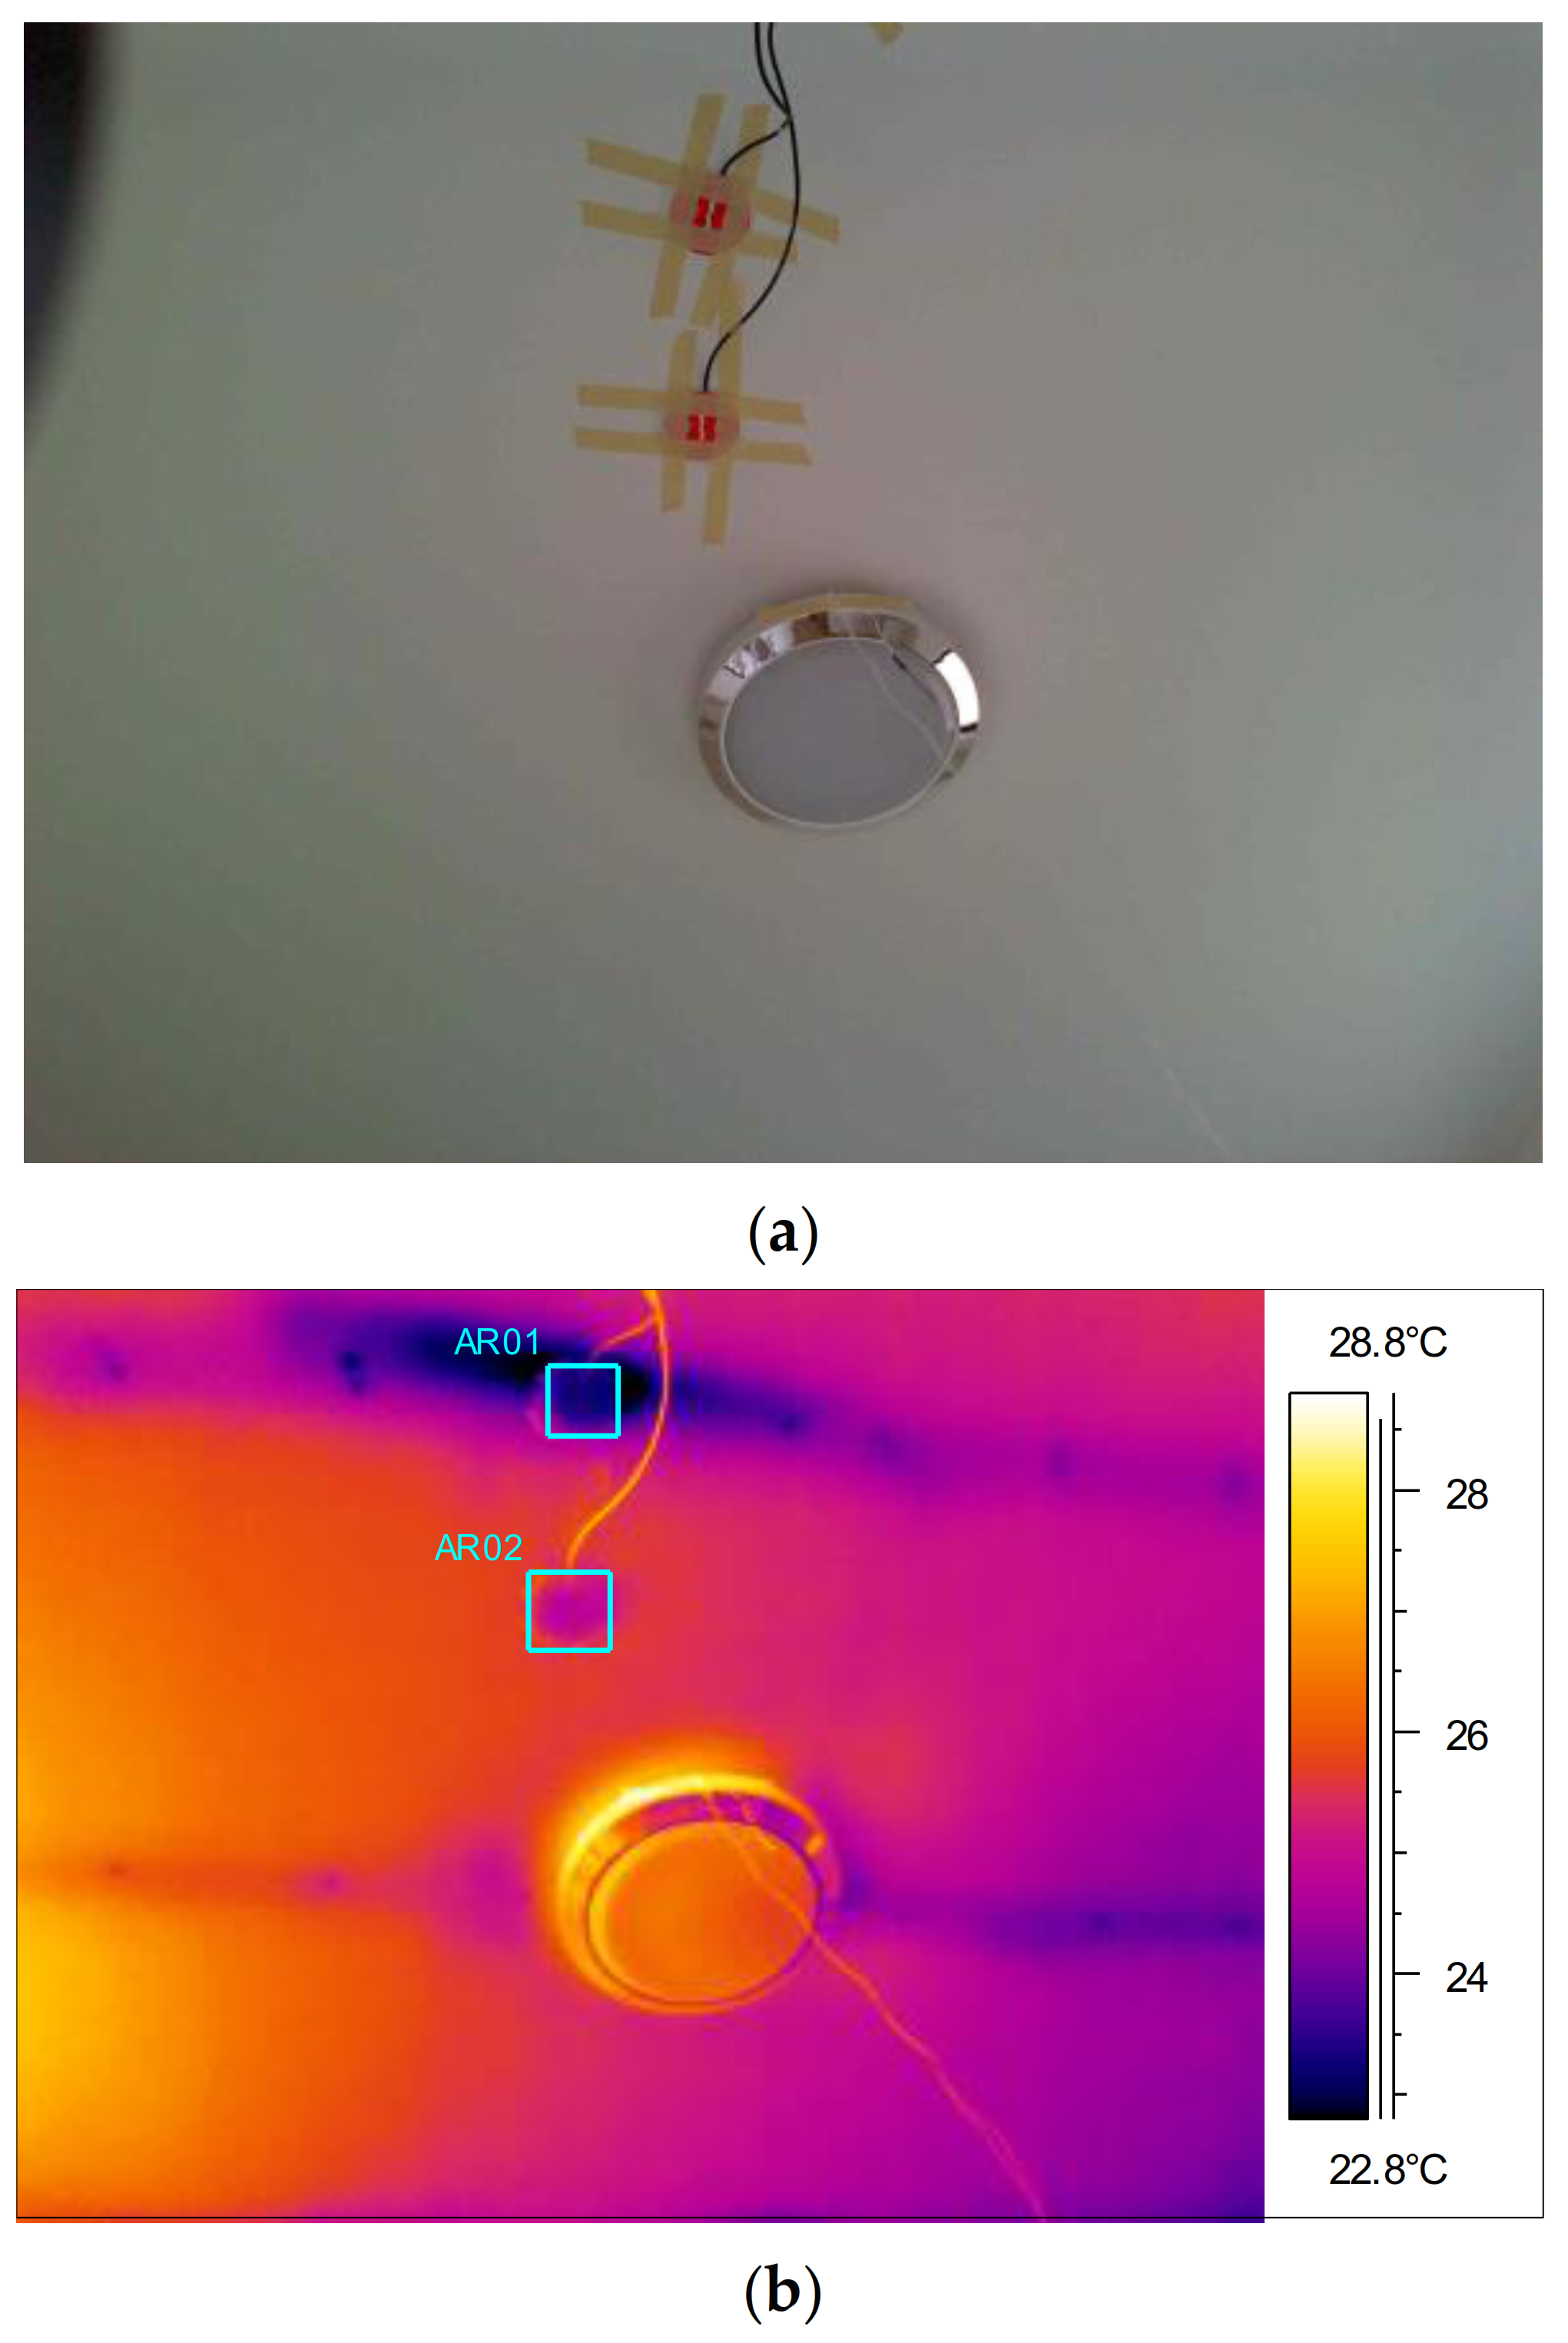
4.2. Thermal Imaging Survey

Thermal imaging survey of the dwellings showed air leakage pathways around openings and penetrations. Most surfaces were found to have a low thermal index which generally equates to higher U-values. In ZP1, the most common areas where anomalies were seen were around skirting boards and at the junctions between the ceilings and walls. In this dwelling, 15 of the 28 images taken prior to depressurisation had a TI equal to or less than 0.75, indicating a predicted U-value much higher than desired (i.e., between 1.75–2.05 W/(m2·K)). ZP2 showed similar signs of air leakage throughout the property, as well as air leakage around the openable elements especially around doors and windows. In this dwelling, 16 of the 24 images taken prior to depressurisation had a TI equal to or less than 0.75. ZP3 also showed similar signs of air leakage that was observed within the other two properties. This was mainly seen at the junctions between the ceiling and wall and around external doors. In this dwelling, 7 of the 35 images taken prior to depressurisation had a TI equal to or less than 0.75.
Figure 6 shows the corner in a bedroom in ZP1 during depressurisation. As shown in the image, under depressurisation (though an extreme state), it is clear that air can pass into the cavities within the walls resulting in cooled internal surfaces. Even the internal studwork wall on the right of the image is affected by cold air penetrating behind the plasterboard. In this image, the TI is 0.63 under depressurisation but 0.88 before depressurisation.
Figure 7 shows the ground floor WC where there appears to be air leakage present along the skirting board; the cooling effect this has on the floor and the wall adjacent is visible in the image. In this image, the TI is 0.53 before depressurisation. The green isotherm added to the image highlights the areas within this room that fall below the minimum internal surface area threshold where condensation risk is more likely. The junction between the wall on the right-hand side also shows signs of possible air leakage and it is possible to see the cooling effect this is having on the wall in this area.
During depressurisation air leakage was also identified emanating around fixed units on the ceiling and walls, an example of this can be seen in Figure 8. This is an image of the bulkhead light within the WC which did not show signs of air leakage until depressurisation. In this image, the TI is 0.72 under depressurisation but 0.79 before depressurisation. Both before and during depressurisation, possible missing or displaced insulation is also notable in the ceiling; however, the anomaly does not pose a high risk for condensation.
ZP2 showed similar signs (to ZP1) of air leakage throughout the property; the skirting board areas were common areas where air leakage was observed and around the openable elements. Special attention should be paid to the doors within the property wherein all of these showed signs of significant cooler temperature along the lower half. However, this may be due to the problem with heating that was present within this property. The rear door can be seen in Figure 9, during depressurisation the air leakage path has increased as expected, these areas would have benefited from having a suitably trained individual inspect this area to ensure adequate sealing is present. In this image, the TI is 0.35 under depressurisation but 0.44 before depressurisation. These results could indicate significant condensation around the lower section of the door frame.

4.3. Heat Flux Measurements

Overall heat flux measurements showed poor thermal quality of the walls and roof section that were measured. Whereas ‘good’ and ‘poor’ quality sections were measured, even the ‘good’ quality sections did not meet the design U-values. The measured values of thermal transmittance for the walls of the dwellings were found to be significantly higher than design values as shown in Table 8. In fact, the measured external wall U-values do not meet UK Building Regulations limiting fabric parameters (0.30 W/(m2·K)). The measured U-value for the roof/ceiling was 0.19 W/(m2·K) in the ‘good’ area, which is close to the design value, but the ‘poor’ area corresponding to a roof joist was 1.28 W/(m2·K) which is eight times the design value. Figure 10 shows the heat flux measurement locations on the ceiling and Figure 11 shows the heat flux measurement data for the measurement period in ZP2.

4.4. Energy Model Calibration

The as-built model for method M1 used:
  •  AP of 5.39 m3/(h·m2) @50pa for ZP1; AP of 5.44 m3/(h·m2) @50pa for ZP1; AP of 7.53 m3/(h·m2) @50pa for ZP3.
  •  External wall thermal transmittance of 0.65 W/(m2·K) for ZP1 and ZP2; and 0.84 W/(m2·K) for ZP3.
  •  Roof thermal transmittance of 0.41 W/(m2·K) for all dwellings.
  •  No changes were made to the occupancy patterns and behaviour or heat gains originally set for the as-designed model.
In method M2, the air permeability and thermal transmittances began as the same values as M1, but the thermal transmittance of the wall U-value was changed to align the model’s internal temperature with monitored data for the lounge. This resulted in an external wall U-value of 0.26 W/(m2·K), and a reduction of 0.3 W/(m2·K):
  •  AP of 5.44 m3/(h·m2) @50pa. (Same AP as M1).
  •  External wall thermal transmittance of 0.26 W/(m2·K) was used. This value was the change variable for finding the match between the monitored temperature data and model temperature data at the lowest temperature condition for the space simulated. This U-value is higher than the designed U-value, as expected, but approximately half the ‘good area’ measurement from the heat flux measurements.
  •  Roof thermal transmittance of 0.19 W/(m2·K) was used. This is the ‘good’ heat flux measurement for the roof.
Through method M1, as-built space heating was found to be over twice that of the designed space heating energy for all three dwellings, as shown in Table 6. Though validation was not applicable, it can be seen through the space heating results that the as-designed and as-built models under M1 are significantly different as were their fabric variables. In the case of M2, as-built annual space heating energy use was found to be approximately 37% more than the designed space heating total, as shown in Table 9.
Figure 12 shows one day during the temperature alignment process (10 September 2019). External and internal temperatures are shown for M1 and M2. M1 resulted in 1 °C cooler internal temperatures in the model than what was monitored for the same period. For M2 validation using hourly temperature data for monitored period, the uncertainty result of NMBE was 0.8% and the result of CV(RMSE) was 5% for the as-built calibration, well below the required 10% and 30%, respectively.

5. Discussion

The in situ building fabric tests performed during the pre-occupancy stage revealed the magnitude and impact of the gap between expected and actual thermal performance of the building fabric and the thermal defects that potentially caused the gap. While most elements of the wall construction visually appeared to be well insulated, depressurisation of the dwelling as part of the air permeability test highlighted air leakage pathways and origins of some anomalies, indicating poor detailing and workmanship. Air movement was prevalent at the junction between walls and ceilings within all three properties, which could lead to thermal bypass. Air infiltration was seen around doors, particularly at the threshold of the doors to the garden area. The heat flux measurement showed some areas of the building fabric that did not meet the limiting fabric parameters of UK Building Regulations. A key benefit of performing these tests was the timing and ability to fix the defects before occupants move in. These irregularities were brought to the attention of the developer and repairs were reportedly performed. Without these test results, the thermal defects would have gone unnoticed and led to bigger problems later on.
The second phase of air permeability tests showed higher AP values than those conducted post-completion as part of compliance testing. This is a significant finding and implies that one-off tests are not adequate to identify thermal defects in dwellings since the building fabric thermal performance may deteriorate (or preferably improve) as works may be undertaken, even after compliance testing. Longitudinal testing of building fabric performance is something that needs to be considered in future iterations of building regulations. This study has also exposed that communication of design intent amongst developers, constructors and designers is essential for achieving the intended thermal performance. If any works to the building fabric are undertaken (holes cut) following air-tightness testing, professionals responsible for ensuring a continuous air tightness layer must be involved.
Ideally, the in situ fabric testing should take place multiple times throughout the construction process to verify installation of insulation and appropriate airtightness barrier sealing and detailing. This is particularly important when design standards specify targets. Where buildings are existing or already occupied and the fabric testing is of interest to establish a baseline, these methods are also useful. Use of alternate methods have also been published and future tools are being developed. These include the tracer gas method, a lower cost, though less precise, technique to measure ventilation rates [53] and air change rates [54]; borescope inspections followed by thermal imaging, can be used to determine the quality of cavity wall insulation [55]. Newly developed tools include, Pulse [56], is a portable compressed air-based system which is used to measure the air leakage of a building or enclosure at a near-ambient pressure level (4 Pa). Pulse dynamically measures building air leakage directly at low pressure providing an air change rate measurement that is representative of normal inhabited conditions. The test is quick, less susceptible to wind disruption, and requires no envelope penetrations. Another tool, Surface thermal properties measuring system (STPSYS05) from Hukseflux [57], allows the measurement of thermal conductivity and an estimate of thermal diffusivity in an inexpensive and fast way. The measurement process involves placing the sensor on a smooth flat surface of the material in question and allowing it to stabilise for five minutes. After this, a reading is provided.
Utilising in situ testing data to calibrate the as-built energy models is beneficial as it exposes a difference that is closer to reality between intended and actual energy performance without the influence of occupancy related factors since the dwellings are un-occupied. However, in this case, the observed thermal transmittance was likely too high as the selected areas sought for heat flux measurements were limited in scope and representative of worst-case scenario for the walls. Combining the calibration of the model with temperature monitoring provided a less extreme projected energy performance gap than simply replacing the designed AP values and U-values with results from AP testing and heat flux measurements.
The validated M2 model retained the observed roof U-value of 0.19 W/(m2·K) as this was close to the BRUKL limiting parameter. Calibration of the model by altering the wall U-value to 0.26 W/(m2·K) made sense as this brought the external wall U-values closer to the BRUKL limiting parameter of 0.30 W/(m2·K). It is theorised that as the constructors, having been involved in the continual construction of a large development with better than UK Building Regulations specifications, should be accustomed to building to achieve at least near the BRUKL limiting parameter values which have been in place since at least 2013. In theory, if the builders were working with the intent to build homes that performed better than a typical UK new-build home and delivered fabric thermal transmittance that is +30% higher than specified, this would suggest that typical UK homes are being delivered anywhere near this gap and as heat flux tests are not required, this gap is passing unseen potentially on a large scale.
In situ building fabric testing can also bring multiple benefits over the short, medium and long term [58] as described below:
  •  Short term—remedial measures can be deployed in response to issues that are discovered through the fabric testing.
  •  Medium term—lessons learnt can be fed-forward to inform future projects for all teams involved, i.e., architect, construction, consultants, housing providers.
  •  Long term—providing the evidence base to improve compliance requirements in building regulations.
To achieve these benefits, more effort is needed to upskill constructors and designers for overseeing the quality of construction and capture the consequences of design and construction changes on fabric thermal performance. According to the CCC [6], the erratic nature of UK policy to-date with respect to delivering low-carbon housing has delayed skills development in housing design, construction and installation of new measures and technology. The key steps to delivery of revised UK Building Regulations and a move to 100% low-carbon heat will urgently require new skills and training. The proposal to integrate building fabric performance testing to assist in identifying and minimising performance gap will also require new skills. Government support is urgently needed to train designers, builders, and installers in the delivery of low/zero-energy housing to meet the national net-zero emissions target.

6. Conclusions

This paper has empirically examined the gap between as-designed and as-built energy performance of three low-energy dwellings by undertaking repeated and integrated in situ testing of building fabric thermal performance. The performance data were used to calibrate the energy models. The in situ tests included repeat testing of air permeability integrated with thermal imaging survey and heat flux measurements of the building fabric elements, along with concurrent monitoring of indoor temperature during the pre-occupancy stage. Building fabric thermal performance gap was found to be prevalent across the three test dwellings despite being designed to high thermal standards. Wall and roof U-values were measured to be much higher than expected. Thermal imaging surveys revealed air leakage pathways around door/window openings, penetrations and junctions between walls and ceilings, indicating poor detailing and workmanship. AP was found to have increased after the initial test due to post-completion alteration to the building fabric. Calibration of the as-built energy models with temperature monitoring provided a less extreme energy performance gap than simply replacing the designed values with test results.
Findings suggest that repeat fabric testing should be encouraged to monitor any degradation of building fabric thermal performance over time. Utilising in situ testing data for calibrating energy models exposes the performance gap without the influence of occupancy-related factors. Indoor/outdoor temperature monitoring during as-built testing is a vital input for calibration. It was evident that using more detailed data for calibration of energy models reduced the projected energy performance gap. To make this mainstream, future revisions of UK Building Regulations should require in situ testing of building fabric thermal performance using a combination of tests (and not just air permeability tests), and submission of calibrated as-built energy models for compliance purposes to ensure designed performance targets are realised.

Author Contributions

Conceptualisation, R.G. with project partners; data curation, M.G.; formal analysis, M.G.; funding acquisition, R.G. with project partners; investigation, R.G. and M.G.; methodology, R.G. and M.G.; supervision, R.G. All authors have read and agreed to the published version of the manuscript.

Funding

This work has received funding from the European Union Horizon 2020 Programme in the framework of the “ZERO-PLUS project: Achieving near Zero and Positive Energy Settlements in Europe using Advanced Energy Technology”, under Grant Agreement No. 678407.

Data Availability Statement

The data presented in this study are not publicly available due to various ownership rights.

Acknowledgments

The authors would like to thank National and Kapodistrian University of Athens for coordinating the Horizon 2020 ZERO-PLUS project, BSRIA for performing air permeability tests, heat flux test, and thermography, as well as the Joseph Rowntree Housing Trust (developer).

Conflicts of Interest

The authors declare no conflict of interest. The funders had no role in the design of the study; in the collection, analyses, or interpretation of data; in the writing of the manuscript, or in the decision to publish the results.

References

  1. UK Council for Science and Technology. Achieving Net Zero Carbon Emissions Through a Whole Systems Approach. 2020. Available online: https://www.gov.uk/government/publications/achieving-net-zero-carbon-emissions-through-a-whole-systems-approach (accessed on 30 September 2020).
  2. Committee on Climate Change. Reaching Net Zero in the UK. UK Action on Climate Change. 2019. Available online: https://www.theccc.org.uk/uk-action-on-climate-change/reaching-net-zero-in-the-uk/ (accessed on 30 September 2020).
  3. Committee on Climate Change. The Sixth Carbon Budget: The UK’s Path to Net Zero; Committee on Climate Change: London, UK, 2020; p. 448. [Google Scholar]
  4. Committee on Climate Change. Reducing UK Emissions: 2020 Progress Report to Parliament; Committee on Climate Change: London, UK, 2020. [Google Scholar]
  5. Ministry of Housing Communities and Local Government. The Future Homes Standard. 2019. Available online: https://assets.publishing.service.gov.uk/government/uploads/system/uploads/attachment_data/file/843757/Future_Homes_Standard_Consultation_Oct_2019.pdf (accessed on 30 September 2020).
  6. Committee on Climate Change. UK Housing: Fit for the Future? Committee on Climate Change: London, UK, 2019; p. 134. [Google Scholar]
  7. Monahan, S.; Gemmell, A. How Occupants Behave and Interact with Their Homes. The Impact on Energy Use, Comfort, Control and Satisfaction. 2011. Available online: https://www.nhbcfoundation.org/publication/how-occupants-behave-interact-with-their-homes/ (accessed on 30 September 2020).
  8. Thompson, P.; Bootland, J. Technical Report Results from Phase 1: Post-Construction Testing of a Sample of Highly Sustainable New Homes; GHA Monitoring Programme 2009-11. 2011. Available online: https://goodhomes.org.uk/wp-content/uploads/2017/08/GHA-Monitoring-Report-APPROVED.pdf (accessed on 30 September 2020).
  9. Bordass, B.; Leaman, A. Making feedback and post-occupancy evaluation routine 1: A portfolio of feedback techniques. Build. Res. Inf. 2005, 33, 347–352. [Google Scholar] [CrossRef] [Green Version]
  10. Gaze, C. How did the Homes Perform? The Data. In Proceedings of the final AIMC4 conference: A Fabric First approach to achieving near Zero Carbon in 2016-Lessons from AIMC4, Watford, UK, 14 July 2014. [Google Scholar]
  11. Gaze, C. AIMC4. Lessons from AIMC4 for Cost-Effective Fabric-First Low-Energy Housing Part 5: As-Built Performance and Post Occupancy Evaluation. 2014. Available online: http://www.aimc4.com/filelibrary/files/AIMC4-Briefing-Paper5_final.pdf (accessed on 30 September 2020).
  12. Gill, Z.M.; Tierney, M.J.; Pegg, I.M.; Allan, N. Low-energy dwellings: The contribution of behaviours to actual performance. Build. Res. Inf. 2010, 38, 491–508. [Google Scholar] [CrossRef]
  13. Gupta, R.; Kapsali, M. How Effective are ‘close to zero’ Carbon New Dwellings in Reducing Actual Energy Demand: Insights from UK. In Proceedings of the 30th International PLEA Conference, Ahmedabad, India, 16–18 December 2014. [Google Scholar]
  14. Lowe, R.; Wingfield, J.; Bell, M.; Bell, J. Evidence for heat losses via party wall cavities in masonry construction. Build. Serv. Eng. Res. T. 2007, 28, 161–181. [Google Scholar] [CrossRef]
  15. Stevenson, F.; Leaman, A. Evaluating housing performance in relation to human behaviour: New challenges. Build. Res. Inf. 2010, 38, 437–441. [Google Scholar] [CrossRef] [Green Version]
  16. Stevenson, F.; Rijal, H.B. Developing occupancy feedback from a prototype to improve housing production. Build. Res. Inf. 2010, 38, 549–563. [Google Scholar] [CrossRef]
  17. Williamson, T.; Soebarto, V.; Radford, A. Comfort and energy use in five Australian award-winning houses: Regulated, measured and perceived. Build. Res. Inf. 2010, 38, 509–529. [Google Scholar] [CrossRef]
  18. Wingfield, J.; Bell, M.; Miles-Shenton, D.; Seavers, J. Elm Tree Mews Field Trial–Evaluation and Monitoring of Dwellings Performance (Final Technical Report). 2011. Available online: https://www.leedsbeckett.ac.uk/-/media/files/research/leeds-sustainability-institute/elm-tree-mews/lsi_elmtree_finalreport.pdf (accessed on 30 September 2020).
  19. Wingfield, J.; Bell, M.; Miles-Shenton, D.; South, T.; Lowe, R. Evaluating the Impact of an Enhanced Energy Performance Standard on Load-Bearing Masonry Domestic Construction: Understanding the Gap Between Designed and Real Performance: Lessons from Stamford Brook. 2011. Available online: http://eprints.leedsbeckett.ac.uk/id/eprint/889/ (accessed on 30 September 2020).
  20. Zero Carbon Hub. Closing the Gap Between Design and As-Built Performance. 2014. Available online: https://www.zerocarbonhub.org/sites/default/files/resources/reports/Design_vs_As_Built_Performance_Gap_End_of_Term_Report_0.pdf (accessed on 30 September 2020).
  21. Gupta, R.; Gregg, M.; Cherian, R. Tackling the performance gap between design intent and actual outcomes of new low/zero carbon housing. In Proceedings of the ECEEE Summer Study, Toulon, France, 3–8 June 2013. [Google Scholar]
  22. Baborska-Narożny, M.; Stevenson, F. Service controls interfaces in housing: Usability and engagement tool development. Build. Res. Inf. 2019, 47, 290–304. [Google Scholar] [CrossRef]
  23. Preiser, W.; Rabinowitz, H.; White, E. Post-Occupancy Evaluation; Van Nostrand Reinhold: New York, NY, USA, 1988. [Google Scholar]
  24. Preiser, W.; Vischer, J. (Eds.) The evolution of building performance evaluation: An introduction. In Assessing Building Performance; Routledge: London, UK, 2006; pp. 3–14. [Google Scholar]
  25. Whale, L. Thermal Bridging Guide—An Introduction to Thermal Bridging in Homes; Zero Carbon Hub: London, UK, 2016; p. 50. [Google Scholar]
  26. Energy Saving Trust. Enhanced Construction Details: Thermal Bridging and Airtightness. 2009. Available online: https://www.energysavingtrust.org.uk/sites/default/files/reports/CE302%20-%20ECD_thermal%20bridging%20and%20airtightness.pdf (accessed on 30 September 2020).
  27. Palmer, J.; Cooper, I. United Kingdom Housing Energy Fact File; DECC: London, UK, 2013; p. 171. Available online: https://assets.publishing.service.gov.uk/government/uploads/system/uploads/attachment_data/file/345141/uk_housing_fact_file_2013.pdf (accessed on 30 September 2020).
  28. TSB. Building Performance Evaluation Competition Brief. Technology Strategy Board. Available online: https://webarchive.nationalarchives.gov.uk/20130102174011/http://www.innovateuk.org/content/competition/building-performance-evaluation-.ashx (accessed on 5 December 2018).
  29. Seguro, F. Building Performance Evaluation Meta-Analysis: Insights from Social Housing Projects. National Energy Foundation: London, UK, 2015; p. 29. [Google Scholar]
  30. Palmer, J.; Godoy-Shimizu, D.; Tillson, A.; Mawditt, I. Building Performance Evaluation Programme: Findings from Domestic Projects Making Reality Match Design; Innovate: Swindon, UK, 2016. [Google Scholar]
  31. Oxford Brookes University; Four Walls. Avante Housing Development; Oxford Brookes University: Oxford, UK, 2011; Available online: https://www.usablebuildings.co.uk/UsableBuildings/Unprotected/BPEArchive/AvanteHousingDevelopment.pdf (accessed on 30 September 2020).
  32. Leeds Beckett University. Dormary Court; Leeds Beckett University: Leeds, UK, 2014. [Google Scholar]
  33. Leeds Beckett University. PassivHaus Bungalows; Leeds Beckett University: Leeds, UK, 2015. [Google Scholar]
  34. Gupta, R.; Kotopouleas, A. Magnitude and extent of building fabric thermal performance gap in UK low energy housing. Appl. Energ. 2018, 222, 673–686. [Google Scholar] [CrossRef]
  35. Cartwright, P.; Gaze, C. Lessons from AIMC4 for Cost-Effective, Fabric-First, Low-Energy Housing; Information Paper 9/13; HIS BRE Press: Watford, UK, 2010; Available online: https://www.hhcelcon.co.uk/sites/default/files/attachments/IP9-13-1.pdf (accessed on 30 September 2020).
  36. Littlewood, J.; Smallwood, I. Testing building fabric performance and the impacts upon occupant safety, energy use and carbon inefficiencies in dwellings. Energy Procedia 2015, 83, 454–463. [Google Scholar] [CrossRef] [Green Version]
  37. Bell, M.; Wingfield, J.; Miles-Shenton, D.; Seavers, J. Low Carbon Housing: Lessons from Elm Tree Mews; Leeds Beckett University: Leeds, UK, 2010; Available online: https://www.jrf.org.uk/report/low-carbon-housing-lessons-elm-tree-mews (accessed on 30 September 2020).
  38. Guerra-Santin, O.; Tweed, C.; Jenkins, H.; Jiang, S. Monitoring the performance of low energy dwellings: Two UK case studies. Energ. Build. 2013, 64, 32–40. [Google Scholar] [CrossRef]
  39. Iordache, V.; Teodosiu, C.; Teodosiu, R.; Catalina, T. Permeability measurements of a passive house during two construction stages. Energy Procedia 2016, 85, 279–287. [Google Scholar] [CrossRef] [Green Version]
  40. Wallace, L.; Emmerich, S.J.; Howard-Reed, C. Continuous measurements of air change rates in an occupied house for 1 year: The effect of temperature, wind, fans, and windows. J. Expo. Sci. Environ. Epidemiol. 2002, 12, 296–306. [Google Scholar] [CrossRef] [PubMed] [Green Version]
  41. Johnston, D.; Siddall, M. The building fabric thermal performance of Passivhaus dwellings—Does it do what it says on the tin? Sustainability 2016, 8, 97. [Google Scholar] [CrossRef] [Green Version]
  42. GHA. Community in a Cube Riverside One; Good Homes Alliance. 2014. Available online: https://goodhomes.org.uk/wp-content/uploads/2017/05/gha-case-study-ciac-full.pdf (accessed on 30 September 2020).
  43. Gupta, R.; Kapsali, M. Evaluating the ‘as-built’performance of an eco-housing development in the UK. Build. Serv. Eng. Res. T. 2016, 37, 220–242. [Google Scholar] [CrossRef]
  44. Eaton, C. Results from Phase 2: Post-Occupation Testing of a Sample of Sustainable New Homes. 2014. Available online: https://goodhomes.org.uk/wp-content/uploads/2017/08/01-GHA-Monitoring-Report-Phase-2-Summary-and-Recommendations.pdf (accessed on 30 September 2020).
  45. Johnston, D.; Farmer, D.; Brooke-Peat, M.; Miles-Shenton, D. Bridging the domestic building fabric performance gap. Build. Res. Inf. 2016, 44, 147–159. [Google Scholar] [CrossRef]
  46. Gupta, R.; Kapsali, M. Empirical assessment of indoor air quality and overheating in low-carbon social housing dwellings in England, UK. Adv. Build. Energy Res. 2016, 10, 46–68. [Google Scholar] [CrossRef]
  47. Johnston, D.; Miles-Shenton, D.; Farmer, D. Quantifying the domestic building fabric ‘performance gap’. Build. Serv. Eng. Res. T. 2015, 36, 614–627. [Google Scholar] [CrossRef]
  48. Gorse, C.A.; Glew, D.; Miles-Shenton, D.; Farmer, D.; Fletcher, M. Building Performance: Fabric, Impact and Implications. In Proceedings of the Sustainable Building 2013 (SB13) Hong Kong Regional Conference, Urban Density & Sustainability, Hong Kong, China, 12–13 September 2013. [Google Scholar]
  49. MHCLG. Conservation of Fuel and Power: Approved Document L.; Communities & Local Government Ministry of Housing: London, UK, 2018. Available online: https://www.gov.uk/government/publications/conservation-of-fuel-and-power-approved-document-l (accessed on 30 September 2020).
  50. Ward, T.I. Assessing the Effects of Thermal Bridging at Junctions and Around Openings; BRE IP1/06; Building Research Establishment: Watford, UK, 2006; Available online: https://www.thenbs.com/PublicationIndex/documents/details?Pub=BRE&DocID=277903 (accessed on 30 September 2020).
  51. Reilly, A.; Kinnane, O. The impact of thermal mass on building energy consumption. Appl. Energy 2017, 198, 108–121. [Google Scholar] [CrossRef] [Green Version]
  52. ASHRAE. ASHRAE Guideline 14-2014: Measurement of Energy, Demand, and Water Savings; ASHRAE: Atlanta, GA, USA, 2014. [Google Scholar]
  53. Van Buggenhout, S.; Van Brecht, A.; Özcan, S.E.; Vranken, E.; Van Malcot, W.; Berckmans, D. Influence of sampling positions on accuracy of tracer gas measurements in ventilated spaces. Biosyst. Eng. 2009, 104, 216–223. [Google Scholar] [CrossRef]
  54. Cui, S.; Cohen, M.; Stabat, P.; Marchio, D. CO2 tracer gas concentration decay method for measuring air change rate. Build. Environ. 2015, 84, 162–169. [Google Scholar] [CrossRef]
  55. Ross, J. Cavity Wall Insulation Inspection Report; Northern Ireland, South Eastern Regional College and North Ireland Housing Executive: Downpatrick, UK, 2014. Available online: https://www.nihe.gov.uk/getmedia/7138f205-c8fb-408b-974e-626ed394e472/cavity-wall-insulation-inspection-report.pdf.aspx?ext=.pdf (accessed on 30 September 2020).
  56. BTS. Build Test Solutions (BTS), Innovators in Building Performance Measurement. Available online: https://buildtestsolutions.com/ (accessed on 18 November 2020).
  57. Hukseflux. STPSYS05 System. Hukseflux. Available online: https://www.hukseflux.com/products/thermal-conductivity-sensors/thermal-conductivity-measuring-systems/stpsys05-system (accessed on 18 November 2020).
  58. Zimring, C.; Rashid, M.; Kampschroer, K. Facility Performance Evaluation. Available online: www.wbdg.org/resources/fpe.php# (accessed on 18 November 2020).
Figure 1. Street-facing facades of case study dwellings (a) ZP3 and (b) ZP2 on left and ZP1 on right.
Sustainability 13 02784 g001
Figure 2. Basic layout of model B3.
Sustainability 13 02784 g002
Figure 3. Basic layout of model C4.
Sustainability 13 02784 g003
Figure 4. ZP1 heat flux measurement location on stairway wall (a) with thermal image (b).
Sustainability 13 02784 g004aSustainability 13 02784 g004b
Figure 5. Technical specifications of the temperature sensor.
Sustainability 13 02784 g005
Figure 6. Example of thermal bypass during depressurisation in bedroom of ZP1, (a) thermal image, (b) photograph of thermal image location.
Sustainability 13 02784 g006
Figure 7. Ground floor WC of ZP1, (a) thermal image, (b) thermal image with isotherm.
Sustainability 13 02784 g007
Figure 8. Bulkhead within the WC of ZP1 during depressurisation, (a) thermal image, (b) photograph of thermal image location.
Sustainability 13 02784 g008
Figure 9. Rear door of ZP2 during depressurisation: (a) thermal image, (b) close up of air leakage on right.
Sustainability 13 02784 g009
Figure 10. Heat flux measurement on Bathroom ceiling of ZP2, (a) photograph, (b) thermal image.
Sustainability 13 02784 g010
Figure 11. Heat flux measurement data for ZP1.
Sustainability 13 02784 g011
Figure 12. Internal and external measured and simulated temperature data compared on 10 September 2019 in ZP2.
Sustainability 13 02784 g012
Table 2. Design and regulation fabric parameters [49].
ZP DesignUK Building Regulations
U-ValuesWall W/(m2·K)0.170.30
Roof W/(m2·K)0.160.20
Floor W/(m2·K)0.140.25
Party wall W/(m2·K)0.200.20
Windows W/(m2·K)1.332.00
Air permeability m3/(h·m2) @50pa4.010.0
Table 3. Characteristics of case study dwellings.
ZP1ZP2ZP3
Form2-story right side
semi-detached
2-story left side
semi-detached
2-story detached with adjacent
attached garage
Total floor area (m2)84.484.4129.6
Envelope area245.8245.8321.1
No. of bedrooms223
Occupied fromAugust 2019February 2019September 2019
Renewables14×—300 Wp PV panels14×—300 Wp PV panels14×—300 Wp PV panels
Battery13.5 kWh13.5 kWh13.5 kWh
Table 4. Characteristics of case study models.
ZP1ZP2ZP3
ConfigurationGround floor: entry hall with stairs at front, water closet (WC) in front, kitchen at back, living room full length of house along party wall. First floor: two bedrooms above living room, bathroom above kitchenGround floor: entry hall with stairs at front, WC in front, kitchen at back, living room full length of house. First floor: two bedrooms at back with bathroom in centre, bedroom in front to the right and study to the left
Living room occupancy patternMorning: 6:00–10:00 (with maximum presence at 7:00–9:00)/evening 18:00–23:00 (with maximum presence at 19:00–22:00)
Bedroom occupancy pattern22:00–9:00 (with maximum presence at 24:00–7:00)
Heating times and setpoints October 1–May 31; mornings 6:00–10:00 and evening 18:00–23:00; all rooms 19 °C with exception of living room 21 °C
Living room internal gainsTV, TV box, laptop, router, game system/DVD player, lighting
Kitchen internal gainsDishwasher, toaster, kettle, microwave, oven, hob, fridge, hot water gains, lighting
Bathroom internal gainsHot water gains, bathroom lighting
Wall construction
out–in)
102.5 mm brick, cavity, 100 mm insulation at 0.022 W/(m·K), 102.5 mm concrete block, 12 mm plasterboard
Roof construction
(out–in)
12 mm roofing tile, 12.5 mm sheathing, roof void, 130 mm insulation at 0.023 W/(m·K), 12 mm plasterboard (timber framed)
Floor construction
(out–in)
Ground, 100 mm gravel, 200 mm insulation at 0.035 W/(m·K), 100 mm concrete, 12 mm carpet
Table 5. M1 model changes.
Fabric Measurement Parameter
ZP1ZP2ZP3
External wall U-value W/(m2·K)0.650.650.84
Roof U-value W/(m2·K)0.410.410.41
Air permeability m3/(h·m2) @50pa5.395.447.53
Table 6. M2 model changes.
Fabric Measurement Parameter
ZP1ZP2ZP3
External wall U-value W/(m2·K)0.260.260.26
Roof U-value W/(m2·K)0.190.190.19
Air permeability m3/(h·m2) @50pa5.395.447.53
Table 7. Case study form and air permeability details.
Fabric Measurement Parameter
ZP1ZP2ZP3
Total floor area (TFA) (m2)84.484.4129.6
Design AP (m3/(h·m2) @50pa)4.04.04.0
Completion AP (m3/(h·m2) @50pa)3.943.972.77
Current AP (m3/(h·m2) @50pa)5.395.447.53
Table 8. Thermal transmittance results of heat flux measurements for each measurement location.
SpecificationMeasured Good AreaMeasured Poor AreaUnit
Wall ZP10.170.471.39W/(m2·K)
Wall ZP30.170.561.95W/(m2·K)
Roof ZP20.160.191.28W/(m2·K)
Table 9. Calibration results.
ZP1/ZP2 ZP3 Space Heating
As DesignedAs BuiltChangeAs DesignedAs BuiltChangeUnit
M125756107+137%449111,708+161%kWh
M23596+40%6824+52%kWh
Publisher’s Note: MDPI stays neutral with regard to jurisdictional claims in published maps and institutional affiliations.

