Abstract
Achieving urban water security requires sustaining the trade-offs between the exploitation of water/environmental resources and ecosystem services. This achievement not only reduces the pollution and contamination in the environment, level of water stress, but also secures good ambient water quality and future for people’s well-being and livelihoods. Changes in land use and land cover and growth of impervious structures can immediately generate severe ecological and social issues and increase the level of natural or manmade risks, affecting the condition of ecosystem services within and in the vicinity of an urban region. As a result of these transformations and further exploitation, due to the growing anthropogenic pressure, surface water and groundwater quality can be deteriorated compared to ambient water quality standards (for both chemical and biological pollutants). Based on land use and land cover (LULC) data retrieved from remote sensing interpretation, we computed the changes of the ecosystem service values (ESV) associated with the LULC dynamics, water quality and, finally, urban water security during the pre- and post-monsoon periods of 2009, 2014 and 2019 in Kolkata, an Asian deltaic megacity, and its peri-urban wetlands named East Kolkata Wetlands (EKW). The area under wetlands reduced comprehensively in 2009–2019 due to the conversion of wetlands into various other classes such as urban settlement, etc. The quality of surface water bodies (such as rivers, lakes, canals and inland wetlands) deteriorated. The groundwater quality is still under control, but the presence of arsenic, manganese and other metals are a clear indication of urban expansion and related activities in the area. As a result, there was a change in the ESV during this timeframe. In the pre-monsoon period, there was an increase in total ESV from US$53.14 million in 2009 to US$53.36 million and US$59.01 million in 2014 and 2019, respectively. In the post-monsoon period, the ESV decreased from US$67.42 million in 2009 to US$64.13 and US$61.89 million in 2014 and 2019, respectively. These changes can be attributed to the peri-urban wetlands and the benefits or services arising out of them that contribute more than 50% of the total ESV. This study found that the area under wetlands has reduced comprehensively in the past 10 years due to the conversion of wetlands for various other uses such as urban expansion of the Kolkata City, but still, this peri-urban wetland supports the urban water security by providing sufficient ecosystem services. In conclusion, the transformation in extent of the water-related ecosystem is a crucial indicator of urban water security, which also measures the quantity of water contained in various water-related ecosystems. Quantitative analysis of the LULC change, hence, is important for studying the corresponding impact on the ecosystem service value (ESV) and water quality that helps in decision-making in securing urban water future and ecosystem conservation.
1. Introduction
Water security is widely regarded as the key natural resource challenge facing humanity. The availability of water in the appropriate quantity (including avoiding scarcity and overabundance) with the appropriate quality and at the appropriate time for both human consumption and ecosystems is a basic requirement for sustainable development [1]. Water insecurity results in water poverty for both people and the environment, which is a multi-dimensional state of deprivation with lacking access to adequate water of safe quality as a key factor [2]. Ecosystems provide cultural, regulating and supporting services that contribute directly and indirectly to human well-being through recreation, scenic values and maintenance of fisheries [3]. Fresh water is a provisioning ecosystem service as it provides water for human use including domestic use, irrigation, power generation and transportation. Fresh water and the hydrological cycle also sustain inland water ecosystems, including rivers, lakes and wetlands. Provisioning of fresh water also plays a role in sustaining freshwater-dependent ecosystems such as mangroves, inter-tidal zones and estuaries, which provide another set of services to local communities and tourists alike [3].
Under continuous urban expansion and redevelopment, rural–urban linkages are transformed [4,5]. Changing ecosystem services (ES) are central to this transformation as they arise from the interaction of people and ecosystems and are most prominent in areas where the rural is increasingly influenced by the urban [6]. The ecosystem services generated by peri-urban ecosystems play a significant role in urban sustainability and resilience, spanning from food security to disaster risk management [7]. Urban and peri-urban wetlands provide ecosystem services seen and unseen to millions of people and to the environment on which we rely [7]. Especially wetlands provide vital water-related ecosystem services at different scales (e.g., clean water provision, wastewater treatment, groundwater replenishment, flood control), which are relevant for livelihood and well-being [8]. Thus, wetlands are crucial in maintaining the water cycle which, in turn, underpins all ecosystem services and therefore sustainable development and water security [8]. However, wetlands face serious risks as they are confronted by a range of threats such as urban development, pollution and agricultural use [9].
Ecosystem-based management is defined by the United Nations Convention on Biological Diversity (CBD) as a “strategy for the integrated management of land, water and living resources that promotes conservation and sustainable use in an equitable way” [10]. Ecosystem services (ES) research has gained momentum and the science and policy of valuing ES has experienced rapid growth since the Millennium Ecosystem Assessment [11]. The economic valuation of ES is becoming a regular practice in ecological economics to improve the basis for political and planning decisions and to establish more profound knowledge of the economic importance of ES. This includes the assessment of opportunity costs of land degradation or restoration as well as the assessment of developing policy tools and incentive mechanisms such as payments for ecosystem services (PES). However, monetary valuation of ES does not imply that they have exchange values and that all ES can be commodified or exchanged in the market as a substitute to other market commodities. Thus, the valuation is instead an estimate of the benefits of ES to the society expressed in units that work as a tool to help raise awareness on ES importance. Pahl-Wostl and Knüppe [12] argue that the ES concept may serve as a bridging concept to integrate various fragmented development trajectories and human water security without neglecting environmental water needs within a logical integrative framework.
Kolkata is the capital of West Bengal (one of the states of India) with a population of 4.5 million people, situated on the Ganga–Brahmaputra Delta. The climate of Kolkata is a tropical wet-and-dry climate (Aw according to Köppen climate classification system). The city experiences a hot pre-monsoon season from late March to mid-June followed by a monsoon period from mid-June till mid-September and lastly a slightly cooler dry season from mid-October until mid-March [13]. Since 1690, the approximate year when the British founded Kolkata, it has been expanding randomly without having a proper master plan. Besides, Kolkata is blessed ecologically because it has the mighty river Ganga flowing at the west, a huge groundwater reserve underneath and a wide wetland area adjacent to its eastern fringe which naturally treats city’s wastewater and transforms that suitable for fishery and agriculture [13,14,15]. Despite these advantages, at present, the city is increasingly running into water insecurity [13].
Thus, the main objectives of this study are to investigate the spatial and temporal land use and land cover (LULC) changes, their influence on different urban ecosystem services (UES) through an ES valuation approach and analyze the trade-offs between urban environmental water security (UEWS) and its peri-urban wetland area as an example for an Asian deltaic megacity—Kolkata, India.
Therefore, the overall aim of this article is to investigate the spatial and temporal LULC changes and their influence on different urban ecosystem services (UES) in Kolkata City’s UEWS. The following research questions shall be answered by the study:
- -
- To what extent have LULC and their impact on ecosystem services changed over time within Kolkata City and its urban and peri-urban wetland (named East Kolkata Wetlands, or EKW) areas during the pre- and post-monsoon seasons in the last decade (2009–2019)?
- -
- To what extent are the availability and quality of surface and groundwater impacted with the changes in LULC in the Kolkata Municipal Corporation area?
- -
- How do these changes ultimately affect spatial distribution of UEWS in Kolkata City?
2. Methods
2.1. Study Area
The total study area comprises 330 km2 and includes the Kolkata Municipal Corporation (205 km2) and the East Kolkata Wetlands (125 km2) (Figure 1). The Kolkata Municipal Corporation (KMC) currently has 144 wards (three of which were added in 2015). These wards are then clustered into 16 boroughs or administrative blocks [13]. The area is part of the lower deltaic plains of the Ganga–Bhagirathi river system with an elevation ranging between 3.5 and 6.0 m above mean sea level (amsl). The area is drained by the River Hugli, a distributary of the Ganga, running along its northwestern boundary and by several canals. Due to rapid urbanization of Kolkata, most of the marshy lands have been filled up and covered with buildings and the majority of the canals have been silted. The East Kolkata Wetlands area (EKW) is a peri-urban saltmarsh that has been used to receive city’s sewage since the late 17th century [14,15]. Subsequently, the EKW area was transformed by local people into an extensive land use mosaic of sewage-fed fish farms and agricultural lands about 100 years ago [14]. These wetlands serve for the biological treatment of raw sewage coming from the Kolkata Municipal Corporation and other adjacent areas [15]. East Kolkata Wetlands have been reported to support livelihoods of ~74% of the population of the peri-urban area [15,16]. Beyond that, the East Kolkata Wetlands act as an important habitat for various wildlife, especially birds [17]. Traditional pisciculture and cultivation techniques form the basis of ecological security in the region [15], providing multiple benefits, including food production, resource recovery, flood reduction, habitat and biodiversity restoration and opportunities for employment. Under the Ramsar Convention, in August 2002, the East Kolkata Wetlands were designated as a “wetland of international importance” [18]. Details on geology, geomorphology, surface water and groundwater hydrology and ecology are given in the publications by McArthur et al. [19], Sahu and Sikdar [20,21,22,23,24], Sahu et al. [25], Sikdar et al. [26,27], Sikdar [28,29], Sikdar and Dasgupta [30]. The research focuses on the KMC area, and the EKW stand for their support to contribute to ecosystem service valuations (ESVs).
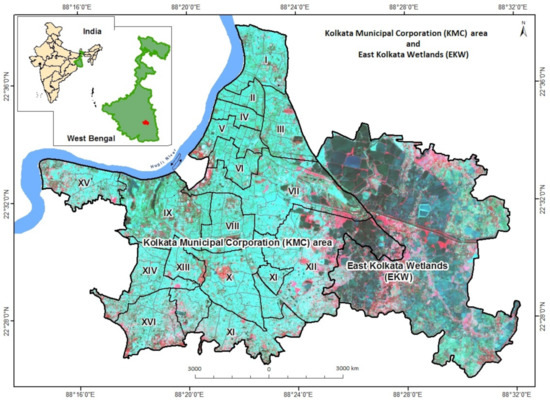
Figure 1.
Map showing Kolkata Municipal Corporation (KMC) boroughs (featuring the wards associated in a borough) and the East Kolkata Wetlands (EKW) area located outside the KMC area. Roman numerals mark borough numbers (source: Mukherjee et al. [13]).
2.2. Land Use and Land Cover Change between 2009 and 2019
Satellite images (Table 1) were analyzed to detect changes in the distribution of the major land use and land cover (LULC) classes between pre-monsoon (March–May) and post-monsoon (October–December) seasons of 2009, 2014 and 2019. In India, the dry winter season comes after the post-monsoon season (October–November) and is considered different from the pre-monsoon season (April–May) when the temperature is higher than 40 degrees Celsius. This study tries to focus on the pre-monsoon season specifically as we cannot use satellite images during the monsoon months (July–September). In order to avoid the yearly changes to show, we chose two distinct seasons of the year, i.e., pre- and post-monsoon seasons only.

Table 1.
Details of the satellite imagery used.
In the first step, a reference image was geometrically and radiometrically corrected; thereupon, the remaining images were co-registered to match the overlay with sub-pixel accuracy (RMS errors ≈ 0.21). For resampling, the nearest neighbor technique was applied for further classification to retain the original pixel values. The maximum likelihood-based supervised classification was performed to detect the LULC changes within the study area for 2009–2014, 2014–2019 and 2009–2019 during pre- and post-monsoon periods. Classification of LULC was performed on co-registered images applying the Arc GIS software (version 10.7) using the supervised (maximum likelihood) image classification technique (SICS). Five broad classes representing urban settlement, vegetated areas, lakes, inland wetlands, open spaces and agricultural lands were mapped (Table 2). It needs to be mentioned that there are two designated surface water bodies within the KMC area referred to as lakes [31,32,33]; correspondingly, we considered only the water-filled parts of them as lakes, while the other surface water bodies (except the River Hugli) were classified as inland wetlands supporting the presence of hydrophytes in them.
Table 2.
Land use and land cover (LULC) classes mapped for the Kolkata Municipal Corporation and East Kolkata Wetlands areas.
More than 50 spectral signatures were taken as representative signatures for each LULC type. Overall accuracy of the classification process was computed for the classified images for 2009, 2014 and 2019, respectively, based on representative reference points extracted from images provided by Google Earth. Ground truth data obtained from field surveys in 2008 and 2020 and the analyzed secondary data collected in 2008–2020 were compared with the classified satellite imagery.
The overall accuracies for the LULC classifications obtained are 89% (for pre-monsoon 2009), 90.1% (for pre-monsoon 2014), 93% (for pre-monsoon 2019), 88.4% (for post-monsoon 2009), 92% (for post-monsoon 2014) and 92.6% (for post-monsoon 2019). Finally, the data generated from the classified imagery were integrated into spreadsheets to calculate the changes in each class over the last decade.
2.3. Estimation of Value of Ecosystem Services and Changes in Value Due to LULC Changes
Global value coefficient (GVC) for 17 biomes was proposed by Costanza et al. [34] to estimate the status of ecosystem services globally. In this study, to quantify the ecosystem service value (ESV) for the six land use categories (urban settlement, agricultural lands, vegetation, lakes, inland wetlands and open spaces), the GVCs proposed by Costanza et al. [34] were used after suitably modified by Mamat et al. [35]. These modified values were used for this study. All estimated monetary values given in US$ are based on the 2018 valuation (Table 3). For our research, we used GVCs estimated by Mamat et al. [34] as an indicative value. Therefore, the most representative biomes are used as proxy for individual land use categories such as urban for urban settlement, rivers/lakes/ponds for inland wetlands, crop lands for agricultural or cultivated lands and forests for vegetation, respectively. Accurate evaluation of monetary values for both ecosystem services and land use and land cover depends upon many factors ranging from national/international polices, socioeconomic development criteria, inflation of the local currency to willingness to pay and the supply–demand mechanism of the local people. Therefore, accurate valuation of ES for a specific geographical context is difficult and, to a certain point, vague. Considering this issue, we used the already adjusted valuation based on the benefit transfer method used by Mamat et al. for their study area. The following equations were applied to quantify ESV:
where ESVk is the ecosystem service value (ESV) for individual land use categories, ESVt is the total ecosystem service value and ESVf is the individual ecosystem service function (Table 3), Ak is the area in hectares (ha) and GVCk is the global value coefficient (US$ ha−1year−1) for land use category k. GVCkf is the global value coefficient (US$ ha−1year−1) for land use category k and ecosystem service function type f [35] (Table 3).
ESVk = Ak × GVCk
ESVt = ΣAk × GVCk
ESVf = ΣAk × GVCkf
Table 3.
Biome equivalent and corresponding ecosystem service value (ESV) (in US$ ha−1year−1) estimation (modified from Mamat et al. [35]).
After estimation of total ecosystem service values (ESV), the average ecosystem service value (ESVavr) was computed applying the following equation:
where ESVavr is the average ecosystem service value (US$ ha−1year−1), ESVt is the total ecosystem service value (US$ ha−1year−1) for a certain study year and Ua is the total geographical area of the urban area (ha).
ESVavr = ESVt/Ua
2.4. Analysis of the Sensitivity Index (SI)
The biomes used in this study as proxies for individual land use and land cover (LULC) types do not perfectly match the biomes proposed by Costanza et al. [34,36]; in consequence, an uncertainty exists in computing the value coefficient. Therefore, it is necessary to conduct the sensitivity analysis to determine the changes (%) of the ecosystem service value upon the changes (%) of value coefficient. Using the concept of elasticity applied in economics, the coefficient of sensitivity (CS) was calculated as follows [37]:
where CS is the coefficient of sensitivity, ESV is the estimated ecosystem service value, GVC is the global value coefficient after Costanza et al. [34], i and j denote the initial and adjusted values, respectively, and k represents the land use category. In case CS > 1, the estimated ecosystem value is considered to be elastic (relatively high sensitivity) in response to the GVC and more attention needs to be paid to computing accurately the value coefficient. In case CS < 1, the estimated ecosystem service value is inelastic (relatively low sensitivity) with respect to the GVC and the resultant ecosystem service value is reliable [35].
CS = [(ESVj − ESVi)/ESVi]/[(VCjk − VCik)/VCik]
2.5. Water Quality Index
To calculate surface water quality index (WQI), seasonal data for ten years (2010–2019) were collected from thirteen stations of the West Bengal Pollution Control Board (WBPCB), Kolkata, India, including the River Hugli, Tolly’s Nullah (canal), four ponds and Rabindra Sarobar (lake) (Figure 2). To calculate the WQI, the Canadian Council of Ministers of the Environment (CCME) model [38,39] was used. The CCME WQI model consists of three measures of variance from selected water quality objectives: scope, frequency and amplitude [39]. The resulting CCME WQI values range between 0 and 100, representing the overall water quality. The CCME WQI values are then converted into rankings by applying the index categorization scheme (Table 4). The water quality variables with corresponding objectives (as per the existing Indian regulatory authorities) tested for the CCME WQI calculation are listed in Table 5.
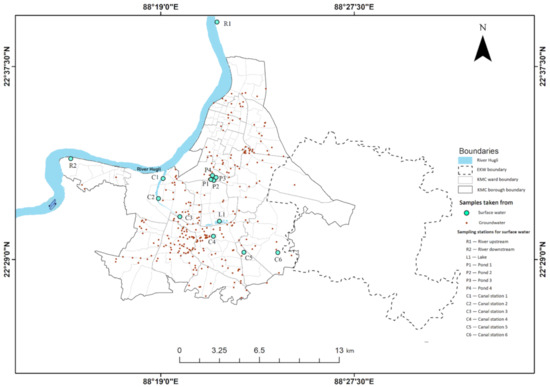
Figure 2.
The water sample collection sites (surface water and groundwater) in the Kolkata Municipal Corporation area (sources: McArthur et al. [19] and WBPCB [40]).
Table 4.
The Canadian Council of Ministers of the Environment (CCME) water quality index (WQI) categorization scheme CCME WQI (CCME, 2001) [39].
Table 5.
Parameters of water quality used and the standard for drinking water and bathing/recreational use of water [41,42].
2.6. Urban Environmental Water Security Index
The concept of water security advocates for providing safe drinking water while maintaining sustainable environment integrating efforts to meet the 2030 Agenda Sustainable Development Goals [1,2,13]. Quantitative metrics of water security of a megacity are needed for more comprehensive understanding of the dynamic environmental characteristics of its neighborhoods, which otherwise remain obscured [13]. In this research paper, we are proposing an index linking land use and land cover changes, values of ecosystem services and quality of the supplied water together for clear understanding of the collective results of all the variables considered for the index. The final scores of this index can be used as an indicative tool with greater clarity and usability for further research and planning purposes.
The urban environmental water security index (UEWSI) was calculated on the basis of intensity indices [43,44,45,46] which explain the degree of change in average ecosystem service value (ESV) in each borough (an administrative block comprising several lowest administrative units called wards) of the Kolkata Municipal Corporation and East Kolkata Wetlands for the given period of time.
The temporal and spatial variation of the UEWSI was prepared using the following equations:
Pre-monsoon ecosystem service valuation index:
Post-monsoon ecosystem service valuation index:
Pre-monsoon LULC intensity index:
Post-monsoon LULC intensity index:
Urban environmental water security index:
where ΔESprmx and ΔESpomx denote the change of the borough-wise average ESV in US$ between 2009–2019 during pre-monsoon or post-monsoon seasons; x is an individual borough of the KMC; ΔC1 and ΔC2 are the change in area (ha) for all LULC classes over the total study period during pre- and post-monsoon seasons, respectively; AT is the total area (ha) of the borough; and Δt is the time (year) span of the total study period.
Weightage for supplied water quality index (SuplWQIx) is a value assigned to the tested supplied water (or main source of drinking water) category in the Canadian Council of Ministers of the Environment (CCME) water quality index (WQI) scheme (Table 4) for each borough (example: 1 for poor, 2 for marginal, 3 for fair, 4 for good and 5 for excellent) where the supplied water is considered the main source of water for drinking purposes.
Normalization of UEWSI values (−1 to 1) allowed assessing inter-borough variability in environmental water security displayed in a map using ArcGIS 10.6 (ESRI, Redland, CA, USA).
3. Results
3.1. Land Use and Land Cover Changes
The spatial distribution of land use and land cover (LULC) in the Kolkata Municipal Corporation (KMC) and East Kolkata Wetlands is outlined seasonally for the years 2009, 2014 and 2019 (Figure 3). Urban settlement dominates the urban area of the Kolkata Municipal Corporation, while in the East Kolkata Wetlands, agricultural land is the dominant LULC class. The occurrence of areas under vegetation varies both seasonally and spatially. It is evident that in boroughs VII and XII, vegetation cover is higher than in the other boroughs of the KMC. In boroughs I–VI, urban settlement dominate the LULC classes during the total study period. The distribution of inland wetlands was all over the study period higher in areas of the East Kolkata Wetlands than in the KMC area. Only in boroughs IX and XII, significant area coverage by inland wetlands can be observed. The areas covered by inland wetlands also varied seasonally in distribution, i.e., during post-monsoon periods, the area covered by inland wetlands was generally higher than during the pre-monsoon periods. This seasonal variation of the distribution of inland wetland areas between pre- and post-monsoon periods is clearly evident for borough IV for the years 2009 and 2014. In contrast, in 2019, the area covered by inland wetlands diminished in the pre-monsoon season and completely disappeared during the post-monsoon season. These strong seasonal variations in the distribution of inland wetlands affected the distribution of the other LULC classes, particularly the areas under open spaces which varied inversely to the inland wetlands between 0.4% in the pre-monsoon period of 2009 to 0.15% in the post-monsoon period of 2019 (Table 6). Within the entire study area, open spaces are rare and could be observed in small portions for boroughs V, VI and VII; however, in the post-monsoon 2014 image for borough V, open spaces are lacking. The area of lakes did not change during the entire study period as these areas within boroughs III and VIII are areas designated by the municipal authorities.
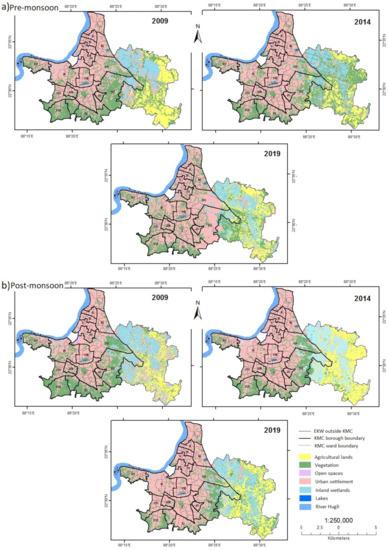
Figure 3.
Distribution of land use and land cover (LULC) classes in 2009, 2014 and 2019 featuring the wards and boroughs of the Kolkata Municipal Corporation (KMC) differentiated by the (a) pre-monsoon and (b) post-monsoon seasons. Black outlines within the KMC are borough boundaries, the light grey outlines within each borough are ward boundaries, Roman numerals mark borough numbers based on satellite image interpretation from Landsat series, United States Geological Survey (USGS).
Table 6.
Distribution of land use and land cover (LULC) by class area extent (km2) and percentage (%) of the study area during pre-monsoon and post-monsoon seasons of 2009, 2014 and 2019 based on satellite image interpretation from Landsat series (USGS).
The spatiotemporal variations of each LULC class were examined in terms of total study area (which includes both the KMC and EKW areas) and percentage for each study period (Table 6). The results indicate that the spatial proportion of each LULC class varied between the seasons and throughout the whole observation period (2009–2019). In 2009, the urban settlement class was the dominant LULC class in the KMC area, covering more than 44% of both the KMC and EKW areas altogether, followed by vegetation-covered areas, agricultural lands and inland wetlands. Lakes and open spaces covered only small shares of the total study area. In 2014, urban settlement remained the dominant LULC class followed by vegetation-covered areas; however, the spatial distribution of agricultural lands and inland wetlands increased substantially during the post-monsoon season at the expense of areas under vegetation (33.95% during the pre-monsoon period of 2014 and 20.47% during the post-monsoon period of the same year). Furthermore, in 2019, the areas under urban settlement were the dominating LULC class in the study area, again, followed by vegetation-covered areas. The shares of areas used as agricultural lands or covered by inland wetlands remained almost the same as in 2014. In 2019, the amount of area under open spaces significantly decreased compared to 2009 and 2014; in contrast, between 2009 and 2019, the area covered by lakes slightly increased in the post-monsoon period compared to that of the pre-monsoon period.
The LULC changes were differentiated into three major observation periods: 2009–2014 (first period), 2014–2019 (second period) and 2009–2019 (total period) with separate examination of seasons (pre- and post-monsoon seasons) (Figure 4). Change detection analysis showed that during the first observation period, the area of urban settlement increased by 2.62% and 3.85% in the pre-monsoon and post-monsoon seasons, respectively. In the second observation period, the area of urban settlement again increased by 2.95% in the pre-monsoon season and by 2.44% in the post-monsoon season. During the total observation period, the area under urban settlement increased by 5.65% in the pre-monsoon period and by 6.38% in the post-monsoon period. In the case of agricultural lands, during the post-monsoon seasons of 2009–2014, a relative increase of 55.06% was observed, as well as a relative increase of 39.33% was observed for the total observation period 2009–2019. Areas of open spaces overall declined in distribution during both types of seasons of the total observation period (2009–2019). Nevertheless, in the pre-monsoon seasons between 2014 and 2019, the areas under open spaces grew by 22.48%, which is, however, only 0.17 km2 in total. The areas under inland wetlands increased by more than 30% during the pre-monsoon seasons of the second and total periods. In contrast, during the post-monsoon seasons of all periods, a continuous decrease in inland wetlands was witnessed. Analyzing the distribution of lakes (the water-filled parts) in the pre-monsoon seasons, between 2009 and 2014, a decrease of 11.93% occurred, whereas between 2014 and 2019, it did grow by 10.67%. During the total observation period of 2009–2019, the lake area grew by 14.38% in the post-monsoon seasons, while in the pre-monsoon seasons, a decrease of 2.53% could be observed.
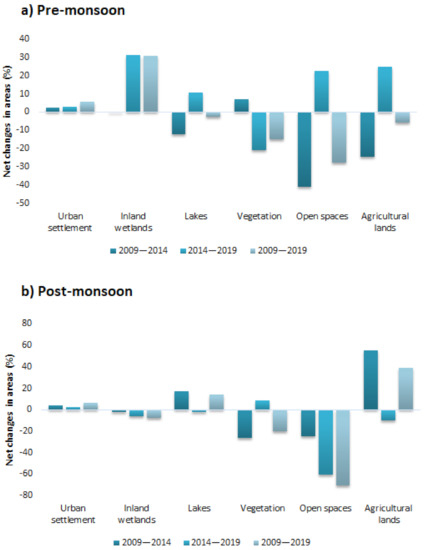
Figure 4.
Relative net changes (%) of different land use and land cover (LULC) classes in the areas of the Kolkata Municipal Corporation and East Kolkata Wetlands during (a) pre-monsoon and (b) post-monsoon seasons of the observation periods 2009–2014, 2014–2019 and 2009–2019 based on satellite image interpretation from Landsat series (USGS).
3.2. Estimation of the Ecosystem Services Value
3.2.1. Categories of Ecosystem Services
The individual ecosystem service values (ESV) of four categories of ecosystem services (ES)—regulating, supporting, provisioning and cultural—in each borough of the Kolkata Municipal Corporation and East Kolkata Wetlands are compiled in the Supplementary Materials. The ESV for regulating services has the highest contribution, whereas cultural ecosystem services have the lowest contribution (Figure 5). The ESV for regulating services for the pre-monsoon period increased from US$26.4 million in 2009 to US$31.4 million in 2019, but in the post-monsoon period, these ESVs decreased from US$33.7 million in 2009 to US$31.4 million in 2019. Cultural ecosystem services contributed a little more than US$1 million corresponding to only 2% of the net contribution to the values for ecosystem services during the post-monsoon season in 2019. The net contributions to ESVs of all four categories of ecosystem services are highest in the East Kolkata Wetlands, where they amount to more than 27% of the net ESV during the entire observation period of 2009–2019 (see the Supplementary Materials). Within the Kolkata Municipal Corporation (KMC), borough XII provides the highest contribution (16.08%) to its ESV compared to the rest of the boroughs; this applies to all the four categories of ecosystem services, i.e., regulating, supporting, provisioning and cultural services, during the entire 2009–2019 period.
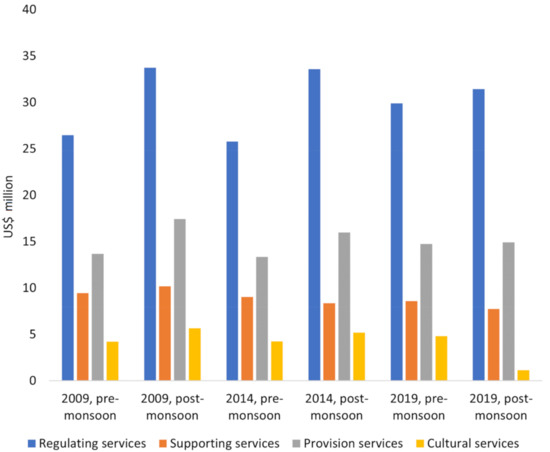
Figure 5.
Individual ecosystem service values (in US$ million) in 2009, 2014 and 2019 differentiated by pre-monsoon and post-monsoon periods in the Kolkata Municipal Corporation boroughs and East Kolkata Wetlands areas (outside the Kolkata Municipal Corporation area) based on satellite image interpretation from Landsat series (USGS) and Mamat et al. [35].
3.2.2. Land Use and Land Cover (LULC)
The effects of changing land use and land cover (LULC) (Table 6) on the ecosystem services and their contribution to the total ecosystem service values (ESV) (Table 7) within the areas of the Kolkata Municipal Corporation and East Kolkata Wetlands were calculated using the ecosystem service value coefficients (Table 3). The data show that the ESV is mainly controlled by the distribution of inland wetlands followed by the areas covered by vegetation (excluding agricultural lands). Inland wetlands contributed more than 50% of the total ESV throughout the entire study period, whereas contribution of the areas covered by vegetation (excluding agricultural lands) varied between 19 and 40% for the whole observation period (2009–2019). Comparison of LULC distribution between base year 2009 and 2019 (Table 7) shows that contribution of inland wetland areas on the ESV increased during both pre-monsoon and post-monsoon periods. The contribution to the ESV of the areas covered by vegetation (not cultivated) during the pre-monsoon periods increased during the pre-monsoon periods between 2009 and 2014 and then decreased between 2014 and 2019. In contrast, in the post-monsoon periods, the contribution of the areas covered by vegetation to the ESV decreased between 2009 and 2014, but thereafter it increased (Table 7). The contribution of agricultural lands to the ESV was less than 9% throughout the whole observation period, whereas the contribution of urban settlement areas, lakes and open spaces considered together accounted for less than 1% (Table 7).
Table 7.
Ecosystem service values in US$ and % of land use land cover (LULC) classes in the study area during 2009, 2014 and 2019 differentiated by pre-monsoon and post-monsoon periods based on satellite image interpretation from Landsat series (USGS) and Mamat et al. [35].
3.2.3. Seasons
The season-wise changes in ecosystem service values (ESV) between 2009 and 2019 differentiated by each land use and land cover (LULC) class are compiled in Table 8 (in US$) and displayed in Figure 6 (in %). Inland wetlands showed significant growth in the ESV for all three time periods during the pre-monsoon seasons, while they shrank during the post-monsoon periods. The areas covered by vegetation (without cultivation) show a decline in contributing to the ESV between 2009 and 2019 for both the pre-monsoon and the post-monsoon periods. The maximum yearly increase in the ESV was observed in the case of the areas under agricultural lands (11.1%) during the post-monsoon seasons between 2009 and 2014. The maximum yearly decrease in the ESV was evident for the areas under open spaces which was −14.03% during the post-monsoon seasons during 2009–2019 (Figure 6).
Table 8.
Season-wise changes in ecosystem service values (in US$) during pre-monsoon and post-monsoon seasons of 2009–2014, 2014–2019 and 2009–2019 for the Kolkata Municipal Corporation and East Kolkata Wetlands differentiated for different land use and land cover classes based on satellite image interpretation from Landsat series (USGS) and Mamat et al. [35].
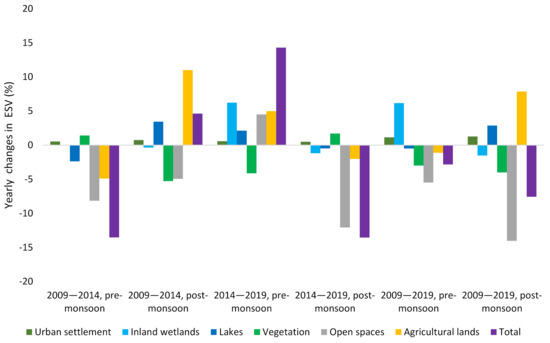
Figure 6.
Season-wise changes in ecosystem service values (in %) obtained from different land use and land cover (LULC) classes in the Kolkata Municipal Corporation and East Kolkata Wetland areas during pre-monsoon and post-monsoon seasons of 2009–2014, 2014–2019 and 2009–2019 based on satellite image interpretation from Landsat series (USGS) and Mamat et al. [35].
Figure 7 displays season-wise changes in the ESV (in %) from individual ES. Among all individual ES, the maximum yearly decrease in the ESV was observed for the cultural ES (−15.62%) during the post-monsoon seasons between 2014 and 2019, while the maximum increase in the yearly ESV was observed in the case of regulating ES (3.18%) during the post-monsoon seasons between 2014 and 2019 (Figure 7). During the post-monsoon seasons of the total observation period, the decline in yearly relative changes in the ESV for all the individual ES was observed. Among them, cultural ES shrank the most (−7.99%), whereas regulating ES decreased only by 0.69%. In the pre-monsoon periods of the total observation period, only supporting ES had a negative yearly change (−0.092%) in the ESV.
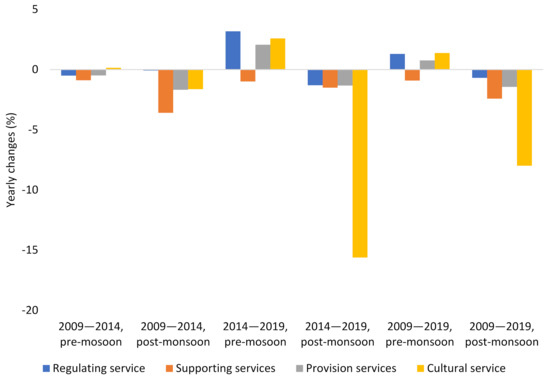
Figure 7.
Relative yearly changes in individual ecosystem service values (in %) during pre- and post-monsoon seasons in 2009–2014, 2014–2019 and 2009–2019 in the Kolkata Municipal Corporation and East Kolkata Wetlands based on satellite image interpretation from Landsat series (USGS) and Mamat et al. [35].
3.2.4. Total ESV Calculation
According to the estimation, the total ecosystem service value (ESV) in the areas of the Kolkata Municipal Corporation and East Kolkata Wetlands was about US$53.14 million during the 2009 pre-monsoon season. The ESV remained almost similar in the pre-monsoon period of 2014 (US$53.36 million) and increased slightly in 2019 (US$59 million) (Figure 8). In contrast, during the post-monsoon seasons of the total observation period (2009–2019), a decrease in the total ESV could be observed.
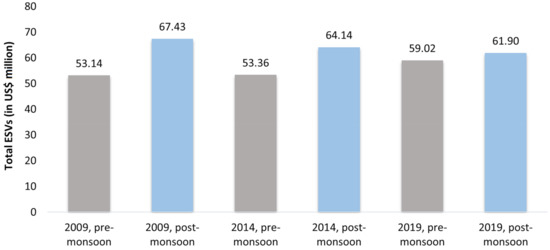
Figure 8.
Values of total ecosystem services (ESV in US$ million) in the total study area including the Kolkata Municipal Corporation and East Kolkata Wetlands during the pre-monsoon and post-monsoon periods of 2009, 2014 and 2019 based on satellite image interpretation from Landsat series (USGS) and Mamat et al. [35].
The borough-wise average ecosystem service values (ESV) between 2009 and 2019 of the Kolkata Municipal Corporation and East Kolkata Wetlands are shown in Figure 9. The major contributions to the ESV come from the East Kolkata Wetland area (EKW). Within the KMC, boroughs VII and XII (Figure 2) contributed the most to the ESV, whereas boroughs II and IV (Figure 2) contributed the least. In general, the southern parts (boroughs VII–XVI) of the Kolkata Municipal Corporation area contributed more to the ESV compared to the northern parts (boroughs I–VI) of the city. The East Kolkata Wetlands contributed almost a quarter of the total ESV with an increase during the total observation period.
Figure 9.
Borough-wise average ecosystem service values (ESV) in US$ million. Roman numerals mark borough numbers based on satellite image interpretation from Landsat series (USGS) and Mamat et al. [34].
3.3. Analysis of the Sensitivity Index (SI)
The sensitivity of ecosystem service values (ESV) to changes in value coefficients (with 50% adjustment) is <1 and often close to 0. Therefore, the ESVs are inelastic and the estimated ESVs calculated for the 10 years of the study period 2009–2019 for the Kolkata Municipal Corporation and East Kolkata Wetlands are reliable.
3.4. Water Quality Index
The overall WQI scores for surface water contemplated season-wise and year-wise were within the “poor” category when the Canadian Council of Ministers of the Environment (CCME) water quality index (WQI) classification scheme was applied (Figure 10). The water quality scores of groundwater in the Kolkata Municipal Corporation boroughs were assessed as “good”, and in boroughs VIII, XII and XIV even as “excellent” (Table 4; Figure 11). Between 2015 and 2017, slight seasonal effects in groundwater quality could be observed: the samples collected during post-monsoon periods showed higher water quality index (WQI) scores than the samples collected in either monsoon or pre-monsoon periods.
Figure 10.
Surface water quality index (WQI) scores between 2011–2019 (a) season-wise and (b) yearly for selected stations of the Kolkata Municipal Corporation and East Kolkata Wetlands. The locations of surface water sample stations are given in Figure 2 (data source: West Bengal Pollution Control Board, Kolkata, India [40]).
Figure 11.
Distribution of water quality index scores of the groundwater sampled between 2015 and 2017 within the Kolkata Municipal Corporation boroughs. Roman numerals mark the different boroughs (data source: McArthur et al. [19]).
3.5. Comprehensive Urban Environmental Water Security Index
The calculation of the comprehensive urban environmental water security index (UEWSI) indicated that the East Kolkata Wetlands showed the highest UEWSI value (Figure 12 and Figure 13). Within the Kolkata Municipal Corporation, boroughs VII and XII, which are also part of the greater East Kolkata Wetland area, showed distinctly higher UEWSI values than the other boroughs. Beyond that, the boroughs located in the southern part of the city showed higher UEWSI values than those in the northern part, where some boroughs even showed negative UEWSI values.
Figure 12.
Distribution of urban environmental water security index (UEWSI) scores in the Kolkata Municipal Corporation and East Kolkata Wetlands (calculation based on satellite observation of land use and land cover changes between 2009 and 2019). Roman numerals mark the borough numbers (data source: satellite image interpretation from Landsat series (USGS)).
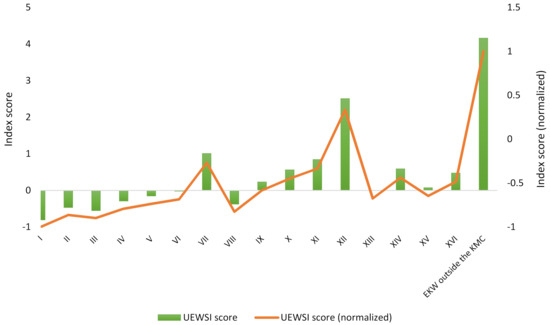
Figure 13.
Distribution of urban environmental water security index (UEWSI) scores and normalized urban environmental water security index scores (calculation based on observations within 2009–2019) within the Kolkata Municipal Corporation boroughs and East Kolkata Wetland areas. Roman numerals mark the borough numbers (data source: satellite image interpretation from Landsat series (USGS)).
4. Discussion
4.1. Effects of Changes in Ecosystem Services on Urban Water Security over the Last Decade
Ecosystems are impacted when they are utilized to meet human needs (e.g., water supply, food production) [8]. The concern is whether an ecosystem is able to provide such services in a sustainable manner as countries and communities continue to grow, adding to an increase in human impact [8]. Ecosystem services (ES) reflect the benefits that humans obtain from ecosystems. These services are both direct and indirect in nature, some easily recognizable and others subtler. Human well-being fundamentally depends upon these ecosystem services. Changes in ecosystem services can affect the humanity with negative impacts on resource security, health and well-being and the maintenance of social and cultural relations [47].
4.1.1. Effect of Changes in Values of Individual Ecosystem Services on Urban Water Security
Regulating ES: In the Kolkata Municipal Corporation and East Kolkata Wetlands, regulating ecosystem services (ES) which control the effects of natural events such as floods are the most prominent (Figure 5). Regulating ES are responsible for stability and resilience of the flow of other ES [48]. Decrease in regulating ES which was observed in the Kolkata Municipal Corporation area during the post-monsoon seasons of the total observation period (2009–2019) (Figure 7) can be linked with the loss of vegetation and inland wetlands in the city area (Figure 6 and Table 8) [45,46,47]. The reduction in values of regulating ES leads to the increase in volumes of surface water runoff and thus increases the vulnerability to water flooding [8,47].
Provisioning ES: Provisioning ES generally coincide with regulating ecosystem services’ function areas [49]. Therefore, benefits from a better provisioning ES are defined on-site by the producing ecosystem, such as waterbodies for fish production [49]. According to Ravetz et al. [50], season of the year and temperature influence provisioning ES, as low water level can increase pollutant concentrations in waterbodies. Beyond that, increased temperatures as occurring in the pre-monsoon season boost agricultural production; however, irrigation is required. In the study area, provisioning ES follow the regulating ES. The fluctuations in provisioning ES during the post-monsoon period and sudden increase in the pre-monsoon period of 2019 in the East Kolkata Wetlands (Figure 5 and Figure 7) can be linked to economic activities dependent on the varying monsoonal rainfall [47,50,51].
Supporting ES: Values of supporting ES declined in the Kolkata Municipal Corporation and East Kolkata Wetland areas during the last decade (2009–2019) (Figure 7). This resulted in a decrease of total ES due to the impact of human activities and infrastructure. Human activities include increased urban impervious surface due to construction of buildings which results in hydrologic alteration manifested by (i) increased surface runoff causing flood risk, (ii) reduced evapotranspiration and (iii) decreased shallow and deep groundwater infiltration [52]. Other impacts include input of pollutants such as sediments, heavy metals, etc. [52,53]. This observation also confirms the continuous fragmentation of natural landscapes through urbanization processes due to, for example, transportation and infrastructure projects in the wetland areas, land grabbing due to construction of urban buildings, leisure activity areas such as parks and indoor swimming pools or agriculture [54,55]. Supporting ES, acting as intermediate services [49], can be regarded as the underlying ecological structures, processes and functions essential [50] for producing all other ES [49,52,56]. As a consequence, the decline of supporting ES has a direct negative impact on biodiversity [50].
Cultural ES: Further, decreased values of cultural ES in the study area document a reduction in the supply of cultural ES, such as recreation and augmented social cohesion [57]. Further, as cultural ES are directly experienced and appreciated by people through ecosystems, thus, unlike other services, cultural ES cannot be replaced if degraded [58]. This problem is especially crucial within the Kolkata Municipal Corporation and East Kolkata Wetlands because of high population density and constant pressure on the trade-offs between natural ecosystems and people [57].
4.1.2. Effect of Land Use and Land Cover (LULC) Changes on Ecosystem Services
Ecosystem dynamics are influenced by land use and land cover (LULC), especially in the ecological functions that reflect into values of ecosystem services (ESV) (Figure 6, Table 7 and Table 8) [59,60]. Urbanization has been globally the main cause of LULC change, often coinciding with irreparable consequences to the urban ecosystem services (ES) [61].
Urban settlement: The results of LULC changes (Figure 3) show that the areal change of urban settlement expansion is not dominant in the Kolkata Municipal Corporation and East Kolkata Wetland areas. Our results show slight seasonal variations in the area under urban settlement. This may be attributed to the mixed pixel problem which is a constraint on estimation of seasonal changes in urban settlement due to the complexity associated with Landsat image interpretation for a megacity like Kolkata [62]. Expansion of settlement areas affected other LULC classes, especially the vegetation-covered areas and open spaces. In consequence, the pressure on the water security of Kolkata City is predominantly driven by vertical urbanization [63]. However, vertical city growth is difficult to detect applying two-dimensional remote sensing approaches as used in this study.
Vegetation: Areas under vegetation (excluding agricultural lands) decreased significantly during the total observation period between 2009 and 2019 contributing considerably to the total ESV. Urban vegetation (excluding the agricultural lands) constitutes the urban green spaces and regulates microclimate [64], which provides monetary benefits by lowering consumption of the energy sourced mainly from the fossil fuels for air conditioning [65,66,67]. Further, urban green spaces play an important role in regulating rainwater interception by trees, lowering pressure on the drainage system and flood risks [68] and reducing pollution to improve air quality [69,70] indirectly improving public health [71,72]. Therefore, a substantial decrease in urban vegetation negatively directly impacts these monetary benefits as well as non-monetary benefits, such as greater social cohesion and trust, human well-being, sharpened sense of place and sense of identity [73,74,75].
Agricultural lands: Agricultural lands also provide benefits such as regulation of soil and water quality, carbon sequestration, support for biodiversity and non-monetary benefits such as cultural services along with food production as the most important monetary service [76]. The Kolkata Municipal Corporation area does not have enough space for agricultural lands. Therefore, all the benefits for agricultural lands to Kolkata City come substantially from the East Kolkata Wetland area. The decrease in the area under agricultural lands, therefore, has a direct negative effect on Kolkata City from the perspective of the ESV, as well as of job and food security [76,77,78]. At the same time, a substantial increase in agricultural lands (as we observed during pre-monsoon seasons of the 2014–2019 period) at the expense of inland wetlands can be blamed for raising water insecurity of Kolkata City [13,14,78].
Lakes: Within the Kolkata Municipal Corporation and East Kolkata Wetland areas, designated areas for lakes between 2009 and 2019 did not change, but a significant seasonal variation was noticed for water-filled parts of these lakes during the observed period. Moreover, the decreased amount of vegetation in boroughs III and VIII could be linked with the deteriorating water quality of the lake in borough VIII (Figure 1) [31,32,40].
Open spaces: The most unfavorably affected land cover class in the Kolkata Municipal Corporation and East Kolkata Wetland areas is the open spaces which constitute a key element in the provisioning ecosystem services of urban environments from the esthetic and cultural benefits perspective (cultural ecosystem services). Open spaces as regulating ecosystem services also have a strong effect on the urban heat balance [79].
Inland wetlands: Inland wetlands support the basal objectives of water security by ensuring both water availability and quality of water [80]. In consequence, they maintain a key role for increasing water security [81,82]. Inland wetlands provide a range of different ecosystem services [80]. They provide regulating ecosystem services by controlling floods, cleaning the city’s sewage, protecting and mitigating impacts from storm events [81]. Located in one of the most cyclone-prone zones in the world, the East Kolkata Wetlands are extremely important for the existence of Kolkata City [14,15,20]. These wetlands also help in sediment, nutrient retention and export [20,21,27]. Undoubtedly, such wetlands act as reservoirs of biodiversity through providing supporting ecosystem services [60]. Inland wetlands play a role in supplying provisional ecosystem services by purifying wastewater and producing goods through agricultural activities [27,80,81]. We must not forget the cultural values these wetlands offer through recreational, touristic and social cohesion activities providing cultural ecosystem services [57,58,60]. Moreover, inland wetlands are invaluable to support climate change mitigation and adaptation providing a natural infrastructure that meets the policy objectives for a water-secured city [35,80,81]. The major benefits of ecosystem services for Kolkata City are obtained from the East Kolkata Wetlands and borough XII of the KMC which is adjacent to the East Kolkata Wetlands. Therefore, to maintain regional water security, inland wetlands within the KMC area and the East Kolkata Wetlands are the key elements for Kolkata City [83]. At the same time, a continuous decrease in the inland wetlands of the East Kolkata Wetlands may lead to the loss of status of a Ramsar site in the near future [78].
4.2. Availability and Quality of Surface and Groundwater in Relation to Land Use and Land Cover Changes
The results of water quality analysis of surface water imply that the quality is almost undesirable for the intended use. The major drinking water supply in the Kolkata Municipal Corporation area depends on the treated surface water of the River Hugli. A big portion, particularly in the added areas in the southern parts of the Kolkata Municipal Corporation area, are deprived of this water supply. Drinking water supply in these deprived areas depends on groundwater [84]. Therefore, availability, physical accessibility and quality of groundwater are also important issues for the Kolkata Municipal Corporation area’s water security [13,84]. Groundwater extraction by tube wells immediately beneath the settled area is still a common practice, especially in slum households and condominiums around the periphery of the city [13]. According to the Kolkata Municipal Corporation 2015 report [85], Kolkata City (the entire Kolkata Municipal Corporation area) officially counted about 12,000 hand-pumped tube wells, predominantly found in slums [85,86]. The groundwater in the Kolkata Municipal Corporation area faces high levels of manganese (Mn > 0.3 mg/L−1) and iron content (Fe; up to 23 mg/L−1) which can induce serious ailments [19,86]. In general, increased solute concentrations in the groundwater are related to industrial activities, sewage effluent and unregulated groundwater extraction [19,87,88,89]. Further analysis for arsenic (As) in the groundwater samples from across the Kolkata Municipal Corporation area failed to meet the permissible limit set by the Bureau of Indian Standards (BIS-2012) [41] due to As concentrations > 10 μg/L−1 in few samples [19]. The As present in the groundwater of Kolkata is anthropogenic in origin, unlike in other areas of the Bengal Basin where it is geogenic in origin [19].
Unregulated groundwater withdrawal has resulted in the development of local groundwater mounds and troughs in and around the East Kolkata Wetlands where the regional topography is otherwise flat. The water quality of that area is dependent on these groundwater mounds and troughs that affect the groundwater flow pattern and distribution [19]. About 800 million liters of wastewater purged daily from Kolkata are naturally treated through these wetlands [20]. Leaching of pollutants from this wastewater of the city containing a mixture of domestic and industrial effluent loaded with high amounts of heavy metals is accelerated due to growing overwithdrawal of groundwater for domestic, irrigation, industrial and commercial needs. This exposes the aquifer below the East Kolkata Wetlands to contamination and affects water quality of the wetland aquifer [20,22] from where groundwater is extracted in large volumes for agricultural use [90].
The parameter outputs of the water quality index scores of the surface waters show that in all surface water samples, the total coliform count is high. Dissolved oxygen (DO) and pH values did not pass the quality standards set by CPCB-1992 (Table 5) [41]. In case of inland wetlands, along with pH, DO and total coliform count, biochemical oxygen demand (BOD) values are above the threshold value for the bathing water set by CPCB-1992 (Table 5) [41]. In consequence, surface water samples analyzed also did not meet the BIS-2012 drinking water quality standard. The input of fecal matter and nutrients from point and extensive sources into aquatic ecosystems affects the surface water’s pH values, DO concentrations and oxygen consumption values as well as bacteria concentrations [91]. This also suggests that, like in most urban areas, the major problem is the discharge of point sources to surface waters [91,92,93,94]. However, being in the area of influence of tides, DO concentrations as well as concentrations of alkali and alkaline earth metals increases in the canal water during high tides driven by the influence of seawater [19]. Clear differentiation of the origin of the major cations and anions either from sewage water or seawater is not possible [19,92].
Rapid urbanization has degraded the conditions of the canal system of Kolkata of which Adi Ganga or the Tolly’s Nullah is a prime example [95,96,97]. Apart from the regular tidal influence which is also disrupted by newly constructed elevated Metro railway lines, the water in the canal does not have any flow and it has black color and stinking odor [40]. The sewage effluents to this canal system contain predominantly domestic wastes from the surrounding area, animal remains from slaughterhouses and crematory wastewater [98]. It has been estimated that humans and animal excreta cause a large portion of the fouling of the canal water flowing along the slum areas [98]. Lack of sewage systems and overflow of sewage caused by heavy rainfall events introduce a large amount of sewage into the canal system. Isobe et al. (2004) [99] document high values of linear alkaline benzenes (LAB3) with concentrations of 4.45 mg g−1 dry wt. in bed load sediments of the Adi Ganga Canal (Figure 2). The drainage system in the Adi Ganga Canal waterways has been choked due to high siltation and dumping of garbage including non-degradable wastes [100]. McArthur et al. [19] showed that groundwater of 33% of the public wells (median depth = 91 m) and 14% of municipal wells (median depth = 121 m) is contaminated by chloride (Cl) from the sewage effluent. The anthropogenic Cl has been drawn down to below 110 m depth by pumping [19].
4.3. Urban Environmental Water Security Index and Its Spatial Variations
The urban environmental water security index (UEWSI) scores (Figure 13) reveal the issues with urban water security in the core areas of the Kolkata Municipal Corporation (KMC) area, especially in the most populous northern areas [13]. These northern boroughs (I–VI) of the Kolkata Municipal Corporation have a higher number of slums than the rest of the city areas as well. Slum areas are more vulnerable to water insecurity than non-slum areas as they lack the basic provision of water and sanitary infrastructure [84]. In contrast, at present, the southern boroughs (VII–XVI) are more stable in water security, but following the increase in urbanization in the area, these boroughs may lose their water security in the near future if proper management is not introduced on time. The urbanization is highly visible along the bank of the River Hugli; these urbanization processes have a dynamic influence on the spatial pattern in LULC [101] changes which predominantly result in a reduction of ecosystem service values. Mondal et al. [92] suggested that the presence of the East Kolkata Wetlands in the east of the megacity limited the urbanization in the eastern part of the Kolkata Municipal Corporation. The entire East Kolkata Wetlands is considered to have peri-urban nature which continues beyond the eastern boundary of the EKW as evident from satellite imagery (Figure 1). The overlapped areas of the East Kolkata Wetlands within the Kolkata Municipal Corporation jurisdiction, particularly boroughs VII and XII, are newly added areas having peri-urban characteristics under sporadic urbanization [13]. Consequently, boroughs along the eastern border of the Kolkata Municipal Corporation area (boroughs VII and XII) show higher UEWSI scores than the other boroughs of the Kolkata Municipal Corporation area. These higher UEWSI index scores of boroughs VII and XII result from their proximity to the East Kolkata Wetlands.
The spatial distribution of UEWSI scores (Figure 12) documents the strong influence of the East Kolkata Wetlands located in the periphery of the Kolkata Municipal Corporation area, both in terms of providing livelihoods and products and in making use of a natural source of water [102,103]. The wetlands serve as a carbon sink with their greenery and water bodies and, in addition, they support purification of the Kolkata’s sewage water [103]. In the East Kolkata Wetlands, Everard et al. [104] identified a wider diversity of services across all categories of ecosystem services. Among them, water purification and flood regulation significantly serve to secure Kolkata’s water security directly. At the same time, provisional ecosystem services in terms of agricultural production (mainly food and flower production) benefit city dwellers in terms of the betterment of the quality of their city lives [104] by providing locally generated products [105]. Mondal et al. [102] showed that 14 km2 of the wetland area of the East Kolkata Wetlands were transformed into urban settlement between 2000 and 2011; due to the vast completion of this process in the first decade of the 21st century, this transformation is not recorded in the study at hand. Beyond that, wetland loss was observed in the study area during 2009–2019, mainly because of continuous urban expansion in the Kolkata Metropolitan area potentially compromising the overall sustainability of Kolkata City itself [106]. Mondal et al. [102] projected that only 39% of wetlands within the existing East Kolkata Wetlands will remain in place by 2025 if the current trend of urbanization continues. Complementary, the results of our study show a decline of ecosystem services in the Kolkata Municipal Corporation’s urban areas over the entire observation period of 2009–2019.
5. Limitations
This study attempts to link the advantages of urban and peri-urban ecosystems to water security of a megacity, applying the method of valuation of ecosystem services. There is a variety of detailed direct and indirect methods for estimating values of ecosystem services which may produce higher accuracy and precision with a demand of precise and adequate empirical data [34,35,36,37]. Keeping this fact of lacking adequate data, our study can be considered as a crude initial estimation based on a simple benefit transfer method proposed by Mamat et al. [35]. According to them, “one of the disadvantages of this ESV estimation is its vagueness, especially because the uncertainty of the value coefficient and the spatial, biophysical, and socio-economic heterogeneity were not considered’’ [35]. Secondly, we did not find any ESVs that are unique to the EKW. Perhaps, in the next phase, while considering the local valuation methods, this can be estimated with precision and adequate accuracy. This is certainly a limitation of the study, but not from the perspective of objectives set for the research. Here, we wanted to show the distribution of changes of the ecosystem service values (ESV) quantitatively, using a standard global value coefficient. Detailed survey, generation of participatory data and valuation techniques considering the heterogeneity and complexity of nature/human systems can reduce the uncertainty and generalization in the future research.
6. Conclusions
The transformation of land use and land cover (LULC) of the Kolkata Municipal Corporation and East Kolkata Wetland (EKW) areas has confronted water insecurity. It is examined in this study during pre-monsoon and port-monsoon seasons of 2009, 2014 and 2019 and we have derived major conclusions. For the calculation of the UEWS index and to discuss the dynamics of spatiotemporal changes in LULC, ES values and water quality, a thorough temporal analysis is needed. Therefore, an additional year in between 2009 and 2019 was necessary to explore the continuity of these changes even at the slightest portion. In the UEWS index, we incorporated the intensity indices, which require yearly changes in areas of LULC classes for both pre-and-post-monsoon seasons. We emphasized this precision in order to create and analyze the distribution of UEWS index values across the city. Even small changes in LULC classes have a substantial effect on the resultant ES values, for example, in open spaces or lake areas. The study aimed to explore the dynamic relationship between the changing pattern of LULC, ES values and water quality from a holistic water security point of view. Therefore, the global value coefficient for ES proposed by Costanza et al. and modified by Mamat et al. was taken into consideration after careful review of the literature for the calculation of ES. It also paved a path for future research to calculate local ES values and analyze ES for water security studies. This is a novel approach to amalgamate quantitative variables and processes (LULC changes, ES valuations, water quality index) together to get a resultant effect as urban environmental water security which can be quantified and analyzed further.
This study shows that it is impossible to disregard the role of peri-urban wetlands and the benefits or services from their ecosystem for securing a city’s water and environmental security. In fact, for megacities like Kolkata, the need is stronger. The process of rapid urbanization has blurred the distinction between the “urban” and the “peri-urban” zones which used to play a role of an intermediary between urban and rural areas. There is a need to understand and document social, economic and institutional characteristics of peri-urban regions in a better way. An understanding of these unique characteristics is essential to develop new and innovative ways of addressing peri-urban challenges, cutting across the frontiers of rural and urban governance. The unplanned and unregulated development process in the Kolkata Municipal Corporation area has proved to be quite unsustainable and has turned out to be a serious threat to the city and its environment. The growth has affected basic amenities, especially water supply, for the increasing population in the newly developing areas. Peri-urban wetland areas of Kolkata City are under stress because of expanding urban settlement which hampers the natural water cycle and its regulatory functions. This compromises the natural protection of controlling floods, recharging the shallow aquifer and natural waste management of the city itself. The entire transformation may introduce new pollutants such as wastewater, arsenic or pesticides ultimately affecting the entire water security of the urban area.
River Hugli is the main source of drinking water for Kolkata and it is the main distributary of the River Ganga since ages. Historically, this river has been the lifeline of this megacity in the eastern hemisphere. We did not consider the stretch of the river while calculating the ecosystem service valuation as there was no recent change in the course of the River Hugli. Rather, we considered its water quality issues in the analysis which is crucial for discussing Kolkata’s water security. The Ganga–Hugli river system contributes significantly towards the transport of pollutants of the coastal areas of the Bay of Bengal. The deterioration of water quality is closely related to inefficient water management, non-functioning of wastewater treatment facilities and lack of environmental planning and coordination. Coliform counts in the river water sampled result from microbial contamination by municipal waste sources. Results of the water quality study show that most physiochemical features may be appropriate for domestic water supply after traditional water treatment. However, bacteriological quality observations revealed a high degree of contamination from domestic and animal wastes.
We require more research on critical water-related ecosystem services to encourage additional policy momentum, business commitment and investment in the conservation, restoration and wise use of wetlands. They must show how recognizing, demonstrating and capturing the local values of ecosystem services related to water and wetlands can lead to better informed, more efficient and fairer decision-making for sustainable urban planning. It is evident from the literature that the poorer sections of the society suffer the most when biodiversity is lost, as their survival depends on the multitude of nature. When wetlands are destroyed, the nature’s water cycle and its ability to provide water for households and farms are disrupted, and the suffering of the poor exacerbates inadvertently. Thus, restoration and protection of the water environment is vital to address today’s most pressing challenges of water and food security, climate change and poverty in urban spaces.
Struggle against climate change will set off substantial opportunities for the economy, specifically in the Global South. We should adopt circular production systems in a water-efficient way. As the global population grows, so does the demand for water, settlement and urban infrastructure development. These, in turn, deplete natural resources and damage the environment in many places. Solutions include protecting carbon sinks such as green cover and wetlands, adopting climate-smart agricultural techniques, rainwater harvesting and artificial recharge and increasing the safe reuse of wastewater in urban areas. Water is our most precious resource—we must use it more conscientiously. The significant trade-off between the mankind’s water needs and water security will protect everyone from being left behind. In this context, it is also important to determine how much water the ecosystem needs to ensure its own water security within an urban space. Urban water security research needs to go deeper to learn how complex ecosystems behave at vastly different scales and under the stresses of changing patterns of climate and water availability along with the increasing water demand. This approach is the first of its kind applied to both the KMC and EKW areas. From this study, we found that the regulating ecosystem services have the highest contribution to the monetary values. Therefore, the regulating ES must be given preference for protecting Kolkata City’s water security. This should be given priority while framing the policy and planning framework for the sustainable management of both the city and its peri-urban areas.
Supplementary Materials
The following are available online at https://www.mdpi.com/2071-1050/13/5/2772/s1, Table S1: Borough wise distribution of Vales of Individual Ecosystem Services in US$ in 2009, 2014 and 2019 during pre-monsoon and post-monsoon seasons in Kolkata Municipal Corporation (KMC) and East Kolkata Wetlands areas (outside Kolkata Municipal Corporation) (based on Mamat et al., 2018 [34]) and Satellite Image interpretation from Landsat series-USGS.
Author Contributions
Conceptualization, methodology, investigation, resources, data curation, visualization, writing—original draft preparation, S.M.; software, validation, formal analysis, S.M., P.K.S., S.P.; writing—review and editing, S.P., P.K.S., B.S.; supervision, B.S.; project administration, funding acquisition, S.M., B.S. All authors have read and agreed to the published version of the manuscript.
Funding
The publication of this article was funded by Freie Universität Berlin.
Institutional Review Board Statement
Not applicable.
Informed Consent Statement
Not applicable.
Data Availability Statement
The calculated data on the ecosystem services valuation (ESV) are given in the supplimentary materials and landuse-landcover (LULC) data calculated from the staellite imagery can be avilable on request from the corresponding author.
Acknowledgments
We thank the German Academic Exchange Service (DAAD) which provided a fellowship to conduct this study. We thank the GeoX Network for additional support regarding data collection and transport. We would like to thank Mahalaya Chatterjee, University of Calcutta, India, who provided relevant information, insight and expertise that greatly assisted the research. We are indebted to Ena Sen and Dipanwita Chatterjee for their continuous assistance in mapping and visualization. We would like to express our deep gratefulness to Sankalita Mondal for her patient guidance, enthusiastic encouragement and rigorous help for the data analysis part of this research. We very much appreciate the support by the Jaydeep Sinha for language editing and proofreading. We would also like to show our gratitude to Mantu Biswas for helping in water quality data collection from WBPCB, India, and Rituparno Acharayya and Manab Das for continuous and rigorous assistance with additional data analysis and mapping during this research, and we thank three “anonymous” reviewers for their insights.
Conflicts of Interest
The authors declare no conflict of interest. The funders had no role in the design of the study; in the collection, analyses, or interpretation of data; in the writing of the manuscript, or in the decision to publish the results.
References
- Grey, D.; Sadoff, C.W. Sink or Swim? Water security for growth and development. Water Policy 2007, 9, 545–571. [Google Scholar] [CrossRef]
- Mayers, J. Water Ecosystem Services and Poverty under Climate Change: Key Issues and Research Priorities: Report of a Scoping Exercise to Help Develop a Research Programme for the UK Department for International Development (No. 17); International Institute for Environment and Development (IIED): London, UK, 2009; ISBN 978-1-84369-687-2. [Google Scholar]
- Aylward, B.; Bandyopadhyay, J.; Belausteguigotia, J.C.; Borkey, P.; Cassar, A.Z.; Meadors, L.; Saade, L.; Siebentritt, M.; Stein, R.; Tognetti, S.; et al. Freshwater ecosystem services. Ecosyst. Hum. Well Being Policy Responses 2005, 3, 213–256. [Google Scholar]
- Steinberg, F. Rural–Urban Linkages: An Urban Perspective; Working Paper Series (128); Working Group; Development with Territorial Cohesion. Territorial Cohesion for Development Program. Latin American Center for Rural Development (Rimisp): Santiago, Chile, 2014. [Google Scholar]
- Akkoyunlu, S. The potential of rural-urban linkages for sustainable development and trade. Int. J. Sustain. Dev. World Policy 2015, 4, 20–40. [Google Scholar] [CrossRef]
- Mngumi, L.E. Ecosystem services potential for climate change resilience in peri-urban areas in Sub-Saharan Africa. Landsc. Ecol. Eng. 2020, 16, 187–198. [Google Scholar] [CrossRef]
- Marshall, F.; Dolley, J.; Randhawa, P.; Bisht, R.; Priya, R.; Waldman, L.; Scharlemann, J.; Shamma, C.; Devi, C.; Saharia, R.; et al. Why Peri-Urban Ecosystem Services Matter for Urban Policy (Policy Briefing); STEPS Centre: Brighton, UK, 2017; Available online: https://steps-centre.org/wp-content/uploads/2017/03/Peri_urban_Ecosystem_briefing.pdf (accessed on 28 September 2020).
- United Nations Environment Program (UNEP). Water Security and Ecosystem Services: The Critical Connection. A Contribution to the United Nations World Water Assessment Program. United Nations Environment Programme, Nairobi, Kenya. 2009. Available online: http://www.unesco.org/new/fileadmin/MULTIMEDIA/HQ/SC/pdf/wwap_pub_side_dial_Water_Security_and_Ecosystems.pdf (accessed on 28 September 2020).
- Amerasinghe, P.H.; Dey, D. Recommendations for the Wise Use of Urban and Peri-Urban Wetlands in Kolkata, India; CGIAR Research Program on Water, Land and Ecosystems (WLE): Briefing Series No. 23; International Water Management Institute (IWMI): Colombo, Sri Lanka, 2018; 20p, Available online: http://www.indiaenvironmentportal.org.in/files/file/Recommendations%20for%20the%20wise%20use%20of%20urban%20and%20peri-urban%20wetlands.pdf (accessed on 28 September 2020).
- World Water Assessment Programme (WWAP). The United Nations World Water Development Report: Water for a Sustainable World; UNESCO: Paris, France, 2015. [Google Scholar]
- Millennium Ecosystem Assessment. Ecosystems and Human Well-Being: Synthesis; Island: Washington, DC, USA, 2005. [Google Scholar]
- Pahl-Wostl, C.; Knüppe, K. Water security and environmental water needs: The role of the ecosystem services concept and transformation of governance systems. In Handbook on Water Security. Cheltenham and Northampton; Pahl-Wostl, C., Bhaduri, A., Gupta, J., Eds.; Edward Elgar Publishing: Cheltenham, UK, 2016; pp. 226–238. ISBN 978-1-78254-800-3. [Google Scholar]
- Mukherjee, S.; Bebermeier, W.; Schütt, B. An Overview of the Impacts of Land Use Land Cover Changes (1980–2014) on Urban Water Security of Kolkata. Land 2018, 7, 91. [Google Scholar] [CrossRef]
- Kundu, N.; Pal, M.; Saha, S. East Kolkata Wetlands: A resource recovery system through productive activities. In Proceedings of the Taal-2007: The 12th World Lake Conference, Jaipur, India, 28 October–2 November 2007; Volume 868, p. 881. [Google Scholar]
- Kundu, N.; Chakraborty, A. Dependence on ecosystem goods and services: A case study on East Kolkata Wetlands, West Bengal, India. In Wetland Science; Prusty, B., Chandra, R., Azeez, P., Eds.; Springer: New Delhi, India, 2017; pp. 381–405. [Google Scholar]
- Ghosh, P.; Ghosh, A. Is ecotourism a panacea? Political ecology perspectives from the Sundarban Biosphere Reserve, India. GeoJournal 2018, 84, 345–366. [Google Scholar] [CrossRef]
- Bhattacharya, S.; Ganguli, A.; Bose, S.; Mukhopadhyay, A. Biodiversity, traditional practices and sustainability issues of East Kolkata Wetlands: A significance Ramsar site of West Bengal, (India). Res. Rev. Biosci. 2012, 6, 340–347. [Google Scholar]
- Ramsar Commission Secretariat. Ramsar information Sheet: East Calcutta Wetlands. Ramsar Commission Secretariat, International Union for the Conservation of Nature (IUCN) in Gland, Switzerland. 2002. Available online: https://rsis.ramsar.org/ris/1208 (accessed on 28 September 2020).
- McArthur, J.M.; Sikdar, P.K.; Leng, M.J.; Ghosal, U.; Sen, I. Groundwater quality beneath an Asian megacity on a delta: Kolkata’s (Calcutta’s) disappearing arsenic and present manganese. Environ. Sci. Technol. 2018, 52, 5161–5172. [Google Scholar] [CrossRef]
- Sahu, P.; Sikdar, P.K. Hydrochemical framework of the aquifer in and around East Kolkata Wetlands, West Bengal, India. Environ. Geol. 2008, 55, 823–835. [Google Scholar] [CrossRef]
- Sahu, P.; Sikdar, P.K. Understanding landuse/landcover change in and around a freshwater peri-urban wetland ecosystem using remote sensing and geographical information system. J. Surv. 2009, 49, 113–126. [Google Scholar]
- Sahu, P.; Sikdar, P.K. Assessment of aquifer vulnerability to groundwater pollution by multi-criteria analysis in and around East Calcutta Wetlands, West Bengal, India. Asian J. Water Environ. Pollut. 2009, 6, 31–42. [Google Scholar]
- Sahu, P.; Sikdar, P.K. Threat of land subsidence in and around Kolkata City and East Kolkata Wetlands, West Bengal, India. J. Earth Syst. Sci. 2011, 120, 435–446. [Google Scholar] [CrossRef]
- Sahu, P.; Sikdar, P.K. Effect of pumping on hydrologic system of a young satellite city in south Bengal Basin through numerical modelling: Past, present and future. Sustain. Water Resour. Manag. 2017, 3, 321. [Google Scholar] [CrossRef]
- Sahu, P.; Michael, H.A.; Voss, C.I.; Sikdar, P.K. Impacts on groundwater recharge areas of mega city pumping: Analysis of potential contamination of Kolkata, India, water supply. Hydrol. Sci. J. 2013, 58, 1340–1360. [Google Scholar] [CrossRef]
- Sikdar, P.K.; Sarkar, S.S.; Palchoudhury, S. Geochemical evolution of groundwater in the Quaternary aquifer of Calcutta and Howrah, India. J. Asian Earth Sci. 2001, 19, 579–594. [Google Scholar] [CrossRef]
- Sikdar, P.K.; Mondal, S.; Saha, L.; Sarkar, S.S.; Banerjee, S. Environmental impact assessment of a proposed info-tech complex in East Calcutta wetlands. Environmentalist 2002, 22, 241–260. [Google Scholar] [CrossRef]
- Sikdar, P.K. Hydrogeology of the Area in and around Calcutta and Howrah Municipal Corporation with Special Emphasis on the Management of Groundwater Resources. 1996. Available online: https://shodhganga.inflibnet.ac.in/handle/10603/164651 (accessed on 28 September 2020).
- Sikdar, P.K. Groundwater resource assessment and management of Calcutta and Howrah cities. In Proceedings of the Symposium on Aquifer Characteristics and Groundwater management in Eastern India, 15–16 March 1996; Department of Geological Sciences, Jadavpur University: Calcutta, India, 1996; pp. 160–161. [Google Scholar]
- Sikdar, P.K.; Dasgupta, S.P. Pollution risk analysis of groundwater of Calcutta and Howrah cities. Indian Miner. 1997, 50, 397–402. [Google Scholar]
- Government of West Bengal. Annual Report of Kolkata Metropolitan Development Authority on the Study of Rabindra Sarobar for Assessment of Methodology Regarding Bio-Medication Work under National Lake Conservation Plan; Government of West Bengal: Kolkata, India, 2006.
- Government of West Bengal. Annual Report of Kolkata Metropolitan Development Authority on Rabindra Sarobar; Proposed Development and Upkeepment: Kolkata, India, 2007. [Google Scholar]
- Mistry, D.; Basu, R. Status of Physical Environment and Land use Pattern in Rabindra Sarobar Lake Area of Kolkata. Int. J. Soc. Sci. 2014, 3, 311. [Google Scholar]
- Costanza, R.; d’Arge, R.; De Groot, R.; Farber, S.; Grasso, M.; Hannon, B.; Limburg, K.; Naeem, S.; O’neill, R.V.; Paruelo, J.; et al. The value of the world’s ecosystem services and natural capital. Nature 1997, 387, 253–260. [Google Scholar] [CrossRef]
- Mamat, A.; Halik, Ü.; Rouzi, A. Variations of ecosystem service value in response to land-use change in the Kashgar Region, Northwest China. Sustainability 2018, 10, 200. [Google Scholar] [CrossRef]
- Costanza, R.; De Groot, R.; Sutton, P.; Van der Ploeg, S.; Anderson, S.J.; Kubiszewski, I.; Farber, S.; Turner, R.K. Changes in the global value of ecosystem services. Glob. Environ. Chang. 2014, 26, 152–158. [Google Scholar] [CrossRef]
- Kreuter, U.P.; Harris, H.G.; Matlock, D.M.; Lacey, R.E. Change in ecosystem service values in the San Antonio area, Texas. Ecol. Econ. 2001, 39, 333–346. [Google Scholar] [CrossRef]
- Almeida, C.A.; Quintar, S.; Gonzalez, P.; Mallea, M.A. Influence of urbanization and tourist activities on the water quality of the Potrero de los Funes River. J. Environ. Monit. Assess. 2007, 133, 459–465. [Google Scholar] [CrossRef]
- Canadian Council of Ministers of the Environment (CCME). Canadian water quality guidelines for the protection of aquatic life Canadian water quality index 1.0 technical report. In Canadian Environmental Quality Guidelines; Canadian Council of Ministers of the Environment (CCME): Winnipeg, MB, Canada, 2001. [Google Scholar]
- West Bengal Pollution Control Board (WBPCB). Environmental Impact Assessment Study Report on Rabindra Sarobar Lake Premises, Kolkata-Final Report; West Bengal Pollution Control Board, Paribesh Bhavan: Kolkata, India, 2017. Available online: http://www.wbpcb.gov.in/writereaddata/upload/contents/File-30.pdf (accessed on 6 June 2020).
- Bureau of Indian Standards (BIS). Drinking Water-Specification IS; No. 10500; Bureau of Indian Standards: New Delhi, India, 2012.
- Miraj, A.; Bhattacharya, S.K. Changing Trends of Some Bio-Physico-Chemical Characteristics of Sagardighi of Cooch Behar, West Bengal, India. J. Indian Res. 2017, 5, 79–94. [Google Scholar]
- Tate, C.M.; Coles, J.F.; Zappia, H. Use of an urban intensity index to assess urban effects on streams in three contrasting environmental settings. Am. Fish. Soc. Symp. 2005, 47, 291–315. [Google Scholar]
- Su, S.; Jiang, Z.; Zhang, Q.; Zhang, Y. Transformation of agricultural landscapes under rapid urbanization: A threat to sustainability in Hang-Jia-Hu region, China. Appl. Geogr. 2011, 31, 439–449. [Google Scholar] [CrossRef]
- Suja, R.; Letha, J.; Varghese, J. Evaluation of urban growth and expansion using remote sensing and GIS. Int. J. Eng. Res. Technol. 2013, 2, 2772–2779. [Google Scholar]
- Zhou, D.; Shi, P.; Wu, X.; Ma, J.; Yu, J. Effects of Urbanization Expansion on Landscape Pattern and Region Ecological Risk in Chinese Coastal City: A Case Study of Yantai City. Sci. World J. 2014, 2014, 821781. [Google Scholar] [CrossRef] [PubMed]
- Mandal, J.; Ghosh, N.; Mukhopadhyay, A. Urban Growth Dynamics and Changing Land-Use Land-Cover of Megacity Kolkata and Its Environs. J. Indian Soc. Remote Sens. 2019, 47, 1707–1725. [Google Scholar] [CrossRef]
- Carpenter, S.R.; Caraco, N.F.; Correll, D.L.; Howarth, R.W.; Sharpley, A.N.; Smith, V.H. Nonpoint Pollution of Surface Waters with Phosohorus and Nitrogen. Ecol. Appl. 1998, 8, 559–568. [Google Scholar] [CrossRef]
- Hack, J. Payments for Hydrological Ecosystem Services in Integrated Water Resources Management. Ph.D. Thesis, Technische Universität, Darmstadt, Germany, 2013. [Google Scholar]
- Ravetz, J. Future of the Urban Environment & Ecosystem Services in the UK; Government Office of Science, Future of Cities Foresight Programme: London, UK, 2015.
- Chauhan, C. Monsoon 2019: A Stark Reminder of Climate Change and Its Implications. Hindustan Times. 2019. Available online: https://www.hindustantimes.com/opinion/monsoon-2019-a-stark-reminder-of-climate-change-and-its-implications/story-yZL2oZFzSUlL7D79jJqQbN.html (accessed on 6 June 2020).
- Sukhdev, P.; Wittmer, H.; Schröter-Schlaack, C.; Nesshöver, C.; Bishop, J.; ten Brink, P.; Gundimeda, H.; Kumar, P.; Simmons, B. The Economics of Ecosystems and Biodiversity: Mainstreaming the Economics of Nature: A Synthesis of the Approach, Conclusions and Recommendations of TEEB; No. 333.95 E19; UNEP: Geneva, Switzerland, 2010. [Google Scholar]
- Tobias, S. Preserving ecosystem services in urban regions: Challenges for planning and best practice examples from Switzerland. Integr. Environ. Assess. Manag. 2013, 9, 243–251. [Google Scholar] [CrossRef] [PubMed]
- Jaeger, J.; Schwarz-von Raumer, H.; Esswein, H.; Müller, M.; Schmidt-Lüttmann, M. Time series of landscape fragmentation caused by transportation infrastructure and urban development: A case study from Baden-Württemberg, Germany. Ecol. Soc. 2007, 12. [Google Scholar] [CrossRef]
- Di Giulio, M.; Holderegger, R.; Tobias, S. Effects of habitat and landscape fragmentation on humans and biodiversity in densely populated landscapes. J. Environ. Manag. 2009, 90, 2959–2968. [Google Scholar] [CrossRef]
- Global Water Partnership. Linking Ecosystem Services and Water Security—SDGs Offer a New Opportunity for Integration; Global Water Partnership (GWP): Stockholm, Sweden, 2016. [Google Scholar]
- Kremer, P.; Hamstead, Z.; Haase, D.; McPhearson, T.; Frantzeskaki, N.; Andersson, E.; Kabisch, N.; Larondelle, N.; Lorance Rall, E.; Voigt, A.; et al. Key insights for the future of urban ecosystem services research. Ecol. Soc. 2016, 21. [Google Scholar] [CrossRef]
- La Rosa, D.; Spyra, M.; Inostroza, L. Indicators of cultural ecosystem services for urban planning: A review. Ecol. Indic. 2016, 61, 74–89. [Google Scholar] [CrossRef]
- Kindu, M.; Schneider, T.; Teketay, D.; Knoke, T. Changes of ecosystem service values in response to land use/land cover dynamics in Munessa–Shashemene landscape of the Ethiopian highlands. Sci. Total Environ. 2016, 547, 137–147. [Google Scholar] [CrossRef]
- Tolessa, T.; Senbeta, F.; Kidane, M. The impact of land use/land cover change on ecosystem services in the central highlands of Ethiopia. Ecosyst. Serv. 2017, 23, 47–54. [Google Scholar] [CrossRef]
- Ferreira, L.M.R.; Esteves, L.S.; de Souza, E.P.; dos Santos, C.A.C. Impact of the Urbanisation Process in the Availability of Ecosystem Services in a Tropical Ecotone Area. Ecosystems 2019, 22, 266–282. [Google Scholar] [CrossRef]
- Sun, Z.; Yu, S.; Guo, H.; Wang, C.; Zhang, Z.; Xu, R. Assessing 40 years of spatial dynamics and patterns in megacities along the Belt and Road region using satellite imagery. Int. J. Digit. Earth 2020, 14, 1–17. [Google Scholar] [CrossRef]
- Kulkarni, S. City Expansions and the Vertical Urbanization Approach. 2016. Medium. Available online: https://medium.com/@SunnyKulkarni/city-expansions-and-the-vertical-urbanization-approach-10280a05a01 (accessed on 31 May 2020).
- Akbari, H. Shade trees reduce building energy use and CO2 emissions from power plants. Environ Pollut. 2002, 116 (Suppl. 1), S119–S126. [Google Scholar] [CrossRef]
- Elmqvist, T.; Setälä, H.; Handel, S.N.; Van Der Ploeg, S.; Aronson, J.; Blignaut, J.N.; Gomez-Baggethun, E.; Nowak, D.J.; Kronenberg, J.; De Groot, R. Benefits of restoring ecosystem services in urban areas. Curr. Opin. Environ. Sustain. 2015, 14, 101–108. [Google Scholar] [CrossRef]
- Nicholson-Lord, D. Green Cities: And Why We Need Them; New Economics Foundation: London, UK, 2003. [Google Scholar]
- Gill, S.E.; Handley, J.F.; Ennos, A.R.; Pauleit, S. Adapting cities for climate change: The role of the green infrastructure. Built. Environ. 2007, 33, 115–133. [Google Scholar] [CrossRef]
- Pataki, D.E.; Carreiro, M.M.; Cherrier, J.; Grulke, N.E.; Jennings, V.; Pincetl, S.; Pouyat, R.V.; Whitlow, T.H.; Zipperer, W.C. Coupling biogeochemical cycles in urban environments: Ecosystem services, green solutions, and misconceptions. Front. Ecol. Environ. 2011, 9, 27–36. [Google Scholar] [CrossRef]
- Escobedo, F.J.; Kroeger, T.; Wagner, J.E. Urban forests and pollution mitigation: Analyzing ecosystem services and disservices. Environ. Pollut. 2011, 159, 2078–2087. [Google Scholar] [CrossRef]
- Escobedo, F.J.; Nowak, D.J. Spatial heterogeneity and air pollution removal by an urban forest. Landsc. Urban Plan. 2009, 90, 102–110. [Google Scholar] [CrossRef]
- Mitchell, R.; Popham, F. Effect of exposure to natural environment on health inequalities: An observational population study. Lancet 2008, 372, 1655–1660. [Google Scholar] [CrossRef]
- Maas, J.; Verheij, R.A.; Groenewegen, P.P.; de Vries, S.; Spreeuwenberg, P. Green space, urbanity, and health: How strong is the relation? J. Epidemiol. Community Health 2006, 60, 587–592. [Google Scholar] [CrossRef]
- Fuller, R.A.; Irvine, K.N.; Devine-Wright, P.; Warren, P.H.; Gaston, K.J. Psychological benefits of greenspace increase with biodiversity. Biol. Lett. 2007, 3, 390–394. [Google Scholar] [CrossRef] [PubMed]
- Brander, L.M.; Koetse, M.J. The value of urban open space: Meta-analyses of contingent valuation and hedonic pricing results. J. Environ. Manag. 2011, 92, 2763–2773. [Google Scholar] [CrossRef] [PubMed]
- Ninan, K.N.N. Conserving and Valuing Ecosystem Services and Biodiversity: Economic, Institutional and Social Challenges; Earthscan: London, UK, 2009. [Google Scholar]
- Power, A.G. Ecosystem services and agriculture: Tradeoffs and synergies. Philosophical transactions of the royal society B: Biological. Sciences 2010, 365, 2959–2971. [Google Scholar]
- Ghosh, D. Wastewater Utilisation in East Calcutta Wetlands; UWEP Occasional Paper; WASTE: Nieuwehaven, The Netherlands, 1999. [Google Scholar]
- Chaudhuri, S.R.; Mukherjee, I.; Ghosh, D.; Thakur, A.R. East Kolkata wetland: A multifunctional niche of international importance. J. Biol. Sci. 2012, 12, 80–88. [Google Scholar]
- Inostroza, L. Open Spaces and Urban Ecosystem Services. Cooling Effect towards Urban Planning in South American Cities. Tema J. Land Use Mobil. Environ. 2014. [Google Scholar] [CrossRef]
- Russi, D.; Patrick ten Brink, P.; Farmer, A.; Badura, T.; Coates, D.; Förster, J.; Kumar, R.; Davidson, N. The economics of Ecosystems and Biodiversity for Water and Wetlands; IEEP: London, UK; Brussels, Belgium, 2013. [Google Scholar]
- Ramsar Convention Secretariat. Handbook on the Best Practices for Planning, Design and Operation of Wetland Education Centres; Ramsar Convention Secretariat: Gland, Switzerland, 2014. [Google Scholar]
- Nagabhatla, N.; Metcalfe, C.D. (Eds.) Multifunctional Wetlands: Pollution Abatement and Other Ecological Services from Natural and Constructed Wetlands; Springer: Cham, Switzerland, 2017. [Google Scholar]
- World Wildlife Fund (WWF). Living Planet Report 2014: Species and Spaces, People and Places; WWF: Gland, Switzerland, 2014. [Google Scholar]
- Mukherjee, S.; Sundberg, T.; Schütt, B. Assessment of Water Security in Socially Excluded Areas in Kolkata, India: An Approach Focusing on Water, Sanitation and Hygiene. Water 2020, 12, 746. [Google Scholar] [CrossRef]
- Basu, J. Kolkata, a Water-Rich City Turning Water-Poor, the Third Pole. 2016. Available online: https://www.thethirdpole.net/2015/11/11/kolkata-a-water-rich-city-turning-water-poor (accessed on 24 May 2016).
- Singh, G. As Kolkata’s Groundwater Level Depletes, Consequences Go beyond Water Shortage; Citizen Matters; Oorvani Foundation: Kolkata, India, 2019; Available online: https://india.mongabay.com/2019/06/as-kolkatas-groundwater-level-depletes-consequences-go-beyond-water-shortage/ (accessed on 30 May 2020).
- Banerjee, S.; Sikdar, P.K. Land Subsidence due to leakage of aquitard-aquifer pore water in an under-construction tunnel of East-West Metro Railway Project, Kolkata. J. Geol. Soc. India 2020, 96, 467–474. [Google Scholar] [CrossRef]
- The British Columbia Ground Water Association (BCGWA). “Sodium in Groundwater.” Water Stewardship Information Series. 2007. Available online: https://www.rdn.bc.ca/cms/wpattachments/wpID2284atID3807.pdf (accessed on 21 June 2020).
- Wagh, V.; Mukate, S.; Panaskar, D.; Sahu, U.; Aamalawar, M.; Muley, A.; Lolage, Y. Development of CCME WQI model for the groundwater appraisal for drinking in Basaltic terrain of Kadava River basin, Nashik, India. Indian J. Geo Mar. Sci. 2019, 48, 1933–1940. [Google Scholar]
- Chakravarty, I. Water Problems for Kolkata Metropolitan Region, Ballardie Thompson & Matthews Pvt. Ltd. 2007. Available online: www.sulabhenvis.in/admin/.../Kolkata%20Sewerage%20systems.pdf (accessed on 2 February 2020).
- Ternus, R.Z.; Gilza Maria de Souza-Franco, G.M.; Anselmini, M.E.K.; Mocellin, D.J.C.; Magro, J.D. Influence of urbanisation on water quality in the basin of the upper Uruguay River in western Santa Catarina, Brazil. Acta Limnol. Bras. 2011, 23, 189–199. [Google Scholar] [CrossRef]
- Daniel, M.H.; Montebelo, A.A.; Bernardes, M.C.; Ometto, J.P.H.B.; De Camargo, P.B.; Krusche, A.V.; Ballester, M.V.; Victoria, R.L.; Martinelli, L.A. Effects of urban sewage on dissolved oxygen, dissolved inorganic and organic carbon, and electrical conductivity of small streams along a gradient of urbanization in the Piracicaba river basin. Water Air Soil Pollut. 2002, 136, 189–206. [Google Scholar] [CrossRef]
- McGrane, S.J. Impacts of urbanisation on hydrological and water quality dynamics, and urban water management: A review. Hydrol. Sci. J. 2016, 61, 2295–2311. [Google Scholar] [CrossRef]
- Sridhar, K.S.; Kumar, S. India’s Urban Environment: Air/Water Pollution and Pollution Abatement. Econ. Political Weekly 2013, 48, 22–25. [Google Scholar]
- Basu, A. Tolly’s Nala: Present and Future. Indian J. Landsc. Syst. Ecol. Stud. 2012, 35, 537–550. [Google Scholar]
- Das, S.; Dhali, M.K.; Biswas, M. Impact of the metro extension over Tolly Nullah on socio-economic behavioural changes—A case study between Tollygunge and Kavi Subhas Metro station, Kolkata. J. Int. Acad. Res. Multidiscip. 2015, 3, 145–160. [Google Scholar]
- Sarkar, M.D. An Urban River on a Gasping State: Dilemma on Priority of Science, Conscience and Policy. 2017. Available online: https://iwra.org/member/congress/resource/ABSID285_ABSID285_FINAL_PAPER_IWRA_MexicoConference_2017.pdf (accessed on 8 July 2020).
- Sarkar, S.K.; Saha, M.; Takada, H.; Bhattacharya, A.K.; Mishra, P.; Bhattacharya, B. Water quality management in the lower stretch of the river Ganges, east coast of India: An approach through environmental education. J. Clean. Prod. 2007, 15, 1559–1567. [Google Scholar] [CrossRef]
- Isobe, K.O.; Zakaria, M.P.; Chiem, N.H.; Minh, L.Y.; Prudente, M.; Boonyatumanond, R.; Saha, M.; Sarkar, S.; Takada, H. Distribution of linear alkylbenzenes (LABs) in riverine and coastal environments in South and Southeast Asia. Water Res. 2004, 38, 2449–2459. [Google Scholar] [CrossRef]
- Sarkar, S.K.; Frančišković-Bilinski, S.; Bhattacharya, A.K.; Saha, M.; Bilinski, H. Levels of elements in the surficial estuarine sediments of the Hugli River, northeast India and their environmental implications. Environ. Int. 2004, 30, 1089–1098. [Google Scholar] [CrossRef]
- Shaw, R.; Das, A. Identifying peri-urban growth in small and medium towns using GIS and remote sensing technique: A case study of English Bazar Urban Agglomeration, West Bengal, India. Egypt. J. Remote Sens. Space Sci. 2017, 21, 159–172. [Google Scholar] [CrossRef]
- Mondal, B.; Dolui, G.; Pramanik, M.; Maity, S.; Biswas, S.S.; Pal, R. Urban expansion and wetland shrinkage estimation using a GIS-based model in the East Kolkata Wetland, India. Ecol. Indic. 2017, 83, 62–73. [Google Scholar] [CrossRef]
- Pal, S.; Chakraborty, S.; Datta, S.; Mukhopadhyay, S.K. Spatio-temporal variations in total carbon content in contaminated surface waters at East Kolkata Wetland Ecosystem, a Ramsar Site. Ecol. Eng. 2018, 110, 146–157. [Google Scholar] [CrossRef]
- Everard, M.; Kangabam, R.; Tiwari, M.K.; McInnes, R.; Kumar, R.; Talukdar, G.H.; Dixon, H.; Joshi, P.; Allan, R.; Joshi, D.; et al. Ecosystem service assessment of selected wetlands of Kolkata and the Indian Gangetic Delta: Multi-beneficial systems under differentiated management stress. Wetl. Ecol. Manag. 2019, 27, 405–426. [Google Scholar] [CrossRef]
- Bolund, P.; Hunhammar, S. Ecosystem services in urban areas. Ecol. Econ. 1999, 29, 293–301. [Google Scholar] [CrossRef]
- Parihar, S.M.; Sarkar, S.; Dutta, A.; Sharma, S.; Dutta, T. Characterizing wetland dynamics: A post-classification change detection analysis of the East Kolkata Wetlands using open-source satellite data. Geocarto Int. 2013, 28, 273–287. [Google Scholar] [CrossRef]
Publisher’s Note: MDPI stays neutral with regard to jurisdictional claims in published maps and institutional affiliations. |
© 2021 by the authors. Licensee MDPI, Basel, Switzerland. This article is an open access article distributed under the terms and conditions of the Creative Commons Attribution (CC BY) license (http://creativecommons.org/licenses/by/4.0/).