Abstract
Currently, there is little information regarding the recent spatiotemporal dynamics of upper timberline in the Carpathian Mountains. We reconstructed the temporal (1887–2018) and spatial dynamics of upper timberline in the Rodna Mountains (Eastern Carpathians) based on seven sets of maps and aerial photographs and explained its variability in relation to three main drivers: air temperature, land morphometry and anthropogenic pressure. The impact of natural drivers (temperature, morphometry) on timberline position was evaluated using a high-resolution digital elevation model, local and regional instrumental and modelled climate databases. The impact of anthropogenic factors on timberline position was documented from published sources such as local paleolimnological studies and historical documents. Results show that timberline rose on average with 113 ± 2 m on the northern slope of the Rodna Mts (currently reaching 1640 m above sea level (a.s.l.)) and with 182 ± 2 m on the southern slope (up to an elevation of 1539 m a.s.l.). Our results suggest that this pattern might be connected with the rising temperature over the recent decades. On the northern slope where land morphometry restricts anthropogenic activities, timberline reached the highest elevation. On the more accessible southern slope, anthropogenic land-use changes likely moderated timberline elevational rise under increasing temperatures.
1. Introduction
Rising temperatures over the last decades are among the main scientific concerns related to global climate change [1]. It is estimated that the impacts of temperature rise on different regional and local ecosystems will be critical in high-elevation mountain areas, which are home to unique habitats with well-defined tolerance limits [2,3]. The Carpathian Mountains are a biogeographically unique region in Europe, where unmanaged old-growth forests and subalpine and alpine habitats with many endemic and relict species are found which are vulnerable to thermal developments forecast for the 21st century [4,5].
High-elevation timberline and treeline environments are highly sensitive to the impact of climate change [6,7,8] due to the narrow tolerance limits of the component vegetation assemblages [2,9,10,11,12]. Timberline is defined as the line below which trees form a forest with a closed canopy, whereas treeline refers to the higher elevation ecotone located between timberline and subalpine/lpine belt, which can sustain tree growth [13]. Accordingly, the position and structure of the timberline and treeline ecotone are climatically determined and therefore strongly dependent on the temperature regime [8,14,15]. The upper forest limit is mainly controlled by largescale temperature, but is influenced locally by other natural, morphometric factors such as slope gradients, aspect or curvature [16,17,18].
A significant number of studies have highlighted a recent rise in timberlines (and treelines) in different mountain regions around the world [7,19,20,21,22] and even more studies predict a continuation of this pattern due to climate warming [14,23,24,25,26]. Other studies have shown that timberline and treeline advance is not a global phenomenon explained by the elevational increase in temperature [8,15,27]. This is because the asynchronous response of tree species to rising temperature [24] and the interaction with other natural factors influence this process locally or regionally [28,29,30]. Fires (natural or anthropogenic) and changes in land use (grazing, logging, mining activities, etc.) may mask or even lead in the opposite direction the altitudinal dynamics of timberline and treeline [12,31,32]. Anthropogenic treelines are much more common than climatic ones (at least in Europe) [33,34].
For Europe, [35] showed that strong warming signals have been present in the Alps since 1980, associated with an advance of the elevation limit below which tree species can grow in the subalpine belt. Other studies [14,36] provided additional evidence regarding the responses already observed in timberline and treeline dynamics to global temperature changes in the Scandinavian Alps and the Alps. A clear timberline and treeline advance, unprecedented in the Holocene vegetation history of the area was found in the Scandinavian Alps [36]. Subsequent research, however, suggested that the vegetation changes over the last decades in the subalpine and alpine belts of the European mountains could have been triggered mainly by the reduction or cessation of human impact (pastoral activities and mining) and not by climate warming itself [14,26,37,38,39,40,41,42,43,44,45,46,47,48,49,50].
Fewer studies on upper timberline dynamics are available for Central and Eastern Europe. For the Carpathian Mountains, these also show an increase in timberline and treeline position over the recent decades [32,51,52,53,54,55,56,57,58]. This increase was attributed either to climate warming [32,57,59] or to land use changes [32,60,61], but in most cases, the distinction between the two types of drivers was difficult to achieve [55,56,58]. This is particularly true for Europe where human impact on environment (mostly fire and grazing) has been and sometimes still is very strong.
Rodna Mountains represent a key ecological area in the Romanian Carpathians [2,62]. Although for this area studies reconstructing timberline dynamics at the Holocene scale are available [11,12], there are currently few studies assessing timberline dynamics in the recent period (131 years) in relation to potential drivers such as temperature, land morphometry and anthropogenic impact [63]. Such a knowledge gap may critically hamper constructing sustainable strategies for ecological and economic management of the area on the short and medium term [64].
The purpose of this paper is to identify precisely and through quantitative and sufficiently detailed information, the altitudinal landmarks of timberline positioning in the Rodna Mountains in the last 131 years (1887–2018). Then, through pertinent and detailed arguments, we will relate this positioning, by the factors that, through their spatio-temporal variability, impose the timberline position: the natural and the anthropic factors.
The present study has the following objectives: to reconstruct timberline dynamics for the period 1887–2018; to quantify the influence of natural factors (temperature, land morphometry) on timberline dynamics; to assess the impact of anthropogenic factors (grazing, deforestation, management of subalpine pastures through burning), on the elevational fluctuations of timberline.
2. Materials and Methods
2.1. Study Area
Rodna Mountains National Park and Biosphere Reserve is part of Rodna Mountains, with the limits located on the following coordinates: in the west 47°37′36.819″ N/24°35′4.133″ E, in the north 47°37′34.262″ N/24°35′7.955″ E, in the east 47°33′50.73″ N/25°1′48.422″ E, and in the south 47°25′50.675″ N/24°38′30.394″ E. Rodna Mountains National Park has an area of 472.07 km2 and a maximum elevation of 2303 m a.s.l. (Figure 1a–c).
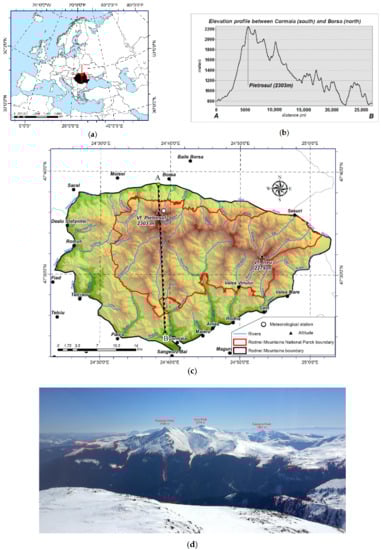
Figure 1.
Details of the study area: (a) geographic location of the study area in Europe and Romania; (b) north-south elevation profile between Borșa and Cormaia localities—the profile shows the asymmetry between northern and southern slopes of the massif; (c) geographical position and topography of Rodna Mountains and of Rodna Mountains National Park and Biosphere Reserve—location of the sites for which meteorological information is available; (d) timberline position (red line) on the southwestern side of Rodna Mts as recorded on 31 March 2019.
Rodna Mts are predominantly composed of crystalline schists with strong metamorphism, whilst sedimentary and calcareous rock layers are a secondary occurrence [65].
Rodna Mts display a pronounced asymmetry, with a steeper, less extended northern slope compared to the southern one (Figure 1b). The difference between the two slopes favors morphological (mostly glacial) processes on the northern slope and higher land fragmentation on the southern slope caused by human activities [65].
Studies show that, in the Carpathian region, the average annual temperature in the 21st century increased by 2 °C [5], twice the global average (1.0 °C) [1]. According to the data from the Iezer weather station, located in the subalpine vegetation belt on the Pietrosul Rodnei Peak (1774 m a.s.l), the multiannual average temperature is 1.3 °C, and the weather phenomena specific to the cold season lasts approx. 9 months a year; the average annual precipitation sums are 803 mm, and the average annual wind speed exceeds the 8 m/s threshold.
Forests cover 60.2% of the park area (284.1 km2) and are the main type of land cover [66]. In terms of forest composition, conifer species (spruce or spruce mixed with pine and/or fir) dominate at higher elevation and conifer-deciduous assemblages (spruce mixed with beech) at lower elevation [67]. Meadows and areas covered by shrubs (mainly juniper) amount to 38.1%, whilst bare rocks have a share of 1.1% [66].
Current timberline has many convolutions (Figure 1d) and is composed of spruce (Picea abies), mixed with pine (Pinus cembra) on the eastern part of the massif, and with beech (Fagus sylvatica) on the southern slope. Along with spruce and beech, mountain ash (Sorbus aucuparia) and birch (Betula pendula) are also found on southern and southwestern slopes [67,68]. Treeline generally forms a broader belt with distinct local discrepancies, from abrupt transition—mostly seen on the southern slope, to an ecotone consisting of subalpine herbs and shrubs, isolated trees and krummholz. In addition, tree height sometimes reaches 8–10 m [67], which might indicate that the current treeline position in those areas is not natural.
For this study, we used five sets of topographic maps indicating vegetation cover (1887, 1921, 1944, 1961, 1984) and two sets of aerial photographs (orthophotoplans from 2012, 2018), coupled with field observations, to reconstruct recent timberline dynamics. To distinguish between the natural factors that influenced timberline dynamics, we used a high-resolution digital elevation model (10 m) and local and regional meteorological data. To evaluate the influence of anthropogenic factors on timberline dynamics, we used paleoecological and historical information extracted from published sources, aerial photographs and the resources of the National Institute of Statistics [69]. In order to enable the comparison between the information derived from aerial photographs and from historical maps, we considered only the position of timberline, i.e., upper limit of the closed forest, and not of treeline. This is because historical maps record only the former, according to the definition of the forest used in that period, and not the position of isolated trees.
2.2. Data and Methods
An accurate analysis of past, present and future timberline dynamics depends on the definition of a closed or open forest area. In order to enable a comparison between current timberline position and the information extracted from historical maps, our reconstruction does not focus on treeline dynamics, because the sets of historical maps available for our study area generally mark the position of alpine timberline and not of the treeline ecotone or isolated trees. On these cartographic resources, upper forest limit is represented according to the definition of the forestry standards of that time (which includes both open and closed forest areas), with limited or no information related to the extension of treeline ecosystem as defined by [8] and others [70,71]. Upper timberline therefore coincides in our study area with treeline when the transition to the alpine meadows is abrupt, and may include portions of the treeline ecotone where minimum tree height is at least 2 m and tree cover exceeds 40%.
2.2.1. Cartographic and Morphometric Analysis
Cartographic analysis for reconstructing historical timberline dynamics and the influence of land morphometry on the former was performed based on 5 sets of topographic maps with scales between 1: 20,000 and 1: 100,000 (published in 1887, 1921, 1944, 1961 and 1984) and two sets of high-resolution aerial photographs (2012 and 2018) [72,73,74,75,76,77,78]. The maps and aerial photographs were georeferenced in the Stereographical projection 70 (Datum Dealul Piscului). Cartographic analysis also involved the identification and mapping on the 2018 aerial photographs of traces of human activity, particularly sheepfolds (which have several common elements, such as circular folds surrounded by wooden fences for the protection of sheep flocks) and cattle stables (larger, built on two levels, the upper used for hay storage). This was done to capture their position and density, in order to assess the potential impact of pastoral activities on timberline dynamics. Furthermore, the 2018 aerial photographs were also used to map the recently deforested areas (1–2 year old deforested areas, where stumps of felled trees are still visible, tree branches are still stored in piles of dry vegetation and the dirt roads used for forest exploitation are still usable) and the recently reforested areas (2 to 6 years old reforestations, where seedlings and young shrubs cover the ground entirely or partly).
Morphometric analysis was performed by extracting the land morphometry data from a digital elevation model with a 10 × 10 m spatial resolution, obtained by interpolating the contour lines vectorized from the Topographic maps of Romania, Scale 1:25,000 (1984). Quantification of spatial errors was achieved by identifying three common reference points (P1, P2, P3) on all sets of maps and aerial photographs. The overlap of all sets of cartographic materials has a spatial error of 1.5–2 m.
The elevation of timberline position in 2018 was extracted from the aerial images based on a number of 31,302 points on the southern slope of Rodna Mountains. For the northern slope, 14,676 points were used to determine timberline position. We used 3D TREND modeling (available as an extension on the ArcGIS platform) to show the spatial variability in timberline position in 2018 (Figure 2). We then extended the reconstruction of timberline dynamics on the two slopes of the massif to 1887.
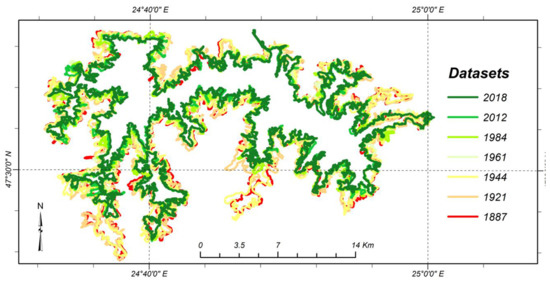
Figure 2.
Timberline dynamics in the Rodna Mountains between 1887 and 2018.
To assess the recent, i.e., 2001–2018 potential impact of fires on timberline dynamics in Rodna Mts, MODIS satellite data was used [79]. Given that MODIS fire data have a spatial resolution of 1 km2, they were used qualitatively, to mark local fire occurrence.
2.2.2. Meteorological Data
To assess climatic conditions in the study area, we used meteorological data on air temperature recorded at Iezer meteorological station (located on the northern slope of the massif, 1774 m a.s.l) which spans the 1961–2017 period. To determine trends in air temperature on the monthly, seasonal and annual time series, we used a nonparametric approach, i.e., Mann-Kendall test combined with Sen slope test [80]. For this, the MAKESENS software [81] was used, as follows: first, the presence of a positive or negative monotonic tendency was tested by using the nonparametric Mann-Kendall test and, secondly, the linear estimated trend slope was calculated using Sen’s nonparametric method. Since average temperature does not technically exist in nature, this parameter should be considered an indicator of the physical state of the air and not a causal factor [8]. Therefore, in addition to average temperature, other complementary climatic indices were included in the weather-climate analysis, such as length of the growing season, growing season air temperature, extreme weather events during the growing season, etc.
Due to the diametrically opposite orientation of the two slopes of the Rodna Mountains, temperature at the Iezer weather station may not be relevant for the whole massif. For this reason, we also used the CRU TS4.02 data [82], to estimate average temperature on both slopes.
2.2.3. Anthropic Data Sources
In our approach, the main sources of anthropogenic information were historical maps and satellite images. The information was processed cartographically and statistically on them, which allowed us a detailed analysis of the positioning in time of the upper limit of the forest in the Rodna Mountains. In addition to these data, we also used information that gave details about the pastoral activity carried out in the Rodna Mountains, about how the fire influenced the forest over time and about the exploitation of vegetation in this massif.
2.3. Timberline Dynamics over the Last 131 Years Reconstructed from Old Maps and Aerial Photographs
Timberline elevational variability was reconstructed by marking its successive positions on the 5 sets of maps (1887, 1921, 1944, 1961 and 1984) and two sets of aerial images (2012, 2018). The reconstructed dynamics in the 1887–2018 period is different for the two slopes of the massif, with a higher temporal and spatial variability on the southern slopes (Figure 2).
Statistical analysis of the data derived from cartographic resources showed that in 2018 timberline position was on average 1640 ± 2 m on the northern slope and 1539 ± 2 m on the southern slope. For the entire 1887 to 2018 time interval, timberline increased on average with 113 ± 2 m on the northern slope (at an average rate of 0.8 m yr−1) and with 116 ± 2 m on the southern slope (at an average rate of 1.3 m yr−1), respectively (Figure 3). For the northern slope, the maximum elevational position reached by timberline was 2017 m in 2012, and the minimum position 921 m in 2018. For the southern slope, the maximum elevational position reached by timberline was 1929 m in 2018, and the minimum 678 m in 1887 (Figure 3). The difference in average timberline position on the two slopes decreased progressively from 170 m in 1887 to 101 m in 2018 (Figure 3).
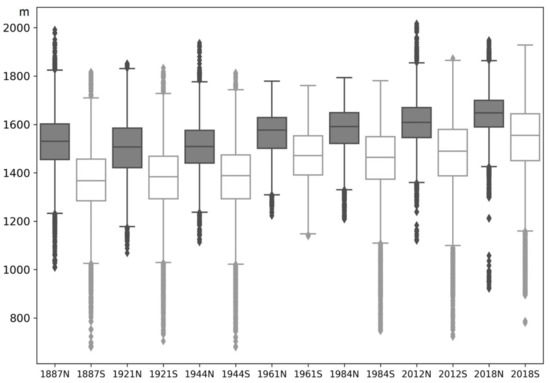
Figure 3.
Boxplot representation of timberline elevation on the northern and southern slopes of Rodna Mts during 1887–2018 (gray color—northern slope, white color—southern slope).
Between 1944 and 1961 there was a marked upward shift in average timberline position (Figure 3). This shift may be related to a strong reduction in anthropogenic pressure in the upland area, while adjacent lowlands were undergoing an incipient process of communist collectivization. Furthermore, meteorological records show that the extremely dry period 1945–1947 was followed by several years more favorable for forest growth, which might have accelerated the upward movement of timberline in the area, on the background of lower human pressure.
Analysis of highest and lowest elevations reached by timberline in the 1887–2018 time interval shows a lower amplitude elevational change on the southern slope compared to the northern slope (Figure 3). On the northern slope, the highest positions are reached after 1990, when the high elevations in Rodna Mts received protected status [64]. Cartographic data also shows that the subalpine and alpine areas above timberline gradually reduced with 84 km2 between 1887 and 2018, from 249 km2 in 1887, to 189 km2 in 1961 and to 165 km2 in 2018 (Figure 1). The results also show the existence of a west-east spatial differentiation in the altitudinal position of the upper forest limit. For example, for 2018 a decrease of 23 m in average timberline position can be observed on the west–east direction, over the entire 32.5 km length of the main mountain ridge.
3. Results
3.1. Natural Drivers of Timberline Dynamics over the Last 131 Years
3.1.1. Air Temperature
Meteorological data derived from instrumental observations at Iezer and Pietrosu Rodnei peak weather stations show that the average annual temperature is 1.5 °C at 1774 m a.s.l. (Table 1) and −1.2 °C at 2303 m a.s.l. We calculated the average vertical temperature gradients for the two slopes (report at 100 m altitude) based on the annual average temperature and elevation differences between the weather stations Vișeu de Sus (478 m a.s.l.), Ocna Șugatag (490 m a.s.l.) and Iezer for the northern slope, and Bistrița (358 m a.s.l.)—Pietrosul Rodnei weather stations for the southern slope, respectively. We obtained average vertical temperature gradients equal to 0.48 °C for the northern slope and 0.53°C for the southern slope. Taking into account these values, the average annual temperature at timberline is 1.76 °C on the northern slope (1640 m a.s.l.) and 2.16 °C on the southern slope—1539 m a.s.l.

Table 1.
Parameters indicating the temporal distribution of air temperature indices (°C) at Iezer meteorological station (1961–2017).
Statistical analysis of the instrumental time series at Iezer meteorological station (1961–2017) shows that between 14 December and 10 March (86 days) the average daily temperature dropped below −5 °C, and between 10 March–14 April and 5 November–14 December (73 days) the average daily temperature was between −5 and 0 °C. Between 14 April–13 May and 25 September–5 November (73 days) the average daily temperature was between 0 and 5 °C. The average frost-free period at timberline around Iezer station for the analyzed interval generally occurs between 14 April and 5 November (206 days), during which time air temperature remains above the critical threshold (0 °C). This threshold is very important for trees growing at the upper forest limit [83]. However, the occurrence of frost days was occasionally reported in the interval where these should not typically be present (e.g., 8 frost days in June 1962 and 1976, 3 days in July 1996, 4 days in August 1981).
On average, the growing season at timberline in Rodna Mts for the 1961–2017 interval was statistically placed between 13 May and 25 September (133 days), with daily average temperature exceeding the 5°C threshold. The importance of the 5 °C threshold over which the growing season of the trees starts is underlined by [84]. However, during this period there were days when the temperature dropped to negative values (e.g., −16.6 °C in September 1977, −10.1 °C in May 1976, −4.1 °C in June 1973, −1,5 °C in June 1978 or −1,9 °C in August 1981), with consequences on tree growth (Table 1). For our study area, the instrumental data show a general trend of increasing air temperature for the entire 1961–2017 period (Table 2).
Table 2.
Trends in air temperature (°C/decade) at the Iezer weather station—1774 m a.s.l. (1961–2017/1976–2017) based on the Mann-Kendall test.
For the 57 years of instrumental data (1961–2017), average annual temperature increased with 0.29 °C/decade; for the period 1976–2017, however, this trend is more evident, i.e., 0.4 °C/decade, which shows an acceleration of atmosphere heating (Table 2). The year 1976 marks the beginning of a warmer period at the regional scale according to several studies [58,59]. Table 2 shows that for the warm seasons, summers but also the months of August, trends in air temperature for the period 1961–2017 were of increase, more evident in the period 1976–2017. The statistical significance of the increase in air temperature is higher than 0.001 (Table 2).
By comparing the standardized instrumental data recorded at the Iezer weather station with those derived from the CRU TS4.02 dataset for the entire summer (June–August), we can extend the meteorological data time series back to the year 1900. The 1900–2010 period was characterized by a succession of intervals with contrasting summer temperature anomalies. Based on the variability of summer temperature anomalies, four main intervals can be separated: two colder, i.e., 1887–1910 and 1947–1976 and two warmer, i.e., 1911–1946 and 1977–2010.
The last three decades of the 1900–2010 period show the most pronounced warming trend, and this trend was visible since 1976 (Figure 4, Table 2).
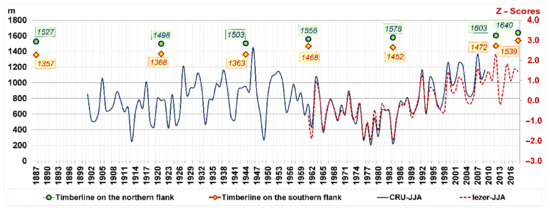
Figure 4.
Comparison between the average timberline upper elevation and the average temperature of summer months: timberline dynamics on the northern and southern slopes (1887–2018) as reconstructed from old maps and aerial photographs—up; summer temperature variability in Rodna Mountains based on CRU TS4.02 data (range 1900–2008) and instrumental data from the Iezer weather station (1962–2010)—bottom.
Comparing summer temperature variability with upper timberline dynamics between 1887 and 2018 and also taking into account that forest response to temperature variability has a time lag of approx. 10 years (but may be subject to other controlling factors at the same time) [8], we note that timberline dynamics generally followed temperature trends on both slopes of the massif (Figure 4). This may be reflective of the influence of summer temperature variability on timberline elevational position. However, during the period 1947–1976 which appears slightly colder, timberline ascent may have been influenced by other factors. We suggest that longer periods with increased summer temperature (e.g. 40–50 years such as 1977 to present) had a larger influence on timberline upward shift, while shorter cool periods (e.g., 30 years or less, such as between 1887–1910 and 1947–1976) likely contributed less to timberline dynamics. This is likely due to other climatic elements (high humidity, cloudiness and precipitation) and/or reduction in anthropogenic activities which may have favored timberline upslope shift. Our analysis therefore shows that longer intervals with summer temperature above the average had a greater influence on timberline rise compared to shorter intervals with summer temperature below the average.
3.1.2. Land Morphometry
To assess the influence of local topography on timberline position, we performed a graphical representation of timberline distribution (expressed as percentages) for different categories of land morphometry, i.e., elevation, slope, aspect and curvature (Figure 5).
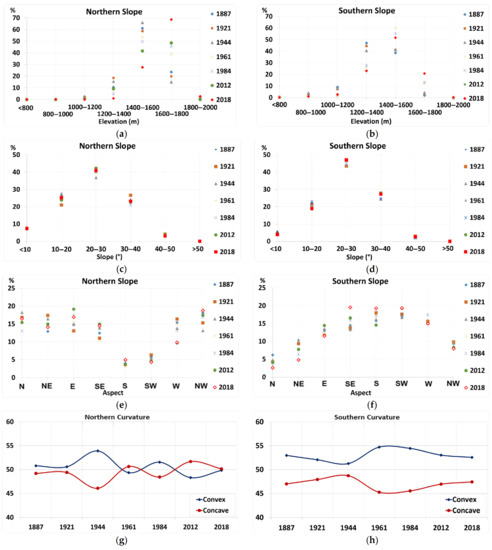
Figure 5.
Timberline percentage distribution for intervals of elevation (a) and (b), declivity (c) and (d), aspect (e) and (f) and curvature (g) and (h).
For the entire analyzed period (1887–2018), timberline was mostly located in the 1400–1600 elevation interval on both northern and southern slopes, in proportion of 40 to 70% on the northern slope and 40 to 60% on the southern slope (Figure 5a,b). The highest variability in timberline dynamics was observed on the northern slope in the 1600–1800 m elevation interval, when the position of timberline increased after 1961 from around 20% to 40–50% (Figure 5a). Conversely, on the southern slope timberline dynamics were characterized by high variability in all the main elevation intervals, i.e., 1200–1400 m (timberline percentages reduced after 1984 from 40–50% to 20–30%), 1400–1600 (60% of timberline was located in this elevation interval in 1961) and 1600–1800 m a.s.l. (timberline percentages increased after 1961 from <5% to 10–20%) (Figure 5b). These changes may be a result of increasing summer air temperature, but may also be caused by anthropogenic activities, particularly on the southern slope.
Regarding timberline temporal distribution on declivity intervals, it was mostly distributed in the 20–30° declivity interval for both slopes, with 35–40% on the northern slope and 45–55% on the southern (Figure 5c,d). On the northern slope, timberline percentual distribution increased in the 10–20° declivity interval from ~20% in 1921 to ~30% in 2018, and declined with 5–10% in 2018 in the 20–30° and 30–40° intervals compared to the previous years (Figure 5c). On the southern slope, timberline distribution remained constant in the 10–30° interval, increased by 10% in the 20–30° interval and decreased by 10% in the 30–40° declivity interval (Figure 5c). The decrease in timberline percentages in the 30–40° interval on both slopes may reflect timberline lowering due an increase in precipitation torrentiality and the intensity of slope processes.
Regarding aspect, timberline was mostly distributed spatially on slopes facing N, NE, E, NW and W on the northern slope, and E, SE, S, SW and W on the southern slope, respectively (Figure 5e,f). This difference is given by the dominant W-E orientation of the two main slopes. As for the temporal dynamics, on the northern slope timberline position was more dynamic and mostly varied on slopes with E, W and NW aspects (12–20%); on the southern slope a similar 12–20% variation was encountered on slopes with a SE aspect. Timberline distribution increased in 2018 by >5% on slopes with E, SE and NW aspects on the northern slope (Figure 5e), and SE and SW aspects on the southern slope, respectively (Figure 5f). This increase may have resulted from an enhancement of the local atmosphere dynamics on the background of rising warm season temperature, which likely amplified convective-orographic processes and moisture availability, thus favoring subalpine grassland encroachment and better conditions for tree growth.
For slope curvature, it can be observed that timberline position was mostly distributed on concave areas on the northern slope, and on convex areas on the southern slope (Figure 5g,h). However, there is a higher variability in this distribution on the northern slope, with timberline predominantly located on convex areas in 1944 and 1984 (Figure 5g). Over the recent years (2012 and 2018), a trend of increasing proportion of timberline distribution on concave surfaces can be observed on both slopes (Figure 5g,h).
By analyzing slope curvature, we can deduce that, under the same substrate, soil moisture is usually higher on concave topography than on flat or convex surfaces. However, variations in exposure to solar radiation can generate local particularities in timberline distribution and dynamics. Moreover, concave topographies of the narrow valleys may have favored a gradual timberline advance, as the amount of snow accumulating each year reduced as a result of atmosphere warming. Visual observations showed that, in the Rodna Mts, timberline usually reaches its highest position in small valleys and rills (concave surfaces), which provide better humidity conditions and strong wind shelters. In the sectors with large declivity gradients, slope curvature is less important in influencing timberline position, as these areas are affected by avalanches and other slope processes which considerably limit timberline and treeline advance. In contrast, on convex topography (prolonged peaks of different height), vegetation generally occurs spontaneously [16]. Such topography is predominantly developed on the southern slope, which may explain the preferential distribution of timberline on convex surfaces (Figure 5h).
3.2. Anthropogenic Factors (Grazing, Fire, Clearance)
3.2.1. Pastoral Activities
Grazing was shown as one of the major anthropogenic factors that controlled timberline advance in the Carpathian Mountains [16,58]. For Rodna Mountains, published information and field observations have shown that subalpine and alpine meadows were used for pastoral activities from centuries ago to the present [85]. Data on pastoral activities in the Rodna Mts is available only starting with 1989 [64,69]. Despite data scarcity, some general aspects regarding the intensity of grazing on the two slopes of the massif can be derived (Figure 6). We analyzed land-use in three localities on the northern slope (Maramureș county) and eight localities on the southern slope (Bistrița Năsăud county) for the period 1990–2014 [69]. The absolute data (ha) was transformed into relative values (%) to effectively compare land-use categories on the two slopes. We found that the smallest changes in land-use structure occurred on the northern slope (the agricultural area increased by only 1%, pastures and meadows increased by 2.2%, forested areas by 0.3%). On the southern slope, land-use changes were more prominent (agricultural area increased by 29.2%, pastures and meadows increased by 36.7%, and the forested area decreased by 5.5%). The data therefore show a more intense anthropogenic impact on the southern slope of the mountains.
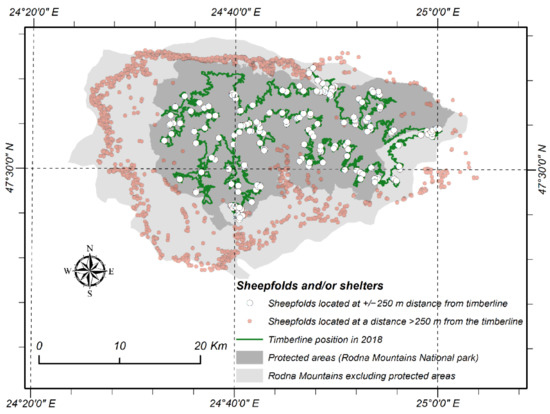
Figure 6.
Distribution of sheepfolds and cattle stables in the Rodna Mountains National Park and its Scheme 2018.
The dynamics of the total number of sheep and cattle in the same localities was also analyzed for the 1990–2003 period, based on the resources provided by the National Institute of Statistics [69]. The data were transformed into relative values (%). On the northern slope, between 1990 and 2003 there was a decrease in livestock numbers by 29.8% in sheep and by 12.5% in cattle. In comparison, on the southern slope the livestock decrease was more pronounced (42% in sheep and 34.6% in cattle) [69]. In 1990, there were more than 89,000 sheep and cattle in the localities adjacent to the Rodna Mts, whilst in 2003 their number was approx. 33% lower, of around 61,000. As shown before, agricultural changes were more ample on the southern slope, and the forest was more affected by anthropogenic activities. The 1990–2003 dataset also shows uncommon situations, such as the decrease in livestock on the southern slope, coincident with an increase in agricultural land, pastures and meadows; this may also be explained by structural agricultural changes unrelated to timberline position. Therefore, to assess the potential impact of pastoral activity on timberline dynamics, we performed a detailed cartographic analysis based on the high-resolution aerial photographs from 2018. We thus identified 1829 sheepfolds and cattle stables in Rodna Mts that were still functional in 2018. Of these, 183 sheepfolds and shelters were located at ± 250 m distance above and/or below the timberline (Figure 6). These data show the presence of pastoral activity in the vicinity of timberline, despite statistical data [69] showing a reduction in livestock number in the area over the recent two decades.
3.2.2. Fire Activity
Over the last 18 years, fire activity in the Rodna Mts has been generally characterized by frequent, small, local fires and only three larger fires. This data does not exclude the occurrence of very large wildfires with a probability of occurrence >18 years. The analysis of the MODIS database from 2001–2018 revealed the occurrence of 21 wildfires within the park limits, of which only three were located near the timberline. These three fires occurred on 6 November 2011 and in each case, the burnt area was over 1 ha.
3.2.3. Clearance
Recent field observations have shown that illegal logging occurs very close to upper timberline on protected areas located in the proximity of human settlements. Illegal forest exploitation by clear cutting is a critical problem in the Rodna Mts National Park, which has generated wide debate over the last years [64].
On the 2018 aerial photographs, we mapped 12.7 km2 of cleared forest near the upper forest limit, and the age of the clearings was estimated at one or two (at most) years, as many of these parcels had trees felled and not yet removed; furthermore, we mapped 33.21 km2 additional areas that were cleared over the last three–six years, where forest is presently regenerating (Figure 7).
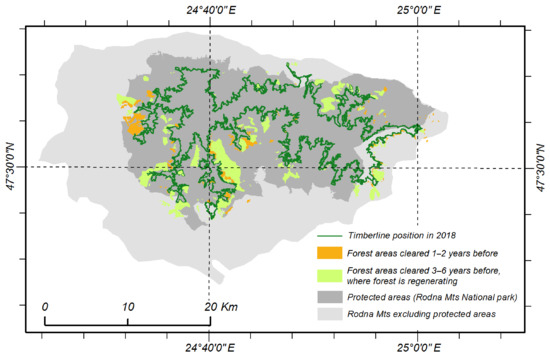
Figure 7.
Cleared areas located in the Rodna Mountains/Rodna Mountains National that were mapped on the 2018 aerial photographs; orange—forest areas that were cleared 1–2 years before; green—forest areas that were cleared 3–6 years before, where forest is currently regenerating.
Forest clearance near the timberline causes the formation of forest gaps and may thus indirectly alter the microclimate at the timberline and promote forest fires [11].
4. Discussion
4.1. Timberline Dynamics in Rodna Mountains between 1850 and 2018
Upper timberline dynamics in the period 1887–2018 is a result of a complex interaction between natural and anthropogenic factors. Timberline response to climate change can occur only if land-use is favorable for tree establishment and expansion [16]. In general, anthropogenic timberline exhibits the greatest elevational changes after cessation of pastoral activities and other types of human activities [26]. We suggest that such a situation also occurred in Rodna Mts when timberline advanced rapidly between 1944 and 1961. We believe that the forest recovered from the major 1945–1947 drought and, due to a lower grazing pressure given by the drastic decline in livestock during the Second World War, its elevational movement was enhanced. Regarding the two intervals characterized by timberline upslope advance (1945–1961 and 1990–2018), human pressure was lower in both cases; however, temperature slightly decreased between 1945 and 1961, and rapidly rose between 1990 and 2018. Thus, timberline upslope movement was likely the result of the two combined factors in both cases (Figure 8).
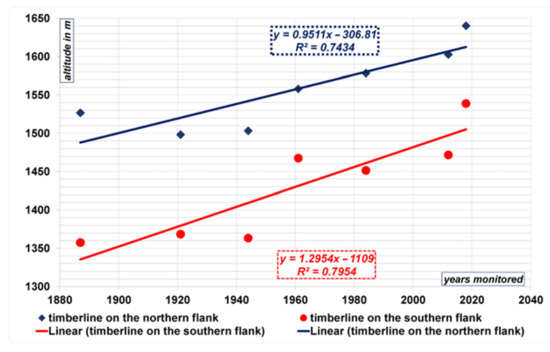
Figure 8.
Past trends in average timberline dynamics on the northern and southern slope in the Rodna Mountains.
A comparison of timberline dynamics between Rodna Mts and other parts of the Carpathians reveals similar, but also contrasting trends. As such, remote sensing research has showed an upslope movement of timberline in the Tatra Mountains (Polish Western Carpathians) [54], while in the Bieszczady Mountains National Park (Polish Eastern Carpathians) timberline has remained relatively stable since the mid-19th century [32]. Timberline in the western Chornohora Mts (Ukrainian Carpathians) advanced by 80 m on average between 1933 and 2001 [32]. The fastest timberline advance resulted from the expansion of coniferous forests (dominant species: Picea abies) and was recorded in remote areas, affected little or not at all by livestock grazing. In the Southern Carpathians (Iezer Mountains), remote sensing showed an increase of 25–50 m of average timberline elevation during the last two decades (1986–2005), paralleled by a gradual replacement of coniferous forests: spruce (Picea abies), common fir (Abies sp.), silver fir (Abies alba), with mixed forests: spruce (Picea abies), common fir (Abies sp.), silver fir (Abies alba), beech (Fagus silvatica), birch (Betula pendula), hornbeam (Carpinus betulus), and the natural regeneration of beech (Fagus silvatica) on debris cones and along old paths [55]. Similarly, in the Rodna Mts after 1850, the forest extended locally on more remote areas, but also reduced in the vicinity of human settlements (bottom-up direction), and in the areas more affected by livestock grazing (top-down direction). The interaction between the climatic and geomorphological factors, on the one hand, and the anthropogenic factor, on the other hand, resulted in an average timberline upslope advance by 147.5 ± 2 m on both slopes, between 1887 and 2018. This average value cannot be solely attributed to regional warming, as overall human pressure and fire occurrence were also shown to decrease.
In the mountains of the temperate latitudes timberline is higher on sunny slopes than on shaded slopes, provided that no orographic or anthropogenic factors prevent upper timberline from reaching the climatic limit [8]. In the European Alps, the elevational position of timberline differs on sunny and shaded slopes by about 100 m [8]. Kucsicsa [67] established for Rodna Mts an average timberline position of 1600–1650 m for the northern slope and 1550–1600 m for the southern slope. Our results showed an average timberline position of 1640 ± 2 m on the northern slope and at 1539 ± 2 m on the southern slope, respectively. Therefore, this situation is not in agreement with natural factors more favorable for timberline ascent on the southern slope. We suggest that this difference is related to higher and longer-time anthropogenic pressure on the more accessible southern slope.
Considering the above-mentioned information, we believe that timberline dynamics in the Rodna Mts over the last 150 years can be considered a positive recovery after the general timberline descent during the Little Ice Age [86,87,88,89,90]. On the background of the general positive trend in temperature in the period 1887–2018 (fragmented in four subperiods), a trend that coincided with upper timberline advance, a shorter phase of timberline descent occurred in 1887–1921, when timberline position descended by 11–29 m on average, followed by a longer, more prominent phase of timberline advance by approx. 137–176 m, from 1921 onward. These changes in timberline position were likely strongly modulated by changes in land-use (clearance, industrial activities, grazing and arson) and other natural disturbances (drought, windthrows).
4.2. Timberline Dynamics in Relation to Natural Factors
According to Kucsicsa [67], upper timberline in the Romanian Carpathians is generally climate-limited, but also varies according to latitude, elevation, aspect, slope gradients, curvature and other morphometric features. The instances where timberline ascent can be solely and explicitly attributed to temperature rise are rare. In certain intervals, decreasing temperatures could not decisively influence timberline dynamics, as other climatic or non-climatic factors were overall more important in shaping timberline position. For example, during the cold period 1960–1980, timberlines declined in the Scandinavian Alps [36]. In Rodna, this cold interval was offset to 1947–1976 and could not influence timberline descent. Our data show that between 1947 and 1976, average timberline elevation actually increased, by ~55 m on the northern slope and ~105 m on the southern slope). We discuss this situation in detail in Section 4.3.
A temperature feature characteristic of the high elevations in the Rodna Mountains is that, based on the average temperature values, winters extend far outside the calendar timeframe (November to end of March), and minimum temperatures recorded in our study area indicate the possibility of occurrence of frost intervals, with temperature minima that can decrease below the −10 °C threshold from September to end of May (Table 1). Therefore, the role of temperature as a conditioning factor for timberline advance increases, due to its relationship with tree resistance, particularly with regard to seedlings, which are key elements in forest survival and extension. Due to the fact that the upper forest belt of the Rodna Mountains is generally composed of spruce, which is less frost-tolerant compared to pine (Pinus cembra), but more resistant compared to some fir species [86], timberline is expected to be more sensitive to low temperatures which generally occur in the cold season, but also to temperature increases during the warm season. Therefore, we suggest that temperature variability could be more accurately reflected in the dynamics of maximum elevations reached by timberline during the analyzed period.
Meteorological data (Figure 4) indicate for the analyzed interval the succession of two warm periods (1911–1946; 1977–2018), a cold period (1947–1976) and a moderately cold period (1880–1910). Similar periods were identified for summer temperature in the Carpathian region [58,59]. Summer temperature showed two notable warming intervals (1911–1946 and 1977–2018), separated by an interval of considerable cooling (1947–1976). According to the authors mentioned previously, the most important temperature increase was recorded after 1977. Cartographic reconstruction of the timberline dynamics in the Rodna Mts showed that timberline reached the maximum positions on both sides of the massif during the cold period 1947–1976 (illustrated by the 1961 map) or immediately after, given the effect of the 10-year temperature lag on forest dynamics (illustrated by the 1984 map), and after 1990, when temperature was more favorable (Figure 4). This increase on both slopes of the massif demonstrates that temperature is the main factor determining the maximum elevation reached by upper timberline. A decrease in temperature is not, however, equally reflected in the mean and minimum timberline positions, these being most likely influenced by other factors such as land morphometry or human impact. The trends in temperature are, however, shaped by local differences in the active surface.
Among the climatic factors, air-mass dynamics can influence the position and physiognomy of timberline, through a combination of wind speed (which in Rodna frequently exceeds 40 m/s), frequency (many years with wind frequency higher than 90% of the time: 1966, 1967, 1970–1972 etc.) and structure (turbulent and gust wind prevails at high elevation), orientation of the main ridge relative to the prevailing wind directions and local topography (aspect, curvature, declivity and elevation). One such example of wind disturbances in the Rodna Mts was the 1970–1979 interval, when calm conditions had a multi-annual average of only 14.5%, based on the data recorded at Iezer weather station. This interval was characterized by massive windthrows, which likely contributed to timberline decline on the more exposed topography. The degree of impact by wind on timberline position is currently visible on the northern slope on the slopes facing west, where timberline includes many flag-shaped trees. Popa [87] identified two other intervals with intense wind activity in Rodna Mountains (1880–1890 and 1915–1920), by using information derived from tree radial growth. He showed that these strong wind intervals had a strong impact on tree growth at and immediately below timberline between 1500 and 1650 m a.s.l. The intense wind activity between 1880 and 1920 also seems to have contributed to a lowering of the average timberline elevation on both slopes, and that between 1970 and 1979 appears to have influenced timberline position predominantly on the southern slope.
Another category of factors playing an important role in shaping the physiognomy and structure of timberline is represented by topography and land morphometry, respectively [8,26]. Unlike air temperature which varies temporally and spatially, local topography is the only relatively constant environmental factor. Local topography not only modulates temperature by creating microclimates, but the effects of local topography on timberline position show clear spatial patterns and are therefore relatively predictable. We noticed that, in the Rodna Mountains, the forest advanced mostly in the 1600–1800 m elevation interval and on slopes facing NW on the northern slope, and on slopes with 20–30° declivity, facing SE and on convex landforms of the southern slope (Figure 5a–h). Field observations (2018) showed signs of recent timberline advance on both slopes. On many areas previously covered by subalpine and alpine pastures, we observed a natural invasion of tree seedlings (Picea abies and Pinus cembra), especially on concave topography. Field observations also showed that timberline position is lower in torrential valleys and avalanche paths (Figure 1d). Rock falls, creep or surface erosion occur locally and may prevent timberline from reaching its upper climatic limit (orographic limit). However, such cases are restricted to few areas on the northern slope of the Rodna Mountains.
4.3. Timberline Dynamics in Relation to Anthropogenic Factors
Treeline advance over the last 100–150 years has been documented in the Ukrainian Carpathians [59], Poland, Slovakia and Hungary [88] and has been largely attributed to land-use changes, such as land abandonment and pasture encroachment at high elevation.
People largely influenced the dynamics of vegetation belts in the Rodna Mts [89]. Recent studies suggested that this influence is also reflected in timberline dynamics [67], through the local control performed by grazing and logging activities. In areas where upper timberline is subject to anthropogenic pressure, it is generally below the potential limit (which should be on average 1740 m on the northern slope and 1890 m on the southern slope, compared to 1640 m on the northern slope and 1539 m on the southern, as it is today). Contrary to situations described in the literature for other European mountains, where timberline is found at lower elevation on the northern slopes compared to the southern, in the Rodna Mts average timberline position is higher on the northern compared to the southern slope. While in the case of the former, timberline position might be more climatically influenced, in Rodna Mts the difference in timberline position between the two main slopes may be a result of anthropogenic activities, particularly livestock grazing.
4.3.1. The Impact of Pastoral Activities
In the last half of the 19th century, forest was removed from all accessible topographies to extend subalpine and alpine pastures [64]. In the twentieth century, a massive deforestation of the subalpine association Rhododendro myrtifolii—Pinus mugo occurred, for a further extension of high-elevation pastures [64]. This deforestation, which removed shrubs and trees in the treeline ecotone almost completely, also affected open spruce forests neighboring subalpine dwarf pine associations, so that open forest was also cleared on large, compact areas [67]. At the same time, pastoral activities mainly resulted in local forest destruction and timberline decline, as grazing on subalpine and alpine meadows negatively affected the growth of seedlings. In addition, grazing activities were associated with large amounts of cut wood to build and support temporary high elevation settlements such as sheepfolds and cattle stables, and meet the need for firewood (heating, cheese production). Pastoral activity decreased drastically in the years following the fall of communism (1990), with a reduction by a third in livestock numbers in the settlements adjacent to the park between 1990 and 2003 [69]. This decrease coincided both with a sharp increase in local temperature (Figure 4) and with an increase in the average timberline elevation (Figure 3). For example, timberline in 2018 reached its highest elevation in the last 150 years. Only in the period 1984–2018 (marked by enhanced warming) did timberline increase on average by 62 m on the northern slope and by 87 m on the southern slope, respectively (Figure 3). It is therefore difficult to separate the influence of the temperature rise from the decrease in anthropogenic pressure in the Rodna Mts after 1990. Most likely, these two factors acted simultaneously, with reduction of human impact probably enhancing timberline upslope movement, already favored by the temperature rise. It is notable that during the cold period 1947–1976, the average and minimum positions of timberline increased on both sides of the massif (Figure 3). This is probably due to a reduction in anthropogenic impact as a result of the lower temperatures and consequently of a shorter pastoral season. To conclude, the rise in the average and minimum timberline positions between 1944 and 1984 is a direct consequence of the reduction in human impact and an indirect consequence of decreasing temperatures.
4.3.2. Fire Activity at Timberline and Potential Impacts on Tree Growth
Fire regime in the subalpine and alpine vegetation belts of the Carpathians is generally shaped by both climate and biomass availability [12,90]. In the Rodna Mts, colder intervals increased the need for firewood in the settlements adjacent to the park; however, this likely did not influence timberline dynamics. A shorter growing season during the colder intervals likely allowed forest to regenerate and timberline to rise, determining a faster rate in the encroachment of subalpine pastures, which required the use of fire to maintain open pastures. This may explain the recent increase in fire activity during the colder intervals at high elevation, as derived from published charcoal records [11,12,90]. The use of fire to manage high elevation pasture was prevalent in the study area since the Bronze Age, based on the quantification of pollen and charcoal data in lake sediments [11,12,90]. Paleoecological indicators (charcoal, pollen) showed that the colder periods (1887–1925; 1944–1976) were associated with higher fire activity in the treeline ecotone and at timberline, as a result of increased biomass availability and reduction of pastoral activities [11,90]. This confirms our hypothesis that the rise in minimum timberline positions during the colder periods (Figure 3) was caused by decreasing anthropogenic pressure, as timberline was located below its potential limit.
The change in political regime and property since 1990 was marked in the sedimentary indicators by an episode with maximum fire activity in the study area, parallel to a marked regional decrease in forest cover [91]. At the same time, after 1990 the sedimentation rates at both lacustrine sites (Stiol and Buhăescu) increased rapidly, due to an increase in either human impact or rainfall torrentiality in the area [12,92]. Nevertheless, cartographic information indicates an increase in the mean and maximum timberline elevations, as timberlines reached their maximum levels for the entire studied interval (Figure 3). The dynamics follow the temperature trend; minimum timberline position declined on the northern slope to the lowest position in the entire analyzed interval (1222 m in 1961, 921 m in 2018). Although we do not dispute the direct role of temperature in driving timberline upward shift, we suggest that there might also be an indirect role, through an intensification of rainfall torrentiality and frequency of avalanches, which might have physically limited timberline rise on the northern slope. We should also note that both datasets (2012 and 2018), based on which post-1990 timberline dynamics was reconstructed, reflect the situation after 2004, when large parts of the Rodna Mts were included in the Rodna Mts National Park and Biosphere Reserve, particularly after 2007 when Romania was integrated in the European Union [64], as both events limited anthropogenic activities in the area.
Studies showed that timberline dynamics are strongly influenced by proximity to human settlements, and by the decline or development of some economic activities. MacDonald et al. [93] showed that the decline in agro pastoral activities at lower and especially upper timberline was a widespread phenomenon in the European mountains, which led to an increase in the elevational position of timberline [94,95,96,97]. Abandonment of mountain pastures (mainly due to the reduction of pastoralism and the livestock numbers), initiated the development of new, secondary forest and subalpine shrubs on the formerly grazed areas of Chornohora, the highest mountain in the Ukrainian Carpathians [32]. In the High Tatra Mountains, overgrazing and use of the Pinus cembra and Larix decidua species as firewood lowered the upper timberline by 120 to 150 m in the last 400–500 years [98].
On the northern slope of the Rodna Mts, human impact controlled forest dynamics on the more accessible slopes, while on the more isolated and remote surfaces, the upward shift in timberline was regulated mainly by the natural factors (temperature and topography). Land morphometry controlled the intensity of human impact at high elevation, particularly on the northern slope, where slope gradients are steep, which resulted in a higher position of the timberline compared to the southern slope. However, very steep slopes, avalanche paths and rock falls create scree deposits at the base of cirque walls, which limit tree growth and forests upward movement. Consequently, on the northern slope, topography is one of the key factors controlling timberline position and structure, when timberline is below its climatic limit. On the southern slope, anthropogenic activities are the dominant factor shaping timberline dynamics, through grazing and other land-uses. The alpine and subalpine meadows cover a considerably larger area on the southern slope, and the contact between subalpine meadow and forest is mostly abrupt, without a transitional ecotone between these two types of vegetation. Thus, given that present timberlines are well below their potential limit on the southern slope, and given that topography is less restrictive, temporal fluctuations in anthropogenic pressure were likely reflected in timberline dynamics, which explains why these dynamics are more ample on the southern slope.
4.3.3. Forest Clearance—Direct and Indirect Impacts
Our results show that, for 2018, a higher accessibility of the southern slope likely favored more widespread deforestation over recent decades (Figure 7). Kucsicsa [67] also found that the southern slope has the largest deforested areas (70%), of which 35% were located between 1600 and 1800 m a.s.l., and 31% between 1400 and 1600 m a.s.l. Immediately after the abrupt change in the political regime in 1989, forest clearance intensified. Massive deforestation in the area occurred between 1989 and 1993, which increased forest openness above 1500 m elevation [64]. The creation of gaps in the compact, old-growth forest, at high elevation, likely influenced the local timberline environment, by changes in the microclimate and forest resistance/resilience to disturbances such as fire. This was also demonstrated by the auxologic changes observed in the tree growth rings in the area [87].
4.4. Future Perspectives in Timberline Dynamics and the Potential Ecological Consequences
Studies showed that changes in temperature can lead to biogeographic changes after a decade or more [8]. This may explain why timberline dynamics in our study area does not clearly follow the trends in temperature. The end of the Little Ice Age (LIA), which corresponds to the mid-19th century in Europe [99,100], coincided with a lower position of upper timberline due to conditions unfavorable for tree survival, especially at high elevations. In the Rodna Mts, timberline dynamics after the LIA indicates a relative stabilization until around 1944. In accordance with climate trends, average timberline elevation increased after 1944 on both slopes (Figure 8). Published palaeoecological information shows that the subalpine and alpine ecosystems in the study area were significantly impacted by anthropogenic activities starting 200 years ago [12], when an intensive change in land-use occurred, with clearance of subalpine and treeline/timberline tree and shrub assemblages for the extension of high elevation pastures [64]. Given the recent reduction in grazing activities and in response to the current and predicted warming, the alpine and subalpine plant communities presently colonizing the open, high elevation areas would likely face a restriction of their habitats due to meadow encroachment and the upward shift in tree/timberlines. The effects of recent warming on treeline/timberline dynamics in the study area are not clearly visible in the local paleoecological records [12].
Kucsicsa [67] showed that current timberline in Rodna Mts is 500–600 m lower than the potential timberline on both slopes. Several studies concluded that upper climatic timberline should coincide approximately with the position of the 5–7.5 °C isotherm representing the average temperature of the growing season [101], or with the position of the 10 °C isotherm representative of average July temperature [25,102]. Based on these parameters, the climatic limit for timberline in the Rodna Mts is located at an average elevation of 1750 m on the northern slope and 1890 m on the southern slope.
Our results show that for the period 1887–2018 timberline shifted upwards on average by 0.86 m yr−1 on the northern slope and by 1.39 m yr−1 on the southern slope. Taking into account this rate of timberline ascent, as well as similar findings from published studies [16,55,103], we estimate that upper timberline advance will be slower on the northern slope compared to the southern (Figure 8). On the northern slope, less affected by anthropogenic impact, average timberline is currently 150–160 m lower than natural timberline. Conversely, on the southern slope, more affected by anthropogenic activities, upper timberline is 400–415 m below its potential position.
The rise in timberlines in our study area will drastically reduce the grazing areas and might result in an increased grazing pressure on the remaining high elevation meadows. Furthermore, the reduction in subalpine and alpine meadows, which are biodiversity hotspots, and encroachment of former grazing areas will likely shrink the habitat of many endemic and relict subalpine and alpine plant species (e.g., Lychnis nivalis, Fritillaria Meleagris, Leontopodium alpinum, Trollius europaeus, Hepatica transsilvanica, Gentiana lutea) and likely reduce the diversity of high-elevation fauna (e.g., M. marmota, Rupicapra rupicapra, Aquila chrysaetos) with critical ecological consequences.
5. Conclusions
Regional climate warming creates ecological effects that are still insufficiently known and assessed, particularly in the Romanian Carpathians. Upper timberline is an environment very sensitive to temperature variability, but also to anthropogenic pressure, and its continuous dynamics can carry important information about the intensity, duration and impacts of these drivers. Results show that upper timberline dynamics in Rodna Mts between 1887 and 2018 were shaped mostly by the thermal factor and the rhythm of human activities but separating the impact of these drivers was difficult to achieve. The increase in the weight of the temperature and the rhythmic fluctuations of the anthropic activity and in the balance of the determinant factors constituted the key of the general ascent in altitude of the timberline in the Rodna Mts. Our study shows that after the Little Ice Age climate warming trends (marked by a series of fluctuations) and the accelerated warming after 1975 were more clearly reflected in upper timberline ascent in Rodna Mts. The cartographic analysis results show an unexpected situation, with a higher timberline position on the colder and shaded northern slope, and a lower position on the warmer and sunnier southern slope. This difference is likely due to anthropogenic land-use change, more prevalent on the more accessible southern slope. Rising temperature likely pushed timberline to higher elevation; however, land morphometry locally constrained timberline advance. Furthermore, the differences in anthropogenic impact on the two main slopes of the massif, i.e., more limited on the steeper, shaded northern slope, further enhanced local differences in timberline dynamics. Due to these factors, upper timberline rose on average between 1887 and 2018 by 113 ± 2 m on the northern slope (reaching 1640 ± 2 m a.s.l.) and by 182 ± 2 m on the southern slope (reaching 1539 ± 2 m a.s.l.). Changing the weight of temperature and anthropogenic influence in the balance of determinants was the key to the oscillating rise of timberline. Quantifying the real influence of the weight of factors (thermal versus anthropogenic) that influence timberline, especially in mountain ranges with strong human pressure, becomes a necessity in the context of profile research in Rodna, Carpathians or elsewhere.
Author Contributions
Conceptualization, D.M.; methodology, D.M. and P.-I.B.; investigation, D.M., P.-I.B. and V.-D.H.; data curation, D.M.; writing—original draft preparation, D.M.; writing—review and editing, D.M.; visualization, P.-I.B. and V.-D.H. All authors have read and agreed to the published version of the manuscript. Due to important field and laboratory work, P.-I.B. is to be considered, together with D.M., as one of the principal authors.
Funding
This research received no external funding.
Informed Consent Statement
Informed consent was obtained from all subjects involved in the study.
Data Availability Statement
The data presented in this study are available on request from the corresponding author. The data are not publicly available, but they can be made available in the form of synthesized statistical indices. These indices were the basis for the tabular and graphic materials in the paper.
Conflicts of Interest
The authors declare no conflict of interest.
References
- Masson-Delmotte, V.; Zhai, P.; Pörtner, H.-O.; Roberts, D.; Skea, J.; Shukla, P.R.; Pirani, A.; Moufouma-Okia, W.; Péan, C.; Pidcock, R.; et al. Summary for Policymakers. Global Warming of 1.5 °C; W.M.O.: Geneva, Switzerland, 2018; p. 32. [Google Scholar]
- Pauli, H.; Gottfried, M.; Dullinger, S.; Abdaladze, O.; Akhalkatsi, M.; Alonso, J.L.B.; Coldea, G.; Dick, J.; Erschbamer, B.; Calzado, R.F.; et al. Recent plant diversity changes on Europe’s mountain summits. Science 2012, 336, 353–355. [Google Scholar] [CrossRef]
- Steinbauer, M.J.; Grytnes, J.A.; Jurasinski, G.; Kulonen, A.; Lenoir, J.; Pauli, H.; Rixen, C.; Winkler, M.; Bardy-Durchhalter, M.; Barni, E.; et al. Accelerated increase in plant species richness on mountain summits is linked to warming. Nature 2018, 556, 231–234. [Google Scholar] [CrossRef]
- UN Environment Programme—Environment for Development. Available online: https://www.unep.org/resources/report/carpathian-environment-outlook (accessed on 20 December 2019).
- Alberton, M.; Andresen, M.; Citadino, F.; Egerer, H.; Fritsch, U.; Götsch, H.; Hoffmann, C.; Klemm, J.; Mitrofanenko, A.; Musco, E.; et al. Outlook on Climate Change Adaptation in the Carpathian Mountains; United Nations Environment Programme: Nairobi, Kenya; GRID-Arendal: Arendal, Norway; Eurac Research: Bolzano, Italy, 2017; p. 54. [Google Scholar]
- Beniston, M.; Diaz, H.F.; Bradley, R.S. Climatic change at high elevation sites: An overview. Clim. Chang. 1997, 36, 233–251. [Google Scholar] [CrossRef]
- Harsch, M.A.; Hulme, P.E.; McGlone, M.S.; Duncan, R.P. Are treelines advancing? A global meta-analysis of treeline response to climate warming. Ecol. Lett. 2009, 12, 1040–1049. [Google Scholar]
- Holtmeier, F.K. Mountain Timberlines. In Advances in Global Change Research; Springer: Dordrecht, The Netherlands, 2009; Volume 36. [Google Scholar]
- Theurillat, J.P.; Guisan, A. Potential Impact of Climate Change on Vegetation in the European Alps: A Review. Clim. Chang. 2001, 50, 77–109. [Google Scholar] [CrossRef]
- Feurdean, A.; Geantă, A.; Tanțău, I.; Auer, A.; Hutchinson, S.M. Determining the sensitivity of the high mountain region in Northern Romania to climate and land use changes through multi-proxy analysis. In Proceedings of the EGU General Assembly, Vienna, Austria, 7–12 April 2013; Geophysical Research Abstracts. Volume 15, p. 12378. [Google Scholar]
- Feurdean, A.; Florescu, G.; Vannière, B.; Tanţău, I.; O’Hara, R.B.; Pfeiffer, M.; Hutchinson, S.M.; Gałka, M.; Moskal-del Hoyo, M.; Hicklera, T. Fire has been an important driver of forest dynamics in the Carpathian Mountains during the Holocene. For. Ecol. Manag. 2017, 389, 15–26. [Google Scholar] [CrossRef]
- Geantă, A.; Gałka, M.; Tanţău, I.; Hutchinson, S.M.; Mîndrescu, M.; Feurdean, A. High mountain region of the Northern Romanian Carpathians responded sensitively to Holocene climate and land use changes: A multi-proxy analysis. Holocene 2014, 24, 944–956. [Google Scholar] [CrossRef]
- Körner, C. Alpine Treelines: Functional Ecology of the Global High Elevation Tree Limits, 2012th ed.; Springer: Basel, Switzerland, 2012; p. 220. [Google Scholar]
- Gehrig-Fasel, J.; Guisan, A.; Zimmermann, N.E. Tree line shifts in the Swiss Alps: Climate change or land abandonment? J. Veg. Sci. 2007, 18, 571–582. [Google Scholar] [CrossRef]
- Holtmeier, F.-K.; Broll, G. Treeline advance—Driving processes and adverse factors. Landsc. Online 2007, 1, 1–33. [Google Scholar] [CrossRef]
- Weisberg, P.J.; Shandra, O.; Becker, M.E. Landscape Influences on Recent Timberline Shifts in the Carpathian Mountains: Abiotic Influences Modulate Effects of Land-Use Change. Arct. Antarct. Alp. Res. 2013, 45, 404–414. [Google Scholar] [CrossRef]
- Spyt, B.; Kaczka, R.J.; Lempa, M.; Rączkowska, Z. Application of timberline morphometric analysis for detecting snow avalanche paths: A case study of the Tatra Mountains. Geogr. Pol. 2016, 89, 91–111. [Google Scholar] [CrossRef]
- Grigor’ev, A.A.; Devi, N.M.; Kukarskikh, V.V.; V’yukhin, S.O.; Galimova, A.A.; Moiseev, P.A.; Fomin, V.V. Structure and Dynamics of Tree Stands at the Upper Timberline in the Western Part of the Putorana Plateau. Russ. J. Ecol. 2019, 50, 311–322. [Google Scholar] [CrossRef]
- Suarez, F.; Binkley, D.; Kaye, M.W.; Stottlemyer, R. Expansion of forest stands into tundra in the Noatak National Preserve, northwest Alaska. Ecoscience 1999, 6, 465–470. [Google Scholar] [CrossRef]
- Jobbágy, E.G.; Jackson, R.B. Blackwell Science, Ltd Global controls of forest line elevation in the northern and southern hemispheres. Glob. Ecol. Biogeogr. 2000, 9, 253–268. [Google Scholar] [CrossRef]
- Gamache, I.; Payette, S. Latitudinal response of subarctic tree lines to recent climate change in eastern Canada. J. Biogeogr. 2005, 32, 849–862. [Google Scholar] [CrossRef]
- Miehe, G.; Miehe, S.; Vogel, J.; Co, S.; La, D. Highest Treeline in the Northern Hemisphere Found in Southern Tibet. Mt. Res. Dev. 2007, 27, 169–173. [Google Scholar] [CrossRef]
- Bachelet, D.; Neilson, R.P. Biome Redistribution Under Climate Change. In The Impact of Climate Change on America’s Forests: A Technical Document Supporting the 2000 USDA Forest Service RPA Assessment; General Technical Report RMRS-GTR 59; U.S. Department of Agriculture, Forest Service, Rocky Mountain Research Station: Fort Collins, CO, USA, 2000; pp. 18–44. [Google Scholar]
- Rupp, T.S.; Starfield, A.M.; Chapin, F.S., III. Response of Subarctic vegetation to transient climatic change on the Seward Peninsula in north-west Alaska. Glob. Chang. Biol. 2001, 6, 541–555. [Google Scholar] [CrossRef]
- Grace, J.; Berninger, F.; Nagy, L. Impacts of Climate Change on the Tree Line. Ann. Bot. 2002, 90, 537–544. [Google Scholar]
- Holtmeier, F.-K.; Broll, G. Sensitivity and response of northern hemisphere altitudinal and polar treelines to environmental change at landscape and local scales. Glob. Ecol. Biogeogr. 2005, 14, 395–410. [Google Scholar] [CrossRef]
- Armbruster, S.W.; Rae, D.A.; Edwards, M.E. Topographic complexity and terrestrial biotic response to high-latitude climate change: Variance is as important as the mean. In Arctic Alpine Ecosystems and People in a Changing Environment; Springer: Berlin, Germany, 2007; Volume 7, pp. 105–121. [Google Scholar]
- Cullen, L.E.; Palmer, J.; Duncan, R.P.; Stewart, G.H. Climate change and tree-ring relationships of Nothofagus menziesii tree-line forests. Can. J. For. Res. 2001, 31, 1981–1991. [Google Scholar] [CrossRef]
- Cullen, L.E.; Stewart, G.H.; Duncan, R.P.; Palmer, J.G. Disturbance and climate warming influences on New Zealand Nothofagus tree-line population dynamics. J. Ecol. 2001, 89, 1061–1071. [Google Scholar] [CrossRef]
- Wang, T.; Zhang, Q.; Ma, K. Treeline dynamics in relation to climatic variability in the central Tianshan Mountains, northwestern China. Glob. Ecol. Biogeogr. 2006, 15, 406–415. [Google Scholar] [CrossRef]
- Stankoviansky, M.; Barka, I. Geomorphic response to environmental changes in the Slovak Carpathians. Studia Geomorphologica Carpatho-Balcanica 2007, 41, 5–28. [Google Scholar]
- Sitko, I.; Troll, M. Timberline changes in relation to summer farming in the western Chornohora (Ukrainian Carpathians). Mt. Res. Dev. 2008, 28, 263–271. [Google Scholar] [CrossRef]
- Vitali, A.; Garbarino, M.; Camarero, J.J.; Malandra, F.; Toromani, E.; Spalevic, V.; Čurović, M.; Urbinati, C. Pine recolonization dynamics in Mediterranean human-disturbed treeline ecotones. For. Ecol. Manag. 2019, 435, 28–37. [Google Scholar] [CrossRef]
- Vitali, A.; Camarero, J.J.; Garbarino, M.; Piermattei, A.; Urbinati, C. Deconstructing human-shaped treelines: Microsite topography and distance to seed source control Pinus nigra colonization of treeless areas in the Italian Apennines. For. Ecol. Manag. 2017, 406, 37–45. [Google Scholar] [CrossRef]
- Beniston, M. The effect of global warming on mountain regions: A summary of the 1995 report of the Intergovernmental Panel on Climate Change. Global change and protected areas. Adv. Clim. Chang. Res. 2001, 9, 155–185. [Google Scholar]
- Kullman, L.; Oberg, L. Post-Little Ice Age tree line rise and climate warming in the Swedish Scandes: A landscape ecological perspective. J. Ecol. 2009, 97, 415–429. [Google Scholar] [CrossRef]
- Holtmeier, F.-K. Geoökologische Beobachtungen und Studien an der subarktischen und alpinen Waldgrenze in vergleichender Sicht (nördliches Fennoskandien/Zentralalpen). In Erdwissenschaftliche Forschung; Steiner Verlag: Wiesbaden, Germany, 1974; Volume 8. [Google Scholar]
- Holtmeier, F.-K. Introduction to the Upper Engadine and its forest. In Proceedings of The International Workshop on Subalpine Stone Pines and Their Environment: The Status of Our Knowledge, St. Moritz, Switzerland, 5–11 September 1992; General Technical Report, INT-GTR-309; Schmidt, W.C., Holtmeier, F.-K., Eds.; USDA Forest Service, Intermountain Research Station: Ogden, UT, USA, 1994; pp. 9–17. [Google Scholar]
- Holtmeier, F.-K. Ecological aspects of climatically-caused timberline fluctuations. In Mountain Environments in Changing Climates; Beniston, M., Ed.; Routledge: London, UK, 1994; pp. 220–233. [Google Scholar]
- Holtmeier, F.-K. Mountain Timberlines—Ecology, Patchiness, and Dynamics, Advances in Global Change Research; Kluwer Academic Publishers: Dordrecht, The Netherlands, 2003; Volume 14, p. 384. [Google Scholar]
- Oksanen, L.; Moen, J.; Helle, T. Timberline patterns in northernmost Fennoscandia. Relative importance of climate and grazing. Acta Bot. Fenn. 1995, 153, 93–105. [Google Scholar]
- Aas, B.; Faarlund, T. The present and the Holocene birch belt in Norway. In Paleoclimate Research; Frenzel, B., Alm, V., Eds.; Fischer: Innsbruck, Austria, 1996; pp. 19–42. [Google Scholar]
- French, D.D.; Miller, G.R.; Cummins, R.R. Recent development of high altitude Pinus sylvestris scrub in the northern Cairngorm Mountains, Scotland. Biol. Conserv. 1997, 79, 133–144. [Google Scholar] [CrossRef]
- Stützer, A. Die Wald—Und Baumgrenze der Saualpe: Ein Vergleich alter und neuer Bilder. Forstwiss Centralbl 2000, 119, 20–31. [Google Scholar] [CrossRef]
- Stützer, A. Zwischen subalpinem Wald und alpiner Tundra. Eine Studie zur Struktur und Dynamik des Fichten-Waldes auf der Saualpe (Kärnten). Wulfenia 2002, 9, 89–104. [Google Scholar]
- Bryn, A.; Daugstad, K. Summer Farming in the subalpine Birch Forest, Nordic Mountain Birch Ecosystem. UNESCO Man Biosph. Ser. 2001, 27, 307–315. [Google Scholar]
- Müterthies, A. Struktur und Dynamik der oberen Grenze des Lärchen-Arvenwaldes im Bereich aufgelassener Alpweiden im. Oberengadin. Bachelor’ Thesis, Institut für Landschaftsökologie, Westfälische Wilhelms-Universität,, Münster, Germany, 2002. [Google Scholar]
- Müterthies, A. The potential timberline: Determination with dendrochronological methods. TRACE—Tree rings in archaeology, climatology and ecology 1. In Proceedings of the Dendro-Symposium 2003, Bonn, Germany, 11–13 April 2003; pp. 94–100. [Google Scholar]
- Ameztegui, A.; Coll, L.; Brotons, L.; Ninot, J.M. Land-use legacies rather than climate change are driving the recent upward shift of the mountain tree line in the Pyrenees. Glob. Ecol. Biogeogr. 2016, 25, 263–273. [Google Scholar] [CrossRef]
- Piermattei, A.; Lingua, E.; Urbinati, C.; Garbarino, M. Pinus nigra anthropogenic treelines in the central Apennines show common pattern of tree recruitment. Eur. J. For. Res. 2016, 135, 1119–1130. [Google Scholar] [CrossRef]
- Kozak, J. Forest cover change in the western Carpathians in the past 180 years: A case study in the Orawa region in Poland. Mt. Res. Dev. 2003, 23, 369–375. [Google Scholar] [CrossRef]
- Wężyk, P.; Guzik, M. The Use of Photogrammetry-GIS (P-GIS) for the Analysis of Changes in the Tatra Mountains’ Natural Environment; Widacki, W., Bytnerowicz, A., Riebau, A. , Eds.; A message from the Tatra. Geographical Information Systems and Remote Sensing in Mountain Environmental Research; Jagiellonian University Press—USDA Forest Service: Kraków, Poland; Riverside, CA, USA, 2014; pp. 31–46.
- Dezső, Z.; Pongracz, R.; Bartholy, J.; Barcza, Z. Analysis of land-use/land-cover change in the Carpathian Region based on remote sensing techniques. Phys. Chem. Earth 2005, 30, 109–115. [Google Scholar] [CrossRef]
- Paterek, A.; Olędzki, J.R. Changes of the limits associations of vegetation in the Tatra Mountains during 1977–1999 [in Polish with English abstract]. Teledetekcja Środowiska 2005, 36, 106–118. [Google Scholar]
- Mihai, B.; Savulescu, I.; Sandric, I. Change detection analysis (1986–2002) of vegetation cover in Romania: A study of alpine, subalpine, and forest landscapes in the Iezer Mountains, Southern Carpathians. Mt. Res. Dev. 2007, 27, 250–258. [Google Scholar] [CrossRef]
- Kricsfalusy, V.; Mróz, W.; Popov, S. Historical changes of the upper tree line in the Carpathian Mountains (Ukraine). Mt. Forum Bull. 2008, 8, 15–17. Available online: http://lib.icimod.org/record/12763/files/1087.pdf (accessed on 3 August 2019).
- Popa, I.; Kern, Z. Long-term summer temperature reconstruction inferred from tree ring records from the Eastern Carpathians. Clim. Dyn. 2008, 32, 1107–1117. [Google Scholar] [CrossRef]
- Shandra, O.; Weisberg, P.; Martazinova, V. Influences of Climate and Land Use History on Forest and Timberline Dynamics in the Carpathian Mountains During the Twentieth Century. In The Carpathians: Integrating Nature and Society Towards Sustainability, Environmental Science and Engineering; Kozak, J., Katarzyna, O., Bytnerowicz, A., Wyżga, B., Eds.; Springer-Verlag: Berlin/Heidelberg, Germany, 2013; pp. 209–293. [Google Scholar]
- Martazinova, V.; Ivanova, O.; Shandra, O. Climate and treeline dynamics in the Ukrainian Carpathians Mts. Folia Oecologica 2011, 38, 65–71. [Google Scholar]
- Kolischuk, V. Suchasna Verhnya Meja Lisu v Ukrainskyh Karpatah; Сучасна верхня межа лісу в Українських Карпатах—Today is the upper boundary of the forest in the Ukrainian Carpathians—In English; Vydavnytstvo Akademii Nauk URSR: Kyiv, Ukraine, 1958; p. 47. [Google Scholar]
- Kozak, J. Land Use Change in the Northern Carpathians, Alpine space—Man & environment. In Global Change and Sustainable Development in Mountain Regions; Jandl, R., Borsdorf, A., Van Miegroet, H., Lackner, R., Psenner, R., Eds.; Innsbruck University Press: Innsbruck, Austria, 2009; Volume 7, pp. 94–96. [Google Scholar]
- UNEP. Carpathians Environment Outlook (KEO). 2007. Available online: https://www.unep.org/resources/report/carpathians-environment-outlook-2007 (accessed on 23 November 2019).
- Kucsicsa, G.; Balteanu, D. The influence of man-induced land-use change on the upper forest limit in the Romanian Carpathians. Eur. J. For. Res. 2020, 139, 893–914. [Google Scholar] [CrossRef]
- Management Plan of Rodna Mountains National Park. 2017. Available online: http://mmediu.ro/app/webroot /uploads/files /Anexa_1_Planul_de_management_al_PNMR.pdf, (accessed on 6 December 2019).
- Ielenicz, M.; Pătru, I. Geografia Fizică a Romaniei (Physical Geography of Romania); University Publishing House: Bucharest, Romania, 2005; p. 256. (In Romanian) [Google Scholar]
- Corine Land Cover data of 2018. Available online: https://land.copernicus.eu/pan-european/corine-land-cover/clc2018 (accessed on 3 December 2019).
- Kucsicsa, G. Considerations on the timberline in the Rodna Mountains National Park. Rev. Roum. Géogr. Rom. Journ. Geogr. 2011, 55, 57–61. [Google Scholar]
- Feurdean, A.; Gałka, M.; Tanţău, I.; Geantă, A.; Hutchinson, S.M.; Hickler, T. Tree and timberline shifts in the northern Romanian Carpathians during the Holocene and the responses to environmental changes. Quat. Sci. Rev. 2016, 134, 100–113. [Google Scholar] [CrossRef]
- National Institute of Statistics, TEMPO ONLINE Database. Available online: http://statistici.insse.ro:8077/tempo-online/#/pages/tables/insse-table (accessed on 6 October 2019).
- Van der Maarel, E. Ecologische Aspecten van de Grondwaterhuishouding in Oost-Gelderland, Rep; Commissie Bestudering Waterhuishouding Gelderland: Arnhem, Germany, 1975; p. 30. [Google Scholar]
- Tinner, W.; Theurillat, J.P. Uppermost limit, extent, and fluctuations of the timberline and treeline ecocline in the Swiss Central Alps during the past 11500 Years. Arct. Antarct. Alp. Res. 2003, 35, 158–169. [Google Scholar] [CrossRef]
- Set 1 of Maps from 1887. Übersichtsblatt der Spezialkarte der Österreichisch-Ungarischen Monarchie 1:75.000. Available online: https://mapire.eu/en/map/thirdsurvey75000/?layers=here-aerial%2C43&bbox=2743367.7110242564%2C6034629.643873994%2C2794924.486602608%2C6049917.049531029 (accessed on 6 October 2019).
- Set 2 of Maps from 1921. Planurile Directoare de Tragere (Romanian Military Maps) 1:20.000. Available online: http://www.geo-spatial.org/download /planurile-directoare-de-tragere (accessed on 17 March 2016).
- Set 3 of Maps from 1945. Middle Danube 1: 100.000 Army Map Service Wasington DC1944. Available online: http://maps.mapywig. org/m/ALLIED_maps/series/AMS_M641A_GSGS4416_Central _Europe_ 100K/ AMS_M671S_GSGS_4416_Middle_Danube_100K_Y-19_Borsa_ 1944.jpg (accessed on 24 October 2016).
- Set 4 of maps from 1961. Archive of the library of the Department of Geography, Faculty of History and Geography, Stefan cel Mare University of Suceava. Topographic Maps of Romania. Ministry of Armed Forces of the People’s Republic of Romania, Military Topographic Directorate, 1:25.000 (accessed several times during 2016–2020). (in file)
- Set 5 of maps from 1984. Archive of the library of the Department of Geography, Faculty of History and Geography, Stefan cel Mare University of Suceava. Topographic Maps of Romania. Ministry of Armed Forces of the Socialist Republic of Romania. Military Topographic Directorate. Second edition. 1:25.000 (accessed several times during 2016–2020). (in file)
- Set 1 of Aerial Photographs (Ortophotoplans) from 2012. ANCPI. Available online: http://geoportal.ancpi. ro/ geoportal/imobile /Harta.html (accessed on 26 October 2017).
- Set 2 of Aerial Photographs (Ortophotoplans) from 2018. ANCPI. Available online: http://geoportal. ancpi.ro/geoportal/imobile/ Harta.html (accessed on 6 September 2019).
- MODIS Database from 2018. Available online: https://earthobservatory.nasa.gov/global-maps /MOD14A1_M_FIRE (accessed on 9 November 2019).
- Sen, P.K. Estimates of the regression coefficient based on Kendall’s Tau. J. Am. Stat. Assoc. 1968, 63, 1379–1389. [Google Scholar] [CrossRef]
- Salmi, T.; Maatta, A.; Anttila, P.; Airola, T.R.; Amnell, T. Detecting Trends of Annual Values of Atmospheric Pollutants by the Mann-Kendall Test and Sen’s Slope Estimates: The Excel Template Application Makesens, Finnish Meteorological Institute. Publ. Air Qual. 2002, 31, 1–35. [Google Scholar]
- CRU TS Version 4.02. Available online: https://crudata.uea.ac.uk/cru/data/hrg/cru_ts_4.02/ (accessed on 2 November 2019).
- Brinkmann, W. Growing season length as an indicator of climatic variations. Clim. Chang. 1979, 2, 127–138. [Google Scholar] [CrossRef]
- Liang, E.; Camarero, J.J. Threshold-dependent and non-linear associations between temperature and tree growth at and below the alpine treeline. Trees 2018, 32, 661–662. [Google Scholar] [CrossRef]
- Morariu, T. Viaţa pastorală din Munţii Rodnei, in Romanian (Pastoral life in the Rodnei Mountains)—In Romanian. Societatea Regală Română de Geografie. Studii şi Cercet. Geogr. 1937, II, 240. [Google Scholar]
- Miron, M.S. Cercetări Privind Mecanismele de Adaptare Ale Unor Specii de Conifere la SchimbăRile Climatice (Research on the Mechanisms of Ad-Aptation of Some Species of Conifers to Climate Change). Ph.D. Thesis, Banat University of Agricultural Sciences and Veterinary Medicine’ King Mihai I of Romania from Timisoara, Timisoara, Romania, 2019. (In Romanian). [Google Scholar]
- Popa, I. Fundamente Metodologice şi AplicaţII de Dendrocronologie (Methodological Foundations and Dendrochronology Applications); Forestry Technical Publishing House: Bucharest, Romania, 2003; p. 194. [Google Scholar]
- Kozak, J.; Estreguil, C.; Troll, M. Forest cover changes in the northern Carpathians in the 20th century: A slow transition. J. Land Use Sci. 2007, 22, 127–146. [Google Scholar] [CrossRef]
- Coldea, G. Munţii Rodnei. Studiu Geobotanic (Rodnei Mountains. Geobotanical Study); Academy Publishing House: Bucharest, Romania, 1990; p. 183. [Google Scholar]
- Florescu, G.; Vannière, B.; Feurdean, A. Exploring the influence of local controls on fire activity using multiple charcoal records from northern Romanian Carpathians. Quat. Int. 2018, 488, 41–57. [Google Scholar] [CrossRef]
- Florescu, G.; Brown, K.J.; Carter, V.A.; Feurdean, A. Holocene rapid climate changes and ice-rafting debris events reflected in high-resolution European charcoal records. Quat. Sci. Rev. 2019, 222, 105877. [Google Scholar] [CrossRef]
- Haliuc, A.; Hutchinson, S.M.; Florescu, G.; Feurdean, A. The role of fire in landscape dynamics: An example of two sediment records from the Rodna Mountains, northern Romanian Carpathians. Catena 2016, 137, 432–440. [Google Scholar] [CrossRef]
- MacDonald, D.; Crabtree, J.R.; Wiesinger, G.; Dax, T.; Stamou, N.; Fleury, P.; Lazpita Gutierrez, J.; Gibon, A. Agricultural abandonment in mountainareas of Europe: Environmental consequences and policy response. J. Environ. Manag. 2000, 59, 47–69. [Google Scholar] [CrossRef]
- Hunziker, M. The spontaneous reafforestation in abandoned agricultural lands: Perception and aesthetic assessment by locals and tourists. Landsc. Urban. Plan. 1995, 31, 399–410. [Google Scholar] [CrossRef]
- Didier, L. Invasion patterns of European larch and Swiss stone pine in subalpine pastures in the French Alps. For. Ecol. Manag. 2001, 145, 67–77. [Google Scholar] [CrossRef]
- Motta, R.; Nola, P. Growth trends and dynamics in sub-alpine forest stands in the Varaita Valley (Piedmont, Italy) and their relationship with human activities and global change. J. Veg. Sci. 2001, 12, 219–230. [Google Scholar]
- Bunce, R.G.H.; Pérez-Soba, M.; Jongman, R.H.G.; Gómez Sal, A.; Herzog, F.; Austad, I. Transhumance and Biodiversity in European Mountains; Report from the EU-FP5 Project TRANSHUMOUNT A review of the role of transhumance in mountain ecosystem processand dynamics (EVK2-CT-2002-80017); Wageningen Environmental Research (Alterra): Wageningen, The Netherlands, 2004; pp. 25–29. [Google Scholar]
- Rybníčková, E.; Rybníček, K. Czech and Slovak Republics. Palaeoecological Events During the Last 15,000 Years. In Regional Syntheses of Palaeoecological Studies of Lakes and Mires in Europe; Berglund, B.E., Birks, H.J.B., Ralskajasiewiczowa, M., Wright, H.E., Eds.; John Wiley & Sons: Chichester, UK, 1996; pp. 473–505. [Google Scholar]
- Jones, P.D.; Briffa, K.R.; Barnett, T.P.; Tett, S.F.B. High resolution palaeoclimatic records for the last millennium: Integration, interpretation and comparison with General Circulation Model control run temperatures. Holocene 1998, 8, 455–471. [Google Scholar] [CrossRef]
- Mann, M.E.; Bradley, R.S. Northern Hemisphere Temperatures During the Past Millennium: Inferences, Uncertainties, and Limitations. Geophys. Res. Lett. 1999, 26, 759–762. [Google Scholar] [CrossRef]
- Körner, C. A re-assessment of high elevation treeline positions and their explanation. Oecologia 1998, 115, 445–459. [Google Scholar] [CrossRef] [PubMed]
- Grace, J.; Allen, S.J.; Wilson, C. Climate and the meristem temperatures of plant communities near the tree-line. Oecologia 1989, 79, 198–204. [Google Scholar] [CrossRef] [PubMed]
- Chen, I.C.; Hill, J.K.; Ohlemüller, R.; Roy, D.B.; Thomas, C.D. Rapid range shifts of species associated with high levels of climate warming. Science 2011, 333, 1024–1026. [Google Scholar] [CrossRef] [PubMed]


Publisher’s Note: MDPI stays neutral with regard to jurisdictional claims in published maps and institutional affiliations. |
© 2021 by the authors. Licensee MDPI, Basel, Switzerland. This article is an open access article distributed under the terms and conditions of the Creative Commons Attribution (CC BY) license (http://creativecommons.org/licenses/by/4.0/).