Article

Teacher Digital Literacy: The Indisputable Challenge after COVID-19

by
Cristina Sánchez-Cruzado
1,
Raúl Santiago Campión
2,* and
Mª Teresa Sánchez-Compaña
1
1
Department of Didactics of Mathematics, Social Sciences and Experimental Sciences, Faculty of Education Sciences, University of Málaga, Teatinos Campus, 29071 Málaga, Spain
2
Department of Educational Sciences, University of La Rioja, C/Luis de Ulloa Nº 2, 26004 Logroño, Spain
*
Author to whom correspondence should be addressed.
Sustainability 2021, 13(4), 1858; https://doi.org/10.3390/su13041858
Submission received: 12 November 2020 / Revised: 4 February 2021 / Accepted: 4 February 2021 / Published: 8 February 2021
(This article belongs to the Special Issue Sustainability Pedagogies for Training with Technologies)

Abstract

:
The COVID-19 outbreak opened a new scenario where teachers must have adequate digital literacy to teach online and to implement a current and innovative educational model. This paper provides the most relevant results obtained from a quantitative study in which 4883 Spanish teachers of all education levels participated to measure their digital skills, during the last school years. It also proposes a digital skills teacher training plan, taking the joint framework of digital skills of INTEF (Spanish acronym for National Institute of Educational Technologies and Teacher Training) as its reference point. The tool ACDC (Analysis of Common Digital Competences) was used for data collection. The results of descriptive analysis show, overall, the low self-perception that teachers have of their digital skills. In addition, this paper studies the relationship existing between the characteristics that define the population and the teachers’ digital skills level. This relationship is obtained through a multiple linear regression model. The study reveals that digital literacy is not a reality that has favored the teaching–learning process and that a training program is urgently required for teachers to reach optimal levels of digital skills, so as to undergo a true paradigm shift, ultimately combining methodology and educational strategies.

1. Introduction

During the month of March 2020, a “state of alarm” was declared to manage an unprecedented world-wide health crisis caused by the outbreak of the SARS-COVID-2 and, with it, the illness COVID-19. In Spain, this situation was legislated through the Royal Decree 463/2020 [1].
In accordance with the data provided by UNESCO 2020, more than 1500 million students all over the world, and their corresponding teachers, were confined for this reason during the academic year 2019–2020, causing an unprecedented situation [2].
From that moment on, all face-to-face activities were canceled. Teaching was shifted to a virtual format and, in many cases, directly interrupted. The first few weeks only the most intrepid teachers or, rather, those professionals who were digitally adept, continued teaching. When it became apparent that the return to the classrooms would not be soon, the local educational authorities drew up some guidelines to help teachers in their transition to online teaching. Upon having confirmation that the school year would finish in a virtual format, these guidelines turned into requirements. Faculty at all academic levels were compelled to undertake an urgent adaptation of methodologies, subject content, and teaching materials, seeking a change to online teaching at an unprecedented rate, which was considered emergency remote teaching [3].
This created a sort of educational catharsis which clearly revealed the significant shortcomings of the Spanish educational system, and of the teaching staff in particular, with regard to digital literacy. Most teachers were urged to innovate with the help of Information and Communication Technologies (ICT), to use synchronous and asynchronous video, online assessment, collaborative learning tools, student tracking systems, communication with families, and many other resources. This meant an enormous challenge, unattainable for many for diverse reasons. Thus, both educational institutions and teachers have become aware that being digitally skillful is no longer an option but a real necessity.
Beyond the state of alarm, it is clear that a strong nexus between innovation and ICT exists. The educational system has shown deficiencies/limitations regarding school policies but also with the state of the teaching staff and the continuity of these types of initiatives [4]. The teaching staff would have required an adequate ongoing assessment of their teaching practice as a tool to improve and strengthen educational standards [5].
Usually, the digital competence of the teacher is revealed as clearly being essential, exceeding both in-depth and in length the most fundamental digital literacy, and encompassing other characteristics such as technological, informational, audio-visual, and communicational [6,7]. If this seems obvious in the daily work of a teacher, it is even more obvious in the current context due to technological, methodological, and organizational needs.
A competence is associated with the skills which are developed to use certain instruments or tools. It is also related to the ability to know how to reach an objective in certain contexts. It can even be understood as a selection of procedures or valid cognitive resources, or as a series of skills or specific capabilities, to solve a specific problem [8].
In accordance with Reference [9], 44.5% of the European Union population between 16 and 74 years old do not have enough digital skills to take part in society and in the economy. This figure is more than a third (37%) in the active labor market. Twelve percent of young Europeans between the ages of 11 and 16 are probably exposed to cyberbullying, a number that has increased since 2010. In this context, work, employability, education, leisure, inclusion, and participation in society, and many other areas of our society have been clearly transformed by digitalization. ICT should, therefore, be considered a necessary element for the development of our society, have an innovative nature, and have an impact on technological and cultural change [10].
The European Commission published the digital competence framework, also known by its acronym “DigComp”, for the first time in 2013. It only sought to be a tool to improve the digital competence of the population, to help lawmakers develop policies aimed at developing digital competencies, and to design initiatives for education and training in order to improve the digital skills of specific groups. “DigComp” also provided a common language on how to identify and describe the key areas of digital competence and, therefore, offered a joint framework at the European level. Based on this framework, the digital competence for educators “DigCompEdu” was also established [11].

1.1. Digital Competence Concept

A scenario full of challenges is posed for the student and teaching body. Working in a digital environment usually implies a more dynamic setting with all that entails [12]. On the one hand, students should be aware that the different areas of knowledge are part of a general digitalization process which allows that the way of living, of communicating, of interacting, of getting a future job, the way of learning and generating knowledge, have undergone an important change that should be overcome [13,14,15,16]. On the other hand, the teaching staff should be qualified to guide pupils in their learning process and in the handling of tools now just as much as in the future. Ultimately, they have to train their students for their future within the so-called “knowledge society” [17,18,19].
There are several definitions of the elements that are included in the digital competence. There are definitions of the implementation from an educational viewpoint [20], and of UNESCO’s communicative competence [21].
Authors like that of Reference [22] made a compilation of definitions concluding that digital competency explains the coinciding processes of what many authors understand as an ICT competence and also as an information literacy skill. These authors insist that we cannot only speak about the abilities to assess, to store, to retrieve information in a knowledge society but should also develop skills to adequately use this information and eventually transform it into knowledge, and to share it.
In 2006, digital competence was branded as a key skill by the European Commission, suggesting the following description: “Digital Competency implies the critical and safe use of Information and Communication Technology for work, leisure, and communication. Based on basic ICT abilities: computer use to recover, evaluate, store, produce, introduce, and exchange information and to communicate and participate in collaborative networks by means of the Internet” [23].
Regarding faculty, they have always required proper basic training that needs to be on an ongoing basis in the different facets of the ICT [24,25]. This issue becomes much more evident in circumstances such as those that occurred the past academic year, in a state of alarm due to COVID-19 where teaching inevitably took place in an online version.
The teaching community has become aware of the pressing need to be trained or to train themselves on this point. ICT had been presented as the tool that would help solve numerous problems of the teaching–learning process such as lack of interest and motivation, apart from encouraging cooperative work, social awareness, autonomy, and helping pupils become digitally literate, among other things [26]. However, teachers’ lack of competence in the use of ICT has hampered all or, at least, many of its possibilities. Technology is still not well integrated either in the day-to-day teaching strategies in the classroom or online. This was ascertained by all the difficulties that arose during the lockdown.
Thus, it is essential to carry out a rigorous diagnosis of the individual shortfalls of each teacher, both of their basic skills in furthering their expertise and of their basic skills in generating knowledge in this new setting [21]. The need for teacher training in the educational use of ICT is evident not only to meet the demands of a virtual format, which is key for genuine educational innovation but also to trigger real changes in educational processes [27].
According to the “DigComp” 2.0 framework, digital competencies have been grouped into five areas [28]. From the authors’ point of view, is in the context of these areas that teacher training should focus while examining those aspects where the weaknesses are greater. These areas are described below.

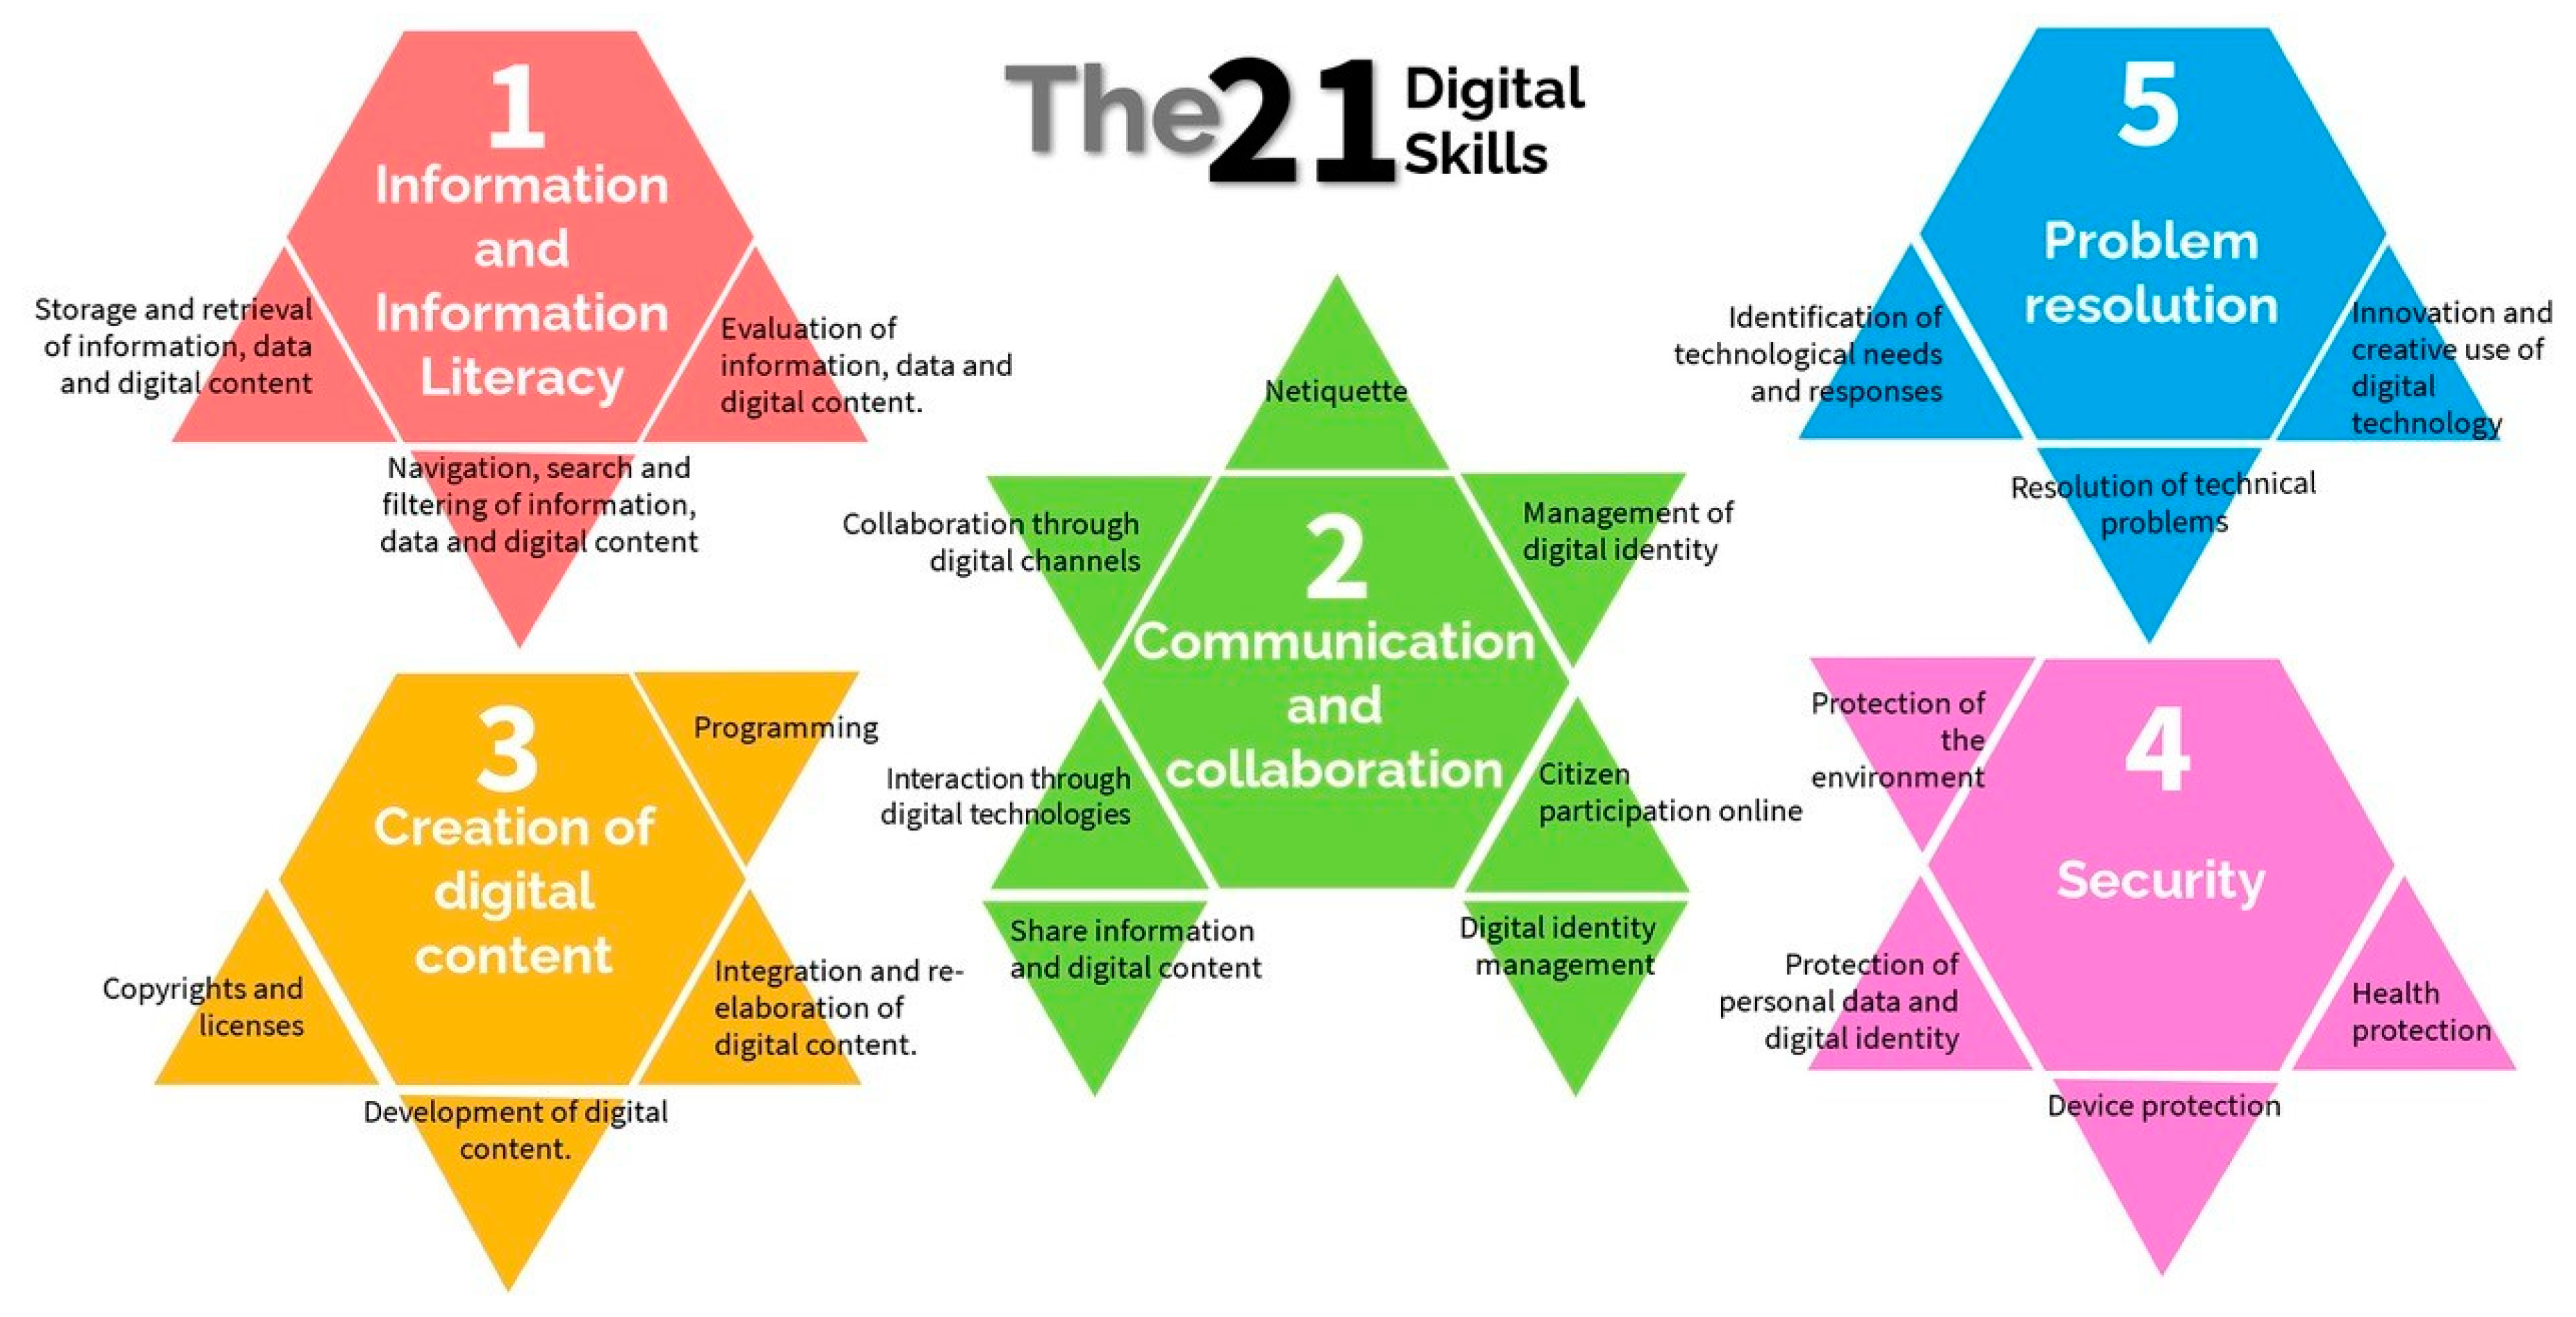
1.2. Digital Competency Areas

The Common Framework for Teaching Digital Competence is a reference framework for the diagnosis and improvement of teachers’ digital skills [28]. These skills are defined as competencies that 21st-century teachers need to improve educational practices and for ongoing professional development. The Common Framework for Teaching Digital Competence is made up of 5 competence areas and 21 structured competencies [28], updated and confirmed in the Official State Gazette [29]. Figure 1 shows the mentioned five areas, with the 21 digital competencies identified by INTEF (Spanish acronym for National Institute of Educational Technologies and Teacher Training) [28]. INTEF, National Institute of Educational Technologies and Teacher Training, is an institution belonging to the Ministry of Education, Culture, and Sport (MECD) of the Spanish government which is in charge of ICT Teachers’ Training.
The five areas that comprise the digital competence for teachers are set in the DigComp framework [28], also shown in Figure 1:
  • Information and Information Literacy: To identify, locate, retrieve, store, organize and analyze digital information, assessing its relevance and purpose for teaching needs.
  • Communication and Collaboration: To communicate in digital environments, share resources via online tools, connect and collaborate with others through digital tools, interact and participate in communities and networks; intercultural awareness.
  • Creation of Digital Content: To create and edit new digital content, integrate and rebuild prior knowledge and content, make artistic productions, multimedia content and computer programming, and know-how to apply intellectual property rights and licenses.
  • Security: For the protection of personal information and data, digital identity protection, digital content protection, security measures, and responsible and safe use of technology.
  • Problem Resolution: To identify needs in the use of digital resources, make informed decisions about the most appropriate digital tool depending on the purpose or need, solve conceptual problems through digital media or digital tools, use technology creatively, solve technical problems, and upgrade my own and others’ competence.
Within each area, there are other associated competencies focused on technical aspects, and technical and operational skills, which we consider more important than stipulating specific tools or resources that may change or not exist in the future [28].
The subject matter of the first, second, and third areas can be considered of linear type and that of the fourth and fifth areas of transversal type. In other words, while areas 1 to 3 focus on skills that can be matched to activities and specific uses, the other two refer to activities developed by means of the first three. Logically, areas 1, 2, and 3 are interconnected and, despite each area having its own context, there are several overlapping aspects and references to one another. The fifth area, “Problem Resolution” is, par excellence, the transversal competency dealing with an independent area in the INTEF framework [28]. Thereupon, the content regarding problem resolution can be found in any of the other areas. For example, we could claim that the field “Information and Information Literacy” includes the skill “Judging information” which is part of the cognitive dimension of “Problem Resolution”. “Communication and Collaboration” and the “Creation of Digital Content” bring together specific aspects of “Problem Resolution” (interacting, collaborating, creating content, integrating and re-elaborating, programming, etc.). Therefore, apart from including elements regarding problem resolution in important areas of competencies, it seems convenient to single out “Problem Resolution” as an independent competence because of the relevance it entails in the use of digital technologies and media [30].
In each area of digital competency, a series of skills have been incorporated that tend to be connected with it. The first skill in each area is the one that compiles aspects of a technological nature. In fact, in these specific competencies, expertise, skills, and attitudes include operational processes as the main component. Moreover, technical and operational abilities are incorporated, although always trying to refer to the functionality of the features and to avoid referring to specific tools that can be changed or be ceased in the near future of what has become to be called technological obsolescence.
Furthermore, digital literacy was also incorporated in the current Spanish legislation, in the Organic Law 8/2013 of December 9 for improving the quality of education as another competency to undertake, equivalent to the mathematical and scientific, linguistic, social, or artistic competencies. Based on these considerations, it is essential that teachers know how to use ICT in an instrumental manner and also as an integrated methodological model in the teaching–learning process. Teachers should work on that capability and use of the so-called technologies for learning and knowledge (TAC) which will progressively shape their own teacher digital literacy.
Improving teacher digital skills should have as its target improving those of their pupils. It is very important that students have acquired key skills by the end of their compulsory school period. This will make them the citizenry that the 21st-century society needs. It is, therefore, crucial that teachers reach a high level of digital literacy. It is a prerequisite to obtain excellence in the teaching profession [30,31,32].
To design a suitable teacher training plan that meets the teachers’ needs so as to obtain the highest levels of digital literacy, it is crucial to be able to successfully cope with circumstances that involve the use of technologies in teaching, not only in exceptional cases like those that occurred during the 2019–2020 school year but for any teaching practice. Thus, it is necessary to know exactly which the main shortcomings of the processing of information, communication and collaboration, creation of digital content, security, and/or problem resolution are, and to focus the training in the right direction or directions.

2. Materials and Methods

The main aim of this paper is to draw attention to the training needs of the teaching body in order to design an appropriate training program that effectively meets their needs while maintaining quality and helping to mitigate the limitations in digital literacy.
For this reason, the most relevant results of a study carried out between the years 2016 and 2019 have been used here. These results were drawn up from the responses to the validated questionnaire ACDC (Analysis of Common Digital Competences) [33,34,35]. More specifically the questionnaire aimed at:
  • Obtaining an accurate picture of the teachers’ perception of their digital competencies.
  • Analyzing the dependencies that could exist between the characteristics of the sample and the level of development of their digital competencies.
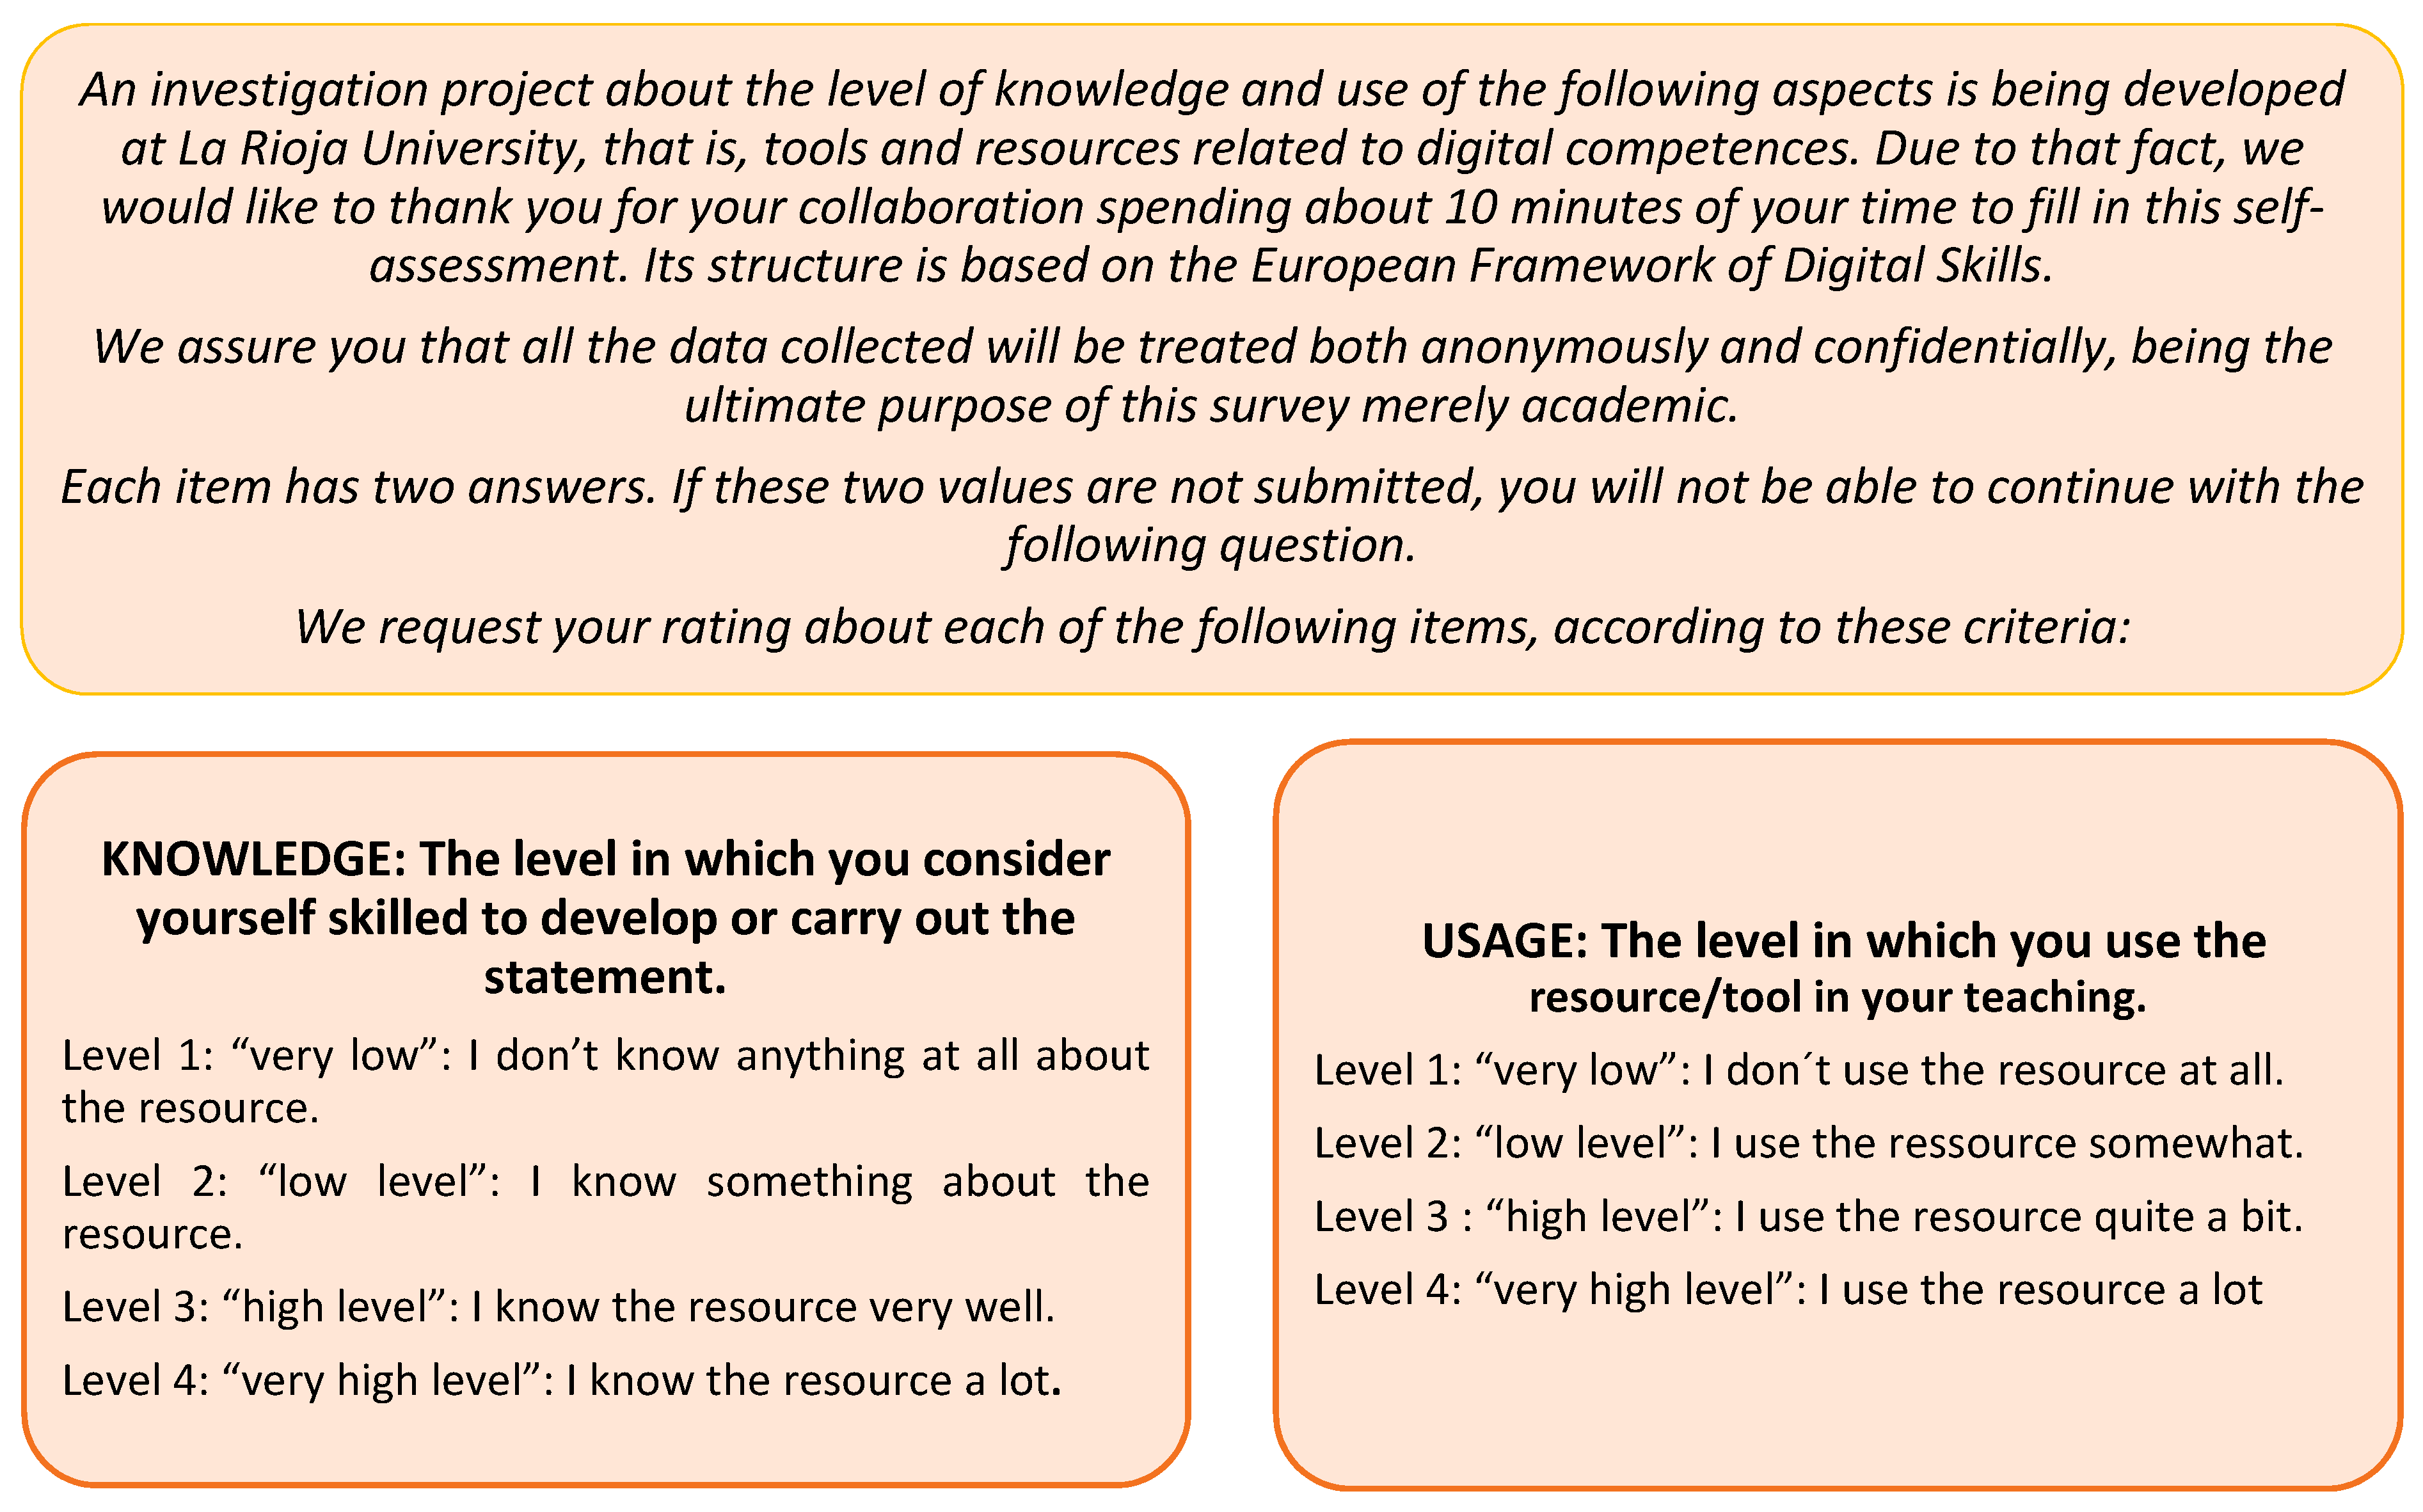
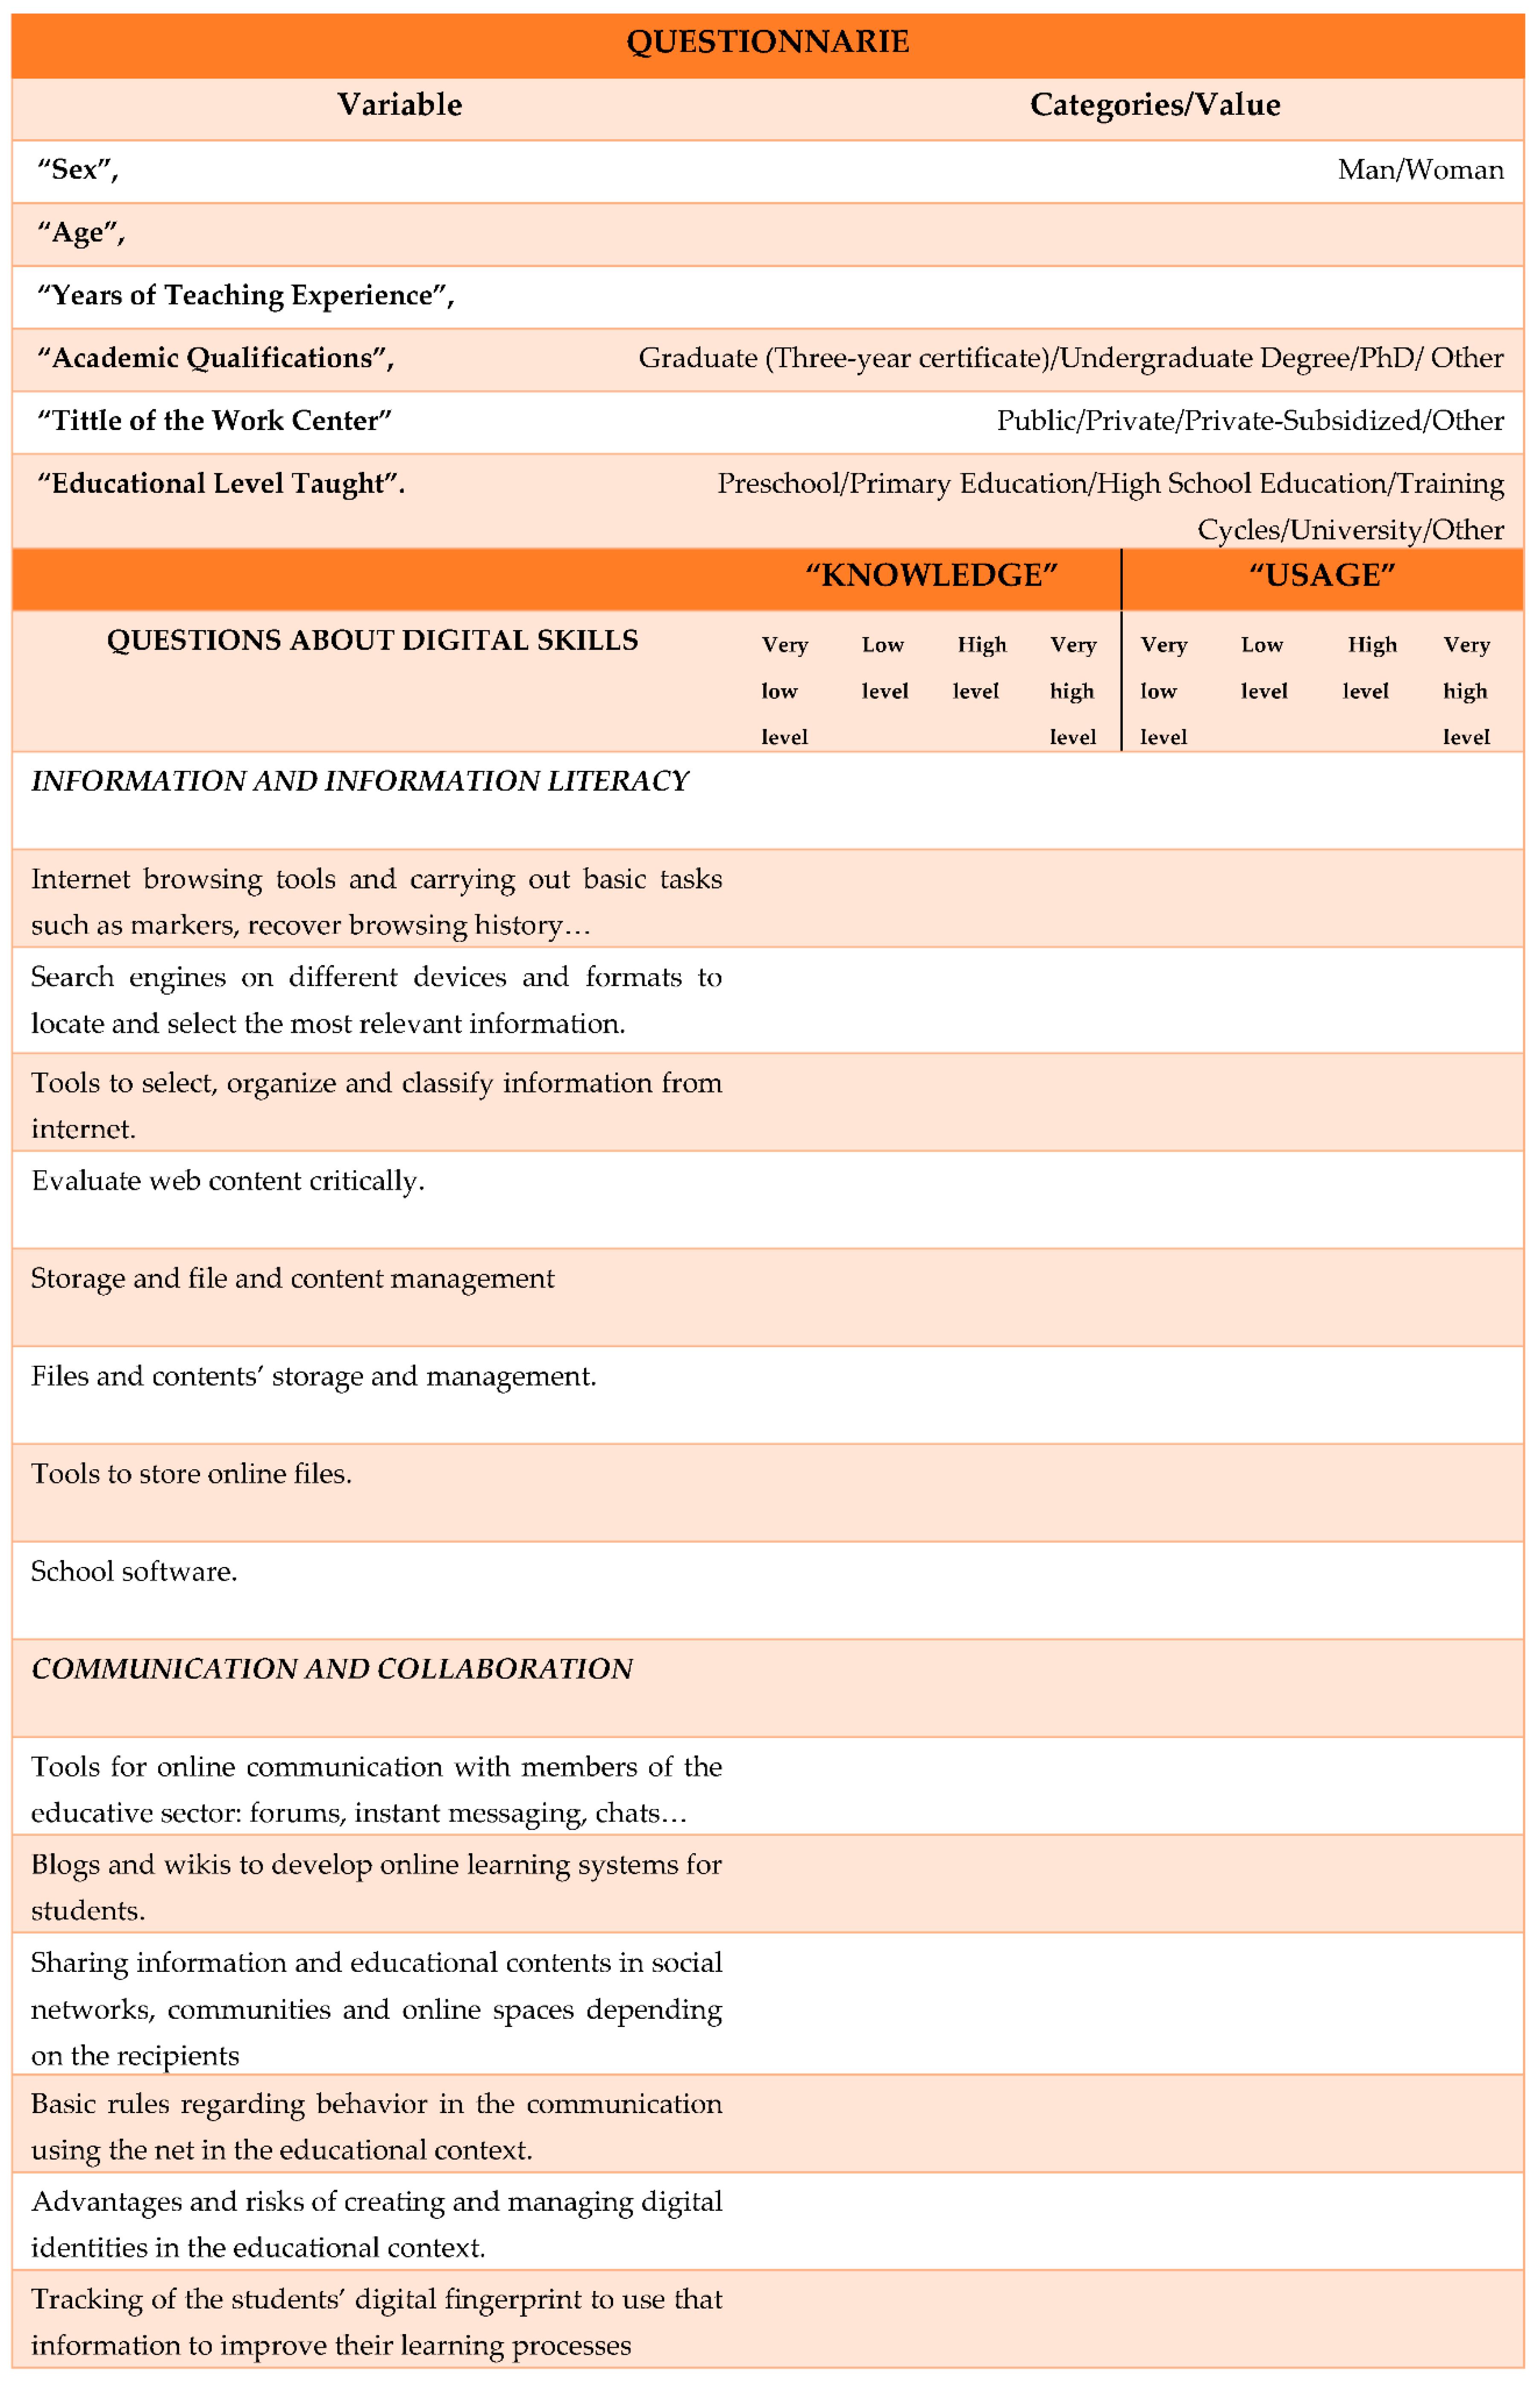
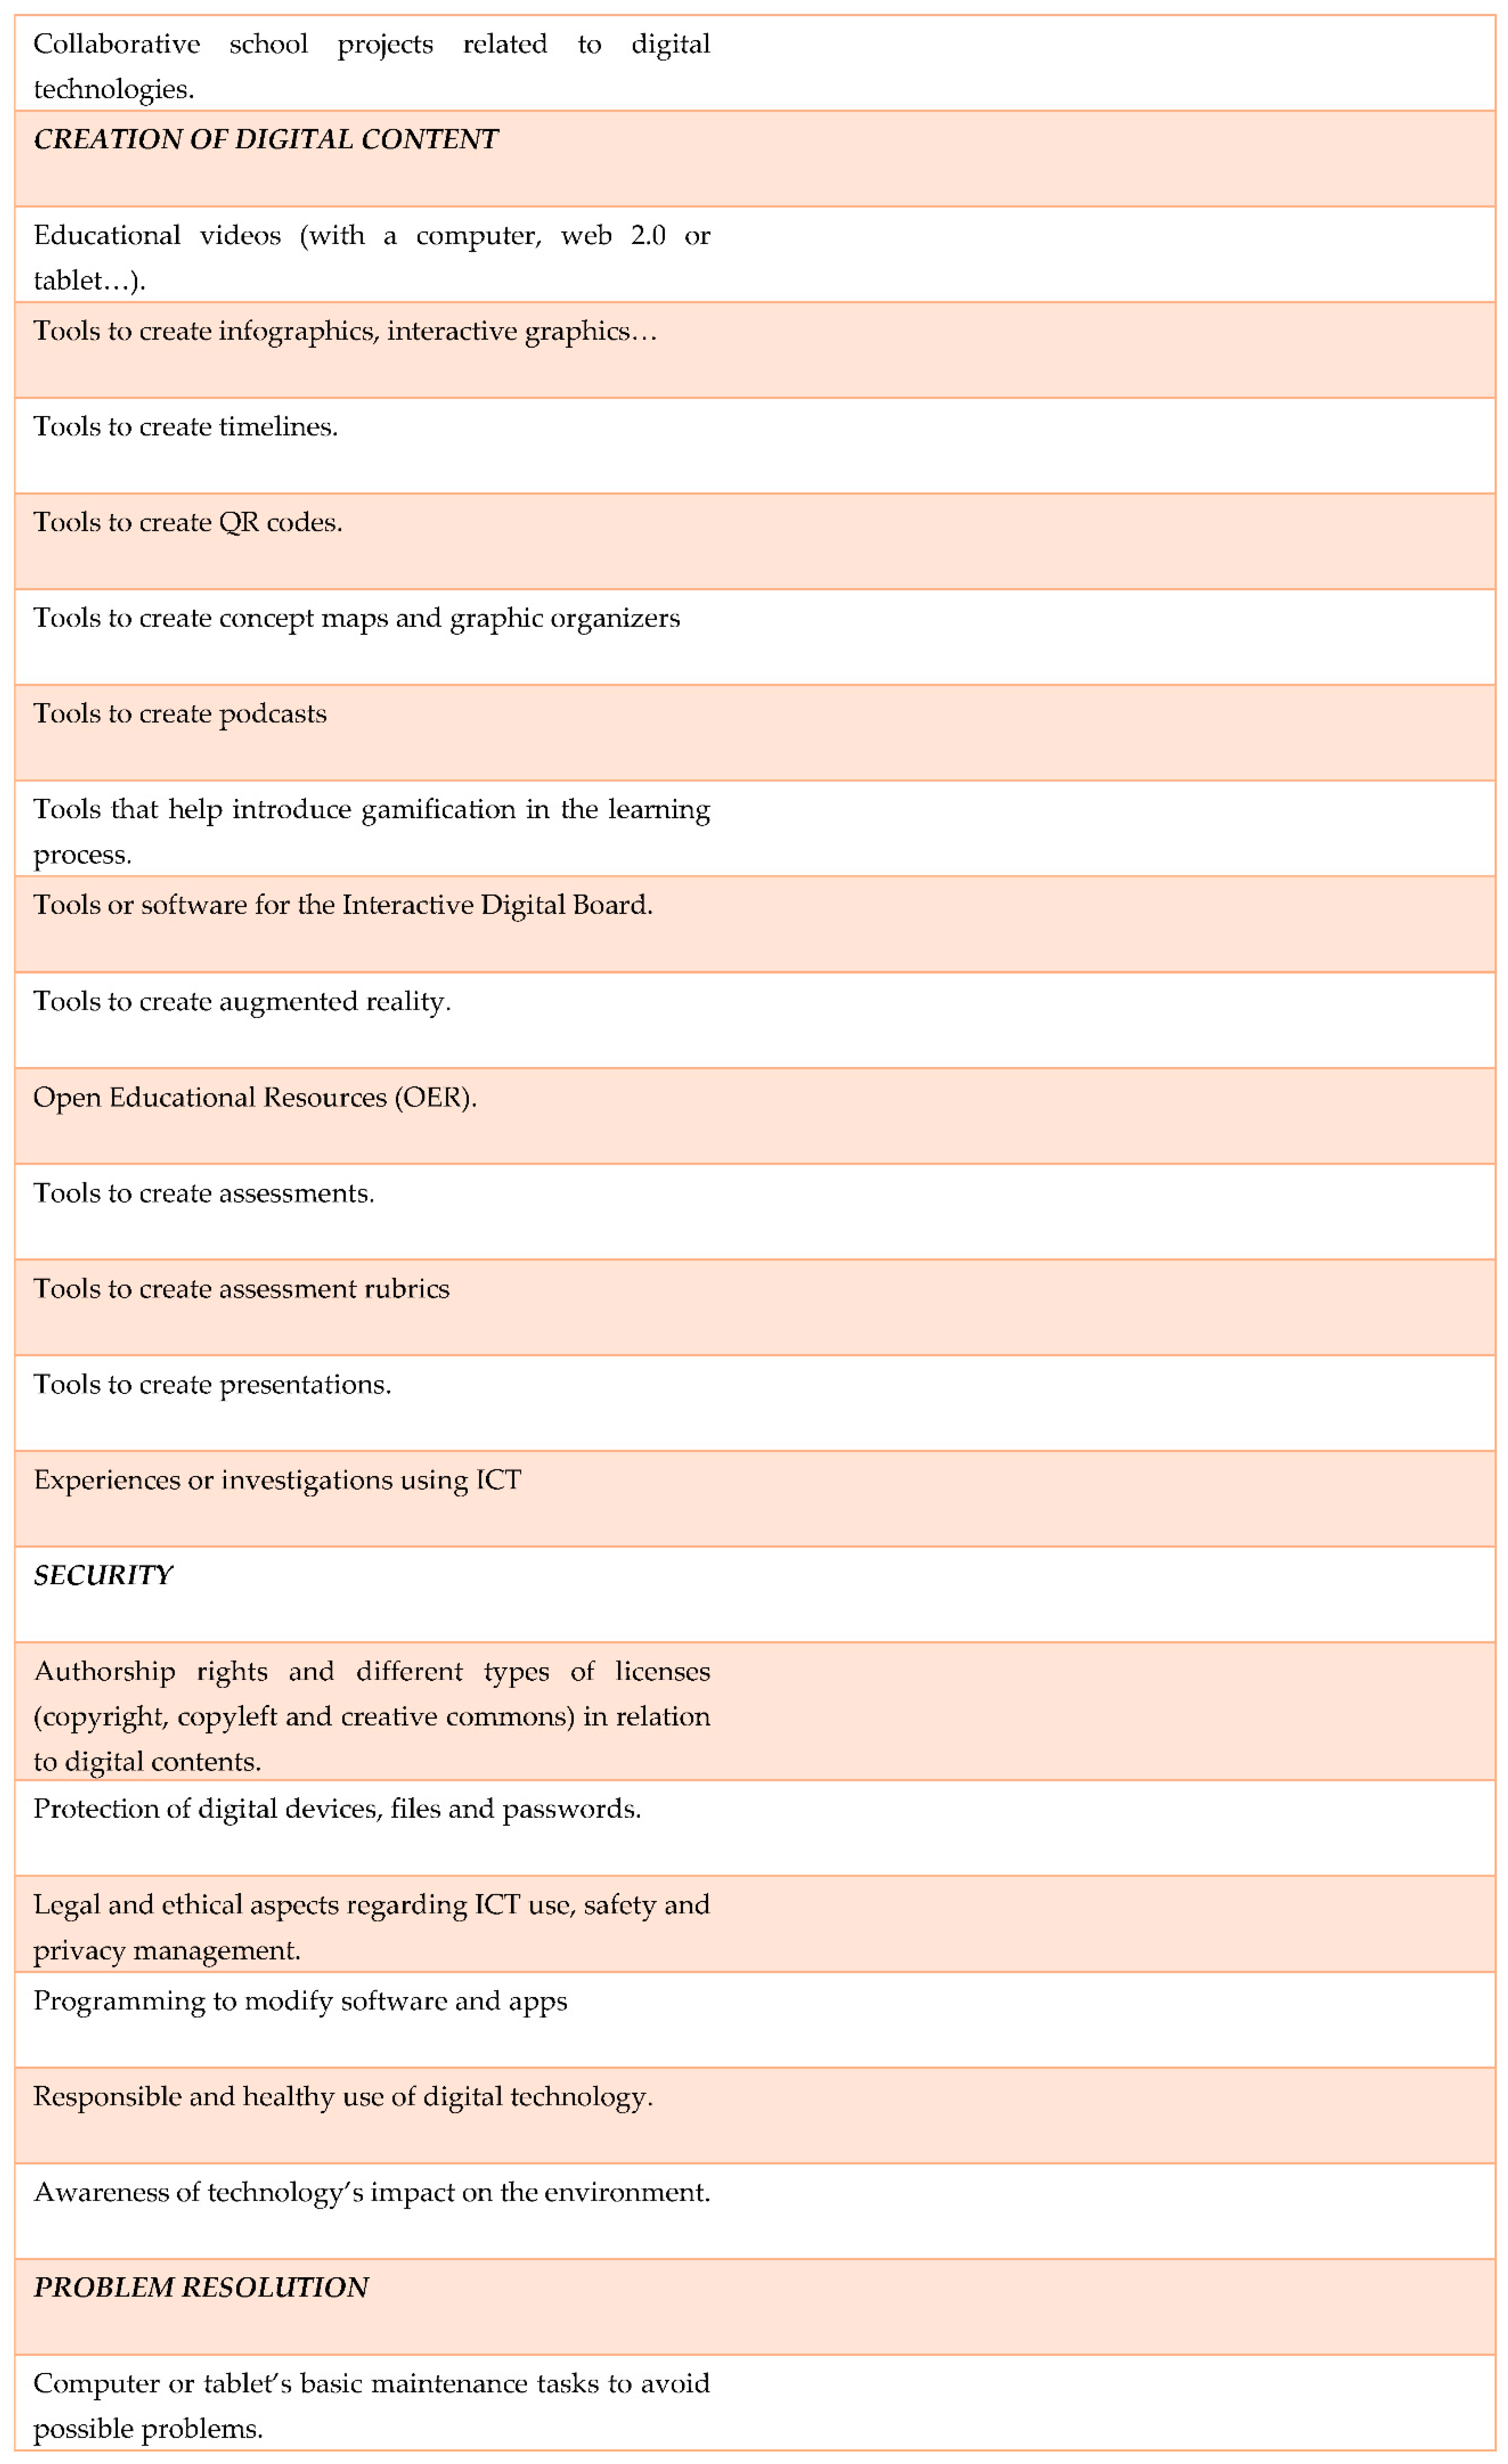
Once the various levels of competencies of educators have been assessed in detail, the next objective is to design a training program in accordance with their actual needs, in terms of the digital skills which are most closely related to methodological transformation.

2.1. Instrument

In order to assess the levels of digital competency of teachers, the ACDC (Analysis of Common Digital Competences) questionnaire has been used [35] as a data collection instrument since it is considered to be a suitable tool for this aim.
For the design and validation of the above-mentioned questionnaire, the dimensions of the common framework [28] and the definition of digital teaching competence [11] were reviewed. A group of 5 experts identified attitudes and knowledge of each area among the different skills. They focused on those ones which were oriented to teaching practice integrating digital tools in the teaching–learning process. Experts coincided on this first step in a percentage above 60%. In this way, the first group of items was selected, which would correspond to the questions in the first draft of the questionnaire. After first filtering and, again, with the agreement of the 5 experts consulted, a new consensus of necessary questions was reached that related to the competencies of the different areas. These questions assessed the skills, attitudes, and knowledge of the respondents, regarding the 21 digital competencies of the INTEF [28], reaching, in this case, more than 80% agreement.
The validation of the initial questionnaire was carried out with 426 teachers who accessed through an online procedure [34].
Initially, the questionnaire had questions to identify the population, and questions to measure both the levels of “knowledge” and “usage” of the different variables associated with the questions. The Cronbach’s Alpha coefficient, corresponding to all the variables calculated at that time, was 0.98. In the case of items related to “knowledge”, Cronbach’s Alpha coefficient varied between 0.89 and 0.94 and for the scale of “usage” of items between 0.87 and 0.92. The validity of the construct, and the convergent and discriminant validity, which is significant and acceptable, can be checked in Reference [34].
At a later stage, three external judges and experts belonging to different branches of knowledge in relation to learning, didactic methodologies, and educational technology, accepted the questions of the designed questionnaire, with slight changes.
The final questionnaire consists of 100 questions, six of which gather information about general population data, “Sex”, “Age”, “Years of Teaching Experience”, “Academic Qualifications”, “Tittle of the Work Center” and “Educational Level Taught”.
The other 94 questions reflect the perception that the participating teachers have of different items of the digital skills. Out of these 94 questions, 47 refer to teachers’ knowledge of different items associated with the different competencies and the other remaining 47 questions to their usage. All of them are closed questions categorized by a “Likert” type of scale from 1 to 4 where 1 is “Very low level” (does not know anything or does not use a specific item), 2 is “Low level”, 3 is “High level”, and 4 is “Very high level”. One further reason to choose this survey is that it avoids the tendency towards centrality.
The instruction text of the ACDC questionnaire is shown in Figure 2:
The questions to be answered are shown in Figure 3.
The survey is done on the “SurveyMonkey” platform and is facilitated through links like Reference [35]. Despite being a long questionnaire, it is easy to complete with an average length of 10 min. The statistical analysis is carried out by means of the “IBM Statistical Package for the Social Sciences” software (SPSS), a program normally used in Social Sciences and in market research companies.
This article aims to confirm the validity and reliability of the questionnaire, taking into consideration the slight modifications proposed by the last three expert judges. For reliability, the Cronbach’s Alpha coefficient has been applied. The closer the Cronbach’s Alpha is to 1 the greater the internal consistency of the analyzed items will be [36,37]. The validity is assumed to be correct having been tested in-depth at the initial stages of the survey [34]. Table 1 shows the Cronbach’s Alpha coefficients for the different groupings of variables by area (“Information and Information Literacy”, “Communication and Collaboration”, “Creation of digital content”, “Security” and “Problem Resolution”) and for the total of items. In Table 1, in the third column, we can see the calculated coefficients by area, isolating those variables related to the “knowledge” of the different items. In the fourth column, we see the coefficients for the variables related to “usage”. Moreover, in the fifth column, the coefficients are calculated by grouping the variables of “knowledge” and “usage” of the items of each area.
As the table shows, in the case of the variables associated with “knowledge” the lowest Cronbach’s Alpha coefficient is 0.852, and the highest 0.928, for the different areas. For the variables on the “usage” of the different items, the lowest Cronbach’s Alpha coefficient is 0.827, and the highest 0.910. In the case of Cronbach’s Alpha coefficient, grouping all the variables of “knowledge” and “usage” for each area, the lowest is 0.917 and the highest 0.957. According to Reference [37], if the Cronbach’s Alpha coefficient is greater than 0.9, it is considered excellent, and if the coefficient is greater than 0.8, it is good. The results obtained confirm the reliability and consistency of the questionnaire, both in the different groups and in the sample as a whole.

2.2. Population and Sample

The study was carried out with 4883 Spanish teachers of different educational levels. In the last academic years, the population of teachers in Spain was around 700,000 people. An incidental or casual sample was decided upon, choosing individuals that were easily accessible [38]. An attempt to obtain a selected sample of educational centers and teachers from all over Spain was beyond reach. Nonetheless, the data obtained offers a very relevant picture as it provides reliable data of the perception that teachers have of their digital skills. Those surveyed were informed of the aim of the questionnaire and accepted to participate knowingly and voluntarily in the present study.
After an exhaustive debugging of data in which incomplete questionnaires and those with outliers and doubtful responses were eliminated, 3651 accurate records remained, leaving 74.77% as the starting point. In data debugging, 25.23% of records were lost, 15.14% were repeated since the first attempt was not completed, and 10.09% are missing data, as they were not fully completed.
Of these 3651 records, 2567 are women, which makes up for 70.3% of the total, and 1084 are men, that is, the remaining 29.7% (this is an accurate reflection of the current ratio of men and women in the Spanish teaching body). 5.2% of the sample are under 26 years old, 24.7% of teachers are between the ages of 27 to 36, and 34% are between 37 and 46; 27.2% are between 47 and 56 years old, and 8% are above 57. The average age is 42.28 years old, the mode 40, the median 42, and the variation coefficient is 0.228.
In relation to “Teaching Experience”, the answers have been grouped in five intervals: teachers with less than 5 years of experience which amounts to 18.2% of the population, those that have from 5 to 15 years of experience, 37.2%; from 15 to 25, 26.6%; between 25 to 35, 15.3%; and more than 35 years of experience, 2.8%. The average of years worked is 15.45, the mode is 10, and the median 14 years with a variation coefficient of 0.641.
With reference to the characterization of the population according to “Academic Qualification”, 1188 teachers claim to have a “Graduate (Three-year certificate)”, which is 32.5% of the population, 2309 teachers have an “Undergraduate Degree”, 63.2%, 122 have a “PhD”, which amounts to 3.3%, and 0.9% chose “Other”.
Regarding “Tittle of the Work Center”, there are four possible options: “Public”, chosen by 22.6% of the population; “Private-Subsidized”, chosen by 2281 teachers (62.5%); “Private”, chosen by 515 teachers (14.1%); and “Other”, chosen by 31 of those surveyed (0.8%).
Finally, with respect to “Educational Level Taught” 515 teachers are of “Preschool”, which comprise 14.1% of the teaching body; 1271 teachers are of “Primary Education” (34.8%); and 1572 teachers are of “High School Education” (43%). “Training Cycles” comprise 142 teachers (4.1%); 44 teachers teach at “University” (1.2%) and, finally, 100 teachers (2.7%) teach in “Others”.

2.3. Method

This study has a clear initial quantitative nature since a statistical analysis is done from the answers obtained in the survey. The responses were obtained by two different means. On the one hand, the digital competence Website School of Digital Competence [39] allowed for the link to appear in several teacher forums in order to deal with the claims for digital competencies analysis. On the other hand, both educational institutions and public administrations requested this analysis to assess the status of teachers.
The statistical analysis consists of two parts, which respond to the objectives set in this work: on the one hand, to obtain the picture of the teachers’ perception of their digital competencies, and on the other hand, to analyze the relations that may exist between the characteristics of the sample and the level of development of their digital competencies:
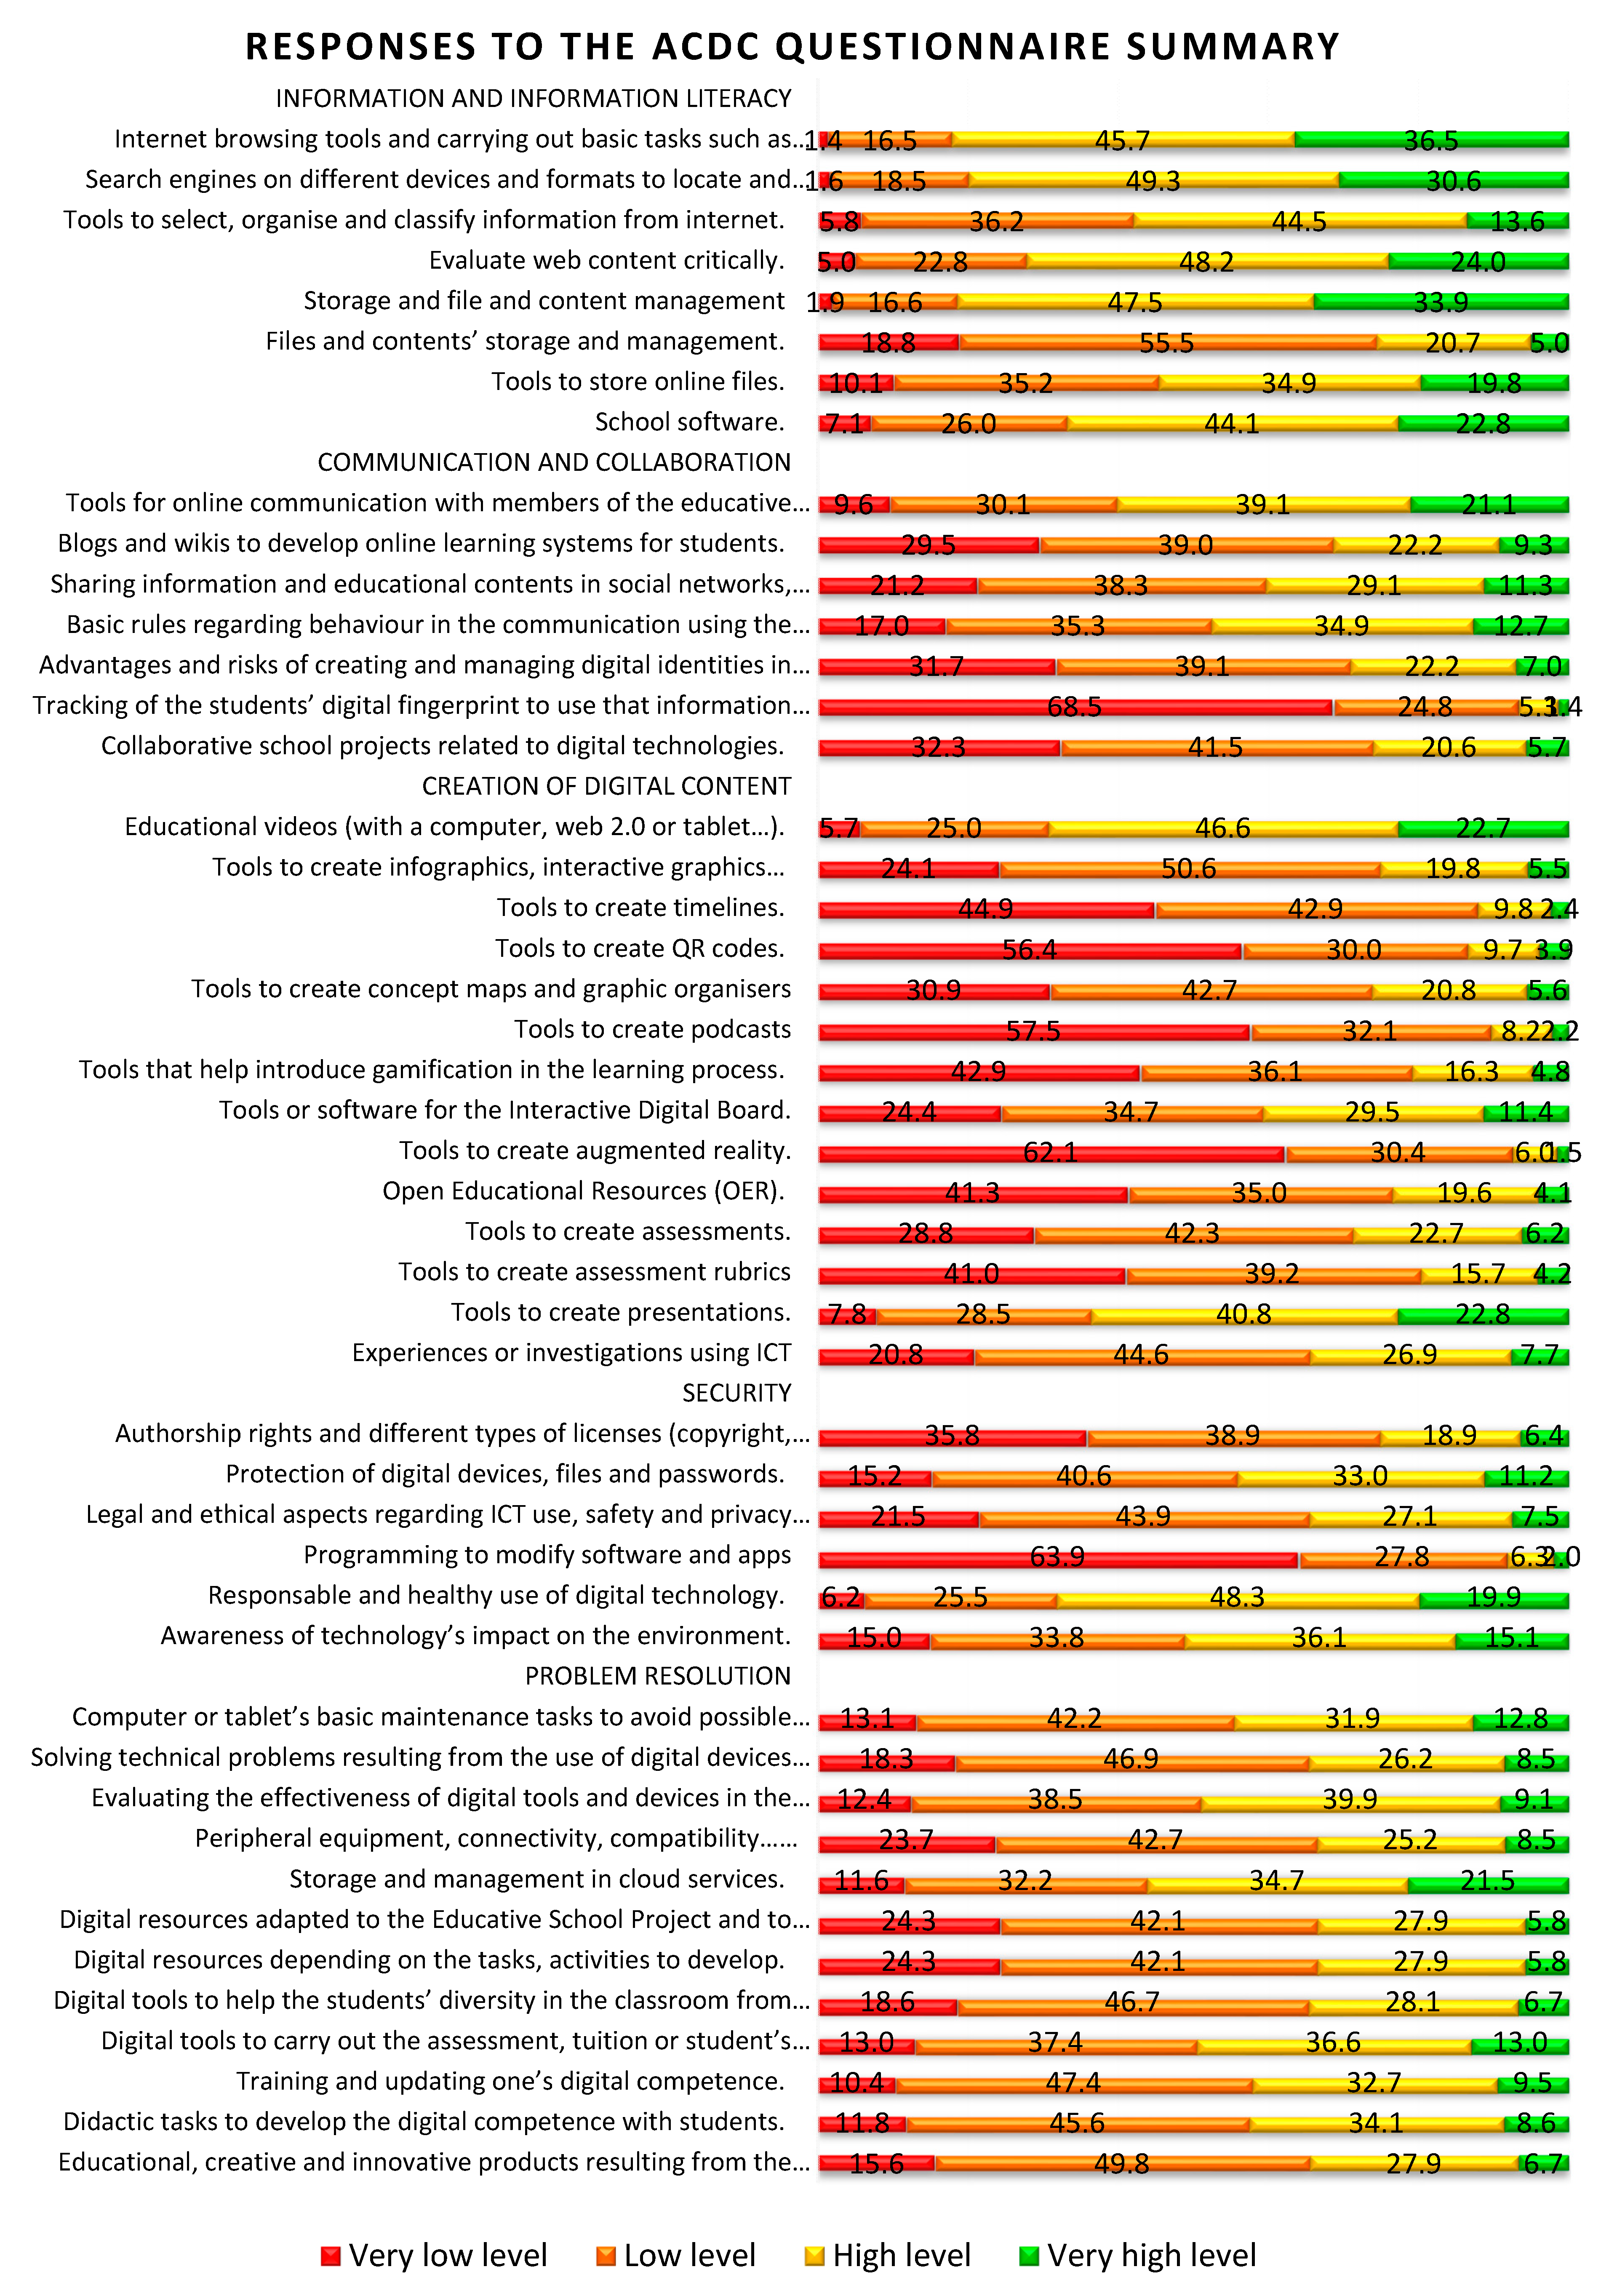
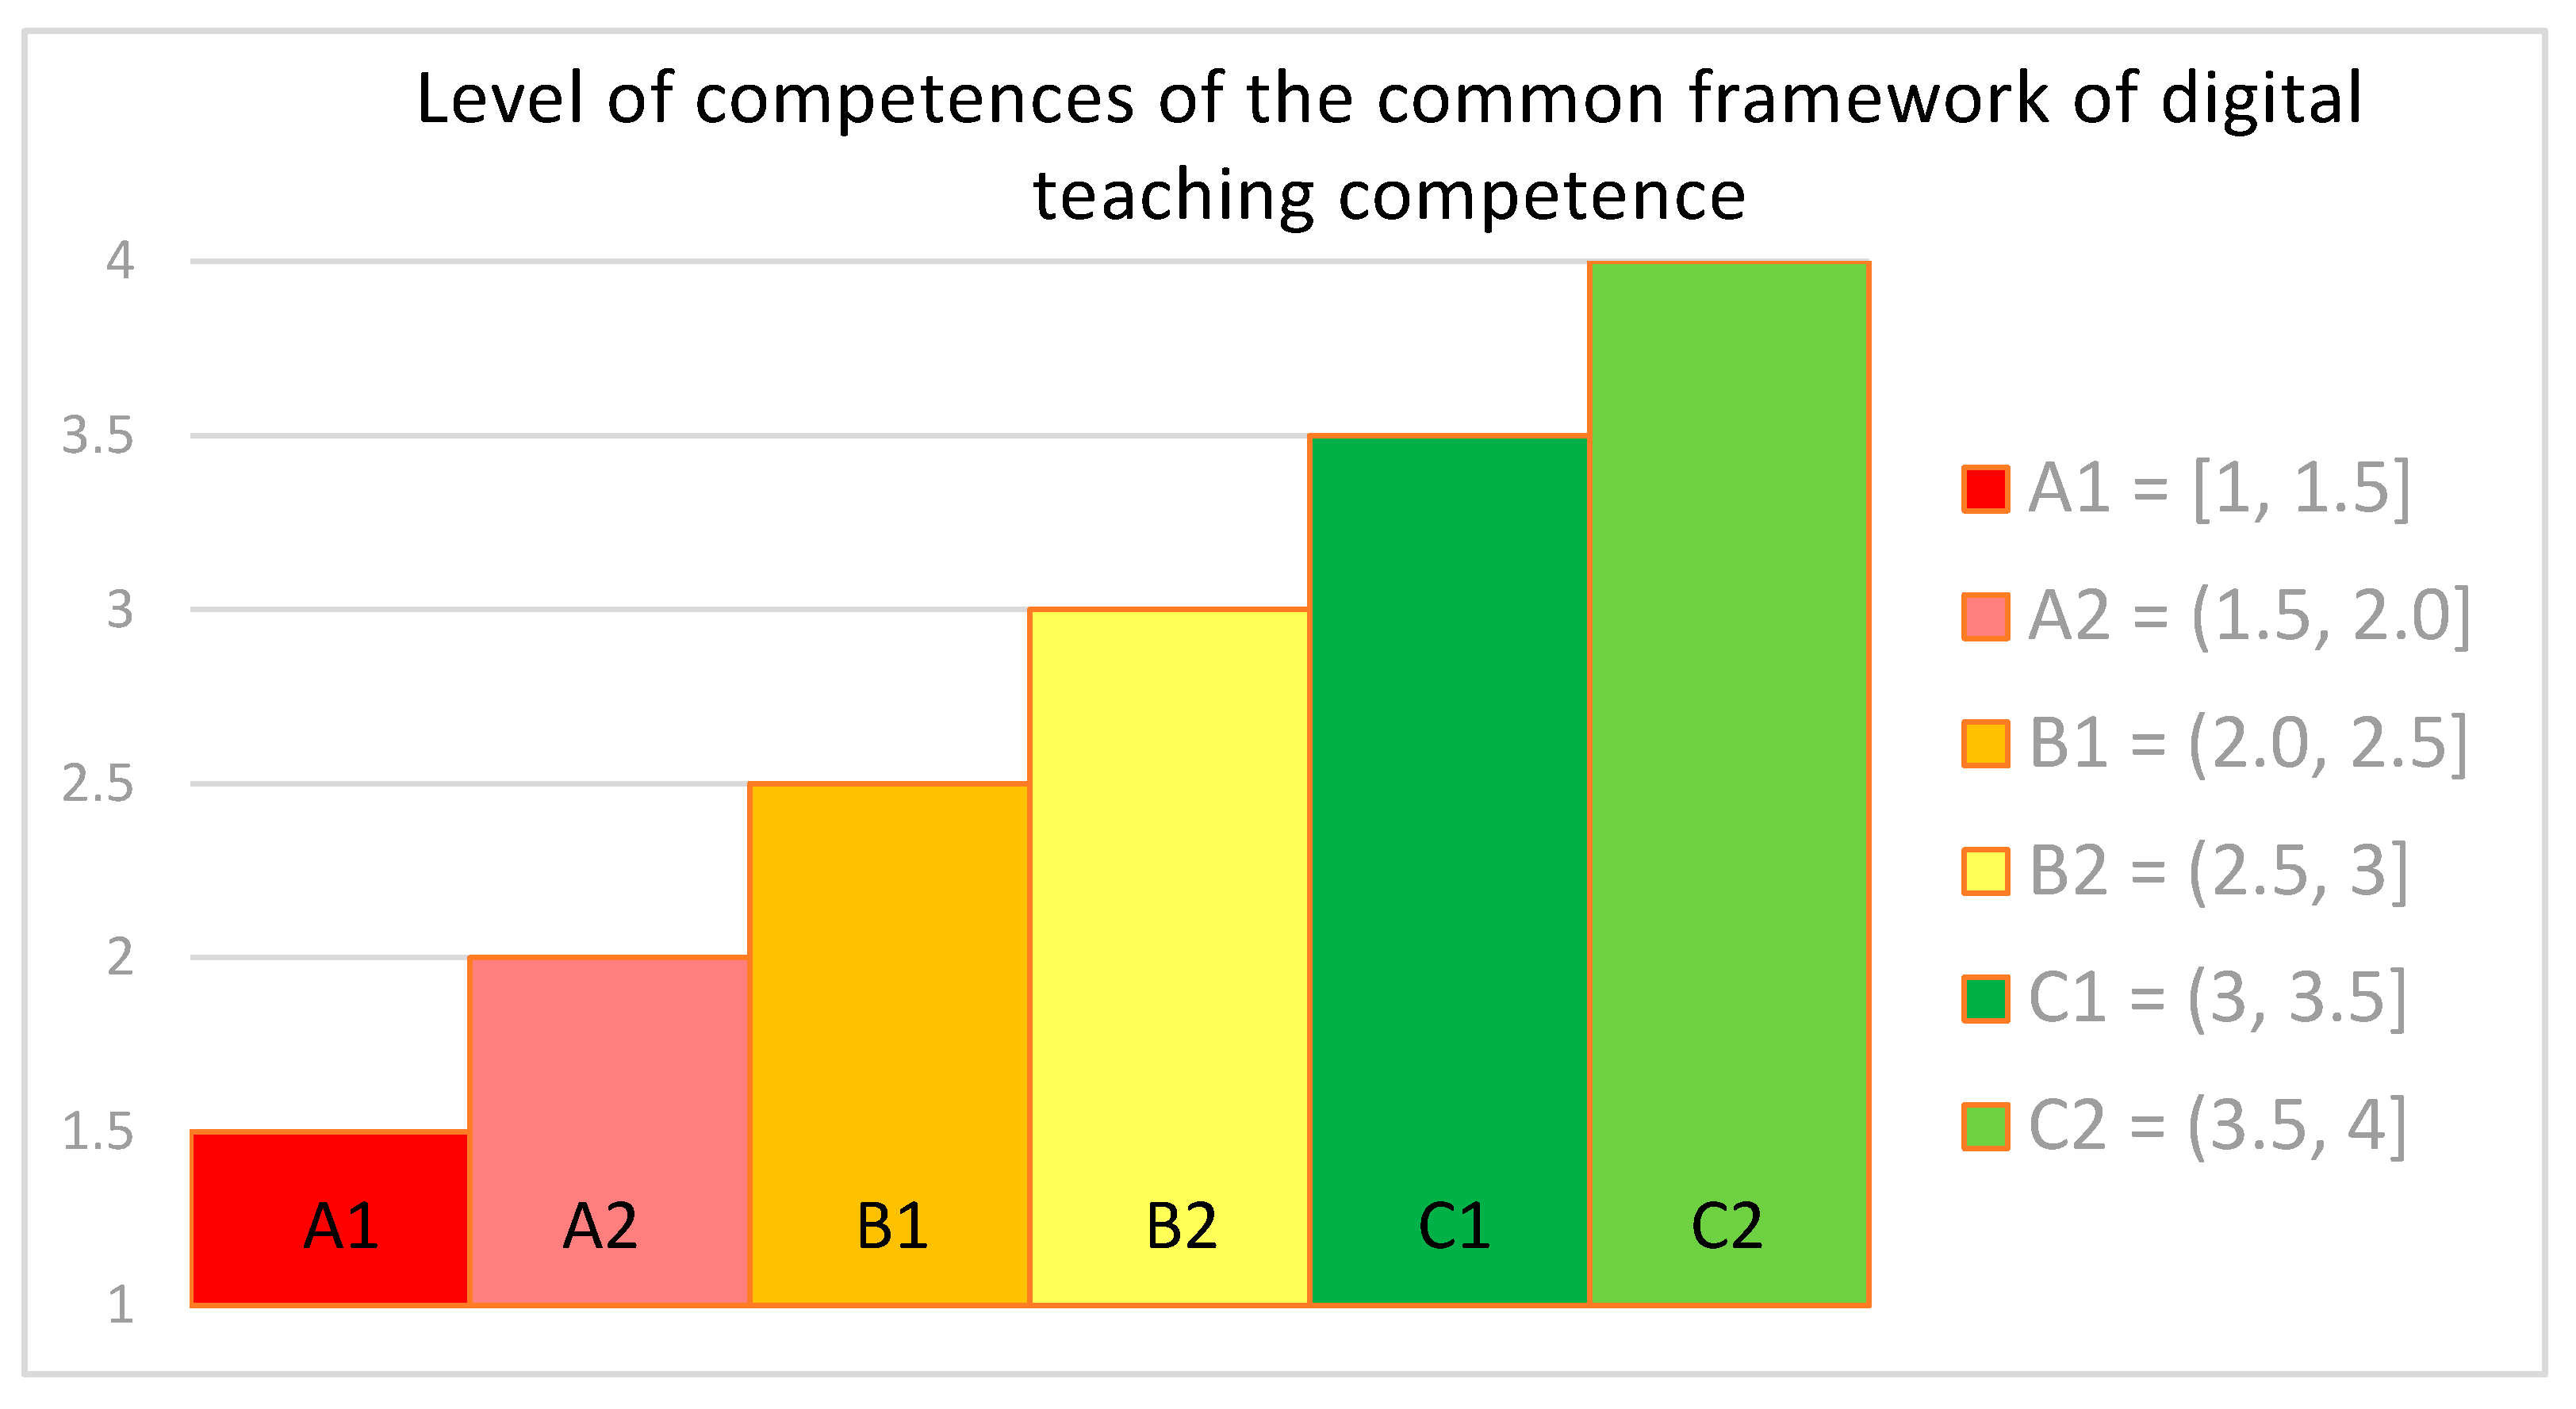
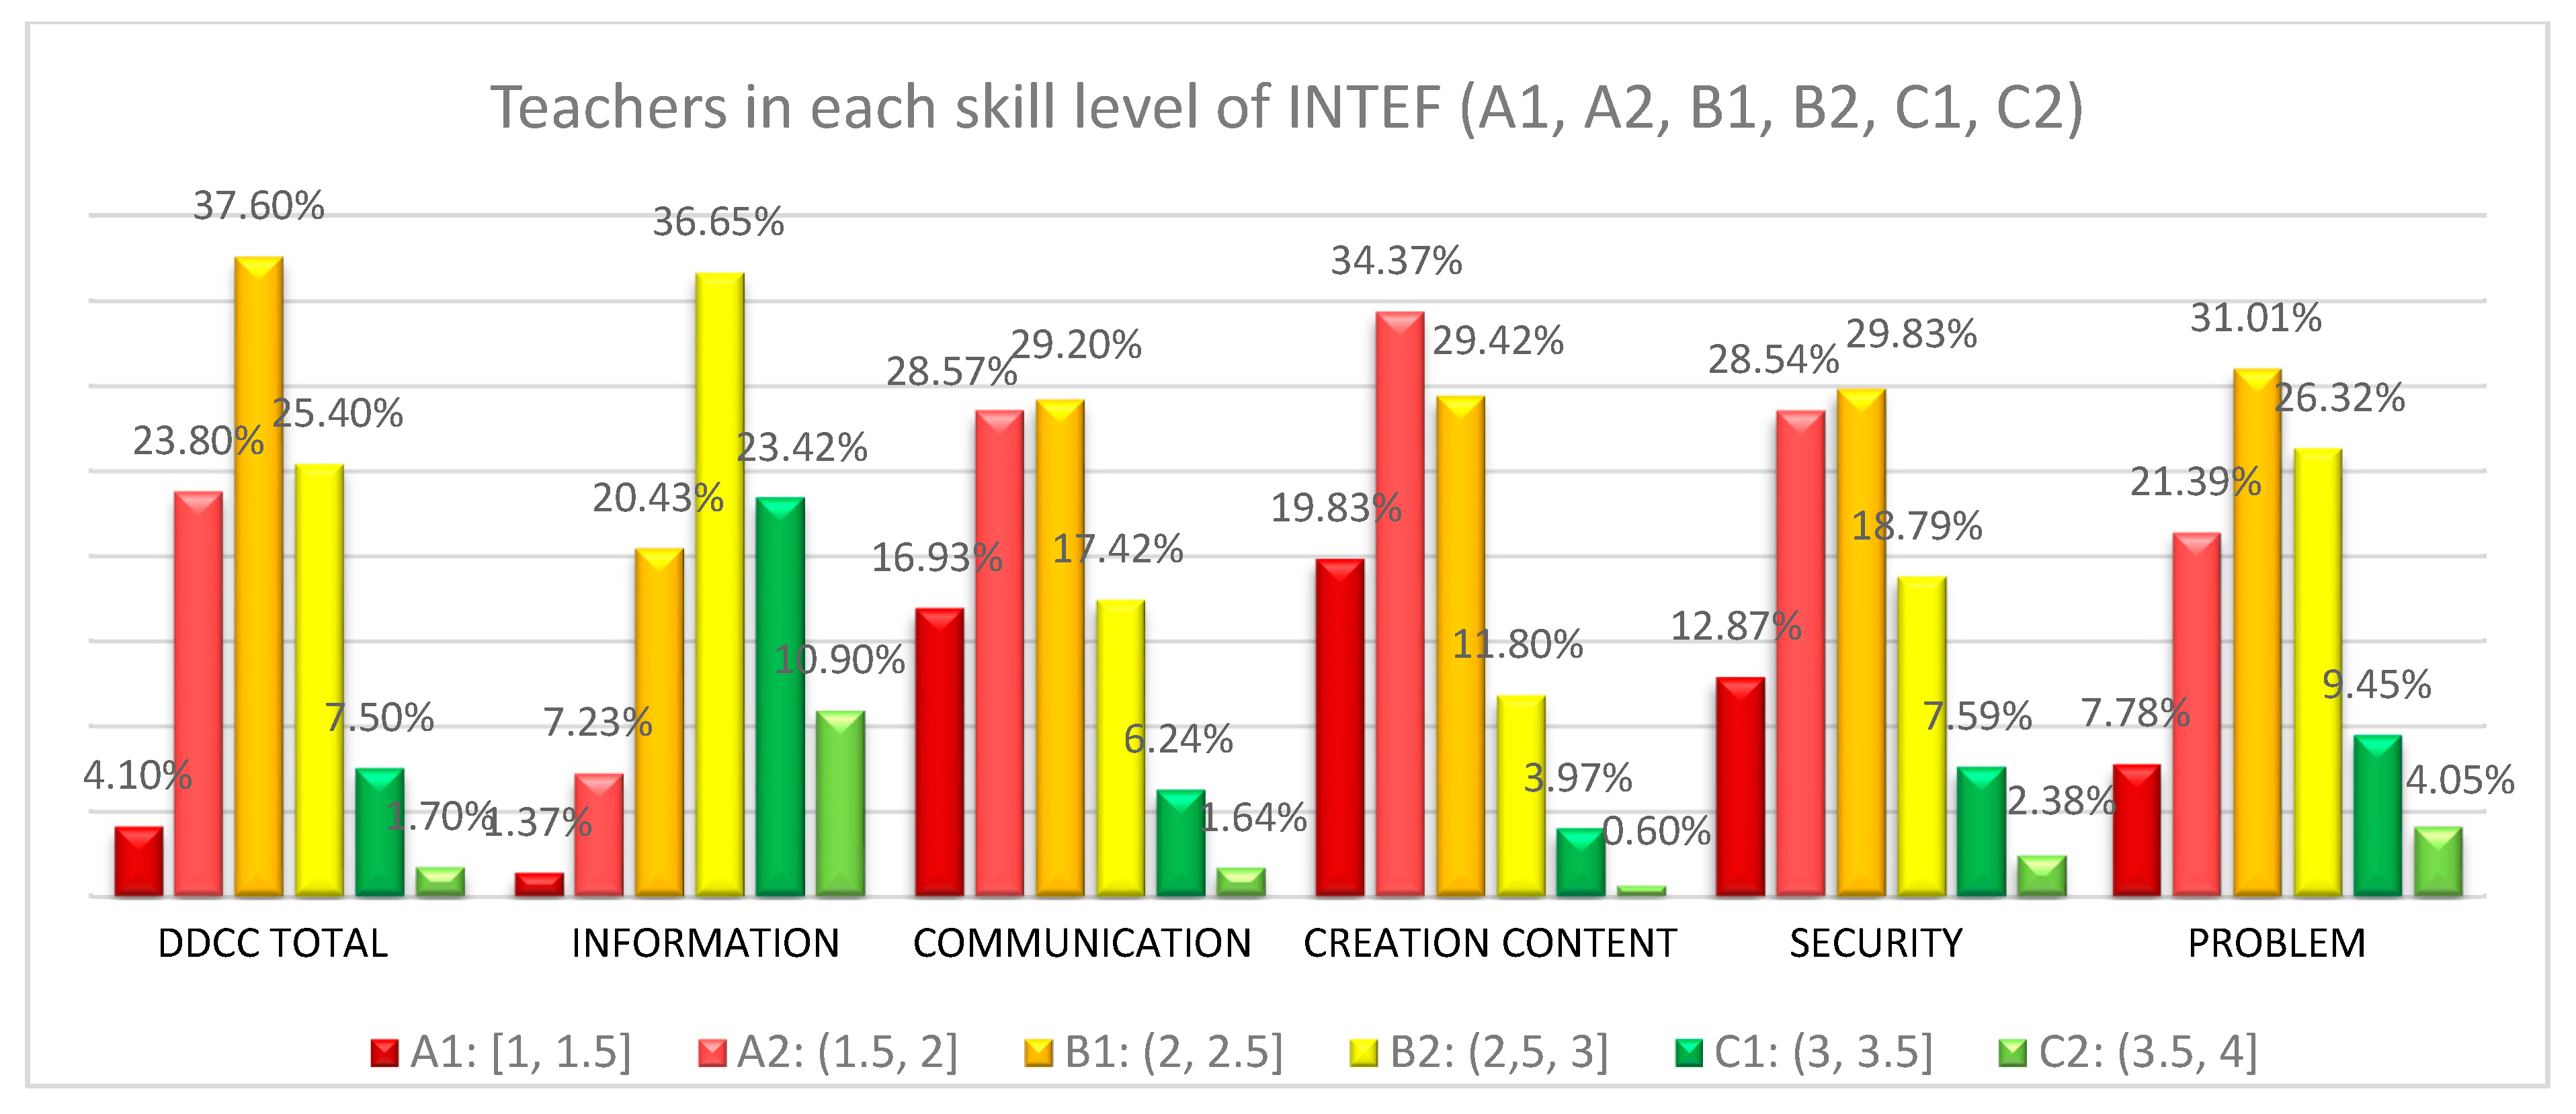
  • Descriptive statistical analysis regarding the teachers’ views of their digital skills. They have been grouped in five areas, “Information and Information Literacy”, “Communication and Collaboration”, “Creation of Digital Content”, “Security”, and “Problem Resolution”, as much as in “knowledge” as in their “usage”, according to the dimensions that the program for the common framework for digital competence designed by the Digital Culture Plan for Schools of the MECD [40] (p. 11) lays out. For the descriptive analysis, the most common centralization measures have been taken into account. These measures are mean, median and mode, and they are calculated considering the quantitative values associated with the qualitative variables, 1 for “Very low level”, 2 for “Low level”, 3 for “High level”, and 4 for “Very high level”.
  • At a second stage, the possible relationships between the variables of the questionnaire are analyzed. The correlational nature analysis checks if the levels of the variables associated to those surveyed, “Sex”, “Age”, “Years of Teaching Experience”, “Academic Qualifications”, “Educational Level Taught”, and “Tittle of the Work Center” influence the respective factors of the items about digital skills. Those variables have been grouped according to the 5 areas of digital skills, as well as to a general grouping of these five dimensions named “Total Digital Competence”. For that purpose, the arithmetic averages of all the responses to the items are calculated, taking the quantitative values of the variables into account. The correlational study is carried out through the Test of Independence with X2, also known as Ji-Square or Chi-Square Independence Test, with a 95% confidence level where frequencies of theoretically awaited events and frequencies of experimentally observed events are compared. Having carried out the above-mentioned test, it can be established if the levels of one variable affect the levels of another analyzed variable [41].
  • A suitable way to specify this statistical analysis of dependencies is to perform a multiple linear regression analysis. The multiple linear regression analysis will allow us to specify, estimate, and interpret the explanatory model in which a dependent variable, in this case the variables associated with “Information and Information Literacy”, “Communication and Collaboration”, “Creation of digital content”, “Security”, “Problem Resolution ”, and “Total Digital Competence ”, is expressed in terms of one or more independent variables, in this case “Sex ”, “Age ”, “Years of Teaching Experience ”, “Academic Qualifications ”, “Educational Level Taught ”, and“ Tittle of the Work Center ”. By means of this analysis, it is possible to quantify the relationship between the dependent variables and the independent variables and the Confidence Interval so that we can affirm that the quantification carried out conforms to the observed reality [42]. With this model, we do not aim to show that there is a causality between the independent and dependent variables, but a trend. From the regression analysis, the goodness of fit (R2), the regression coefficients of the model, and whether there is significance are obtained and shown in this work.
  • Finally, following a more qualitative approach, a training program is outlined that deals with the different competence areas according to the needs expressed in the quantitative study.

3. Results

In the first place, the results obtained from the quantitative, descriptive, and relational analyses are shown, and then a training program based on these results is proposed.

3.1. Quantitative Analysis Outcome

3.1.1. Descriptive Statistical Analysis

First, the most common centralization measures, mean, median, and mode, obtained in each area are shown (Table 2). They are shown by separating the variables associated with “knowledge” and “usage” of each item. These statistical variables are calculated taken into account that in the questionnaire the numerical values associated with each answer are “Very low level” = 1, “Low level” = 2, “High level” = 3, or “Very high level” = 4 (See Table 2). For each teacher, the average values for each area and “knowledge” are calculated, as well as the average for each area and the variables that collect the “usage” of the items asked. In this way, the means per area can be obtained, separating the variables associated with “knowledge" and “usage”.
In order to present the perception that teachers have of their digital skills in a simple way and according to, among other things, the data obtained in the statistical variables of Table 2, it is reasonable to group the options “knowledge” and “usage” of each digital competence into one sole item. To carry out this grouping, a study of the possible linear correlation between both variables for each item was conducted beforehand. The table clearly shows that the perception of whether one knows their own digital skills to a greater or lesser extent is somewhat higher than the perception of how much it is used. Even so, a considerable positive linear correlation exists between the two. This matter is substantiated upon obtaining a Pearson’s Correlation Coefficient of 0.9666, from the means shown in Table 2. Thus, both variables were combined into one, and the study was carried out combining the variable “knowledge” with that of “usage” of each item, with the assurance of having valid results.
Second, the frequencies of the answers reached are shown in a horizontal bar diagram. Figure 4 illustrates the percentage of answers for each item from the questionnaire, grouping “knowledge” and “usage” together.
As an example, on the horizontal bar diagram in Figure 4, the first bar corresponds to the first item of the questionnaire associated with the area "Information and Information Literacy". When respondents had to choose their level for “Internet browsing tools and carrying out basic tasks such as markers, recover browsing history…”, 1.4% answered "Very Low Level”, 16.5% chose “Low Level”, 45.7% “High Level”, and 36.5% answered “Very High Level”. In this way, you can have a general picture of the levels of digital competence of teachers.
Evidence shows that the teaching body that comprises the sample has a positive perception of their “knowledge” and “usage” of the items associated with the area “Information and Information Literacy”. It can be seen that more than 55% of the respondents answered, “High level” or “Very high level” in seven of the eight items and that in three of them (“Internet browsing tools and carrying out basic tasks such as markers, recover browsing history”, “Search engines on different devices and formats to locate and select the most relevant information”, and “Storage and file and content management”) these satisfactory answers exceed 80%. Only one item, “Files and contents’ storage and management,” reverses this tendency with 74% of the responses being “Very low level” or “Low level”. This is the area where the teaching body indicates having better skills.
In the “Communication and Collaboration” area, the teaching body considers that they know and make optimum usage of the most basic tools (forums and the correct use of language on the web) and worse use of the newest tools (fingerprint check, identity management, learning blogs and wikis…). It is noteworthy that for the “Tracking of the students’ digital fingerprint to use that information to improve their learning processes”, 68.5% of the people estimate that they have “Very low level” and 24.8% “Low level” knowledge.
“Creation of Digital Content” is considered key because of its implications in methodological transformation. The existing perception, despite its importance, is rather negative though. More than 60% of respondents answered, “Very low level” or “Low level” in 12 of the 14 items, and in four of them (“Tools to create timelines”, “Tools to create QR codes”, “Tools to create podcasts”, “Tools to create augmented reality”) more than 86% of respondents answered, “Very low level” and “Low level”. Only in the case of the items “Educational videos (with a computer, web 2.0 or tablet…)” and “Tools to create presentations” does this tendency reverse, being 63% of the responses “High level” or “Very high level”.
“Security” corresponds to a transversal digital competence. The data reveals that in four of the six items more than 55% of those surveyed know them and use them at “Very low level” or “Low level”, and in one of them, “Programming to modify software and apps”, more than 91% know about them. For the items “Protection of digital devices, files and passwords” and “Legal and ethical aspects regarding ICT use, safety and privacy management”, the teachers’ self-perception is equally divided between “Very low level” or “Low level”, and “High level” or “Very high level”.
Regarding “Problem Resolution”, another transversal digital competence, the results generally show a considerable equilibrium, with the teachers’ insight being more positive for the item concerning “Storage and management in cloud services” and more negative for the items “Digital resources adapted to the Educative School Project and to the school’s facilities”, “Digital tools to help the students’ diversity in the classroom from an inclusive perspective ”and “Educational, creative and innovative products resulting from the use of technology”.
Third, it is interesting to know the average digital competence of all teachers. To this purpose, the digital competence of each teacher has been calculated as an average value of the answers to all the questions of the questionnaire. In this way, each teacher obtains a total digital competence value, a number between 1 and 4.
We have tried to simplify the image of the levels of competence of the teaching staff and to express results in accordance with the levels of competence as defined by INTEF [28] (upheld in Reference [29] in the Official State Bulletin) (See Figure 5). The Common Teaching Digital Competence frame, as said before, is made up of 5 competence areas and 21 Structured skills in 6 levels, from A1 (“beginner”) to C2 (“advanced”). A translation or relation of the answers obtained in the “Likert” scale from 1 to 4 has been done to establish a correspondence between the perception levels A1, A2, B1, B2, C1, and C2 and the levels “1 = Very low level”, “2 = Low level”, “3 = High level”, or “4 = Very high level”.
More precisely, those values between 1 and 1.5 will correspond to level A1; those greater than 1.5 and less or equal than 2 correspond to A2; those greater than 2 and less or equal than 2.5 correspond to B1; those greater than 2.5 and less or equal to 3 correspond to B2; those greater than 3 and less or equal to 3.5 correspond to C1; and those greater than 3.5 would reach level C2.
Figure 6 shows the percentage of teachers (3651 final data) in each skills level of INTEF [28], according to the calculated average of all the items of the survey for each of them. On the diagram corresponding to “Total Digital Competence” (DDCC TOTAL), it can be observed that, in the most frequent case, 37.60% of the teaching body perceives to have a B1 level in digital skills. Approximately 28% of teachers consider that they have a basic level A1 or A2. 25.4% of the surveyed teachers believe to have an intermediate level B2, and only 9.2% think they have an advanced level in digital competencies C1 or C2. The rest of the diagrams shown in Figure 6 show that the percentages of teachers with low levels, A1 and A2, range between 54.2% for “Creation of Digital Content” and 8.60% for “Information and Information Literacy”. The percentages with intermediate levels vary between 57.33% in “Problem Resolution” and 41.22% in “Creation of Digital Content”. Furthermore, the highest levels, C1 and C2, range between 34.32% in “Information and Information Literacy” and 4.57% in “Creation of Digital Content”. It can be concluded that each of the diagrams follows a Gaussian bell, characteristic of the Normal distribution.
To conclude the descriptive statistical analysis, averages (arithmetic mean), modes, medians, and variable coefficients are calculated from the variables resulting from grouping items according to the different areas of digital skills they relate to. The results can be seen in Table 3. Thus, obtaining an overall digital skill rating average and in the five areas according to the INTEF classification [28], and the total mean of all competencies, so it can be concluded that there is not a great dispersion of data with the average, median, and mode in fairly close values.

3.1.2. Correlation Analysis and Regression Analysis Results

The second phase of the statistical analysis shows the results of some of the most important correlations found after the implementation of the Chi-Square Test of Independence with a 95% level of reliability. After conducting this test, the results obtained in the survey are contrasted so as to be able to assert if two variables in the study are related or, rather, if they are independent of each other.
Contingency tables are dual-entry charts where each box shows the number of individuals who have a level of a given characteristic apart from another analyzed level. According to Reference [43], contingency tables gather the frequencies of the appearance of the different possible combinations among the different options in the answers of two or more variables. By means of the SPSS statistical program, 48 crosstab charts were obtained with their respective parameters pertaining to the Chi-square analysis. The independent variables “Sex”, “Age”, “Teaching Experience”, “Academic Qualifications”, “Tittle of the Work Center” and “Educational Level Taught” were associated with the variables grouped by areas of digital competence, in both its “knowledge” and “usage”, “Information and Information Literacy” (INF), “Communication and Collaboration” (COM), “Creation of Digital Content” (CDC), “Security” (SEC) and “Problem Resolution” (PR), and with the stacked variable “Total Digital Competence” (TDC). These charts are available for consultation. Some of their results are shown in Table 4 as a summary of the existing relationship. Among others, it shows Pearson’s Chi-Squared coefficient value, the degrees of freedom (df), and the associated probability (the bilateral asymptotic length (p)), marked with *** if the probability is less than 0.05 or with * if it is less than 0.1).
These results have been obtained through the analysis of crosstab matrixes for a total of 3651 valid cases. The coefficients have been calculated using SPSS statistical program, which allows to calculate and check the possible relationships between the numerous variables and their groupings. It can be observed that there are dependencies among all the variables associated with the characteristics of the subjects under study and the variables associated with digital competence and its different dimensions.
All associated probabilities are well below 0.05, so there seems to be a strong dependence among the variables. However, the values are slightly higher than 0.05 in the case of the relationship between the “Academic Qualifications” and the variables associated with “Security” (SEC) and “Problem Resolution” (PR). Consequently, it cannot be stated that there is dependence in the case of academic training.
In the next stage of the study of variable dependencies, a regression analysis is carried out to obtain a multiple regression model that allows us to know to what degree each independent variable can influence the dependent variables [42].
The regression coefficients of the model and the significance value have been obtained from the regression analysis, with the SPSS statistical program. The term R2 is also obtained, which indicates the goodness of fit, to find out to what extent the prediction of each dependent variable would improve.
To carry out the regression analysis, it must be taken into account that the dependent variables are numerical and that there is a linear dependence between them. In the same line, the independent variables need not be quantitative, but if they were not, they would have to be recoded using dummy variables [42]. Dichotomous qualitative variables such as “Sex” can be coded with the values “0” and “1”, thus becoming quantitative. In the case of qualitative variables with more than two response options (multiple modalities), indicator variables defined by the researchers are used. Table 5 shows the variables used in the regression model and their description.
Table 6 shows the coding for those qualitative variables that had to become quantified, “Sex”, “Educational Level Taught”, “Academic Qualifications”, and “Tittle of Center”, as well as the names and values of the new variables created.
The general model of multiple linear regression expresses the dependent variables as a function of the independent variables, according to the following formula:
Y = b0 + f(X1, X2,…, Xn).
In the particular case of this regression model, there are now 8 independent variables, leaving the equation in a generic way:
Y = b0 + b1 X1 + b2 X2 + b3 X3 + b4 X4 + b5 X5 + b6 X6 + b7 X7 + b8 X8,
Substituting the names of the independent variables Xn:
Y = b0 + b1 MAN + b2 AGE23 + b3 GRADUATE + b4 PRESCHOOL + b5 PRIMARY + b6 PRIVATE_C + b7 SUBSIDIZED_C + b8 TEACHING EXPERIENCE,
In the regression equation, for each dependent variable, only those independent variables with a significance value (p) less than 0.05 should be selected, and those with a significance level greater than 0.1 should be excluded, for lower levels of significance mean higher confidence levels [42]. Table 7 shows the non-standardized coefficients (bn) of the model, marked with “***” if the significance value (p) is less than 0.01, with “**” if p is greater than 0.01 and less than or equal to 0.05, and with “*” if the value of p is greater than 0.05 and less than or equal to 0.10. In the last row of Table 7, the term R2 is also shown to measure the goodness of fit of the model.
For each dependent variable (called “DDCC TOTAL”, “INFORMATION”, “CONTENT_CREATION”, “COMMUNICATION”, “SECURITY”, and PROBLEM_RESOL"), a model can be estimated according to the coefficients present for each one of them, and taking into account whether the significance value is small enough to ensure a 95% confidence level. In general, a positive coefficient (bn) contributes to an increase in the value of the dependent variable associated with the independent variable (Xn), decreasing in the case of being negative. Furthermore, it is necessary to select those variables that make a significant contribution [42].
In this analysis, it is observed that the variables “MAN”, “PRIVATE_C”, “SUBSIDIZED_C", and “TEACHING EXPERIENCE", always have a positive coefficient, providing an increase in the different dependent variables. This means that when the teacher is male, or when he is in a private or subsidized center, or when he has more teaching experience, and the rest of the variables being equal, the dependent variable increases and his digital skills are higher.
On the other hand, the variables “AGE23”, “PRESCHOOL”, and "PRIMARY” have negative coefficients for all dependent variables, except “PRIMARY” for the dependent variable “CONTENT_CREATION”, but in this case, it is not significant. Negative coefficients cause a decrease in the value of the dependent variable. This implies that the older the subject is, or if they teach infant or primary school and the rest of the variables are the same, the lower the value of the dependent variable—that is, of their digital skills.
Checking the significance levels, the variable related to the academic training of teachers (“GRADUATE”) could be eliminated from the model since they are greater than 0.1 for all dependent variables. If the variable is taken into account, the trend is that teachers whose training is Graduate (Three-year certificate), have a lower perception of their digital competence than those who have an Undergraduate Degree or a PhD.
In the particular case of “Total Digital Competence” (“DDCC TOTAL”), the model would be:
DDCC TOTAL = 2.494 + 0.186 MAN − 0.021 AGE23 − 0.229 PRESCHOOL − 0.055 PRIMARY + 0.123 PRIVATE_C + 0.068 SUBSIDIZED_C + 0.011 TEACHING EXPERIENCE,
The rest of the dependent variables would be expressed in the same way, using the coefficients associated with each of them in Table 7.
In Equation (4), it can be observed that men seem to have a greater “Total Digital Competence” (“TOTAL DDCC”) than women, their average being 2.494, and men scoring 0.186 points more, in equality of conditions (same type of center, same age, same years of experience) which would mean a “TOTAL DDCC” of 2.68, according to the regression model.
In the model for the dependent variable “INFORMATION” and for “PROBLEM_RESOL”, this difference would be slightly accentuated.
Regarding age, both in the perception of the “Total Digital Competence”, collected in “DDCC TOTAL”, and in each of the dependent variables associated with the 5 areas, the perception is inversely proportional to age, that is, older subjects are less digitally competent. More precisely, in “TOTAL DDCC”, the competence of the teacher would decrease proportionally to 0.021 per year older, provided that the rest of the independent variables are equal.
Analyzing the model from the independent variable "PRESCHOOL", for people who teach early childhood education, the value of the variable “DDCC TOTAL” would decrease by 0.229 points with respect to a teacher who works in a secondary school or training cycles. The value of the variable “INFORMATION” undergoes the strongest decrease, becoming 0.253 points lower, while in the dependent variable “CONTENT_CREATION” the decrease is lighter, causing a decrease of 0.203.
In the case of the variable “PRIMARY”, the trend is the same as in the case of “PRESCHOOL”, although the decrease is not as noticeable. In any case, the significance levels are not low enough to consider that there is a strong relationship with the variables “DDCC TOTAL”, “CONTENT_CREATION”, and “COMMUNICATION”.
If we examine the contribution to the dependent variables of the variables “PRIVATE_C” and “SUBSIDIZED_C”, a positive relationship can be observed; that is, people who teach in private centers or in subsidized centers reach a higher value at the level of digital competencies, compared to those who work in public centers. More precisely, in the case of “DDCC TOTAL”, the variable “PRIVATE_C” would cause an increase of 0.123 in its value, this increase being 0.236 in the variable “CONTENT_CREATION”, and 0.110 due to “SUBSIDIZED_C”, bearing in mind that these increases are considered only when the rest of the characteristics of the subjects are the same.
Finally, the variable “TEACHING EXPERIENCE” makes a positive contribution to the model and there is always a significant relationship, although the increase it causes in the dependent variables is relatively small. In the case of the variable “DDCC TOTAL”, of the “CONTENT_CREATION”, and of the “PROBLEM_RESOL” each year of experience would bring about an increase of 0.011 points.
To conclude the regression analysis, we have the R2 terms as a measure of the goodness of fit. In this analysis, the different R2 obtained range from 0.048 for “SECURITY” to 0.112 for “INFORMATION”, being 0.110 for “DDCC TOTAL”. This can be interpreted as choosing a random subject, about whom we know nothing; there is a certain uncertainty (variance), of what would be the value of the dependent variables, that is, of their digital skills. Knowing data of the teacher corresponding to the independent variables, and using this model, we could make a prediction that the uncertainty (variance) decreases by 11% in “DDCC TOTAL”, by 11.2% in “INFORMATION”, by 9,9% in “CONTENT_CREATION”, by 8.6% “COMMUNICATION”, by 4.8% “SECURITY”, and by 10.6% in “PROBLEM_RESOL”, when compared to the original.

3.2. Training Proposal to Train Teachers Starting from Their Digital Competence Level

Drawing from the results obtained, a proposal for each skill area is put forward in this section that specifies the adequate training for the needs arising and in accordance with the areas defined in the Common Framework of Teacher Digital Competence [28,29]. Figure 7 shows a summary of the items of the different competency areas that the teaching staff has, and a graph is obtained with an average rating of overall digital competence (2.32, B1 level according to the INTEF [28]) and in its five dimensions or areas following the INTEF classification [28]. Table 3 shows these values.
Training teachers this way will be conducive to improving their digital competencies which, in turn, is the necessary previous step to upgrading the technological abilities of students. Technology thus becomes a key element in developing different skills inherent in the citizens of the 21st century, who belong to the so-called knowledge society. The use of technology becomes crucial since it is the means to gain access to global knowledge [44]. Digital Competency Training should, therefore, be part of state educational policies and from different academic institutions [45]. However, although in this proposal, and in the majority of teacher training proposals, they address the most instrumental aspect of the use of technologies, which is only the most visible part, what should really be transformed is classroom practice [46].
Digital skills training should go hand-in-hand with improvements in educational practices. This training must take into account the relationships among pedagogical models, methodologies, teaching and learning materials, and competencies in the use of technological resources and equipment, succumbing to the non-desirable technocracy in teaching–learning processes [47].
The most common means that the teaching staff use to train themselves in ICT is either self-learning or peer support [24]. Institutions should provide regulated training that strengthens digital literacy and optimizes the teacher training process.
In accordance with, among others, some of the indications proposed in Reference [29] of the Official State Gazette of the Spanish Government, a series of training measures were proposed with the aim of significantly improving the levels of digital competence of teachers at all educational levels.
As can be seen in Figure 7, “Information and Information Literacy” is mentioned, despite being the area with the best results, only an average of 2.82 is reached, which is considered a B2 level. According to Reference [24], the training related to this area should focus on properly managing the data, its veracity, its organization, and its presentation. To improve in this area, training should be focused on understanding how to generate information and how it is shared in digital media. Teachers should be instructed in the choice and use of different search engines in order to be able to choose which ones are better for specific needs of finding information. Knowing how to work with search engines means knowing how these search engines classify data, how they work in different gadgets, how to use filters, keywords that limit the amount of data depending on the specific needs of the search, and knowing how to use hyperlinks. It is also important that teachers know how data is stored in different gadgets and are familiar with different storage options. The teaching staff should be able to find relevant data for their teaching assignments, choose worthwhile educational resources, and efficiently manage different sources to develop personal information strategies [28,29].
These are some of the most important points an efficient training should address to improve “Information and Information Literacy”.
In order to compensate for the shortcomings of “Communication and Collaboration”, which in this study obtains an average of 2.14 (B1), a rather low figure, further work should be done on communication in digital environments. Teachers must be able to share resources by means of web-based tools, to connect online with other teachers and to collaborate in digital environments, to interact and to participate in online communities and social networks. Therefore, a training is proposed that prepares teachers to correctly convey information through e-mails, digital presentations, blogs, and social networks. Teachers should be able to not only transmit the information directly but also to transform or modify it, citing correctly, and sharing data selectively, knowing how it is published—i.e., whether it is public or private. It is important that teachers know what subject matter can be shared publicly or not, and which environments are more adequate to share certain contents. Thus, the teacher should be familiar with the different types of social networks and the regular users of those networks, as well as with where to find specific online communities to collaborate with in order to share the results of their work. In these cases, it is important to know how to check the property rights and how to use digital content in order to avoid plagiarism [48]. To collaborate in virtual environments, it is also important to be acquainted with collaborative working dynamics [49] and, among other tasks, with how to provide and receive feedback on the contributions made. When using collaborative and participative tools, it is essential to monitor the changes and comments made by the participants in the shared documents.
As mentioned above, “Creation of Digital Content” is a key skill for proper transformation and methodological adaption. However, this item obtains the lowest average score, 2.01 (B1, extremely near to A2), out of 6. It is evident that teachers should know how to create content, a simple technological adaptation is not enough. What matters is that this new scenario has other characteristics and another potential. In many cases, the same teaching materials have been used that were created for a face-to-face teaching environment, and for students of prior generations with different characteristics to the current ones, but the materials have not changed at the same pace as the school children [50].
In the competence area of “Security”, an average score of 2.23 (B1) is reached, which is considered a rather low figure. The need to be trained in this area becomes unquestionable in the early stages of training when school children are younger. When teachers begin to work in a virtual setting, they must be aware of the need to take safety measures, carrying out a responsible and safe use of both the information and the content they work with, like their network exposure and that of the student body. The inadequate use of ICT also affects other dimensions of the psycho-affective and social development of schoolchildren, so it is necessary to be acquainted with the most common security problems to be able to adopt appropriate measures [51].
One of the initial steps should be an assessment of the risks existing on the web, followed by training in how to develop skills to fight threats and in how to adequately manage and use passwords. Another skill to develop is the management of digital—i.e., how it can be used by third parties not only for commercial purposes, how to prevent digital identity theft, and what consequences it may bring about. Faculty should be trained to be able to understand and trace their digital fingerprint, to track down the existing data on the web about themselves or about others, to eliminate or modify it, to be aware of its permanence in time and its consequences and, of course, to transmit this knowledge to their pupils so that they can act with the necessary caution. It is necessary to train the teaching staff to develop strategies, to be able to detect and redirect cyber-aggression situations and cyber-victimization not only to the one who bears the brunt of the aggression but also to be capable of conveying to their pupils the risk that their participation on the net entails, the need to act with caution and responsibility and to detect and avoid misconducts which appear [52]. Internet is a space full of learning possibilities, but it is also a setting where safety measures should be seriously taken into account, especially in cases where minors are concerned. Fortunately, there is no doubt about the need to develop skills in digital security. In fact, teachers are usually very receptive to it [53].
Finally, in the area of “Problem Resolution”, the average score is 2.38 (B1), which is also very low. More often than not, the training available for teachers is purely instrumental and theoretical. It would be much more efficient if it was based on problem resolution [24].
More precisely, the training in this area should be aimed at resolving conceptual problems by means of digital mediums, at using technology in a creative manner, and at developing abilities to solve technical problems [28]. This area encompasses critical analysis and self-assessment of problems that can arise with the use of ICT, instrumental skills, and the capability of independently solving technical problems [32].
Solving technical problems has been a very prominent weakness during the months of the lockdown, which has impeded the acquirement of any other digital skills. Consequently, the training should first focus on learning the main elements of the digital device one works with, whether a computer, a tablet, or a telephone. Secondly, the training should focus on how to identify the problem to resolve it and, of course, on how to look for information to solve a technical problem. It is necessary to know both the potential and the limitations of at least the gadgets one works with. Therefore, it is desirable that teachers attain skills to solve troubleshooting connection problems, to carry out document retrieval, and to handle peripheral problems.

4. Discussion and Conclusions

The findings of the present analysis led to the conclusion that the self-perception of the teachers who participated in the study of their digital competencies is low and they consider that the above-mentioned skills must be strengthened. The results show that the total competency level of the teachers participating in this study is 2.32, that is to say, a B1, a low intermediate level. Only 1.7% of those surveyed reach a really high level, C2, and 7.5% reach a level C1. At the other end, 4.1% have an A1 level, and 23.8% an A2. Although not desirable, these low levels are to be expected, but it is necessary to have evidence of them so that this knowledge can be added to other research projects with similar results [13,24,31,50,54,55]. This fact is much more evident in those areas associated with methodological transformation, as in the case of “Creation of Digital Content”, where the mean hardly reaches 2.01, a bare B1.
This analysis has been carried out to get the “picture “of the real level of the teachers’ digital competencies in order to develop training plans that best suit the level of each teacher. The analysis reveals that the design of the training programs must be organized around three variables. First, once the level of digital competence of the teachers (from A1 to C2) is identified, groups of the same level are generated with the aim of advancing at least one level after the training received (A1 > A2; A2 > B1; B1 > B2; B2 > C1; C1 > C2). Second, the training program must be adjusted to the ICT ecosystem used in each center (Google, Apple, Microsoft, Tools 3.0, LMS, etc.), with Google being the most widely chosen option. Finally, the set of methodologies and didactic strategies usually deployed in the classroom must be taken into account, which is normally of the active-inductive type: PBL (Learning Based on Projects, Cooperative, Flipped Learning, Peer Teaching, Discovery-Based Learning, between others). In short, the analysis of the digital competencies, together with ICT tools and the methodological approach, constitute the central axis in the overall design of the training plan, with the aim of creating the most coherent, customizable, and efficient program.
In this respect, it seems logical that adequate teacher training schemes be designed, implemented, and revised both for the improvement of digital skills overall and for those that encourage and sustain methodological change, paying special attention to the latter. Authors, as in Reference [56], also suggest a series of specific measures related to technology that allows teachers to choose their learning program in a technological context. In their report, the authors spot existing differences between innovative classroom activity and the actual usage of technology for that true transformation of the teaching–learning process.
On the other hand, through a linear regression analysis, it has been possible to obtain a model that observes, explains, or estimates how the characteristics of those surveyed—sex, age, teaching experience, teaching level taught, and title of the center—can influence the levels of their digital skills. Statistical techniques can help to systematize knowledge from the data collected, in this case, to predict what the digital competence of a teacher would be, based on their characteristics. These techniques cannot be a substitute for good work as social researchers when interpreting a model. Explaining a regression model by simply observing how a dependent variable can change, depending on the independent variables available, is an incomplete interpretation [42]. Other factors that may influence our model are either unknown or cannot be accessed, for example, teacher motivation, extrinsic and intrinsic factors, personal context, area of knowledge, characteristics of the teaching team with whom they work, and the management team of the center, among others. It is difficult to control all the variables that may influence digital competence and its dimensions, which have been set out here. In future research, in order to improve the analysis, an attempt should be made to complete the study by taking into account some of these currently uncontrolled variables, such as the area of knowledge and/or the characteristics of the management team in the workplace.
Despite the limitations of this analysis, a linear regression model has been obtained, which allows us to estimate and explain the degree to which some of the characteristics of the population under study may influence their digital competence. It is observed that, when comparing two teachers who work in the same center and teach at the same educational level, of the same age, and with the same years of experience, the teacher who was a man could have greater digital competence. It could be translated, in that “men” in general terms have a better perception of their digital skills, coinciding with the study of Reference [57]. However, authors like Reference [55] do not find any differences.
Similarly, all other characteristics being equal, a younger teacher seems to have better competency levels than an older teacher, which also accords with research like that of Reference [55]. According to the model, teachers from private centers would have a higher level than those of subsidized centers or public schools. These results contradict those of the study carried out by Reference [31], which concludes that public schools had higher levels of digital competencies than private centers.
On the other hand, it seems that teachers with higher academic qualifications would have a higher level in their digital skills. However, this piece of information is not significant in accordance with the study submitted by the authors of Reference [55], who concluded that there were not any notable differences.
Regarding the educational level at which the subject teaches, in this analysis, and in accordance with the study of Reference [55], the model predicts that those who teach at higher levels have a better digital competencies profile. Comparing the competence levels of two teachers of the same age, and with the same years of experience, working in the same type of center, a secondary school teacher would have a higher competence level than a primary school or nursery teacher.
Moreover, finally, in terms of the years of experience of the teachers, and also in accordance with Reference [55], the more experience the teacher has, the higher their level of competence. This may at first seem contradictory with the fact that the younger you are, the better your digital competence is. However, it could be understood as the case of two teachers of the same sex, same age, same center, teaching the same level, where the one with more experience would have greater digital competence. As in most studies of this type, one of the limitations we have encountered is the difficulty to access a sufficiently varied sample that adequately represents the population. Despite this, we are satisfied with the number of participants included in this study. Furthermore, the similarity with other studies already mentioned strengthens our results. We are currently collecting more data to expand the analysis in order to compare the effect of the best training on the improvement of digital competencies. The results should show which skills have actually improved, and which have remained at low levels, after the COVID-19 effect.
Therefore, it is considered essential, in the following phase of the study, to conduct an adequate qualitative analysis of the reasons that have instigated teachers who have not attained a sufficient competence level to undertake the methodological change through the use of ICT. In this respect, Reference [58] highlights three factors: first, “attitude” as the level of acceptance. This factor is based on three elements: “perceived usefulness”, “the perception of its ease of use” and “compatibility”, and its usefulness is unquestionable. Second, the “subjective standard”, which refers to certain social pressure that obliges a teacher to accept a given position at the moment of technological implementation; in this case, social pressure or, rather, social need, has been decisive. Moreover, third, [58] emphasize a thoroughly analyzed aspect of this paper: “the awareness of self-competence”. This factor comes into play in circumstances where individuals do not have total control of their competency, and it can be divided into two elements: on the one hand, “self-efficiency” in the use of one particular technology, which is based on a feeling of “comfort” for the educator to decide if he adopts certain technologies. This feeling of comfort was displaced during the 2019–2020 school year, turning the use of technologies into an obligation. On the other hand, the so-called “enabling conditions”, which have to do with the availability of resources (economic, provisional, formative…) when taking into account the use of technologies. In this case, this availability mainly refers to formative resources for both their learning process and for its practical use in their job. Those responsible for education have found themselves obliged to provide training in record time and without sufficient guarantees of success.
The improvement of the main digital competencies of the teaching body must be accompanied by the competence development of the two cross-sectional areas “Security” and “Problem Resolution”, whose levels reached 2.23 (B1) and 2.38 (B1), respectively, i.e., low intermediate. The former is especially important because of the implications that it has in terms of both the legal protection of minors on the web- with reference to knowledge and consistency in local, regional, national, and European regulations—and the laws on the subject of data protection.
We consider that innovation in the field of education, be it mediated or not by technology, must spin around teachers, since they are the focal point of educational intervention, thus implying the improvement in the knowledge of their teaching activity: on know-how and on carrying it out [59]. It is obvious that in view of the analyzed results and of the events during the confinement period of the 2019–2020 school year, the technological resources available are not being exploited to their full potential. This is occasionally due to the lack of technical equipment but more so due to the teachers’ lack of preparation [24,60,61]. Previously, small changes were implemented in the classroom, but not a sustainable development in the learning approach [27,57,62,63,64], and far less a digital literacy adequate enough to undertake online teaching relying on technology, as was necessary during the 2019–2020 school year. A teacher training program, adapted and specialized, is the next necessary step to take action urgently. The uncertainty of the upcoming academic years stresses this need.
Moreover, teacher training is not the only factor that can influence the improvement of digital competence. School organization, education policies, and the role of publishing and technology industries also have something to add but they are factors beyond our control.
What would make teachers become involved in a real methodological change was questioned at the time by Reference [65]. Twelve years later, 2020 has answered that question in a way those authors could not foresee. Being forced to use technology to adapt teaching to a virtual format because of the impossibility of teaching in the classroom was the most compelling reason.
It is, therefore, essential to focus on the specialized training of teachers, spotting their main weaknesses and looking into them, helping them to attain an adequate level of data literacy, in order to face the new educational paradigm successfully. Technology and education should converge to guide the students in their acquisition of the key competencies necessary for their full integration as citizens in the digital world.

Author Contributions

Conceptualization, written by R.S.C. and C.S.-C.; methodology, C.S.-C. and M.T.S.-C.; validation, C.S.-C., M.T.S.-C., and R.S.C.; formal analysis, C.S.-C. and M.T.S.-C.; investigation, C.S.-C., R.S.C., and M.T.S.-C.; resources, C.S.-C., R.S.C., and M.T.S.-C.; data curation, C.S.-C. and M.T.S.-C.; writing original draft preparation, C.S.-C., R.S.C., and M.T.S.-C.; writing review and editing, C.S.-C., R.S.C., and M.T.S.-C.; visualization, C.S.-C., R.S.C., and M.T.S.-C.; supervision, R.S.C.; project administration, R.S.C. All authors have read and agreed to the published version of the manuscript.

Funding

This research was partially funded by Foundation BIAS, as part of one of the lines of research and development defined in the OTRI project “Design and development of a system for analysis, diagnosis and teachers training in Digital skills” with reference number OTEM 160907- University of La Rioja (Spain).

Institutional Review Board Statement

Ethical review and approval were waived for this study, due to at the time we collected the data, this process was not necessary at the University of La Rioja and BIAS Foundation (reference institutions for this project). Anyway all questionnaires included this introductory text: We assure you that all data will be treated confidentially (as indicated in Organic Law 3/2018, of December 5, on the Protection of Personal Data and guarantee of digital rights); being the ultimate goal of exclusively academic analysis.

Informed Consent Statement

Informed consent was obtained from all subjects involved in the study.

Data Availability Statement

The data presented in this study are available on request from the corresponding author. The data are not publicly available due to they may include personal information of the survey respondents.

Conflicts of Interest

The authors declare no conflict of interest. The funders had no role in the design of the study; in the collection, analyses, or interpretation of data; in the writing of the manuscript, or in the decision to publish the results.

References

  1. Real Decreto 463/2020, de 14 de Marzo, por el que se Declara el Estado de Alarma para la Gestión de la Situación de Crisis Sanitaria Ocasionada por el COVID-19; 14 de Marzo de 2020; BOE núm. 67; Boletín Oficial del Estado: Madrid, España, 2020; Available online: https://bit.ly/3n0WjJj (accessed on 25 March 2020).
  2. UNESCO. Perturbación y Respuesta de la Educación de Cara al COVID-19. 2020. Available online: https://bit.ly/3gaoQJp (accessed on 10 December 2019).
  3. Hodges, C.; Moore, S.; Lockee, B.; Trust, T.; Bond, A. The Difference between Emergency Remote Teaching and Online Learning. Educause Review, 27 Marzo. Available online: https://bit.ly/3hK3XoR (accessed on 3 March 2020).
  4. Zenteno, A.; Mortera, F.J. Integración y apropiación de las TIC en los profesores y los alumnos de educación media superior. Apertura 2011, 3, 142–155. [Google Scholar]
  5. Escudero Escorza, T. Evaluación del profesorado como camino directo hacia la mejora de la calidad educativa. Rev. Investig. Educ. 2019, 37, 15–37. [Google Scholar] [CrossRef]
  6. Ferrari, A.; Punie, Y.; Redecker, C. Understanding Digital Competence in the 21st Century: An Analysis of Current Frameworks. In 21st Century Learning for 21st Century Skills. EC-TEL 2012. Lecture Notes in Computer Science; Ravenscroft, A., Lindstaedt, S., Kloos, C.D., Hernández-Leo, D., Eds.; Springer: Berlin/Heidelberg, Germany, 2012; Volume 7563. [Google Scholar] [CrossRef]
  7. Lee, A.Y.; So, C.Y. Alfabetización mediática y alfabetización informacional: Similitudes y diferencias. Comun. Rev. Científica Comun. Educ. 2014, 21, 137–147. [Google Scholar] [CrossRef] [Green Version]
  8. Guzmán, I.; Marín, R. La competencia y las competencias docentes: Reflexiones sobre el concepto y la evaluación. Rev. Interuniv. Form. Profr. 2011, 14, 151–163. [Google Scholar]
  9. Vuorikari, R.; Punie, Y.; Carretero, S.; Van den Brande, G. «DigComp» 2.0: The Digital Competence Framework for Citizens. Update Phase 1: The Conceptual Reference Model; Luxembourg Publication Office of the European Union: Luxembourg, 2016; Available online: https://bit.ly/21320Fl (accessed on 4 February 2021).
  10. Centeno Moreno, G.; Cubo Delgado, S. Evaluación de la competencia digital y las actitudes hacia las TIC del alumnado universitario. Rev. Investig. Educ. 2013, 31, 517–536. [Google Scholar] [CrossRef] [Green Version]
  11. Redecker, C. European Framework for the Digital Competence of Educators: DigCompEdu; Punie, Y., Ed.; Joint Research Centre; Publications Office of the European Union: Luxembourg, 2017. [Google Scholar]
  12. Imbernón Muñoz, F.; Silva García, P. Competencias en los procesos de enseñanza-aprendizaje virtual y semipresencial. Comun. Rev. Científica Comun. Y Educ. 2011, 18, 107–114. [Google Scholar]
  13. Pérez-Escoda, A.; Conde, M.J.R. Evaluación de las competencias digitales autopercibidas del profesorado de educación primaria en Castilla y León (España). Rev. Investig. Educ. 2016, 34, 399–415. [Google Scholar] [CrossRef] [Green Version]
  14. Salmerón Pérez, H.; Rodríguez Fernández, S.; Gutiérrez Braojos, C. Metodologías que optimizan la comunicación en entornos de aprendizaje virtual. Comun. Rev. Científica Comun. Educ. 2010, 34, 163–171. [Google Scholar]
  15. Brynjolfsson, E.; McAfee, A. The Second Machine Age: Work, Progress, and Prosperity in a Time of Brilliant Technologies; Norton y Company: New York, NY, USA, 2014. [Google Scholar]
  16. Gisbert, M.; Lázaro, J.L. Professional development in teacher digital competence and improving school quality from the teachers’ perspective: A case study. J. New Appr. Edu. Res. 2015, 4, 115–122. [Google Scholar] [CrossRef] [Green Version]
  17. Gairín Sallán, J.G.; Feixas, M.; Guillamón, C.; Vilamitjana, D.Q. La tutoría académica en el escenario europeo de la Educación Superior. Rev. Interuniv. Form. Profr. 2004, 49, 61–78. [Google Scholar]
  18. Gutiérrez Martín, A.; Palacios Picos, A.; Torrego Egido, L. Tribus digitales en las aulas universitarias. Comun. Rev. Científica Comun. Educ. 2010, 17, 173–181. [Google Scholar] [CrossRef] [Green Version]
  19. Rangel, A. Competencias docentes digitales: Propuesta de un perfil. Píxel Bit. Rev. Medios Educ. 2015, 46, 235–248. [Google Scholar]
  20. Hernández, A. La formación del profesorado para la integración de las TIC en el currículum: Nuevos roles, competencias y espacios de formación. In Investigación y Tecnologías de la Información y Comunicación al Servicio de la Innovación Educative; García-Varcárcel, A., Ed.; Universidad de Salamanca: Salamanca, Spain, 2008; pp. 33–56. [Google Scholar]
  21. UNESCO. Estándares de Competencia en TIC para Docentes. 2008. Available online: https://bit.ly/2Vru4WD (accessed on 14 November 2019).
  22. González Martinez, J.; Espuny Vidal, C.; de Cid Ibeas, M.J.; Gisbert Cervera, M. INCOTIC-ESO. Cómo autoevaluar y diagnosticar la competencia digital en la Escuela 2.0. Rev. Investig. Educ. 2012, 30, 287–302. [Google Scholar] [CrossRef] [Green Version]
  23. The European Parliament and the Council of the European Union (2006/962/EC) 18 de diciembre. Recommendation of the European Parliament and of the Council on Key Competences for Lifelong Learning. 2006. Available online: https://bit.ly/3n5ext6 (accessed on 14 April 2020).
  24. Lores Gómez, B.; Sánchez Thevenet, P.; García Bellido, M.R. La formación de la competencia digital en los docentes. Profr. Rev. Currículum Form. Profr. 2019, 24, 234–260. [Google Scholar]
  25. Cabero, J. Formación del profesorado universitario en TIC. Aplicación del método Delphi para la selección de los contenidos formativos. Educ. XX1 2014, 17, 111–132. [Google Scholar]
  26. Altuna Urdín, J.; Martínez de Morentin de Goñi y Amenabar Perurena, N. Las teorías de enseñanza-aprendizaje y los recursos de Internet: Su confluencia en centros de primaria. Estud. Sobre Educ. 2017, 33, 145–167. [Google Scholar] [CrossRef] [Green Version]
  27. Santiago, R.; Navaridas, F.; Andía, L. Perceptions of school leaders about the use and value of ICT for educational change and innovation. Estud. Sobre Educ. 2016, 30, 145–174. [Google Scholar]
  28. INTEF. Marco Común de Competencia Digital Docente. 2017. Available online: https://bit.ly/2jqkssz (accessed on 15 November 2019).
  29. Resolución de 2 de julio de 2020, de la Dirección General de Evaluación y Cooperación Territorial; 13 de julio de 2020. BOE nº 191; Boletín oficial del Estado: Madrid, España, 2020; Available online: https://bit.ly/35fodLP (accessed on 14 July 2020).
  30. Santiago, R.; Bergmann, J. Aprender al Revés: Flipped Classroom y Metodologías Activas en el Aula; Planeta-Paidós: Barcelona, Spain, 2018. [Google Scholar]
  31. Fuentes Cabrera, A.; López, J.; Pozo, S. Análisis de la competencia digital docente: Factor clave en el desempeño de pedagogías activas con realidad Aumentada. Reice Rev. Iberoam. Sobre Calid. Efic. Cambio Educ. 2019, 17, 27–42. [Google Scholar]
  32. Girón-Escudero, V.; Cózar-Gutiérrez, R.; González-Calero Somoza, J.A. Análisis de la autopercepción sobre el nivel de competencia digital docente en la formación inicial de maestros/as. Rev. Electrónica Interuniv. Form. Profr. 2019, 22, 193–218. [Google Scholar]
  33. Martín, D.; Chocarro, E.; Santiago, R.; Sáenz de Jubera, M. Diseño de un instrumento para evaluación diagnóstica de la Competencia digital docente: Formación flipped classroom. Rev. Dim Didáctica Innovación Multimed. 2016, 33, 1–15. [Google Scholar]
  34. Tourón, J.; Martín, D.; ASENCIO, N.; Pradas, S.; Íñigo, V. Construct validation of a questionnaire to measure teachers’ digital competence (TDC). Rev. Española Pedagog. 2018, 76, 25–54. [Google Scholar]
  35. ACDC. Análisis Competencias Digitales Comunes; Santiago Campión, R., Saenz de Jubera, M., Martín, D., Chocarro, E., Eds.; Available online: https://es.surveymonkey.com/r/acdcv2 (accessed on 4 February 2021).
  36. Gliem, J.A.; Gliem, R.R. Calculating, interpreting, and reporting Cronbach’s Alpha reliability coefficient for likert-type scales. In Proceedings of the Midwest Research-to-Practice Conference in Adult, Continuing, and Community Education, Ohio State University, Columbus, OH, USA, 8–10 October 2003. [Google Scholar]
  37. George, D.; Mallery, P. SPSS for Windows Step by Step: A Simple Guide and Reference, 11.0 Update, 4th ed.; Allyn y Bacon: Boston, MA, USA, 2002. [Google Scholar]
  38. Pereda Marín, S. Psicología Experimental. I, Metodología; Pirámide: Madrid, Spain, 1986. [Google Scholar]
  39. Escuela de Competencia Digital. Available online: https://escuelacompetenciadigital.com/ (accessed on 2 October 2019).
  40. MECD. Cifras clave sobre el uso de las TIC para el aprendizaje y la innovación en los centros escolares de Europa. MECD. 2011. Available online: https://bit.ly/2XmCWyk (accessed on 14 November 2019).
  41. Tejedor Tejedor, F.J.; Etxeberría Murgiondo, J. Análisis Inferencial de Datos en Educación; La Muralla: Madrid, Spain, 2006; Volume 2. [Google Scholar]
  42. Guillén, M.F. Análisis de Regresión Múltiple. In Cuadernos Metodológicos; Centro de Investigaciones Sociológicas: Madrid, Spain, 2014. [Google Scholar]
  43. Serrano Angulo, J. Nociones básicas sobre el análisis inferencial. In Principios, Métodos y Técnicas Para la Investigación Educative; Nieto Martín, S., Ed.; Dykinson: Madrid, Spain, 2010; pp. 354–371. [Google Scholar]
  44. Arancibia, M.L.; Cabero, J.; Marín, V. Creencias sobre la enseñanza y uso de las tecnologías de la información y la comunicación (TIC) en docentes de educación superior. Form. Univ. 2020, 13, 89–100. [Google Scholar] [CrossRef]
  45. Villarreal-Villa, S.; García-Guliany, J.; Hernández-Palma, H.; Steffens-Sanabria, E. Competencias docentes y transformaciones en la educación en la era digital. Form. Univ. 2019, 12, 3–14. [Google Scholar] [CrossRef] [Green Version]
  46. Valencia-Molina, T.; Serna-Collazos, A.; Ochoa-Angrino, S.; Caicedo-Tamayo, A.M.; Montes-González, J.A.; Chávez-Vescance, J.D. Competencias y Estándares TIC desde la Dimensión Pedagógica: Una Perspectiva desde los Niveles de Apropiación de las TIC en la Práctica Educativa Docente; Pontificia Universidad Javeriana: Santiago de Cali, Colombia, 2016. [Google Scholar]
  47. Mato-Vazquez, D.; Álvarez-Seoane, D. La implementación de TIC y MDD en la práctica docente de educación primara. Campus Virtuales 2019, 8, 73–84. [Google Scholar]
  48. Gómez-Espinosa, M.; Francisco, V.; Moreno-Ger, P. El impacto del diseño de actividades en el plagio de Internet en educación superior. Comun. Rev. Científica Comun. Educ. 2016, 24, 39–48. [Google Scholar]
  49. García-Chitiva, M.; Suárez-Guerrero, C. Estudio bibliométrico de la producción científica en web of science: Formación profesional y blended learning. Pixel Bit. Rev. Medios Educ. 2019, 56, 169–191. [Google Scholar] [CrossRef]
  50. Piñón, L.C.; Sapién, A.L.; Gutiérrez, M.C. Autoevaluación de docentes en competencias tecno-pedagógicas para la elaboración de materiales didácticos virtuales. Publicaciones 2019, 49, 161–177. [Google Scholar]
  51. Rodriguez-Gómez, D.; Castro, D.; Meneses, J. Usos problemáticos de las TIC entre jóvenes en su vida personal y escolar. Comun. Rev. Científica Comun. Educ. 2018, 56, 91–100. [Google Scholar]
  52. Álvarez García, D.; Barreiro-Collazo, A.; Núñez, J. Ciberagresión entre adolescentes: Prevalencia y diferencias de género. Comun. Rev. Científica Comun. Educ. 2017, 50, 89–97. [Google Scholar]
  53. Gallego-Arrufat, M.J.; Torres-Hernández, N.; Pessoa, T. Competencia de futuros docentes en el área de seguridad digital. Comun. Rev. Científica Comun. Educ. 2019, 27, 57–67. [Google Scholar]
  54. Andía Celaya, L.A.; Santiago Campión, R.; Sota Eguizabal, J.M. Estamos técnicamente preparados para el flipped classroom? Un análisis de las competencias digitales de los profesores en España. Contextos Educ. Rev. Educ. 2020, 25, 275–311. [Google Scholar] [CrossRef]
  55. Fernández-Cruz, F.; Fernández-Díaz, M. Los docentes de la Generación Z y sus competencias digitales. Comun. Rev. Científica Comun. Educ. 2016, 24, 97–105. [Google Scholar]
  56. Fullan, M.; Donnelly, K. Alive in the Swamp, Assessing Digital Innovations in Education; NESTA: London, UK, 2013. [Google Scholar]
  57. Cacheiro González, M.L.; Sánchez Romero, C.; González Lorenzo, J.M. Recursos Tecnológicos en Contextos Educativos; UNED: Madrid, Spain, 2016. [Google Scholar]
  58. García-Valcárcel Muñoz-Repiso, A.; Salvador Blanco, L.; Casillas Martín, S.; Basilotta Gómez-Pablos, V. Evaluación de las competencias digitales sobre seguridad de los estudiantes de Educación Básica. Rev. Educ. Distancia (Red) 2019, 19, 1–34. [Google Scholar] [CrossRef]
  59. Amo, D. y Santiago, R. Learning Analytics. La Narración del Aprendizaje a Través de los Datos; Editorial UOC: Barcelona, Spain, 2017. [Google Scholar]
  60. De Pablos, J.; Colás, P.; Villaciervos, P. Políticas educativas, buenas prácticas y TIC en la comunicad autónoma andaluza. Teoría Educ. Educ. Cult. Soc. Inf. 2010, 11, 180–202. [Google Scholar]
  61. García-Valcárcel, A.; Tejedor, F.J. Evaluación de procesos de innovación escolar basados en el uso de las TIC desarrollados en la Comunidad de Castilla y León. Rev. Educ. 2010, 352, 125–147. [Google Scholar]
  62. McClintock, R. Prácticas pedagógicas emergentes. Cuad. Pedagog. 2000, 290, 74–77. [Google Scholar]
  63. Fullan, M. Liderar en una Cultura de Cambio; Octaedro: Barcelona, Spain, 2002. [Google Scholar]
  64. Miranda Martín, E. La supervisión escolar y el cambio educativo. Un modelo de supervisión para la transformación, desarrollo y mejora de los centros. Profr. Rev. Currículum Form. Profr. 2002, 6, 1–15. [Google Scholar]
  65. Ajzen, H.; Hartshorne, R. Investigating faculty decisions to adopt Web 2.0 technologies: Theory and empirical tests. Internet High. Edu. 2008, 11, 71–80. Available online: https://bit.ly/2T6jcRd (accessed on 4 February 2021).
Figure 1. Five fields of digital competency and 21 digital competencies according to the “DigComp” 2.0—the Conceptual Reference Model. Adapted from Reference [28]. Source: own elaboration.
Sustainability 13 01858 g001
Figure 2. Instruction text of Analysis of Common Digital Competences (ACDC) questionnaire. Own elaboration.
Sustainability 13 01858 g002
Figure 3. Questionnaire ACDC questions. Source: Translated from Reference [35].
Sustainability 13 01858 g003aSustainability 13 01858 g003bSustainability 13 01858 g003c
Figure 4. Summary of responses to the ACDC questionnaire, grouping “knowledge” and “usage” variables. Own elaboration.
Sustainability 13 01858 g004
Figure 5. Correspondence of the Common Framework of Digital Competence with the Likert scale of the ACDC questionnaire. Adapted from INTEF (Spanish acronym for National Institute of Educational Technologies and Teacher Training) [28]. Own elaboration.
Sustainability 13 01858 g005
Figure 6. Teachers in each skill level of INTEF (A1, A2, B1, B2, C1, C2) [28]. Source: Own elaboration.
Sustainability 13 01858 g006
Figure 7. Average digital competence of Spanish teachers: global results of the report according to the scale of the common framework of competencies of the INTEF [28]. Source: Own elaboration.
Sustainability 13 01858 g007
Table 1. Cronbach’s alpha coefficients as reliability indices. Own elaboration.
AreaNi: N° Variables/AreaAlfa Cronbach
Variables of “Knowledge”
Alfa Cronbach
Variables of “Usage”
Alfa Cronbach
“Knowledge” + “Usage” (Double Ni)
“Information and Information Literacy”80.8820.8480.930 (N = 16)
“Communication and Collaboration”70.8650.8300.918 (N = 14)
“Creation of Digital Content”140.9170.8870.947 (N = 28)
“Security”60.8520.8270.917 (N = 12)
“Problem Resolution”120.9280.9100.957 (N = 24)
Total470.9710.9590.981 (N = 94)
Table 2. Centralization variables by area and “knowledge” or “usage”.
Area“Knowledge”“Usage”
MeanMedianModeMeanMedianMode
Information and Information Literacy.28,5023327,88533
Communication and Collaboration.22,6012220,27622
Creation of digital content.21,0032219,18922
Security.22,8232221,72922
Problem Resolution.24,1082223,51222
Table 3. Statistical variables by area of digital competence. Own elaboration.
VariableMeanMedianModeStandard Desv. Variance
Total Digital Competence.2.32220.506260.256
Information and Information Literacy.2.82330.556330.310
Communication and Collaboration.2.4220.604750.366
Creation of digital content.2.01220.530600.282
Security.2.23220.611860.374
Problem Resolution.2.38220.598100.358
Table 4. Summary of Pearson’s chi-squared coefficient value, and the associated probability (bilateral asymptotic length (p)). Own elaboration.
VariablePearson’s Chi-Squared Coefficient Valuedf
TDCINFCOMCDCSECPR
«Sex»118.083 ***166.591 ***87.396 ***81.994 ***63.683 ***178.042 ***5
«Age»171.918 ***148.670 ***179.905 ***156.718***91.580 ***161.860 ***20
«Educational Level Taught»97.774 ***122.386 ***63.012 ***109.763 ***80.485 ***88.838 ***35
«Teaching Experience»105.441 ***79.953 ***78.339 ***90.606 ***54.045 ***95.048 ***20
«Academic Qualifications»48.113 ***89.767 ***38.996 ***44.562 ***22.808 *23.839 *15
«Title of the Work Center»57.523 ***47.066 ***41.663 ***95.772 ***38.517 ***34.250 ***15
*** sig. bilateral asymptotic length (p) < 0.05; * sig. bilateral asymptotic length (p) < 0.1.
Table 5. Names of the variables used and their description. Own elaboration.
VariableDescription
MANIf the person surveyed is a woman, this variable will be 0, if it is a man it will be 1
AGE23Age of the subject, based on the minimum value of the sample, 23 years.
GRADUATEIf the teacher is a Graduate (Three-year Certificate), this variable will be 1; if he has an Undergraduate Degree or PhD, it will be 0.
PRESCHOOLIf the teacher is a Childhood Ed. teacher, it will be 1, otherwise it will be 0.
PRIMARYIf the teacher is a primary school teacher, it will be 1, otherwise it will be 0.
PRIVATE_CIf the teacher is from a private center it will be 1, otherwise it will be 0.
SUBSIDIZED_CIf the teacher is from a subsidized center it will be 1, otherwise it will be 0.
TEACHING EXPERIENCEYears of teaching experience.
Table 6. New associated dichotomous variables to code the qualitative variables “Sex”, “Educational Level Taught”, “Academic Qualifications”, and “Tittle of the Work Center”. Own elaboration.
Qualitative VariablesCategory (Modality)New Associated Dichotomous Variables
“MAN”
“SEX”A woman0
A man1
“PRIMARY”“PRESCHOOL”
“EDUCATIONAL LEVEL TAUGHT”Teaches High School Ed./Training Cycles00
Teaches in Childhood Ed.01
Teaches in Primary Ed.10
“GRADUATE”
“ACADEMIC QUALIFICATIONS”Undergraduate Degree or PhD0
Graduate (Three-year Certificate)1
“PRIVATE_C”“SUBSIDIZED_C”
“TITLE OF THE WORK CENTER”Public Center00
Private Center10
Subsidized Center01
Table 7. Coefficients of the multiple linear regression model for the different dependent variables. Own elaboration.
DDCC TOTALINFORMATIONCONTENT_CREATIONCOMMU_NICATIONSECURITYPROBLEM_RESOL
BBBBBB
Constant (K)2.4942.9972.1062.4222.3492.598
MAN0.186 ***0.231 ***0.146 ***0.157 ***0.146 ***0.252 ***
AGE23−0.021 ***−0.019 ***−0.020 ***−0.026 ***−0.015 ***−0.024 ***
GRADUATE−0.027−0.059 *−0.031−0.046 *0.0000.001
PRESCHOOL−0.229 ***−0.253 ***−0.203 ***−0.212 ***−0.242 ***−0.237 ***
PRIMARY−0.055 *−0.095 ***0.017−0.063 *−0.081 ***−0.054 **
PRIVATE_C0.123 ***0.135 ***0.236 ***0.074 *0.106 ***0.066 **
SUBSIDIZED_C0.068 ***0.077 ***0.110 ***0.0260.080 ***0.048 **
TEACHING EXPERIENCE0.011 ***0.009 ***0.011 ***0.014 ***0.007 ***0.011 ***
N365136513651365136513651
R20.1100.1120.0990.0860.0480.106
Sig: *** p ≤ 0.01; ** 0.01< p ≤ 0.05; * 0.05 < p ≤ 0.10.
Publisher’s Note: MDPI stays neutral with regard to jurisdictional claims in published maps and institutional affiliations.

