Abstract
A successful built environment is assumed to encourage street vitality in the time and space dimensions. The availability of mobile location data has made it possible to measure street vitality from a large-scale and multiperiod perspective. We used the mobile location data recorded in West Nanjing Road and the surrounding streets in Shanghai as a proxy for street activity, and introduced intensity and instability as indicators of street vitality to test whether there is still a correlation between street vitality and built environment in high-density cities, and whether there are applicable conditions. The results show that for spatial units with higher intensity, the street activities tend to be more unstable. It is more effective to promote street vitality by increasing the diversity of commercial formats. For the streets in high-intensity areas, increasing the mix degree of building functions and the development intensity of the surrounding blocks may not necessarily enhance the street vitality. The design of the external spaces is always an effective measure to maintain continuous vitality. Subway stations play a significant role in promoting street vitality.
1. Introduction
“Think of a city and what comes to mind? Its streets. If a city’s streets look interesting, the city looks interesting; if they look dull, the city looks dull.” [] Streets are an important part of urban public open space and are regarded as the most important symbol of the public domain [,,,,,,,,]. The activities in streets are the source of street vitality, and energetic street space should maintain intensive and continuous crowd activities. The theories of urban planning and design hold that the built environment is an important factor affecting street vitality [,,,]. The diversity of buildings’ functions, the intensity of development, small street segments, old buildings, and other built environment conditions can effectively promote street vitality. There is a direct relationship between the quality of the built environment and the activities in the streets. The street furniture, the scale of the walking spaces, and the layouts of daily commercial service facilities can attract activities in streets. These views have been widely accepted and become the guiding principles of street design.
However, the abovementioned theories on street vitality originated from the empirical observation of large cities in Western countries from 1950s to 1970s. With the development of Information and Communication Technology (ICT) and the popularization of mobile communication equipment, the travel purposes and spatiotemporal features of street activities in Chinese cities in the 2010s have changed greatly. Due to the use of e-commerce online payment services, the frequency of residents’ shopping trips has been greatly reduced, which has had a strong impact on traditional street activities. Due to the differences of the localized built environment between Chinese cities and Western cities, as well as the changes in the purposes and patterns of residents’ street activities under the background of the new era in China, it is questionable whether the design theories based on a qualitative analysis and subjective summary can still reflect the current pattern of the street activities in China.
To clarify the influence mechanism of the built environment on street vitality under the background of Chinese modern cities, the primary task of this study is to carry out an objective observation and systematic analysis of street vitality. Street vitality refers to the people and their activities that can be observed in street spaces and is the product of the number, types, and duration of various activities [,]. Although existing quantitative research studies measure street vitality with field survey data and make some explorations on its influence mechanisms, they are far from reaching a conclusion, and there is still a lack of reliable data that would enable an accurate measurement and quantitative analysis of street vitality from a large-scale, multiperiod perspective.
Traditional street research studies mostly use field observation, questionnaire surveys, travel diaries, interviews, and other field survey forms to obtain research data. The advantage of these kinds of data is that they are rich in information and comprehensive in content, can record specific street activity types, and are suitable for micro-scale research studies. However, these kinds of data comprise static data and can only reflect the spatial distribution of street population in a certain time section. Limited by manpower and material resources, only residents’ small-scale activities can be sampled, and the applicability and operability of each key point in a specific high-density environment cannot be answered. At present, with the development of ICT, mobile location data, considered “Big Data”, can make up for the above deficiencies. Relevant research studies can use new data sources for sensing crowd activities to observe street vitality in a long-time dimension or at a large scale in a precise way, thereby enabling the recording of the behaviors and feelings of a considerable number of users in continuous time and space under multiple scales []. These data sources thus provide the possibility for a better quantitative analysis of the influence of the built environment on street vitality [,,,,]. With the help of mobile location data with massive samples to sense crowd activity, street research can dig out the behavior rules of space users in continuous time and space and is no longer limited to small sample sampling and small-scale research. In recent years, a research trend has been to perceive urban streets from a new perspective, evaluate the characteristics of vitality, and examine the street design, especially the concept of place and its related theories, which are closely related to users’ behavior and feelings []. Several previous studies have started from the idea of quantitative verification and have used more detailed records of residents’ behaviors, quantitative models, and statistical methods to deepen the design theories of how the built environment affects street vitality and to propose street design strategies to better promote vitality [,,].
The research aim of this study is to verify the influence of the built environment on street vitality in a high-density urban environment. The following questions will be tried to answer: From a large-scale and multi-period perspective, how does the built environment influence the street vitality measured by mobile location data? To what extent is the traditional theory established, and are there applicable conditions for the theoretical points? The main route is the following. First, multifunctional streets with high street vitality and complex built environment conditions are selected as the case studies. Mobile location data, a new data source for sensing street activities in large scale and full time, are used to measure street vitality and to analyze the spatiotemporal characteristics. Second, the street vitality indicators of each spatial unit are summarized. Third, an indicator system is constructed to measure the built environment. Fourth, after a series of model checking, 10 time-segmented models are constructed to identify the built environment conditions that significantly affect street vitality in the current urban environment and compare them with existing theories to further clarify the application.
The correspondence between the above content and each chapter is as follows. Section 2 clarifies the connotation and definition of street vitality. In Section 3, mobile location data and their spatial-temporal characteristics are used to discuss the measurement of street vitality. The quantification of the built environment, the adopted method, and the analysis results are described in Section 4. Section 5 offers concluding remarks and discussions on this study.
2. Literature Review
To explore the connotation of street vitality, a literature review is conducted from two aspects of classic theory and recent research.
(1) Classic theory
In the classic discourse, vitality comes from enough people []. To maintain vitality, the density of people must reach a high level, regardless of the purpose of those people. Furthermore, vitality is the flow of people in different periods of time. The time here is a short period of time and is calculated by hours. Regardless of who goes out according to different schedules or who comes in for different purposes, people should be able to use common facilities. Streets need people who come and go every day [,]. The pedestrian flow in different periods and in various groups represents vitality [,]. The continuous flow of people can produce economic effects.
In addition, the distribution of the absolute number of people using streets is different during the day. Regardless of how high the density of the population is, no neighborhood or area can ignore the necessity of enabling the distribution of the people during daytime; otherwise, the vitality will be greatly reduced. Time distribution is of great significance [,,]. It is necessary to focus on how the characteristics of the intensity and duration of the pedestrian flow change with time. In a successful and energetic street, people should appear at different times. The space-time continuity of people and activities is the basic characteristic of street vitality.
Therefore, street vitality refers not only to the way an absolute number of people use the streets but also the way these people are distributed in different time periods. The balanced distribution of time periods implies the need for more dynamic street space [,,]. The manner in which an absolute number of the people use the streets is different from the way these people are distributed in the streets at different times of the day. These two connotations cannot be compared, and a distribution with a balance of use times should be emphasized []. Diversified functional configurations around the streets can bring long-term and continuous pedestrian flow to street space [,,,,].
(2) Recent research
In recent years, there have been a considerable amount of street vitality studies conducted from various perspectives. In these related studies, street vitality refers to a variety of people engaged in activities, especially the social communication activities, conducted in street-based external public spaces at various times. The connotation of street vitality can be analyzed from the perspective of social communication activities, the number of active people, and instability. Social communication activities refer to a series of fixed or continuous social activities in which the static and slow-moving people participate in the streets’ public spaces. The more intensive the social communication activities are, the more vital the streets [,,,,,]. The number of people refers to those who participate in continuous street activities and social activities of groups in the streets. The more people there are, the more vital the streets. The number of people can be measured by the intensity of the activities in the streets [,,,,,,,]. Instability refers to the balance and continuity of the street activities over time. Activities should take place at different times. Time here refers to small time periods in a day. The influence of the time dimension is very important to the vitality at the street level, but it is often ignored [,,,]. Instability is the characteristic denoting how activities maintain balance with time. This feature has a great correlation with the stay time. The longer the stay time of the active people in the streets is, the lower the instability.
(3) Theoretical background
In summary, we believe that street vitality refers to the dense people and the intense activities in the street, regardless of the purpose of the people. The street activities especially refer to the social communication activities in the streets’ public spaces, and street vitality is the product of the number and duration of various activities. Therefore, street vitality includes both the intensity of the street activities in different time periods and the instability of these activities over time. Street vitality can be quantified as the spatiotemporal characteristics of the intensity and instability of the activities in the streets.
3. Data and Methods
3.1. Research Area
The middle section of West Nanjing Road in Shanghai is chosen as the research area, which is located in the core section of Shanghai city (Figure 1). As a highly developed modern metropolis, Shanghai has a strong universality in its built environment and streets, which can provide reference for the construction and development of other developed countries and cities. West Nanjing Road is a representative multi-functional street in a high-density built environment in China, with a large number of people coming here for different purposes. It has high research value and can be used to verify the applicability of traditional design theories in a high-density built environment. To the east of the research area are square and tourist street, and to the west is a living street, which intersects with the viaduct. The built environment and street vitality of the above segments are quite different. Therefore, West Nanjing Road is chosen as the research area, which has a total length of 2.6 km. At the same time, the street section intersecting with the middle section of West Nanjing Road is also included in the research area and has a total area of approximately 0.36 km2.
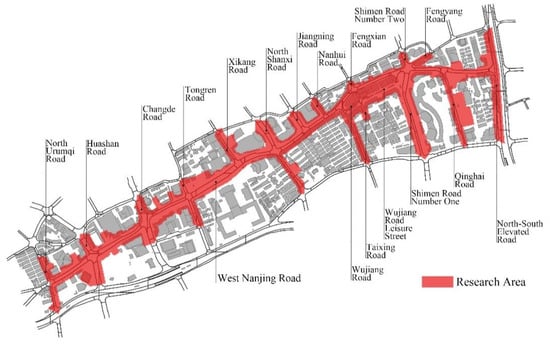
Figure 1.
Research area of West Nanjing Road in Shanghai. Source: Authors.
West Nanjing Road was built after the concession period in the early 20th century and contains high-density residential buildings, such as apartments and lanes, on both sides. In the 1950s, when the middle section of West Nanjing Road was rebuilt, large public cultural buildings, such as the Shanghai Exhibition Hall, appeared. After the 1990s, large-scale construction began in Shanghai. The middle section of West Nanjing Road was converted into commercial and high-rise office buildings. However, the historical building environments, such as the apartments and lanes, remained in many sections. Up to now, the street segments in the middle section of West Nanjing Road cover various types of typical commercial streets, historical streets, daily life service streets, etc. Most of the street segments retain the 20 m road width of the concession era, and due to the reconstruction of high-rise buildings, several segments have formed a red-line open space area. As a result, the street types and the diversity of the street spaces of West Nanjing Road make them suitable to be taken as representative research cases.
3.2. Data Description
Location-based services (LBS) data generated by mobile phone applications (APPs) is suitable mobile location data for street research []. As mobile Internet devices are widely used in street activities, such as reading, socializing, navigation, and shopping, these mobile Internet services will generate LBS data of GPS accuracy, which is accurate up to 10 m. A trajectory point represents a mobile smart device user who is currently moving or staying at that location in the street. Based on the above principles, LBS data can effectively identify and extract the position of people in the streets’ public spaces, reveal their social communication activities, and continuously record the accurate trajectories of the users in a wide space-time range. In addition to providing the unique advantages of large data, such as massive samples, objective random sampling, and wide space-time range, LBS data also provides the advantage of accurate positioning. These advantages make it especially suitable for micro-level research studies, which can provide a data basis for better street vitality analysis. With the help of the LBS data that includes massive samples providing a sense of the street activities, the studies on street vitality can dig out the behavioral patterns of the street space users in continuous time and space and observe the street activities on a large scale, in multiple time periods and in a fine manner; moreover, these studies need no longer be limited to small samples and small-scale research studies. Based on the above, it is possible to analyze the influence of the built environment on street vitality from the perspective of large scales and multiple time periods.
The LBS data used in this study is the anonymous geographical location data obtained from the APPs supported by TalkingData services. TalkingData is a company that provides the SDK (Software Development Kit) positioning development environment functionality for application software in smart phones and other smart devices. By 2017, the service of TalkingData covered more than 750 million active independent smart devices per month, serving more than 100,000 mobile APPs in China. The anonymous geographical location data from TalkingData are very popular with users, provides wide coverage, and is suitable for the studies using basic data to analyze the urban residents’ activities. The TalkingData service is triggered by the user’s positioning request when using the mobile Internet and comes from various mobile phone applications (APPs), that is, the instant location data formed by the user’s logging in, searching, sending and receiving information, pushing, and other events on the TalkingData client APPs. These data record both time and space location information with GPS accuracy.
This study selected all LBS trajectory points positioned in the West Nanjing Road district in March 2017. March is the season of early spring in Shanghai. Street activities become lively and outdoor activities are abundant. March 2017 does not include holidays, which is helpful for exploring the daily street activities. In addition, after 31 days of LBS data inspection and climate information, it was found that the weather in March 2017 had a relatively small impact on street vitality. These trajectory points comprised 3,080,512 trajectory points representing a total of 450,660 anonymous user IDs. Among them, in the most typical public spaces of West Nanjing Road and its adjacent streets, a total of 163,051 anonymous ID users left 387,810 trajectory points. A trajectory point represents the location and time of a mobile Internet user when in the street; the user makes a location request, which indicates that the user is moving or staying at that location in the street at that moment.
3.3. Algorithm
The data processing method is as follows: First, the distribution of the 24-h street activities is described; second, the indicators of street vitality are calculated, including intensity and instability.
(1) Algorithm of the 24-h street activities
LBS data is generated based on the operation of the APPs, and a mobile phone user will continuously leave multiple trajectory points in a short time at the same position. Calculations based on time periods will cause errors. Also, to make up for the discontinuity of the LBS data in the space-time trajectory, the characteristics of the street activities are recorded according to the cumulative number of location points at each time point. After data inspection, it is found that there is no significant difference in the spatial distributions of street vitality on weekdays and weekends. The difference between weekdays and weekends is the number of people, not the spatial distribution of the street activities. What we are concerned about is the relationship between the spatial distribution of street vitality and built environment, therefore, no distinction is made between weekdays and weekends. The data processing method is as follows: First, select all the LBS location records of all the user IDs within the study area in March 2017; second, calculate the position records of the users at the exact hour of the day, and take the position record closest to the exact hour as the positions of the users at that time. For example, during the period from 17:00 to 18:00, select the location record with each ID closest to 18:00. Third, the 24-h results of the 31 days in March were collected to obtain the distribution of the 24-h street activities.
(2) Algorithms of intensity and instability
Based on previous data preprocessing, the intensity of the street activities is calculated as follows:
where Pop is the number of people in the street unit and Length_street is the length of the street unit. As the density of street length can objectively reflect the number of active people accumulated per unit length, the intensity is calculated as the density of the street length instead of the area of the spatial unit.
Intensity = Pop/Length_street
Instability is the measurement of the changes in the street activities over time. The standard deviation can effectively reflect the degree of dispersion of a data set. The smaller the value is, the more stable the data. Standard deviation can be used to measure instability and is calculated as follows:
where T represents the number of the time points in the statistical period, i.e., the number of the intensity indices involved in the calculation; is the intensity index of each unit and is its average value (arithmetic average value).
3.4. Spatiotemporal Characteristics
(1) Spatiotemporal Characteristics of the 24-h street activities
The calculation results reflect the spatial characteristics of the activities in the streets in different periods (Figure 2).
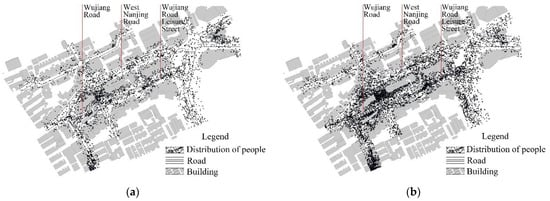
Figure 2.
Distribution of the street activities in different time periods estimated by LBS data: (a) 10 o’clock, (b) 18 o’clock. Source: Authors.
Through the accumulation of the data for a whole month, the change of the number of the active people in the research area during the period was identified (Figure 3). The overall time-varying rule is that the number of the people in the streets in the daytime is much larger than that in the evening. From 7:00 in the morning, the number rises sharply. The periods 7:00–9:00 and 17:00–19:00 are the two peak periods. The number of active people in the evening peak period is larger than that in the morning peak period. During the off-peak hours of the day (10:00–16:00) between the morning and evening peaks, the number of active people showed a steady upward trend. After 22:00, the number of people in the streets dropped sharply. The standard deviation of each hour in the 31 days is similar to the change of the number of people. The more the number of people, the larger the standard deviation.
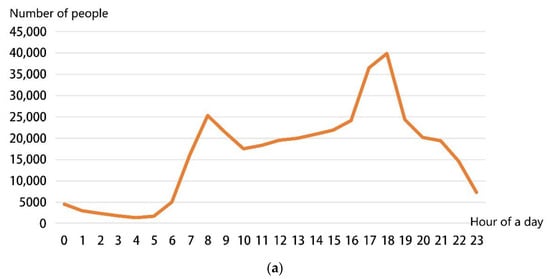
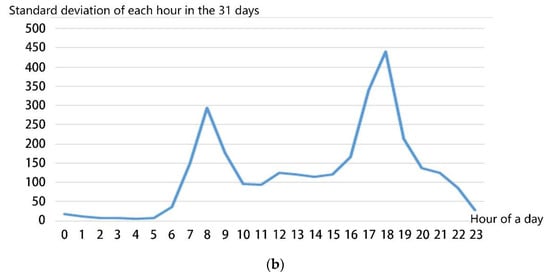
Figure 3.
Changes in the number of people in each hour within 31 days. (a) Changes in the number of people in the street for 24 h (multi-day average accumulated over a month); (b) Standard deviation of each hour in the 31 days. Source: Authors.
(2) Spatiotemporal Characteristics of intensity and instability
The spatial distribution of intensity is shown in Figure 4. In the research area, there are two activity-intensive areas, which have high intensity throughout the day. The two activity-intensive areas correspond to two street sections: the Meilong Town-CITIC Pacific street section and the Jing’an Kerry Center street section. These two sections are not only the commercial, office and employment centers on West Nanjing Road but also the public activity centers serving the entire Shanghai area. In addition to the high degree of functional mixing, the design of the street exterior public spaces of the above street sections is also relatively perfect, causing the spaces to attract a large number of active people.
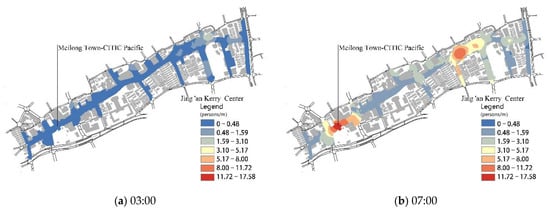
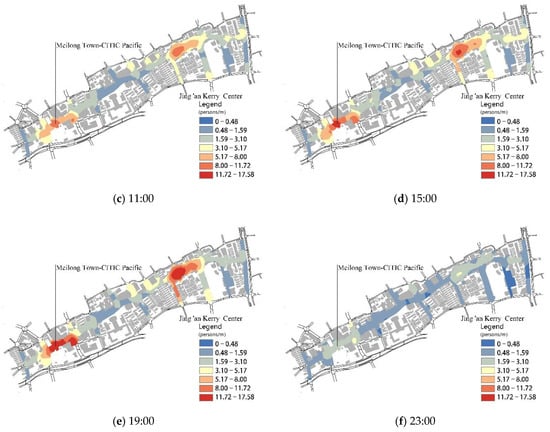
Figure 4.
Spatiotemporal distribution map of intensity. Source: Authors.
From the 24-h change of intensity (Figure 3), it can be seen that there are fewer outdoor activities on the streets at night and that the mobility in this period is extremely weak; therefore, it is not necessary to explore the street activities in this period. Moreover, if the vitality of this period is included in the research, it will cause interference to the overall results and increase the value of instability. To sum up, the instability of the street activities during the daytime is calculated. According to the obvious change nodes of intensity within a day, we calculate the instability of the street activities based on the values of intensity from 7:00 to 22:00.
The calculation of instability needs to be based on the division of spatial units to show the spatiotemporal characteristics of instability. The spatial units are divided by the road intersections and the building facades on both sides of the street as the boundaries [,]. Since the LBS data is based on GPS positioning, there is a positioning error of 10 m. Therefore, the spatial unit buffers 10 m outwards so as to select the active people in the street as much as possible. At the road intersections, the boundary is still the angular bisector of the intersecting road centerlines. In the research area, the streets are divided by intersections into natural segments comprising units with a length of 58.7–471.5 m, with unit lengths mostly measuring 200–300 m. The street units of these lengths have been able to independently assume spatial functions. For pedestrians, this is not a short street scale and is a suitable street unit for walking. As far as the sense of spatial experience is concerned, there is a complete space between the two intersections, and the psychological feelings of the people in the streets are continuous [,]. Environmental functions, old buildings and other environmental elements on the same street will have an impact on the activities in the space. The impact is continuous and direct in the space unit. In addition, as West Nanjing Road and its surrounding streets are all car ways, the intersections will have a certain split effect in terms of the psychological feelings of the people in the streets. Therefore, the natural segments are used as the spatial units.
As seen from Figure 5, the street activities change greatly during the early and late peaks, while the changes during the off-peak hours are not obvious. The change in instability is mainly due to the sudden increase and decrease in traffic at peak hours in the morning and evening. The Meilong Town-CITIC Pacific section and the Jing’an Kerry Center section are not only high-value areas of intensity but also areas with high instability. In addition, the streets with less intensity naturally have a lower range of change, and the instability assignment is correspondingly smaller.
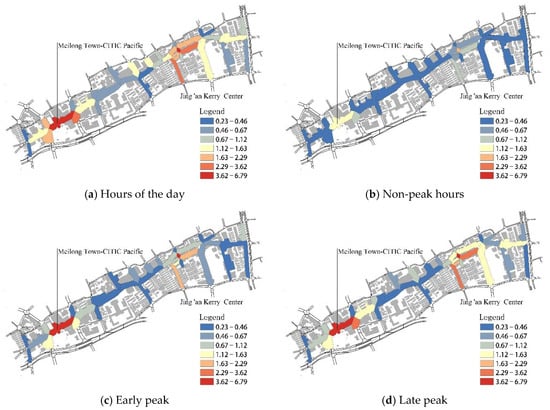
Figure 5.
Spatiotemporal distribution of instability. Source: Authors.
4. Results
4.1. Division of Time Periods
According to the 24-h time-varying characteristics of the street activities accumulated by the LBS data for 31 days (Figure 3), the activities in the exterior spaces in the evening are very few. Consequently, it is of little significance to study them, as their inclusion in the study will lead to the deviation of the overall analysis results. Therefore, to make an in-depth analysis, we choose street vitality during the daytime. According to the important nodes in the 24-h time variation, 10 time-segmented models were constructed, including five intensity models for the time periods represented by the following hours during the day: (time points between 7:00 and 22:00); morning peak (7:00, 8:00, 9:00); non-peak hours (time points between 10:00 and 16:00); evening peak (17:00, 18:00, 19:00); and evening (20:00, 21:00, 22:00). In addition, five instability models with time divisions the same as those in the intensity models were constructed.
The distributions of the intensities of the spatial units in each time period are shown in Figure 6, and the spatial distribution of instability has been shown in Figure 5.
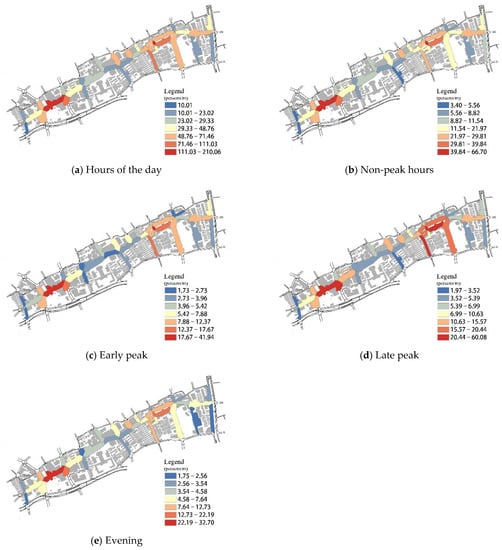
Figure 6.
Spatiotemporal distribution of the intensities in the spatial units. Source: Authors.
4.2. Quantification of the Built Environment
4.2.1. Indicators of the Built Environment
In recent years, many scholars have analyzed the built environmental conditions that affect street vitality. The environmental conditions at street scale mainly include street function, street texture, self-characteristics, format types, format mix, format density, building function, height and length, street bottom interface, sidewalk, street trees, public facilities (such as seats, street lamps, billboards, telephone booths, newspaper kiosks, etc.), and fences [,,].
In this study, the conditions that are closely related to street activities and oriented by urban design are selected to measure the built environment. The built environment is subdivided into five groups: functional diversity, small street segments, old buildings, density, traffic, and site design [,,,,]. Each condition contains several quantitative indicators. According to the framework of this study, the indicators that are commonly used in related research are chosen to measure the built environment. A total of 18 indicators are selected to measure the built environment at the street level.
4.2.2. Data for Measuring Built Environment
There are two data sources of the built environment: the topographic map and field survey data.
The 1:500 digital topographic map of Shanghai contains detailed information on the buildings and the roads. The information on the building includes the functions, the building areas, floors, and other characteristics of all the buildings in the central urban area of Shanghai. The information on the roads includes the following: road name; layout and length of the railways; and expressways and roads at all levels. The acquisition time of the topographic map is the year of 2015, which is close to the acquisition time of the LBS data in 2017. The LBS data records the space-time information of the street activities, and the topographic map shows the built environment of the streets. As the acquisition time of the LBS data and that of the topographic map data are close, the data can be used to measure the influence of the built environment on street vitality.
Other street physical built environment data were obtained from a field survey in January 2018. The survey of the built environment at the street level includes five aspects, namely, land use mix, small street segments, old buildings, density, traffic, and site design, which are all consistent with the conditions selected above.
4.2.3. Connotation and Algorithm of the Indicators
Table 1 shows the connotations and algorithms of the indicators of the built environment. The descriptive statistics of these indicators are detailed in Appendix A.

Table 1.
Connotations and algorithms of the indicators of the built environment.
4.3. Influence of Built Environment on Street Vitality
4.3.1. Model Specification
As seen from Figure 6, street vitality shows significant spatial agglomeration characteristics. Therefore, this study considers the use of a spatial statistical analysis method. Therefore, to construct 10 time-segmented models, the intensity and instability of the street activities in five periods are taken as the explained variables, and the quantitative indices of the built environment on the street are taken as the explanatory variables. The process of model checking and the final selection of the analysis methods are as follows.
First, a collinearity diagnosis was carried out for the explanatory variables. According to the diagnosis results, among the variables, there is collinearity, in which the tolerance of three variables, namely, the diversity of the architectural ages, the density of the population, and the density of the employment positions is ≤0.1 and the VIF (variance expansion factor) is ≥10 (Table 2). After deleting these three independent variables, the collinearity diagnosis result is good. Finally, 15 explanatory variables are selected for the regression analysis.
Table 2.
Partial results of the collinearity diagnosis.
Second, a spatial autocorrelation analysis is performed on the dependent variables. The general measure of a spatial autocorrelation analysis is the Moran’s I. The results in Table 3 indicate that the intensities and instabilities of the street activities in five time periods show obvious spatial agglomeration characteristics. Therefore, the spatial econometric models are adopted to analyze the influence of the built environment on street vitality.
Table 3.
Results of the spatial autocorrelation tests.
Finally, 10 time-segmented models are tested, and the final regression method is determined. Taking the model of hours of the day as an example, the procedure is as follows. The Ordinary Least Squares (OLS) model, as the most common benchmark model, is used as a comparison reference. After the OLS regression, the Lagrange Multiplier Test (LM) is performed on the residuals returned by OLS. The test contains two statistics: the LM-Error and the LM-Lag. The test results are illustrated in Table 4. As the LM-Lag statistic is significant, the spatial lag model was chosen as the final model. If both statistics were significant, robustness was used to multiply the subtest (Robust LM test). According to the inspection method above, all the 10 time-segmented models have chosen the spatial lag model as the final regression model. The contiguity weight (queen contiguity) is used to evaluate the relations of the adjacent units.
Table 4.
Results of two Lagrange multiplier test (the model of hours of the day).
4.3.2. Influence of Built Environment on Intensity
(1) Overall Spatial Effects
Table 5 shows the analysis results of the influence of the built environment on the intensity of the street activities. The R2 of the five models are all high, indicating that the spatial lag model fits well and can reveal the correlation between the built environment and street vitality. The coefficients of the spatial weight matrix in the five models are all negative and of high significance, which indicates that the vitality of the adjacent units has a competitive effect. Under the condition of a similar spatial location and function, the street units with a better built environment have higher street vitality, which shows that the built environment of West Nanjing Road has a significant influence on street vitality in terms of the overall spatial effect.
Table 5.
Influence of the built environment on intensity.
(2) Spatial Characteristics
Among the five groups of 15 indicators, the main factors that influence street vitality are the diversity of the commercial formats along the street, the ratio of the commercial building area along the street, the entrances of subway stations, the ratio of the exterior public spaces, the length of the street segments, the width of the sidewalks, and the continuity of the stores. The above seven indices are significantly correlated in the five models, of which the first four are positively significant and the last three are negatively significant. The above results show that improving the diversity of commercial formats along the street, the ratio of the commercial building area along the street, and the ratio of the exterior public spaces can attract street activities and that the surrounding entrance of the subway stations can also effectively gather the activities. The shorter the segment length is, the denser the street activity, which is consistent with the diversity theory of Jacobs. Consistent also with general planning and design cognition, too wide sidewalks reduce street vitality. The continuity of the stores will negatively affect the activities in the streets, mainly due to the narrow sidewalks in front of many shops along West Nanjing Road, which when the width occupied by plants is excluded, can accommodate only two to three people in parallel on average and is not suitable for pedestrians to stay. The mobile location data used in this study represents the trajectory points left by the stationary and slow-moving activities, and it is difficult to locate people who rush by in front of the shops. Therefore, this result is not representative and universal.
(3) Temporal Characteristics
In the time dimension, the correlation of six indicators, namely, the diversity of commercial formats along the street, the ratio of the commercial building area along the street, the entrances of the subway stations, the length of the street segments, the width of the sidewalks, and the continuity of the stores, all have the same regularity. The effects are greater in the early peak and the late peak and less in the off-peak hours and in the evening.
Among these indicators, the time characteristics of the entrances of the subway stations, the diversity of the commercial formats along the street, and the width of the sidewalks are more obvious. These three indices not only have the strongest significance but also coefficients that in the five models exhibit obvious changes, all of which have the greatest impact in the late peak and the least impact in the off-peak hours and the evening. According to Figure 3, the evening peak is also the highest peak period in terms of the total number of people in the streets in the research area, showing that the entrances of the subway stations, the diversity of the commercial formats along the street, and the width of the sidewalks are the most dominant built environmental indicators that affect the street activities of West Nanjing Road.
The influence of the ratio of the exterior public spaces is relatively similar and balanced in each time period, and there is no significant fluctuation within 1 day. The entrances of the public buildings and the ratio of the gray spaces significantly affect street vitality in the evening. The entrances of the public buildings play an increasing role, while the ratio of the gray spaces plays a reducing role. In the evening hours, the entrances of the public buildings can effectively gather active crowds, and people can stop, talk, rest, and engage in other activities in the transitional space between indoor and outdoor. However, the grey spaces failed to effectively enhance street vitality in the evening, mainly because the grey space along West Nanjing Road mainly comprises the corridors that are in front of the shops. These corridors have a narrow width and non-pleasant scales and mainly support the traffic function. In addition, the lighting conditions in these spaces in the evening are not as bright as those of the public buildings and shopping malls. Therefore, even in the evening, people seldom stay in the gray spaces.
In summary, commercial diversity, small street segment, and external environment design can effectively enhance the intensity of street activities. Among them, the external environment design can enhance the vitality of all time periods during the day. As important entrances of streets in high-density environments, the planning and design of the subway stations should be coordinated. exterior public spaces can attract a constant flow of people. The lighting environment is also vital to night vitality.
4.3.3. Impact of Built Environment on Instability
(1) Overall Spatial Effects
The analysis results in Table 6 show that the R2 values of the five models are high, which indicates that the spatial lag model has a good fitting degree and can reveal the correlations between the built environment and street vitality. The spatial distribution of instabilities in each hour of the day, in the early peak hours, and in the evening hours has significant spatial autocorrelation characteristics, and the weight matrix coefficient is negative. The overall level of the intensities of the street activities is also higher for the spatial units with higher instability. The increase and loss of the activities in spatial units with higher intensity can enhance the intensity of their surrounding spatial units and thus make the density of the street activities more stable. The instabilities in the non-peak hours and the late peak hours did not show significant spatial autocorrelations.
Table 6.
Influence of the built environment on instability.
(2) Spatial Characteristics
The diversity of the commercial formats along the street, the ratio of the commercial building area along the street, the entrances of the subway stations, and the ratio of the exterior public spaces are significantly positively correlated, while the continuity of stores, the length of the street segment, and the width of the sidewalks are significantly negatively correlated. The diversity of the commercial formats along the street, the entrances of the subway stations, the length of the street segment, and the width of the sidewalks have the highest significance. The result is consistent with the result of intensity, mainly because only the spatial units with higher activity intensity have higher instability. The pedestrian flows of these spatial units vary greatly in the early, late peak, and other periods; therefore, the instability is also high.
In addition to the above indicators, the other eight indicators did not show a significant impact in each period.
(3) Temporal Characteristics
In the time dimension, the six indicators, namely, the diversity of commercial formats along the street, the ratio of the commercial building area, the length of the street segment, the subway station entrances and exits, the width of the sidewalks, and the continuity of the stores, show similar patterns. The late peak period has the greatest impact, the early peak period is slightly weaker than the late peak period, the non-peak period is next to the early peak, and the evening period has the weakest impact.
The influence of the continuity of the stores is not significant in the evening, mainly because the scarcity of business operations and the small number of the customers make it difficult for this factor during this period to have a significant influence on the instability of the street activities. The influence of the ratio of the exterior public spaces in the early peak is not significant because the influence of the built environment on the behavior of the active people in the streets is mainly reflected in the leisure time. The discussion on the influence of the built environment on street activities mainly focuses on the leisure time, and when discussing street vitality, the traditional theories pay more attention to the staying or slow-moving people on the streets [,,,,,,]. In the morning rush hour, people are on their way to work and in a hurry, and the special purpose of behavior leads to an insignificant impact, which further confirms the rationality of constructing the time-segmented model in this study. The difference in the findings between the time-segmented models better proves the establishment of the influence of the built environment on street vitality.
In summary, to a certain extent, the indicators of increasing intensity will also lead to instability of street vitality. However, there are still some conditions that can stabilize the intensity. Small streets can increase opportunities for people to communicate, reasonable sidewalk widths can effectively attract people to stay, and continuous commercial interfaces can continuously attract crowd activities. These environmental conditions effectively maintain the balance of street activities at various times.
5. Discussion and Conclusions
5.1. Discussion
The connotation of street vitality in this study refers to all static and slow-moving activities in the street, and the types of activities and travel purposes (residence, work and shopping) have not been distinguished. The main reason lies in the fact that in the related researches and discussions, street vitality refers to a variety of people engaged in activities, especially the continuous and social communication activities. The density of the people must be high enough, no matter what purpose these people come to the street. Diversity is the source of vitality. However, it is undeniable that the classification of street activities is meaningful. If different types of street activities can be distinguished, more detailed conclusions could be obtained. In addition, some studies recorded the flow of the people as street vitality. Due to the discontinuity of the trajectory, LBS data cannot be used to measure the flow. However, since the research scene is an outdoor space, these trajectory points represent the flowing people. It is rare for a person to stay in the street all day. During the cleaning and inspection of the LBS data, it is found that few mobile phone users remain in one position for a long time. Therefore, the data already had captured the information and attributes of the flowing people.
Each trajectory point of the LBS data represents a mobile phone user’s active social behavior. Selecting and then accumulating the trajectory points in the streets can effectively identify the active social behavior of the pedestrians in the streets, thus distinguishing the difference of the intensities in different areas in the street and the intensity change in 1 day. In addition, there is localization error in the LBS data, which cannot be eliminated and well quantified. However, the localization error did not have a significant impact on the results. Reasons are as follows. First, the positioning (based on GPS) is relatively accurate, and the space unit buffers 10 m outward, so that the trajectory points in the street can be included as much as possible. Second, TD location points inside buildings rely on WIFI positioning, which hardly shifts to the street. Third, even though a small number of trajectory points located on the edge of the building will shift to the street, the relatively large area of the spatial unit can reduce the influence. In addition, on street segments with intense activities, more drift points at the edge of the building are also accompanied by intense street activity. In summary, despite the existence of localization error, the findings of this study are still considered credible. LBS data enables the realizing of the quantitative measurement of the street activities in multiple periods, which is research content that cannot be realized by the field observation data in traditional research studies.
This study adopts the division method of natural street segments as spatial units. West Nanjing Road and its surrounding streets are all car ways. Regarding the impact of the intersections on the psychological feelings of the people, the intersections will have a certain split effect. Within the research area, the length of the segment units formed by road intersection segmentation is mostly 200–300 m. As far as the sense of spatial experience is concerned, there is a complete space between the two intersections, and the psychological feelings of the people are continuous. For pedestrians, this is already a non-short activity scale and a suitable unit for walking. The built environmental elements on the same street will influence the activities in the street, and this influence is continuous and direct in the spatial unit. Therefore, the natural street segments are chosen as the spatial units.
Although the street network will affect the trajectories of individuals to a certain extent, the street in this study is interpreted as a public place accommodating activity rather than a path or a connecting channel. The overall spatial distributions of the street activities are explored. To display the connotation of public places better, one representative street and its intersecting roads were selected as the research area, not a street network. In addition, natural street segments are chosen as spatial units, which are similar to polygons. Therefore, the conventional spatial analysis methods are introduced, and the spatial adjacency matrix based on queen adjacency relationship is chosen to analyze the interactions of street vitalities on each time section.
Several existing research studies used POIs to measure the functional diversity along the street, which has not been adopted in this study. The main reasons are as follows. First, the map of POIs simplifies each function into a point. This point only has the attribute of its spatial location but does not include the concept of area and scale. On the street, there is a great difference in the influences of a small convenience store and a large supermarket on the street activities; that is, buildings of the same function and different sizes along the street have different impacts on street vitality. Second, it is easy for the POIs to repeatedly mark the same function point, for example, the repeated labeling of the residential buildings within the same residential quarter or the repeated labeling of the entrance and the hall of the same exhibition hall. This repeated marking is likely to cause errors in the analyses on the micro scale. For the above reasons, this study, based on the building area, still measures the functional diversity along the street. However, the results of this study do not prove that the functional diversity along streets has no effect on street vitality, but the functional diversity based on the building area statistics has little effect on the street activities.
5.2. Conclusions
This study investigates the influence of the built environment on street vitality using mobile location data. According to the analysis results, in the high-density cities and the current Internet age, the traditional theories are established to a certain extent, and on street vitality, the built environment still has an influence, which can be analyzed from two dimensions of time and space.
In the time dimension, the influence of most indices shows obvious time characteristics. Due to the different spatio-temporal characteristics of the street vitalities, the explanatory variables that do not change with time show different influence features in each model. The influence of the temporal series is mainly reflected in the comparison of time-segmented models. In general, the effects are greater in the early peak and the late peak and less in the off-peak hours and in the evening. Among the indicators, the time characteristics of the entrances of the subway stations, the diversity of the commercial formats along the street, and the width of the side-walks are more obvious. Street sections with higher intensity have higher instability.
In the space dimension, it is found that the streets in the high-density urban environment show different influence characteristics from traditional theories. In general, the indicators of built environment that significantly affect street activities include the diversity of commercial formats along the street, the ratio of the commercial building area along the street, the entrances to the subway stations, the ratio of the exterior public spaces, the length of the street segment, the width of the sidewalks, and the continuity of stores. The detailed conclusion is as follows: (1) It is more effective to promote street vitality by increasing the diversity of commercial formats than to increase the commercial area along the street. Most of the services provided by the businesses along the street are not long lasting. People’s perception of functional diversity is more important than the perception of commercial scale. (2) For the streets in high-intensity areas, increasing the mix degree of building functions and the development intensity of the surrounding blocks may not necessarily enhance the street vitality. The improvement of function and intensity is not always a feasible means. (3) The design of the external spaces is always an effective measure to maintain continuous vitality. On streets with imperfect functional configuration along the street, exterior spaces of high quality can still effectively attract activities. (4) Compared with the evenly distributed bus stations, subway stations have a significant role in promoting street vitality, which is always neglected. Subway stations should be used as important entrances to the street and arranged in coordination with large commercial facilities.
Mobile location data has not been widely accepted as an effective tool for measuring street vitality. This study was exploratory and verified that street vitality can be objectively measured and reflected by mobile location data because of the characteristics of a wide range of time and space, relatively high precision, large volume, and passive sampling, and this can effectively support research on street vitality. Traditional street researches mostly use field survey data to explore the variations of the street activities in a small space-time range. It is difficult to accurately describe the temporal characteristics of street vitality and identify the features whether vitality remains stable with time changes. The availability of mobile location data has made it possible to measure street vitality and analyze its spatiotemporal characteristics on a large urban scale and in multi-time periods, which provides a better understanding for street designers and urban planners. Based on the measurements of street vitality, the influence of the built environment on street vitality can be explored in a comprehensive, systematic, and in-depth manner.
The contributions of this study are mainly reflected in three aspects. First, theoretical significance. In-depth exploration of the connotation and the basic theoretical understanding of street vitality have been made clear, which can provide a reference for subsequent researches. Second, practical significance. The classic theories of street vitality are verified. It is found that in high-density urban areas, the built environment has certain applicability to the influence of street vitality. This study provides theoretical basis and practical guidance for the sustainable development of streets. Vitality is the basis for the survival and sustainable development of streets. If a street cannot attract people and activities, it can only die away. Also, implications are provided for planners and policy makers to enhance the complexity of the street systems through a better understanding of the street vitality and its relationships with the built environment. Third, methodology significance. The feasibility and limitations of LBS data in urban micro-research have been tested. The measurement of intensity and time-varying characteristics is more reliable, but the credibility of the measurement of mobility and diversity needs further verification. At present, mobile location big data has been widely used in urban researches, especially on the macro level. Due to the discontinuity of trajectory points, the application on micro level has certain limitations and needs further exploration in the future.
Author Contributions
Conceptualization, X.N. and W.W.; methodology, X.N. and W.W.; software, W.W.; validation, X.N.; investigation, W.W. and M.L.; data curation, X.N., W.W. and M.L.; writing—original draft preparation, W.W.; writing—review and editing, X.N.; visualization, W.W. All authors have read and agreed to the published version of the manuscript.
Funding
This study is supported by the National Natural Science Foundation of China (Grant No. 51908229), the Natural Science Foundation of Fujian Province (Grant No. 2019J01063), and the Science and Technology Innovation Funding Program for Middle Aged and Young Teachers of Huaqiao University (ZQN-816).
Institutional Review Board Statement
Not applicable.
Informed Consent Statement
Not applicable.
Data Availability Statement
Restrictions apply to the availability of these data. The original data was obtained from TalkingData and are available from the authors with the permission of TalkingData.
Acknowledgments
The authors are very grateful for the data support provided by TalkingData. The authors would like to thank anonymous reviewers and the editor for helpful comments and suggestions.
Conflicts of Interest
The authors declare no conflict of interest.
Appendix A
The descriptive statistics of the indicators of the built environment are shown in Table A1.
Table A1.
Descriptive statistics of the indicators of the built environment.
Table A1.
Descriptive statistics of the indicators of the built environment.
| Condition | Indicators | Minimum | Maximum | Mean | Standard Deviation |
|---|---|---|---|---|---|
| Functional Diversity | functional diversity of the buildings | 0.10 | 0.63 | 0.34 | 0.12 |
| diversity of the commercial formats along the street | 0.00 | 0.77 | 0.19 | 0.25 | |
| ratio of the commercial building area along the street | 0.00 | 25.39 | 7.49 | 8.36 | |
| Small Street Segment | length of the street segment (m) | 58.68 | 471.54 | 192.30 | 96.53 |
| Old Buildings | proportion of the old buildings | 0.01 | 0.53 | 0.14 | 0.13 |
| Density | development intensity (person/square hectare) | 0.00 | 35,397 | 13,217.42 | 9675.04 |
| Traffic and Site Design | entrance of the subway stations | 0.00 | 5.00 | 0.47 | 1.09 |
| bus stations | 0.00 | 2.00 | 0.47 | 0.75 | |
| width of the sidewalks (m) | 0.02 | 29.65 | 6.72 | 4.79 | |
| entrance of the public buildings | 0.00 | 51.00 | 5.00 | 9.83 | |
| continuity of the stores (m) | 0.00 | 1.92 | 0.82 | 0.56 | |
| continuity of the fences (m) | 0.00 | 1.54 | 0.46 | 0.43 | |
| ratio of the exterior public spaces | 0.00 | 20.32 | 4.91 | 5.76 | |
| ratio of the gray spaces | 0.00 | 5.31 | 0.56 | 1.27 | |
| ratio of the green lands | 0.00 | 12.94 | 1.25 | 3.11 |
References
- Jacobs, J. The Death and Life of Great American Cities; Random House: New York, NY, USA, 1961. [Google Scholar]
- Appleyard, D. Livable Streets; University of California Press: Berkeley, CA, USA, 1981. [Google Scholar]
- Vernez-Moudon, A. Public Streets for Public Use; Columbia University Press: New York, NY, USA, 1991. [Google Scholar]
- Jacobs, A. Great Streets; MIT Press: Cambridge, MA, USA, 1993. [Google Scholar]
- Chekki, D. The Community of the Streets; Jai: Greenwich, CT, USA, 1994. [Google Scholar]
- Southworth, M.; Ben-Joseph, E. Streets and the Shaping of Towns and Cities; McGraw-Hill: New York, NY, USA, 1996. [Google Scholar]
- Lofland, L. The Public Realm: Exploring the City’s Quintessential Social Territory; De Gruyter: New York, NY, USA, 1998. [Google Scholar]
- Hass-Klau, C.; Crampton, G.; Dowland, C.; Nold, I. Streets as Living Space: Helping Public Spaces Play Their Proper Role; ETP/Landor: London, UK, 1999. [Google Scholar]
- Carmona, M.; Heath, T.; Tiesdell, S.; Oc, T. Public Places, Urban Spaces: The Dimensions of Urban Design; Architectural Press: Oxford, UK, 2003. [Google Scholar]
- Gehl, J. Life between Buildings; Van Nostrand Reinhold: New York, NY, USA, 1987. [Google Scholar]
- Montgomery, J. Making a city: Urbanity, vitality and urban design. J. Urban Des. 1998, 3, 93–116. [Google Scholar] [CrossRef]
- Montgomery, J. Editorial Urban Vitality and the Culture of Cities. Plan. Pract. Res. 1995, 10, 101–110. [Google Scholar] [CrossRef]
- Luca, M.; Barlacchi, G.; Lepri, B.; Pappalardo, L. Deep Learning for Human Mobility: A Survey on Data and Models. 2020. Available online: https://www.researchgate.net/publication/346700983 (accessed on 8 December 2020).
- De Nadai, M.; Staiano, J.; Larcher, R.; Sebe, N.; Quercia, D.; Lepri, B. The death and life of great Italian cities: A mobile phone data perspective. In Proceedings of the 25th International World Wide Web Conferences Steering Committee, Montreal, QC, Canada, 11–15 April 2016; International World Wide Web Conferences Steering Committee Republic and Canton of Geneva: Geneva, Switzerland, 2016; pp. 413–423. [Google Scholar]
- Yue, Y.; Zhuang, Y.; Yeh, A.G.-O.; Xie, J.-Y.; Ma, C.-L.; Li, Q.-Q. Measurements of POI-based mixed use and their relationships with neighbourhood vibrancy. Int. J. Geogr. Inf. Sci. 2017, 31, 658–675. [Google Scholar] [CrossRef]
- Fan, Z.; Pei, T.; Ma, T.; Du, Y.; Song, C.; Liu, Z.; Zhou, C. Estimation of urban crowd flux based on mobile phone location data: A case study of Beijing, China. Comput. Environ. Urban Syst. 2018, 69, 114–123. [Google Scholar] [CrossRef]
- Martí, P.; Serrano-Estrada, L.; Nolasco-Cirugeda, A. Social Media data: Challenges, opportunities and limitations in urban studies. Comput. Environ. Urban Syst. 2019, 74, 161–174. [Google Scholar] [CrossRef]
- Chen, Z.; Gong, Z.; Yang, S.; Ma, Q.; Kan, C. Impact of extreme weather events on urban human flow: A perspective from location-based service data. Comput. Environ. Urban Syst. 2020, 83, 101520. [Google Scholar] [CrossRef] [PubMed]
- Hu, F.; Liu, W.; Lu, J.; Song, C.; Meng, Y.; Wang, J.; Xing, H. Urban function as a new perspective for adaptive street quality assessment. Sustainability 2020, 12, 1296. [Google Scholar] [CrossRef]
- Mehta, V. Lively streets: Determining environmental characteristics to support social behavior. J. Plan. Educ. Res. 2007, 27, 165–187. [Google Scholar] [CrossRef]
- Sung, H.; Lee, S. Residential built environment and walking activity: Empirical evidence of Jane Jacobs’ urban vitality. Transp. Res. Part D Transp. Environ. 2015, 41, 318–329. [Google Scholar] [CrossRef]
- Sung, H.; Lee, S.; Cheon, S.H. Operationalizing Jane Jacobs’s urban design theory: Empirical verification from the great city of Seoul, Korea. J. Plan. Educ. Res. 2015, 35, 117–130. [Google Scholar] [CrossRef]
- Jalaladdini, S.; Oktay, D. Urban Public Spaces and Vitality: A Socio-Spatial Analysis in the Streets of Cypriot Towns. Procedia Soc. Behav. Sci. 2012, 35, 664–674. [Google Scholar] [CrossRef]
- Delclòs-Alió, X.; Miralles-Guasch, C. Looking at Barcelona through Jane Jacobs’s eyes: Mapping the basic conditions for urban vitality in a Mediterranean conurbation. Land Use Policy 2018, 75, 505–517. [Google Scholar] [CrossRef]
- Yue, W.; Chen, Y.; Zhang, Q.; Liu, Y. Spatial explicit assessment of urban vitality using multi-source data: A case of Shanghai, China. Sustainability 2019, 11, 638. [Google Scholar] [CrossRef]
- Wu, J.; Ta, N.; Song, Y.; Lin, J.; Chai, Y. Urban form breeds neighborhood vibrancy: A case study using a GPS-based activity survey in suburban Beijing. Cities 2018, 74, 100–108. [Google Scholar] [CrossRef]
- Lunecke, M.G.H.; Mora, R. The layered city: Pedestrian networks in downtown Santiago and their impact on urban vitality. J. Urban Des. 2017, 23, 336–353. [Google Scholar] [CrossRef]
- Yue, H.; Zhu, X. Exploring the relationship between urban vitality and street centrality based on social network review data in Wuhan, China. Sustainability 2019, 11, 4356. [Google Scholar] [CrossRef]
- Xu, X.; Xu, X.; Guan, P.; Ren, Y.; Wang, W.; Xu, N. The cause and evolution of urban street vitality under the time dimension: Nine cases of streets in Nanjing city, China. Sustainability 2018, 10, 2797. [Google Scholar] [CrossRef]
- Wu, W.; Niu, X. Influence of built environment on urban vitality: A case study of Shanghai using mobile phone data. J. Urban Plan. Dev. 2019, 145, 04019007. [Google Scholar] [CrossRef]
- Sung, H.; Go, D.; Choi, C.G. Evidence of Jacobs’s street life in the great Seoul city: Identifying the association of physical environment with walking activity on streets. Cities 2013, 35, 164–173. [Google Scholar] [CrossRef]
- Cervero, R.; Sarmiento, O.L.; Jacoby, E.; Gomez, L.F.; Neiman, A. Influences of built environments on walking and cycling: Lessons from Bogotá. Int. J. Sustain. Transp. 2009, 3, 203–226. [Google Scholar] [CrossRef]
- Jiang, S.; O Alves, A.; Rodrigues, F.; Ferreira, J.; Pereira, F.C. Mining point-of-interest data from social networks for urban land use classification and disaggregation. Comput. Environ. Urban Syst. 2015, 53, 36–46. [Google Scholar] [CrossRef]
- Liu, X.; Long, Y. Automated identification and characterization of parcels with OpenStreetMap and points of interest. Environ. Plan. B Plan. Des. 2015, 43, 341–360. [Google Scholar] [CrossRef]
- Chen, J.; Li, X.; Cheung, W.K.W.; Li, K. Effective successive POI recommendation inferred with individual behavior and group preference. Neurocomputing 2016, 210, 174–184. [Google Scholar] [CrossRef]
- Zhang, T.; Sun, L.; Yao, L.; Rong, J. Impact analysis of land use on traffic congestion using real-time traffic and POI. J. Adv. Transp. 2017, 10, 1–8. [Google Scholar] [CrossRef]
- Whyte, W.H. The Social Life of Small Urban Spaces; Project for Public Spaces Inc.: New York, NY, USA, 1980. [Google Scholar]
- Bosselmann, P. Representation of places: Reality and realism in city design. J. Am. Plan. Assoc. 1998, 34, 504–506. [Google Scholar]
- Isaacs, R. The subjective duration of time in the experience of urban places. J. Urban Des. 2001, 6, 109–127. [Google Scholar] [CrossRef]
- Alexander, C.; Neis, H.; Anninou, A.; King, I.F. A New Theory of Urban Design; Oxford University Press: New York, NY, USA, 1987. [Google Scholar]
Publisher’s Note: MDPI stays neutral with regard to jurisdictional claims in published maps and institutional affiliations. |
© 2021 by the authors. Licensee MDPI, Basel, Switzerland. This article is an open access article distributed under the terms and conditions of the Creative Commons Attribution (CC BY) license (http://creativecommons.org/licenses/by/4.0/).