Abstract
Bicycling appears in the literature on urban mobility as a more sustainable transportation mode for future transportation, based on empirical evidence of the potential benefits of bicycling on the environment, society, and health. In this context, public interventions to promote and maintain bicycling as a sustainable practice and its positive effects are salient. This article reviews different cycling policies with respect to cycling facilities present in the literature and compares them with a case study in Valencia (Spain). We collected information on the public policies implemented in Valencia and the traffic intensity in bike lanes over detecting loops distributed around the city. The results show a strong increase in bicycle use accompanying the implementation of public policies that promote bicycling. The effectiveness of public policies and their impact on bicycling and sustainability are discussed.
1. Introduction
Public policies are extremely important to achieve sustainable social interests. Public administrators promote public policies to achieve desired changes. In this sense, the public sector easily has an impact on individuals’ behavior by promoting certain specific public policies, such as taxation, land use, education, and law enforcement policies among others. There is also a wide range of policies promoted by states called” green policies” that focus on promoting healthy and sustainable lifestyles among citizens. Green policies work against environmental change and encourage individuals to improve responsible attitudes towards a strategic field. To observe the potential output of those policies, public administrators should, first, invest in public policies and, secondly, observe whether those public policies have an impact on the preferred direction.
One important element of green policies is devoted to sustainable urban transportation [1]. Urban transport is a key sector for social welfare and is increasingly demanded because of the continuous growth of urban populations [2]. Urban mobility in big cities is currently associated with a few negative externalities, such as noisy environments, crowded roads, and pollution.
A socially accepted solution for this problem is based on substituting fossil fuels with electric batteries. We are now experiencing a dramatic growth in buying electric vehicles such as e-bikes, e-scooters, and e-cars [3]. In particular, recently, there has been an increase in electric vehicles. The EV30@30 Campaign has set a collective aspirational goal to reach a 30% sales share for electric vehicles by 2030 [4].
The attention of urban mobility actors is not only on electric vehicles. Cycling appears to be a clever way to cover urban distances, since almost one third of all car trips in cities are less than three kilometers [5].
The number of bicycle users has increased among many cities. The bicycling boom in Germany [6] illustrates the dramatic increase in bicycling as a practical mode of urban travel. Indeed, in many large German cities, the frequency of bicycling has doubled or tripled. The Netherlands is the clearest example of urban cycling. The European commission [7] has reported that 36% of the population selects bicycles as their preferred mode of transport on a typical day as compared with cars (45%) and public transport (11%).
There are many advantages of bicycling as compared with other modes of transport, even electric vehicles. Overall, there is a positive impact on social welfare [8], and quality life improvements through pollution reduction, as well as reduction in economic and social cost [9] (the cost of driving represents six times the cycling cost). More importantly, there is a positive impact on health [10,11]. An increasing number of scientific studies have assessed that bicycling can reduce obesity rates, improve cardiovascular health, and morbidity [12,13,14,15,16,17,18,19,20,21,22,23,24,25,26]. All of these studies have indicated the significant health benefit of bicycling; even considering the potential health risks of traffic injuries the health benefits are still positive and even greater when bicycling levels increase [27,28,29].
There is almost no doubt about the positive associations between bicycling and health. In this line, as bicycling increases, pollution levels and traffic congestion decrease. In particular, the State Government of Victoria (Australia) has identified the health benefits of regular cycling [30] as including the following: increased cardiovascular fitness, increased muscle strength and flexibility, improved joint mobility, decreased stress levels, improved posture and coordination, strengthened bones, decreased body fat levels, and prevention or management of disease.
Over the years, the social perception of cycling has also changed and there is social consensus on the benefits of moderate physical activity, the reduction of gas emissions, and the mitigation of climate change. In addition, active commuting is socially perceived as a less risky behavior because of both the increased number of bicycle users and the better and larger facilities provided by cities.
There is a social trend showing positive perceptions of new environmentally friendly ways to move around cities. Sustainable practices in urban transportation rule the future, demanding a positive impact on the environment, cost reduction, health, and low distress levels.
This article relates public bicycling-oriented policies with larger levels of performance in terms of sustainable urban transportation.
This article is structured in five parts. In Section 2, we analyze and discuss the set of policies that, according to the literature, have a positive impact on bicycling. In addition, we analyze the mechanisms that relate specific facilities with cycling increase, and define operationally the set of cycling facilities that can be found in cities that implemented cycling promotion policies. In Section 3, we present the data sources and the methodology for measuring policy implementation and traffic intensity. In Section 4, we analyze the specific facilities present in Valencia and describe a traffic intensity analysis of bicycle traffic data using automatic counters around the city. In the last section, we review the results and conclusions, as well as consider the limitations of the study and further research.
2. Public Policies to Promote Bicycling
Taking in consideration the sustainable effects of bicycling mentioned above, society could benefit from its practice, and public managers need to promote it. Public interventions are crucial to encourage bicycling. Many cities around the world have created integrated plans including precise interventions with the main goal of promoting and maintaining bicycling levels.
Public policies account for infrastructure provision, pro-bicycle programs, car restrictions, and policies aimed at increasing bicycling [31]. Planning strategic infrastructures can become a sustainable approach to promote cycling [32,33]. There is strong evidence among many countries that strategic urban planning relies on public interventions to promote and maintain bicycling levels.
Local governments in many cities have measured the efficiency of their urban policies, for example, case studies analyzing bicycle infrastructure and programs related to trends in bicycling levels and safety, such as London, Bogota, Berlin, Paris, Amsterdam, Portland, Copenhagen, Muenster, Freiburg, Odense, Groningen, Boulder, and Davis CA [34,35,36,37], and at a country level such as New Zealand [38], USA [39], and Norway [40]. All these studies have shown an increase in bicycle trips (from 1970 to 2006, in Berlin, the number of bicycle trips quadrupled) and, especially, an improvement in bicycling safety (serious injuries in Berlin fell by 38% from 1992 to 2006).
To design better roads on which bicycling could be safer and other bike-specific infrastructure projects, public policies need to be oriented to support the route-design approach applied in many northern European countries. In order to promote cycling, these transportation infrastructures aim at reducing bicycling injury risk. In this sense, some authors have analyzed the association between bike infrastructures and injury risk reduction among cyclists [41].
The wide and quickly growing literature suggests the need to facilitate bicycling through effective and sustainable public policies. In this sense, public interventions can change the urban mobility of a city creating bicycling infrastructure (bike paths as common asset), traffic calming through car restrictions, educational and marketing programs, and law enforcements.
Desired Cycling Facilities
The existing literature about this topic reveals that some specific bicycling facilities have had a positive impact on promote bicycling [31]. In particular, this article considers 42 cycling facilities in the existing literature [31], under the following eight broad categories:
- Infrastructure
Infrastructure facilities are the most common elements that enable bicycling traffic in cities. We describe fifteen of them according to the literature review. Among them, on-road bicycle lanes are the most common facility and are delineated using white stripes and bicycle icons on the pavement. Many studies have found a positive correlation between bike lanes and bicycling (see [42] for a comparative analysis of bicycling trends and policies). However, there are others infrastructure facilities commonly presented in cities. Contra flow bike lanes allow bicyclists to ride in the opposite direction on one-way streets. False one-way streets provide signaling or physical barriers to allow bicycles to enter the streets, but not entry by motor vehicles. Share bus/bike lanes allow cyclists to enter into exclusive bus lanes. Off street paths are physically separated from motor traffic and are designed exclusively for cyclists or shared with other users (pedestrians, rollerblades, etc.). Signed bicycle routes are “shared roadways which have been designated by signage as a preferred route for bicycle use” [43]. Bicycle boulevards are shared bicycle and motor vehicle routes which present some elements discouraging motor vehicles. Cycle tracks are very similar to bike lanes but include a physical element separating cyclists from motor traffic. Colored lanes for cyclists offer greater visibility for traffic. Share lane markings are lanes on routes shared between cyclists and motor vehicles indicating where cyclists have to ride. Bike boxes are separated areas on pavement near an intersection, where cyclists can wait during red traffic light phases without the presence of cars. Bicycle phase traffic signals consist of a special traffic light for cyclists to cross intersections without motor traffic. Maintenance of facilities is necessary to increase the quality of bicycling, and commonly includes pavement conditions and colored lanes and paths. Way finding signage includes interesting locations or spots in the city and the distance and time needed to bicycle there. Finally, techniques to shorten cyclist’s routes are an advantage for cyclists as a more direct path connection, where motor vehicles are not allowed.
- Traffic controls
Some controls are requested to reduce the number of motor vehicles, especially in some areas, limiting access in order to create a safe space. A case study in Italy [44] found a 50% decline in vehicle traffic after a conversion into a pedestrian mall; another study, in Germany, found an 8% decline in vehicle traffic [44]. The following four elements are described here: (1) Traffic calming offers a set of physical measures that reduce the negative effects of motor vehicle use, such as speed humps and chicanes, among others. Traffic calming is more pedestrian oriented rather than cyclist oriented. (2) Home zones are a form of traffic calming mainly focused on residential streets. The speed limit is around 5 Km/h. (3) Car-free zones do not allow any motor vehicles. The zones can be permanent or temporary attending to the spatial needs. (4) The complete street concept highlights the potential interest of society to partially remove cars form the public space in order to increase their use by pedestrians, transit users, and residents.
- Bike parking
Bike parking is perceived as a pleasant facility for bicyclists and can motivate them to bicycle to work [45]. Secure parking at destination also has a statistically significant impact on bicycling [46]. This category includes four bike-parking facilities with different characteristics. Unsheltered parking offers an efficient way to facilitate destination parking in cities with no bicycle cover. Sheltered parking offers a more complex option for parking bicycles on the street by at least providing a roof of some sort. Guarded parking offers a safer option preventing vandalism and/or thefts. They are typically located in special facilities such as bike stations and outdoor parking. Bike lockers represent secure bike parking usually located at train or metro stations.
- End-of-trip facilities
Two description facilities appear in the literature to create a more comfortable environment for bicycling. On the one hand, showers at workplaces are infrequently developed but an increasing presence should be expected due to green building codes in some cities. They provide showers, clothes storage, and change facilities combined with bike parking locations, that appear as significant facilitators for bicycling to work [45]. On the other hand, bicycle stations provide full-service facilities for cyclists, including accessories, repair stations, and information spots integrated in one hot spot location in the city.
- Integration of bicycles with public transport
Public transports are crucial to efficiently transport individuals around cities. Furthermore, due to the presence of bicycling, a further integration of bikes into the public transport is needed. There are five elements to describe in this category. Parking at rail stations is the most important form of integration with public transport in Europe and Japan. They offer a clear facility for cyclists to combine with trains, suburban rail, and metro stations, and increases the use of public transports [47]. Parking at bus stops provides parking facilities at bus stops to facilitate integration with public transport. Bike racks on buses are frequently found in USA and Canada but rarely in Europe. Bike racks basically consist of a facility system to lock a bike inside a bus. Bike on rail cars allow bikes to enter into the suburban rails and metro by also providing a type of rack to hold a bike. They are usually effective during off-peak hours to avoid crowding. Short-term rental bikes are bicycle rental systems with rental stations around the city. This facility is well-established in the most important cities in Europe, and urban populations commonly use rental bikes.
- Programs and legal interventions to promote bicycling
Governments invest resources into programs and legal interventions, which aim to increase bicycling. Those programs are usually based on nudge theory, creating a convenient framework to better understand the individual behavioral approach. While some studies have not found any impact of monetary incentives on bicycling [48], other studies have found a positive impact from informational campaigns on bicycling [49]. Overall, a positive impact is assumed, despite the lack of direct evidence of some governmental efforts, mainly because of difficulties with the quantification process. This category includes eight facilities.
Travel programs are employee-based programs implemented to reduce the use of motor vehicles. Programs use incentives and/or promotions to influence individual decision making to switch to a more sustainable way of urban transportation (commute transport, walking, bicycling). Individualized marketing uses incentives, implemented by coupons or transit passes, at the individual level to promote sustainable transport. Travel awareness programs are usually implemented by local governments to reduce driving and increase public transportation, bicycling, or walking. Safe routes to school provide enforcement programs to increase safety and the number of students choosing to walk or bicycle to school. Bicycling-specific programs are based on organizing events, activities, and special days or weeks to encourage people to bicycle. “Ciclovias recreativas” is a commonly used term in the literature and consists of a free mass recreational program in which streets are temporarily closed to motor traffic in order to promote walking, running, bicycling, and rollerblading. Other bicycle promotions include bicycle film festivals, bicycle “buses”, recreational bicycle events, and bicycle awareness campaigns. Finally, education and training is referred as any program to increase knowledge of desired skills when riding a bike or bicycling laws to avoid conflicts with traffic and pedestrians.
- Bicycle access programs
Bicycle access programs are designed to incentivize bicycling by providing bikes, either in the form of rental bikes or promotions to facilitate bicycle access. Studies have found evidence of a significant increase in bikeshare usage [50]. Bicycle sharing programs offer short-term rental systems by which commuters can become users by purchasing a smart card and paying a monthly/yearly fee. The stations are located around the city to take and return the rental bike. Additionally, other access programs include raffles, loans, and fleet programs among others. All of them promote bicycling.
- Legal interventions
Legal interventions are mandatory rules that governments apply to reduce vehicle traffic and to increase bicycling commuting. We highlight two legal interventions described in the literature. First, helmet laws are based on mandatory laws for bicyclists to wear helmet. They can be applied to all ages or specific ages (e.g., under 16 years old). However, the use of helmet for cycling in urban areas remains controversial since there is empirical evidence about the mandatory use of helmets and bicycling reduction. Studies in Australia found a reduction in cycling of about 36% in Melbourne, 36% in New South Wales, and 20% in Perth, due to the implementation of helmet law [51,52]. Secondly, speed limits for vehicle traffic are a common measure implemented in Europe and also abroad. This intervention promotes safety among bicyclists and pedestrians and a reduction in the negative impact of motor traffic (pollution and noise). In fact, studies concerning this issue refer to greater social benefits rather than a social cost [53].
3. Data and Methods
Next, we systematically review the actual presence or absence of the previously described cycling facilities, in Valencia. In order to assess the scope and the impact of cycling promotion policies implemented in Valencia, in this paper, we rely both on qualitative and quantitative data.
The scope of cycling promotion policies is analyzed based on qualitative data provided by Agència Municipal de la Bicicleta, a local agency from Valencia’s City Council dedicated to promoting the use of bicycles. These data are complemented with quantitative data, provided by Valencia’s City Council, on the number of kilometers of bike lanes deployed in Valencia and the municipal investment in cycling facilities.
The impact of cycling policies, in Valencia, is analyzed by means of quantitative data on traffic intensity in bike lanes and in regular streets. These primary data on bicycle traffic comes from automatic counters installed along the bike lanes in Valencia. The counter installation and maintenance are part of the strategic program to encourage bicycling by the local government.
Automatic counters consist of inductive loops installed on the pavement. Every time a metal vehicle passes over the loops (or coils), the inductance of the coil changes, and consequently changes in the resistance of the circuit are measured. Different vehicle types, such as electric scooters and bicycles, produce different electric signatures that can be classified by the means of proper machine learning techniques. Unfortunately, at the time of writing this article (October 2020), the automatic counters in Valencia city bike lanes were not able to distinguish vehicle types.
Counters are equally distributed along the different sections of the urban bike lanes (i.e., Figure 1). The number of counters has increased in recent years, from 73 in 2016 up to 118 counters in October 2020 (Table 1). The information on traffic intensity in different sections of the bike lanes is collected as the daily number of vehicles passing over every counter. The Agència Municipal de la Bicicleta publishes these data, for every counter, aggregated as monthly averages of daily passes over each counter, excluding weekends and holiday nonworking days.
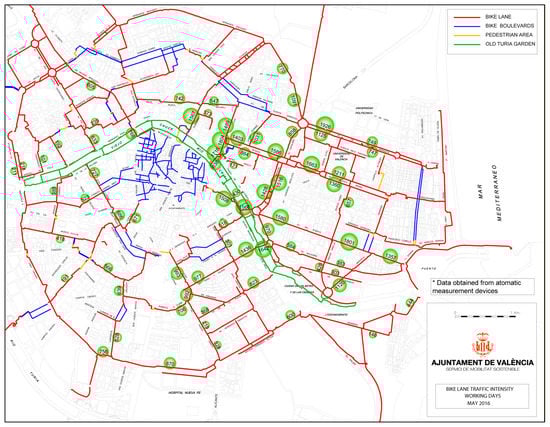
Figure 1.
Average number of daily passes over counters in bike lanes in Valencia, May 2016. Source: Agència Municipal de la Bicicleta. Ajuntament de València.

Table 1.
Number of traffic counters in bike lanes in Valencia, by year.
In a similar manner, we also analyze motor traffic based on automatic counters that are equally distributed along different sections of the city roads and streets. The information is aggregated exactly in the same way described for bike lane counters. The total number of motor traffic counters in October 2020 was 490.
4. Analyses and Results
4.1. Public Policies and Urban Facilities in Valencia to Promote Bicycling
In recent years, from 2016 to present, the local government of Valencia has invested more than 8.4 million euro promoting bicycling and providing facilities to encourage more sustainable ways of urban transportation. In this section, we aim to systematically describe the cycling facilities deployed by Valencia City Council.
Table 2 contains a list of 42 cycling facilities grouped in eight categories [31] and provides information on their deployment (or not) in the city of Valencia. A facility is labeled as “yes”, deployed in Valencia, if there is at least one observable facility of that kind deployed.
Table 2.
Cycling facilities in urban areas, and its implementation in Valencia from 2016 to 2020.
4.2. Infrastructure
As shown in Table 2, all the infrastructure elements considered, except for bike boxes, have been deployed in Valencia. Indeed, the extension of bike lanes (Figure 2) has been constantly growing with two periods of especially intense expansion, i.e., between 2008 and 2011, under a conservative local government, and between 2016 and 2020, under a progressive government. By October 2020, Valencia has 159.1 km of bike lanes (plus 3 km in progress) and 29.5 km of bicycle boulevards. In addition, facilities such as specific bicycle traffic lights, signed routes, and colored paths have been implemented, among others. The more notable facility implemented recently in the city is a bike path circle around Valencia city center called “anell ciclista” that connects preexisting bike lanes in different city districts. According to data from Valencia City Council (Table 2), 93% of the infrastructure elements identified in the literature review are deployed in Valencia. Only one out of 15 facilities is not present; no bike boxes are signalized in front of the motor vehicle lane where cyclists can wait during red traffic light phases. Indeed, there are only two contraflow bike lanes in the city. To conclude about this package of facilities, cycling infrastructures are correctly developed in Valencia, becoming a key element to create the existing network of bike lanes evenly deployed along time (Figure 2).
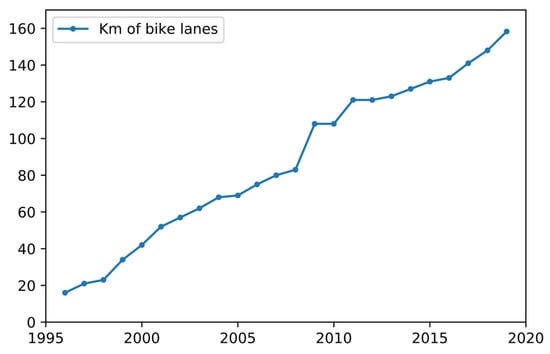
Figure 2.
Bike lane extension in Valencia, by year, 1995–2020. Source: Agència Municipal de la Bicicleta. Ajuntament de València.
4.3. Traffic Controls
Traffic measures are commonly implemented in Valencia. In August 2020, a significant portion of the Town Council Square was pedestrianized. There are car-free streets in some neighborhoods, and also areas with priority for pedestrians. We can conclude that 100% of facilities for pedestrians and cyclists presented in the literature are well developed in Valencia, and their usage will increase over the next years.
4.4. Bike Parking
Bike vandalism is present around all European cities, especially in the southern cities. To avoid thieves, Valencia unfortunately does not have a sophisticated network of sheltered parking. However, a few elements such as covered and monitored bicycle parking at hotspots of the city are present, in particular, at the main bus and train stations. Only one parking at the main train station benefits from a positive externality, having a train station guard near to the parking. Public parking facilities only offer an unsheltered system, however private facilities cover partially the demand by implementing a few private spaces at neighborhoods. In general, despite the lack of sheltered public parking spots developed by other European cities, 75% of the observed facilities in the literature are partially covered in Valencia. The city of Valencia should develop this aspect in order to complete the proper package of facilities.
4.5. End-of-Trip Facilities
No public end-of-trip facilities were observed in Valencia, such as showers at workplaces and full-service bicycle stations. Only a few companies located outside of the urban area provided these services for private use.
4.6. Integration of Bicycles with Public Transport
There is a lack of public facilities, since different private companies operate in the transport sector. Valencian public buses carry folding bicycles, but not regular bicycles as there are no bus bike racks. Valencian suburban metro only allows bicycles during the weekends, except for folding bicycles. An interesting key point, here, is the fact that most metro stations are equipped with elevators that can be easily reached by cyclists. As compared with other north European countries, there is a lack of certain facilities. There are unsheltered bike parking places near the bus stops, but there are no bike racks on buses. However, there is a well-developed network of short-term rental bikes called “Valenbisi” with a large system of designated spots around the city. In summary, 80% of the measures reported in the literature to integrate bycicles with public transport are present in Valencia. Consequently, there is room for improvement, and public interventions should support sustainable practices in this area.
4.7. Programs and Legal Interventions to Promote Bicycling
According to the legal interventions and public programs developed to promote bicycling, we highlight the mobility ordinance “Ordenanza de mobilidad”, implemented in 2019 as a legal effort to promote cycling. Those efforts are legally oriented to develop a safe and friendly climate for bicycling and include information programs, safety routes to school for pedestrians, promotion of bike days, including festivals and special events related to bicycling. Once a month there is a cyclist demonstration organized by cyclist associations and partially facilitated by the local government under a festive atmosphere (Massa Crítica València). An important device displayed in Valencia that creates a positive environment for bicycling is the public counter system, which measures daily cumulative number of passes. A total of five counters (out of 118) in selected critical points of the city are reported in real time in luminescent panels. These panels are located beside the bike lanes and can be read by the general public.
Other campaigns related to individualized marketing or bicycling-specific programs are present in the city, such as public campaigns promoting gifts to go to the opera (by biking to the opera) or promoting cycling among women (women’s day). To conclude, there is an exemplary effort from local government to establish a legal framework to facilitate bicycling. The legal facilities in Valencia account for 87.5% of the facilities identified by the literature. This percentage is explained by a lack of programs, promotions, and campaigns related to bicycling incentives as compared with bike-to-work events [54] and parking cash-out programs [55] present in USA.
4.8. Bicycle Access Programs
The reviewed literature identified two types of bicycle access programs, i.e., programs to increase bicycle access and bicycle-sharing programs. On the one hand, there is no information about the first program being present in Valencia. On the other hand, the “Valenbisi” sharing system is a successful program based on its use and extensive network. Inaugurated in 2010, today, it has 276 automatic stations including strategic spots near train stations, universities, subway entries, city beaches, and vivant neighborhoods. Those hot spots have a larger number of “Valenbisi” docking stations due the high demand of users. In summary, 50% of the facilities described in the literature are present in Valencia.
4.9. Legal Interventions
Legal interventions contain two measures analyzed in the research literature; they are the use of helmet laws and speed limits. In Valencia, there is a legal requirement for children under 16 to wear a helmet. With respect to speed limits, the city of Valencia also implemented different measures to reduce traffic speed on the streets. In 2019, the local government announced a speed limit of 30 Km/h on one-way streets, affecting up to 64% of the city, and a total of 708 street kilometers. Thus, these two elements are satisfactorily covered in Valencia.
The previously classified list of facilities of Valencia is part of a renewed effort to accommodate bicycles in the city. Education on bicyclist encourages bicycling [56]. There have been case studies on cycling trend and policies considered for six cities and three European countries. The evidence supports that a multi-faceted tactic for the provision of public facilities is the most effective way to enhance bicycling. A set of measures completing a comprehensive network of well-maintained and well-designed bike paths is the key to better promote bicycling.
As we saw in this section, Valencia has implemented a wide range of policies to support bike paths as the main infrastructure investment. As previously mentioned, those policies are related, but not limited to roadway design with separate cycling facilities, comprehensive traffic education, traffic priority for cyclists at intersections, informational events, and restrictions of car uses. However, 17% of cycling facilities (seven out of 42) are not fully adopted by the city of Valencia, as presented in Table 2.
Valencia has a fairly positive attitude towards bicycling, providing a large range of facilities and also public policies to promote it. Effective contributions to promote cycling in Valencia began in the early 1980s with the inauguration of the first bike lanes in the city. After time, different local governments of different political and ideological adscriptions enlarged the bike lane network towards peripheral neighborhoods and contributed with key cycling infrastructures. The fact that cycling policies in Valencia have been implemented by governments of different political orientation make cycling policies difficult to reverse.
4.10. Bike Traffic Intensity Analysis
In order to analyze bicycle traffic data, we selected an array of automatic measuring points that were functional throughout the period studied. Since the number of automatic counters has increased along with the expansion of the bike lane network in Valencia, and in order to make measurements fully comparable, we focused on a core of 71 automatic counters which had measurements available from May 2016 to October 2020, when our series ended. These 71 counters correspond to those available in May 2016 (see Figure 1) that remained operational until October 2020. By doing so we could study the evolution of bike traffic intensity in Valencia with a measurement that was not contaminated by the installation of new measuring points. We analyzed traffic intensities on a total of 3692 data points. Our unit of analysis was the monthly average of the number of daily passes over each of the 71 automatic counters (see Section 3).
Figure 3 shows the bicycle traffic intensity evolution for each year, for the 2016–2019 period. Data clearly shows an important variability in traffic intensity both within and between the years.
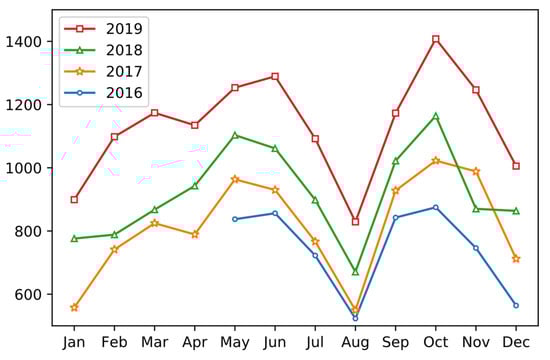
Figure 3.
Traffic intensity in bike lanes in Valencia city, 2016–2019 (average daily passes over 71 automatic counters). Source: Agència Municipal de la Bicicleta. Ajuntament de València.
On the one hand, if we consider the within year variability, we observe a strong seasonal pattern over the four years. In this pattern, the maximum use of bicycle corresponds to two periods of the year, i.e., May–June and October. The minimum traffic in bike lanes corresponds to January and August. The historical minimum traffic intensity in the period corresponds to August 2016 with a monthly average of 523 daily passes per counter. The maximum of the period corresponds to October 2019 with an average of 1408 passes per counter.
These results are fully consistent with previous studies [57,58,59] that showed, among other factors, urban bicycle use is strongly dependent on ambient temperature, in a curvilinear manner. The higher the ambient temperature, the greater the bicycle use, up to a specific temperature point in which the relation becomes inverse.
Traffic intensity in Valencia shows a similar pattern with maximum traffic intensity in months with milder temperature and minimum traffic in months with more extreme temperatures.
On the other hand, although there is a seasonal pattern in the data, if we consider the between years variability, we observe a clear and sustained yearly increase in the intensity of bike lane traffic in Valencia. The lines in Figure 3 represent consecutive years and appear almost perfectly layered, showing relevant increases in the use of bike lanes. However, these increments in bicycle use are not constant. As shown in Figure 4, the increase is strong but stable from 2016 to 2018. Then, the intensity of traffic in bike lanes increased even more between 2018 and 2019, showing an additional expansion of bicycle use. Figure 4 also includes a second series showing the yearly expansion of bike lanes along with the variations in traffic intensity in the preexisting bike lane sectors. Both series show a positive trend and, in the case of traffic intensity, it seems to increase even more after 2018. This result is especially telling if we consider that our measure of traffic intensity is based only on the preexisting core of automatic counters active since 2016. Given that, in 2016, data points begin in May, the computation of year averages of daily passes over automatic counters, shown in Figure 4, included only data points from May to December in every year. We computed year averages in such way in order to make the 2016 averages fully comparable to the averages during the rest of the period.
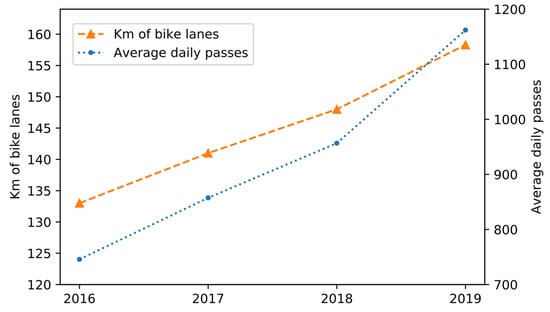
Figure 4.
Bike lane extension and bicycle traffic intensity in Valencia, by year, 2016–2019. Source: Agència Municipal de la Bicicleta. Ajuntament de València.
Figure 5 contains data on traffic intensity in bike lanes in Valencia, including data from the year 2020. It shows that in January and February 2020 the bike lane traffic intensity continued to steadily increase, maintaining the positive overall tendency seen up to that time. Suddenly, in March 2020, traffic intensity declined reaching its historical minimum due to the impact of the lockdown decreed in Spain because of SARS-CoV-2. Then, parallel to the progressive de-escalation of lockdown, traffic intensity in bike lanes recovered the values observed previously in August 2019 and began a slight increase after that time.
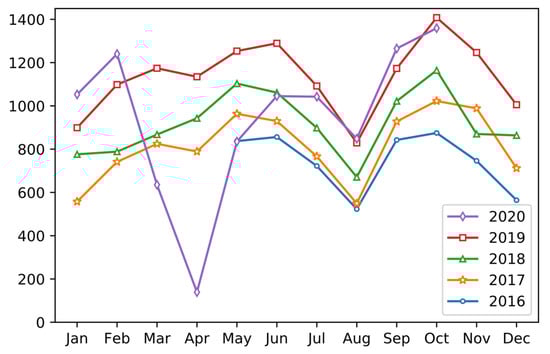
Figure 5.
Traffic intensity in bike lanes in Valencia city, 2016–2020 (average daily passes over 71 automatic counters). Source: Agència Municipal de la Bicicleta. Ajuntament de València.
Finally, Figure 6 compares the evolution of bicycle lane traffic intensity and motor vehicle traffic intensity in Valencia. Data for motor traffic intensity was processed exactly in the same way as for bike traffic intensity. Data come from the core of motor traffic automatic sensors that remained operational throughout the period, and do not include measurements from January to March in order to maximize comparability with bike lane traffic data.
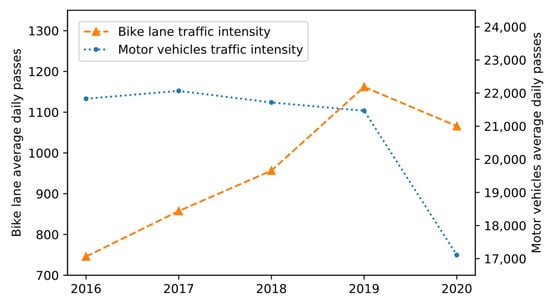
Figure 6.
Bike lane and motor vehicles traffic intensity in Valencia, 2016–2020. Source: Ajuntament de València.
Except for 2020, both transportation modes show opposite trends, i.e., while cycling intensity systematically increases, motor traffic shows a slight decrease throughout the period. In 2020, due to the special circumstances associated with SARS-CoV-2 March and April lockdown, both average traffic intensities decreased. That decrease was especially acute in the case of motor vehicles since, once the lockdown was over, it never recovered its previous level [60].
5. Discussion
In this paper, we aimed to provide new evidence to support the existing literature on bicycling sustainable urban mobility policy. Public interventions have been crucial for achieving a greater level of cycling, reaching high usage levels, and promoting sustainable practices.
Valencia stands in a satisfactory position to attract an increased number of bicycle users, since its bike lanes are extensive and well connected.
Taking into consideration that the social interest of bicycling appeared decades ago, we assume that public policies to promote bicycling were implemented in order to satisfy this preexisting demand. There exists a historical demand from the habitants of Valencia to provide a safer environment for bicycling. Demonstrations lobbying the local government to increase investment in bicycling facilities have been a constant in Valencia, supported by grassroots movements such as València en Bici or Massa Crítica.
Infrastructure interventions in the city are correctly established, and traffic controls are frequently present in the city, providing a safer environment for cycling. Indeed, the potential social benefits transformed to health outcomes are also very important to justify the development of bicycle infrastructure [10,11].
There is a lack of resources for three main elements, i.e., bicycle parking, end-of-trip facilities, and integration of bicycles with public transport. The local government should cover those three disadvantages that could discourage potential cycling. Bike parking has a positive effect on cycling to work. Indoor secure parking positively affects the demand, and even more so with end-of-trip facilities [45]. Bicycle access programs are also missing in Valencia.
A positive practice in Valencia is the bicycle-sharing program “Valenbisi”. “Valenbisi” started in 2010 reaching more than 120,000 attached users. Many citizens from Valencia discovered the advantages of bicycling thanks to “Valenbisi”, which motivated many to decide to buy a bicycle. This circumstance, together with the proliferation of private rental companies, has caused the number of users to stabilize in recent years at around 45,000 subscribers. Another relevant facility deployed in Valencia is the automatic bicycle counter network around the city, which is crucial to measure the evolution of bicycle usage. Monitoring and measuring the final output gives public administrators the opportunity to make decision based on observed data. Furthermore, the discussion extends to a positive impact on bicycling, since the show-up effect of counters can create a friendly environment for bicycling.
The consequence of the social demand for cycling facilities accompanied by the constant development of the bike lane network by different local governments has been a steady increase in bicycle users in Valencia throughout the period studied.
We can conclude that bicycling has to be safe, convenient, and attractive. In particular, despite the good results in Valencia, bicycling still needs to increase its competitiveness with respect to other transportation modes. Public administrators should provide the key elements to achieve such goal. By providing the correct cycling facilities with the correct intensity, the machinery works and greater number of cyclists are also attracted.
5.1. Limitations
Our research, as many others, has limitations. The listed facilities are not uniform around the cities; each city needs different facilities for different purposes. Indeed, the provision of cycling facilities in the city is not homogeneous; it depends on the number of facilities implemented, and also on the intensity in which measures are implemented. A lot of public facilities are considered to be public infrastructure. As with other public goods, market failures could appear, such as provision failures and spatial limitations, among others. Automatic bike counters cannot discriminate the vehicle type, but neither gender nor other socio-demographic characteristics of users. This fact reduces the analytical power of our investigation. Finally, the lack of public information (e.g., bike traffic intensity and investment) before 2016 limits the study.
5.2. Further Research
Further research is needed to create a more detailed picture of preferences over sustainable modes of transportation. Future studies based on individual level survey data should shed light over socio-demographic characteristics and preferences on modes of transportation to better understand the mechanism linking them. Additionally, comparative studies of public policies and bicycle use across similar territories are needed to better understand successful models.
Other potential studies could also take in consideration a cost benefit analysis and an estimation of environmental and health outcomes.
Author Contributions
Research conceptualization, G.M. and A.S.; Data curation, A.S.; Formal data analysis, A.S.; In-vestigation, G.M.; Writing—original draft, G.M. and A.S. All authors have read and agreed to the published version of the manuscript.
Funding
G.M. appreciates research funding from Burgundy School of Business. A.S. appreciates the editorial funding support received from Centro Universitario EDEM-Escuela de Empresarios.
Institutional Review Board Statement
Not applicable.
Informed Consent Statement
Not applicable.
Data Availability Statement
Publicly available datasets were analyzed in this study. This data can be found here: [https://valencia.es].
Conflicts of Interest
The authors declare no conflict of interest.
References
- Sultana, S.; Salon, D.; Kuby, M. Transportation sustainability in the urban context: A comprehensive review. Urban. Geogr. 2019, 40, 279–308. [Google Scholar] [CrossRef]
- Akyelken, N.; Banister, D.; Givoni, M. The sustainability of shared mobility in London: The dilemma for governance. Sustainability 2018, 10, 420. [Google Scholar] [CrossRef]
- Schleinitz, K.; Petzoldt, T.; Franke-Bartholdt, L.; Krems, J.; Gehlert, T. The German Naturalistic Cycling Study–Comparing cycling speed of riders of different e-bikes and conventional bicycles. Saf. Sci. 2017, 92, 290–297. [Google Scholar] [CrossRef]
- IEA. Global EV Outlook 2019; IEA: Paris, France, 2019; Available online: https://www.iea.org/reports/global-ev-outlook-2019 (accessed on 1 December 2020).
- Karanikola, P.; Panagopoulos, T.; Tampakis, S.; Tsantopoulos, G. Cycling as a smart and green mode of transport in small touristic cities. Sustainability 2018, 10, 268. [Google Scholar] [CrossRef]
- Pucher, J. Bicycling boom in Germany. A revival engineered by public policy. Transp. Quaterly 1997, 51, 31–46. [Google Scholar]
- Quality of Transport Report. European Commission, December 2014; p. 11. Available online: https://ec.europa.eu/transport/road_safety/specialist/knowledge/pedestrians/pedestrians_and_cyclists_unprotected_road_users/walking_and_cycling_as_transport_modes_en (accessed on 8 September 2015).
- Winters, M.; Brauer, M.; Setton, E.M.; Teschke, K. Built Environment Influences on Healthy Transportation Choices: Bicycling versus Driving. J. Urban. Health 2010, 87, 969–993. [Google Scholar] [CrossRef] [PubMed]
- Gössling, S.; Choi, A.S. Transport transitions in Copenhagen: Comparing the cost of cars and bicycles. Ecol. Econ. 2015, 113, 106–113. [Google Scholar] [CrossRef]
- Garrard, J.; Rissel, C.; Bauman, A. Health benefits of cycling. In City Cycling; Pucher, J.R., Buehler, R., Eds.; The Mit press: Cambridge, MA, USA, 2012; pp. 31–56. [Google Scholar]
- Doorley, R.; Pakrashi, V.; Ghosh, B. Health impacts of cycling in Dublin on individual cyclists and on the local population. J. Transp. Health 2017, 6, 420–432. [Google Scholar] [CrossRef]
- Andersen, L.B.; Schnohr, P.; Schroll, M.; Hein, H.O. All-cause mortality associated with physical activity during leisure time, work, sports, and cycling to work. Arch. Intern. Med. 2000, 160, 1621–1628. [Google Scholar] [CrossRef]
- Bassett, D.R.; Pucher, J.; Buehler, R.; Thompson, D.L.; Crouter, S.E. Walking, cycling, and obesity rates in Europe, North America, and Australia. J. Phys. Act. Health 2008, 5, 795–814. [Google Scholar] [CrossRef]
- Bauman, A.E.; Rissel, C.; Garrard, J.; Ker, I.; Speidel, R.; Fishman, E. Cycling: Getting Australia Moving: Barriers, Facilitators and Interventions to Get More Australians Physically Active through Cycling; Cycling Promotion Fund: Melbourne, Australia, 2008. [Google Scholar]
- Cavill, N.; Kahlmeier, S.; Racioppi, F. (Eds.) Physical Activity and Health in Europe: Evidence for Action; WHO Regional Office Europe: Copenhagen, Denmark, 2006. [Google Scholar]
- Giles-Corti, B.; Vernez-Moudon, A.; Reis, R.; Turrell, G.; Dannenberg, A.L.; Badland, H.; Owen, N. City planning and population health: A global challenge. Lancet 2016, 388, 2912–2924. [Google Scholar] [CrossRef]
- Gordon-Larsen, P.; Boone-Heinonen, J.; Sidney, S.; Sternfeld, B.; Jacobs, D.R.; Lewis, C.E. Active commuting and cardiovascular disease risk: The CARDIA study. Arch. Intern. Med. 2009, 169, 1216–1223. [Google Scholar] [CrossRef]
- Hamer, M.; Chida, Y. Active commuting and cardiovascular risk: A meta-analytic review. Prev. Med. 2008, 46, 9–13. [Google Scholar] [CrossRef] [PubMed]
- Hillman, M. Cycling and the promotion of health. Policy Studies 1993, 14, 49–58. [Google Scholar] [CrossRef]
- Huy, C.; Becker, S.; Gomolinsky, U.; Klein, T.; Thiel, A. Health, medical risk factors, and bicycle use in everyday life in the over-50 population. J. Aging Phys. Act. 2008, 16, 454–464. [Google Scholar] [CrossRef]
- Matthews, C.; Jurj, A.; Shu, X.; Li, H.; Yang, G.; Li, Q.; Zheng, W. Influence of exercise, walking, cycling, and overall nonexercise physical activity on mortality in Chinese women. Am. J. Epidemiol. 2007, 165, 1343–1350. [Google Scholar] [CrossRef] [PubMed]
- Oja, P.; Vuori, I.; Paronen, O. Daily walking and cycling to work: Their utility as health-enhancing physical activity. Patient Educ. Couns. 1998, 33, S87–S94. [Google Scholar] [CrossRef]
- Raustorp, J.; Koglin, T. The potential for active commuting by bicycle and its possible effects on public health. J. Transp. Health 2019, 13, 72–77. [Google Scholar] [CrossRef]
- Rojas-Rueda, D.; de Nazelle, A.; Teixidó, O.; Nieuwenhuijsen, M.J. Replacing car trips by increasing bike and public transport in the greater Barcelona metropolitan area: A health impact assessment study. Environ. Int. 2012, 49, 100–109. [Google Scholar] [CrossRef]
- Rojas-Rueda, D.; De Nazelle, A.; Teixidó, O.; Nieuwenhuijsen, M.J. Health impact assessment of increasing public transport and cycling use in Barcelona: A morbidity and burden of disease approach. Prev. Med. 2013, 57, 573–579. [Google Scholar] [CrossRef]
- Shephard, R.J. Is active commuting the answer to population health? Sports Med. 2008, 38, 751–758. [Google Scholar] [CrossRef] [PubMed]
- Elvik, R. The non-linearity of risk and the promotion of environmentally sustainable transport. Accid. Anal. Prev. 2009, 41, 849–855. [Google Scholar] [CrossRef]
- Jacobsen, P.L.; Ragland, D.R.; Komanoff, C. Safety in numbers for walkers and bicyclists: Exploring the mechanisms. Inj. Prev. 2015, 21, 217–220. [Google Scholar] [CrossRef] [PubMed]
- Robinson, D.L. Safety in numbers in Australia: More walkers and bicyclists, safer walking and bicycling. Health Promot. J. Aust. 2005, 16, 47–51. [Google Scholar] [CrossRef] [PubMed]
- State Government of Victoria. Available online: https://www.betterhealth.vic.gov.au/health/healthyliving/cycling-health-benefits (accessed on 1 December 2020).
- Pucher, J.; Dill, J.; Handy, S. Infrastructure, programs, and policies to increase bicycling: An international review. Prev. Med. 2010, 50, S106–S125. [Google Scholar] [CrossRef] [PubMed]
- Dimter, S.; Stober, D.; Zagvozda, M. Strategic Planning of Cycling Infrastructure Towards Sustainable City Mobility-Case Study Osijek, Croatia. Mater. Sci. Eng. 2019, 41, 092022. [Google Scholar] [CrossRef]
- Gerike, R.; Jones, P. Strategic planning of bicycle networks as part of an integrated approach. In Cycling Futures: From Research into Practice; Routledge: Abingdon-on-Thames, UK, 2015; pp. 115–136. [Google Scholar]
- Buehler, R.; Pucher, J. Sustainable transport that works: Lessons from Germany. World Transp. Policy Pract. 2009, 15, 13–46. [Google Scholar]
- Buehler, T.; Handy, S. Fifty years of bicycle policy in Davis, California. Transp. Res. Rec. 2008, 2074, 52–57. [Google Scholar] [CrossRef]
- Council, D.B. Continuous and Integral: The Cycling Policies of Groningen and other European Cities (Amsterdam: Fietsberaad). 2006. Available online: http://www.fietsberaad.nl/ (accessed on 5 February 2014).
- Pucher, J.; Buehler, R. At the frontiers of cycling. Policy innovations in The Netherlands, Denmark, and Germany. World Transp. Policy Pract. 2007, 13, 8–57. [Google Scholar]
- Tin, S.T.; Woodward, A.; Thornley, S.; Ameratunga, S. Cycling and walking to work in New Zealand, 1991–2006: Regional and individual differences, and pointers to effective interventions. Int. J. Behav. Nutr. Phys. Act. 2009, 6, 64. [Google Scholar] [CrossRef]
- Saelens, B.E.; Sallis, J.F.; Frank, L.D. Environmental correlates of walking and cycling: Findings from the transportation, urban design, and planning literatures. Ann. Behav. Med. 2003, 25, 80–91. [Google Scholar] [CrossRef] [PubMed]
- Sælensminde, K. Cost–benefit analyses of walking and cycling track networks taking into account insecurity, health effects and external costs of motorized traffic. Transp. Res. Part A Policy Pract. 2004, 38, 593–606. [Google Scholar] [CrossRef]
- Teschke, K.; Harris, M.A.; Reynolds, C.C.; Winters, M.; Babul, S.; Chipman, M.; Monro, M. Route infrastructure and the risk of injuries to bicyclists: A case-crossover study. Am. J. Public Health 2012, 102, 2336–2343. [Google Scholar] [CrossRef]
- Pucher, J.; Buehler, R. Why Canadians cycle more than Americans: A comparative analysis of bicycling trends and policies. Transp. Policy 2006, 13, 265–279. [Google Scholar] [CrossRef]
- AASHTO Executive Committee. Guide for the Development of Bicycle Facilities; American Association of State Highway Transportation Officials: Washington, DC, USA, 1999. [Google Scholar]
- Topp, H.; Pharoah, T. Car-free city centres. Transportation 1994, 21, 231–247. [Google Scholar] [CrossRef]
- Wardman, M.; Tight, M.; Page, M. Factors influencing the propensity to cycle to work. Transp. Res. Part A Policy Pract. 2007, 41, 339–350. [Google Scholar] [CrossRef]
- Hunt, J.D.; Abraham, J.E. Influences on bicycle use. Transportation 2007, 34, 453–470. [Google Scholar] [CrossRef]
- Hegger, R. Public transport and cycling: Living apart or together? Public Transp. Int. 2007, 56, 38–41. [Google Scholar]
- Ryley, T. Estimating cycling demand for the journey to work or study in West Edinburgh, Scotland. In Transp. Res. Rec. 2006, 1982, 187–193. [Google Scholar] [CrossRef]
- Barta, F.; Brög, W. National Demonstration Project: Individualized Marketing Demonstration Program. In Proceedings of the Transp. Res. Board TRB 86 Annual Meeting Compendium of Papers CD-ROM, Washington, DC, USA, 21–25 January 2007. [Google Scholar]
- DeMaio, P. Bike-sharing: History, impacts, models of provision, and future. J. Public Transp. 2009, 12, 3. [Google Scholar] [CrossRef]
- Clarke, C. The Case against Bicycle Helmets and Legislation; Cyclists’ Touring Club, Yorkshire and Humber Region: Guildford, UK, 2006. [Google Scholar]
- Robinson, D.L. No clear evidence from countries that have enforced the wearing of helmets. Br. Med. J. 2006, 332, 722–725. [Google Scholar] [CrossRef] [PubMed]
- Ang, A.; Christensen, P.; Vieira, R. Should congested cities reduce their speed limits? Evidence from São Paulo, Brazil. J. Public Econ. 2020, 184, 104155. [Google Scholar] [CrossRef]
- Piatkowski, D.; Bronson, R.; Marshall, W.; Krizek, K.J. Measuring the impacts of bike-to-work day events and identifying barriers to increased commuter cycling. J. Urban Plan. Dev. 2015, 141, 04014034. [Google Scholar] [CrossRef]
- Shoup, D.C. Evaluating the effects of cashing out employer-paid parking: Eight case studies. Transp. Policy 1997, 4, 201–216. [Google Scholar] [CrossRef]
- Buehler, R.; Pucher, J. Cycling for a few or for everyone: The importance of social justice in cycling policy. World Transp. Policy Pract. 2009, 15, 57–64. [Google Scholar]
- Böcker, L.; Dijst, M.; Prillwitz, J. Impact of everyday weather on individual daily travel behaviours in perspective: A literature review. Transp. Rev. 2013, 33, 71–91. [Google Scholar] [CrossRef]
- Jestico, B.; Nelson, T.; Winters, M. Mapping ridership using crowdsourced cycling data. J. Transp. Geogr. 2016, 52, 90–97. [Google Scholar] [CrossRef]
- Miranda-Moreno, L.F.; Nosal, T. Weather or not to cycle: Temporal trends and impact of weather on cycling in an urban environment. Transp. Res. Rec. 2011, 2247, 42–52. [Google Scholar] [CrossRef]
- Intensidades de Vehículos Motorizados. 2020. Available online: https://www.valencia.es/ayuntamiento/trafico.nsf/fCategoriaVista?readForm&Vista=vCategoriaDescargas&Categoria=Sincat&titulo=Descargas&lang=1&nivel=6&expand=11&bdorigen=&idApoyo= (accessed on 4 December 2020).
Publisher’s Note: MDPI stays neutral with regard to jurisdictional claims in published maps and institutional affiliations. |
© 2021 by the authors. Licensee MDPI, Basel, Switzerland. This article is an open access article distributed under the terms and conditions of the Creative Commons Attribution (CC BY) license (http://creativecommons.org/licenses/by/4.0/).