Abstract
In recent years, particulate matter (PM) has emerged as a major social issue in various industries, particularly in East Asia. PM not only causes various environmental, social, and economic problems but also has a large impact on public health. Thus, there is an urgent requirement for reducing PM emissions. In South Korea, the PM generated at construction sites in urban areas directly or indirectly causes various environmental problems in surrounding areas. Construction sites are considered a major source of PM that must be managed at the national level. Therefore, this study aims to develop a technology for predicting PM emissions at construction sites. First, the major sources of PM at construction sites are determined. Then, PM emission factors are calculated for each source. Furthermore, an algorithm is developed for calculating PM emissions on the basis of an emission factor database, and a system is built for predicting PM emissions at construction sites. The reliability of the proposed technology is evaluated through a case study. The technology is expected to be used for predicting potential PM emissions at construction sites before the start of construction.
1. Introduction
The World Health Organization has recently classified particulate matter (PM) as a class 1 carcinogen because research has shown that it may cause lung, cardiovascular, and respiratory diseases. Thus, considerable effort is being made to reduce PM emissions in various industries worldwide [1,2,3,4,5,6,7,8,9]. In East Asian countries, particularly South Korea and China, the emission of large amounts of PM due to radical industrialization is emerging as a major social problem [10,11,12,13,14,15]. According to the statistical data of the Ministry of Environment (ME) of South Korea, fugitive emissions account for approximately 50% of PM10 and smaller PM emissions in South Korea. Furthermore, the fugitive emissions caused by construction work are the largest at 33% [16,17].
PM is generated during construction mainly by the movement of construction equipment and construction activities. Accordingly, there is an urgent requirement for research on various PM emission sources associated with construction equipment [18]. Currently, there is no standard for regulating PM emissions at construction sites in South Korea and no method for calculating PM emissions to set such a standard [19]. The National Institute of Environmental Research (NIER) of South Korea uses the method provided by the US Environmental Protection Agency (EPA) to calculate the amount of PM10 in fugitive dust at construction sites using an equation [20]. However, the equation calculates PM10 using only the construction period and the size of a construction area, and it cannot reflect the various construction conditions that generate PM.
In South Korea, PM at construction sites is managed on the basis of the emission concentration through “PM Emergency Reduction Measures” [21]. However, this is a passive method that is applied after a high concentration of PM has already been generated. Therefore, a method to preventively manage PM emissions by controlling the quantity of emissions is needed for accurate PM management. As the South Korean government has recognized the need for quantitative management of dust emission, the “Business Site Total Air Pollution Management System” was implemented nationwide in South Korea in 2020. This is a preemptive system for managing air pollutants by presenting quantitative emission standards in advance. It has realized an active reduction in air pollution by setting the total amount of allowed emissions and then assigning an amount to each business site to maintain pollutants within the allotted range [22]. However, this system only regulates the business site emissions and does not include construction sites as management targets. The South Korean government continuously discusses the importance of managing construction site emissions; however, there is no clear standard to evaluate PM emissions generated from construction sites. Therefore, it is necessary to develop a systematic method for calculating PM emissions at construction sites quantitively by developing emission factors and calculating methods to expand the national air pollution management system to construction sites in the future [23].
Therefore, this study develops a technology to predict PM emissions at construction sites by calculating the emission factors for PM10 and PM2.5 for major PM emission sources. PM emissions are calculated on the basis of an emission factor database (DB). Furthermore, a system is developed for predicting PM emissions. The reliability of the prediction technology is examined through a case study.
2. Materials and Methods
The PM emission factors at construction sites were calculated and used to construct a DB. Then, this DB was utilized to develop a method for calculating PM emissions. Finally, an algorithm was developed to predict PM emissions at actual construction sites. The PM emission factors were calculated by identifying the major sources of PM emissions and construction activities. The emission factor DB consisted of direct and fugitive emission factors for each construction activity and emission source. In addition, emission scenarios and calculation methods were proposed for each emission source. Finally, a system for predicting PM emissions at construction sites was developed on the basis of the emission factor DB and calculation method. Figure 1 shows the research method of this study.
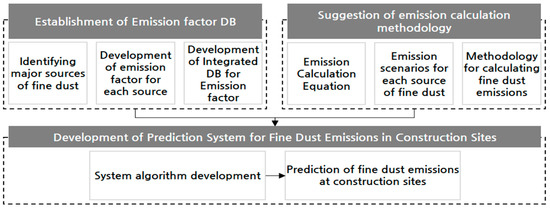
Figure 1.
Research framework and methods.
2.1. Major PM Emission Sources at Construction Sites
Earthworks are considered the major source of PM emissions at construction sites [24]. In addition, according to US EPA AP-42 and the ME of South Korea, the movement of construction equipment used for civil works and construction activities is a major source of PM emissions at construction sites [20,25]. Figure 2 shows the major PM emission sources selected in this study. These sources were selected on the basis of the construction-related air pollutant emission sources defined by the US EPA and ME of South Korea [17,20,25,26,27]. Among the large category of air pollutant emission sources defined in South Korea, the categories of on-road and nonroad mobile pollution sources were selected. The major dust generating sources defined in AP-42 (Heavy Construction Operations) of US EPA match with the nine types of construction equipment and four types of material transport equipment in the small category of South Korean air pollutant emission sources. As a result, 13 major PM emission sources were selected in this study.
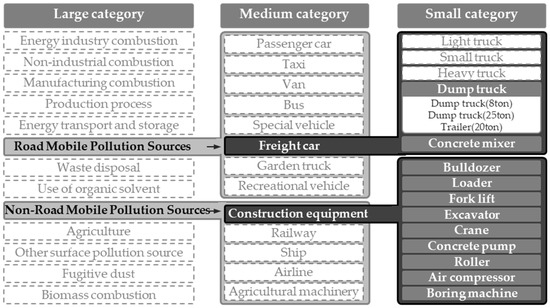
Figure 2.
Major particulate matter (PM) generating sources in construction sites.
2.2. PM Emission Factor DB for Construction Sites
Two types of PM emissions due to construction equipment were considered. The first type was direct emission, in which PM is released into the air through fuel combustion in construction equipment. The second type was fugitive emission, in which PM is released by the construction activities of construction equipment. Different methods were used to calculate the emission factors for each type of emission.
For direct emission, the air pollutant emission factor data presented by the NIER of South Korea were applied mutatis mutandis [26]. The emission factors for dump trucks and trailers were directly specified in the freight car category of on-road mobile pollution sources. The emission factors for the nine types of construction equipment were defined according to the rated output of each equipment type [20]. This study directly calculated the emission factors using the average rated output data for construction equipment manufactured in South Korea in accordance with the National Air Pollutant Emission Calculation Method Manual of South Korea. Table 1 shows the direct emission factors for PM10 and PM2.5 for different types of construction equipment.

Table 1.
Direct emission factors for construction equipment according to rated output.
For fugitive emission, the emission factors were calculated according to US EPA AP-42 [27,28,29]. However, forklifts, concrete pumps, and air compressors were excluded because the definition of fugitive emission activities was unclear. Table 2 shows the equations for calculating the emission factors for the construction activities of construction equipment. The information required for calculating the emission factors, such as the silt content, moisture content, and mean wind speed, was obtained from South Korean literature (GRI, 2019) [25].
Table 2.
Formulae for calculating fugitive emission factors for construction equipment.
However, according to the Korean national air pollutant emission factors (NIER, 2015) which are used for calculating the annual emission in Korea, fugitive emissions are calculated using Equation (1) and the emission factors in Table 3 [26].
where E denotes the total fugitive emissions (kg/year), A denotes the annual construction area (m2), P denotes the annual earthwork construction period (month/year), and EF denotes emission factor (kg/m2/month).
Table 3.
Emission factors (kg/m2/month) for Equation (1) [26].
The emission factors were derived from a NIER study (NIER, 2008) to select the most appropriate emission factors for construction sites among the emission factors developed by the US EPA [30]. According to this research study, the fugitive emission factors for each construction equipment were calculated using AP-42 as in this study. However, the types of construction equipment considered in the research were limited compared to this study, which implies that the fugitive emission factor database of this study is more appropriate for calculating the fugitive emissions of construction sites compared to Equation (1). The comparison of construction equipment considered in both studies is shown in Table 4.
Table 4.
Construction equipment considered for fugitive emission factor development.
2.3. Calculation Method for PM Emissions at Construction Sites
The PM emissions at construction sites in South Korea were calculated using Equation (2) of US EPA AP-42. This equation requires the activity rate, emission factor, and overall emission reduction efficiency, which quantify the degree and scope of construction activities. These variables should be presented as applicable figures in South Korea. The activity rate applicable to South Korea was obtained by deriving the construction activity scenarios for each type of construction equipment using the Standard of Construction Estimate [31]. In particular, the activity rates for bulldozers and rollers were derived by selecting the most typical usage of each equipment type, and other scenarios were derived by following the use of each equipment type described in the standard. Table 5 shows the construction activity scenarios for the construction equipment. In addition, the emission factor applicable to South Korea was obtained using the emission factor DB described in Section 2.2.
E, A, EF, and ER denote the emissions, activity rate, emission factor, and overall emission reduction efficiency, respectively. However, ER in this study was considered 0, as there is no standard for ER.
Table 5.
Scenarios for calculating the amount of construction activity.
3. Results
3.1. PM Emission Factors for Major Construction Equipment
Table 6 shows the emission factors obtained for major types of construction equipment. The construction equipment is divided into two categories, i.e., working and moving, according to the work type (construction activities). The direct and fugitive emission factors are obtained for PM10 and PM2.5 for each type of construction equipment. Hours, tons, and kilometers (or vehicle kilometers traveled (VKT)) are used as the functional units for the work time, amount of work, and distance traveled, respectively. According to Table 6, the direct emission factors for heavy construction equipment, such as bulldozers, loaders, and rollers, were higher than those for transportation equipment such as dump trucks.
Table 6.
Emission factor DB for construction site.
Furthermore, the fugitive emission factors for cranes, forklifts, bulldozers, and loaders were higher than those for other types of construction equipment. The above construction equipment is mainly used for cutting, excavating, and filling soil in earthworks, a large amount of fugitive dust is generated from the soil during these operations. In the case of transport equipment, the fugitive emission factors were higher than the direct emission factors. The direct emissions of PM due to the unloading of dump trucks were considered to be negligible and excluded from this study.
3.2. System for Predicting PM Emissions at Construction Sites
Figure 3 shows the components and algorithm of the system for predicting PM emissions at construction sites. The total PM emissions at construction sites were the sum of the direct and fugitive emissions caused by construction equipment, which were calculated as described in Section 3.1. An Excel-based system was developed for predicting PM emissions at construction sites. Figure 4 shows the information input screen of the system, where a user enters a design statement and general information about a construction project, and a sheet for displaying the evaluation result. The information input sheet was divided into two parts for entering the general information and design statement. The general information part was configured to input general site information such as the name of the construction project, construction period, site area, gross floor area, underground depth, and ground height. The design statement part was configured to input the amount of earthwork and construction material, which determined the amount of activity of construction equipment, on the basis of design documents and detailed statements.
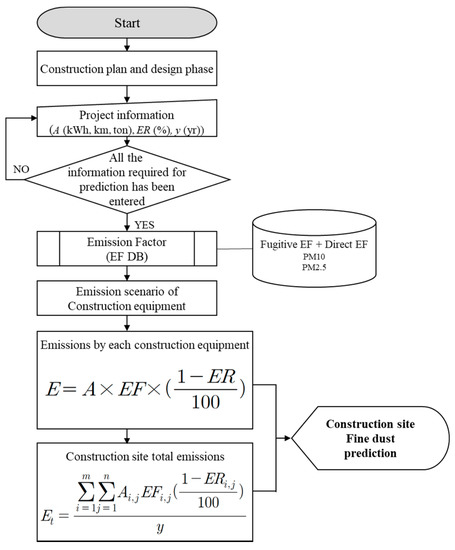
Figure 3.
Algorithm of system for predicting PM emissions at construction sites (EF: emission factor).
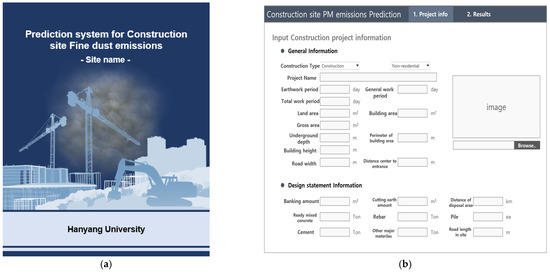
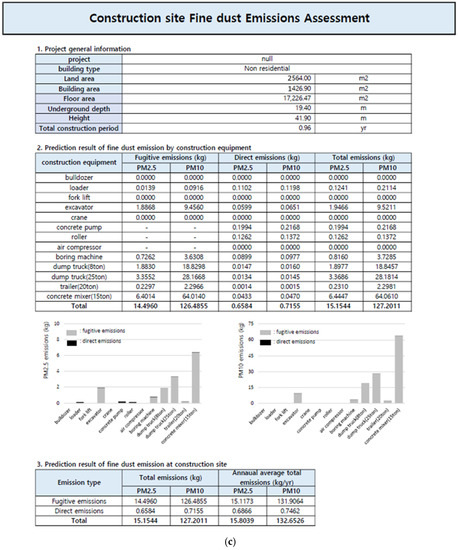
Figure 4.
System for predicting PM emissions at construction sites. (a) Main screen, (b) Information input sheet, (c) Assessment result sheet.
4. Case Study
4.1. Overview of Case Study
The applicability of the developed system was examined by predicting PM emissions using actual construction site information, as shown in Table 7. This information was obtained from the design outline, elevation drawing, floor plan, and design details of the building. The duration of earthworks and general works and the number of concrete piles were not available; these were assumed based on the scale of construction. The amount of work was calculated according to the PM emission scenario at the construction site in the prediction system. Then, the final PM emissions were predicted using the calculated amount of work and established emission factor DB.
Table 7.
Information of the construction site to be evaluated (PM: particulate matter).
4.2. Results of Case Study
Table 8 shows the evaluation results of PM emissions by construction equipment. The PM10 emissions by the concrete mixer truck were the largest (50.36% of the total PM10 emissions), followed by the 25-ton dump truck, 8-ton dump truck, and excavator. The PM10 emissions from these types of equipment accounted for approximately 95% of the total emissions at the construction site. The PM2.5 emissions showed a similar trend, with a few differences. The concrete mixer truck generated the largest amount of PM2.5 emissions. Nevertheless, they accounted for only 42.53% of the total emissions. Furthermore, the PM2.5 emissions decreased in the order of the 25-ton dump truck, excavator, and 8-ton dump truck. Table 9 shows the predicted total emissions and Figure 5 shows the predicted PM2.5 and PM10 emissions for construction equipment. The concrete mixer truck and dump trucks (25 tons and 8 tons) emitted high amounts of PM. Thus, a plan for reducing PM emissions should focus on these types of equipment.
Table 8.
PM emissions by construction equipment.
Table 9.
Results obtained using system for predicting PM emissions at construction sites.
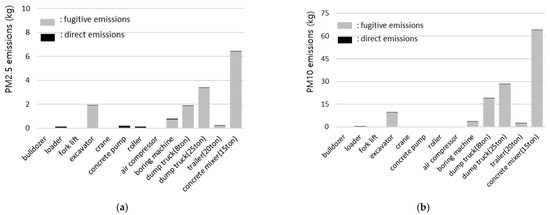
Figure 5.
Prediction results for PM2.5 and PM10 emissions by construction equipment. (a) PM2.5 emissions, (b) PM10 emissions.
Moreover, while the direct emission factors applied in this study are reasonable since they are based on the national air pollutant emissions statistics data which are widely used in Korea, the accuracy of the fugitive emission factors needs to be verified. However, there is no proper comparison target for verification, and it is necessary to study the detailed method of fugitive emission factor development in further studies. Thus, in this study, the comparison between the fugitive emissions result of the case study and fugitive emissions calculated by Equation (1) was studied to provide basic points of fugitive emission factor development.
According to the general information of the construction site used for the case study, the annual construction area is 2564 m2 and the annual earthwork period is 6.67 months. Since the building is a nonresidential building, the emission factors for Equation (1) are 0.0426 for PM10 and 0.00426 for PM2.5. Therefore, the total fugitive emissions calculated by Equation (1) are 7.28 × 10² kg/year for PM10 and 7.28 × 101 kg/year for PM2.5. Compared to the annual fugitive dust emissions derived in Table 7, the results of Equation (1) are approximately 5 times bigger in both PM10 and PM2.5. This gap is basically caused by the difference in the variables used in fugitive emission factor equations; in particular, the silt content and the moisture content highly affect fugitive emissions. Previously, it was found that the PM emissions increase as the silt content increases and that the PM emissions decrease as the moisture content increases [17]. According to the NIER research (NIER, 2008) for Equation (1) development, the moisture content used for fugitive emission factor calculation was 0.7% and silt content was 14.1%. However, the moisture content used in this study was 12% and the silt content was 9%, as shown in Table 2. Since the moisture content in this study is higher and the silt content is lower compared to the NIER research (NIER, 2008) the fugitive PM emissions calculated in this study were low. Thus, the moisture and silt content should be supplemented in further studies to improve the accuracy of PM emissions evaluation.
5. Discussion
This study has developed an original technology for quantitatively predicting PM emissions at construction sites. The proposed technology overcomes the limitations of the existing concentration-based PM assessment and management method. Furthermore, this study is expected to provide a guideline for investigating PM emissions at construction sites nationwide.
However, the variables applied for generating fugitive PM emission factors in this study only rely on the single study from GRI and still need to be studied to retain accuracy. Variables such as silt content and moisture content highly influence the value of fugitive PM emission factors [17]. However, methods of how the variables were selected were not considered in this study. According to the result of the case study, fugitive emissions compose the largest share of total emissions; thus, updating the fugitive emission factors by applying reasonable variables should be performed in further studies. Moreover, construction equipment considered in this study is limited to only 13 types. US EPA provides more equipment emission factors through AP-42, such as those for graders and batch plants [29]. Considering the diversity of construction events in large-scale construction sites, additional emission factors for equipment and construction work should be continuously developed in future studies.
The proposed technology is based on a limited amount of existing literature and data. Thus, further research is required to establish a more precise emission factor DB and calculate input scenarios for construction equipment. In addition, the data that are assumed in the calculation of emission factors, such as the topsoil silt content and soil moisture content, should be supplemented with geographic information.
6. Conclusions
This study aimed to develop a technology for predicting particulate matter (PM) emissions at construction sites. The primary findings of this study are as follows:
- Thirteen types of construction equipment were selected as the main PM emission sources at construction sites. Then, an emission factor DB was established, which consisted of direct and fugitive emission factors for PM10 and PM2.5 for various types of construction equipment.
- The PM emission activity scenarios for construction equipment were presented and used to develop a method for predicting PM emissions at construction sites.
- A system for predicting PM emissions at construction sites was built using the emission factor DB and activity scenarios.
- A case study was performed using the developed system, and the fugitive and direct emissions of PM2.5 and PM10 were calculated for construction equipment.
- Moisture content and silt content values applied in fugitive factor development equations should be supplemented in further studies to improve the accuracy of PM emissions evaluation.
Author Contributions
Writing—original draft preparation, J.Y.; writing—review and editing, J.Y., H.K.; conceptualization and supervision, H.K., S.T. All authors have read and agreed to the published version of the manuscript.
Funding
This work was supported by the Korea Agency for Infrastructure Technology Advancement (KAIA) grant funded by the Ministry of Land, Infrastructure and Transport (grant number 21CTAP-C152276-03).
Conflicts of Interest
The authors declare no conflict of interest.
References
- Bennett, J.E.; Tamura-Wicks, H.; Parks, R.M.; Burnett, R.T.; Pope, C.A.; Bechle, M.J.; Marshall, J.D.; Danaei, G.; Ezzati, M. Particulate matter air pollution and national and county life expectancy loss in the USA: A spatiotemporal analysis. PLoS Med. 2019, 16, e1002856. [Google Scholar] [CrossRef] [PubMed] [Green Version]
- Griffiths, S.D.; Chappell, P.; Entwistle, J.A.; Kelly, F.J.; Deary, M.E. A study of particulate emissions during 23 major industrial fires: Implications for human health. Environ. Int. 2018, 112, 310–323. [Google Scholar] [CrossRef]
- Zhang, X.; Gao, S.; Fu, Q.; Han, D.; Chen, X.; Fu, S.; Huang, X.; Cheng, J. Impact of VOCs emission from iron and steel industry on regional O3 and PM2.5 pollutions. Environ. Sci. Pollut. Res. 2020, 27, 28853–28866. [Google Scholar] [CrossRef] [PubMed]
- Tétreault, L.-F.; Doucet, M.; Gamache, P.; Fournier, M.; Brand, A.; Kosatsky, T.; Smargiassi, A. Childhood Exposure to Ambient Air Pollutants and the Onset of Asthma: An Administrative Cohort Study in Québec. Environ. Health Perspect. 2016, 124, 1276–1282. [Google Scholar] [CrossRef] [PubMed] [Green Version]
- Winquist, A.; Kirrane, E.; Klein, M.; Strickland, M.; Darrow, L.A.; Sarnat, S.E.; Gass, K.; Mulholland, J.; Russell, A.; Tolbert, P. Joint Effects of Ambient Air Pollutants on Pediatric Asthma Emergency Department Visits in Atlanta, 1998–2004. Epidemiology 2014, 25, 666–673. [Google Scholar] [CrossRef] [PubMed] [Green Version]
- Rückerl, R.; Schneider, A.; Breitner, S.; Cyrys, J.; Peters, A. Health effects of particulate air pollution: A review of epidemiological evidence. Inhal. Toxicol. 2011, 23, 555–592. [Google Scholar] [CrossRef] [PubMed]
- Pande, P.; Dey, S.; Chowdhury, S.; Choudhary, P.; Ghosh, S.; Srivastava, P.; Sengupta, B. Seasonal Transition in PM10 Exposure and Associated All-Cause Mortality Risks in India. Environ. Sci. Technol. 2018, 52, 8756–8763. [Google Scholar] [CrossRef] [PubMed]
- Morino, Y.; Chatani, S.; Tanabe, K.; Fujitani, Y.; Morikawa, T.; Takahashi, K.; Sato, K.; Sugata, S. Contributions of Condensable Particulate Matter to Atmospheric Organic Aerosol over Japan. Environ. Sci. Technol. 2018, 52, 8456–8466. [Google Scholar] [CrossRef] [PubMed]
- Fajersztajn, L.; Saldiva, P.; Pereira, L.A.A.; Leite, V.F.; Buehler, A.M. Short-term effects of fine particulate matter pollution on daily health events in Latin America: A systematic review and meta-analysis. Int. J. Public Health 2017, 62, 729–738. [Google Scholar] [CrossRef] [PubMed]
- Wong, C.-M.; Vichit-Vadakan, N.; Kan, H.; Qian, Z. Public Health and Air Pollution in Asia (PAPA): A Multicity Study of Short-Term Effects of Air Pollution on Mortality. Environ. Health Perspect. 2008, 116, 1195–1202. [Google Scholar] [CrossRef] [PubMed] [Green Version]
- Sun, Y.; Zhuang, G.; Tang, A.; Wang, Y.; An, Z. Chemical Characteristics of PM2.5 and PM10 in Haze-Fog Episodes in Beijing. Environ. Sci. Technol. 2006, 40, 3148–3155. [Google Scholar] [CrossRef] [PubMed]
- Yang, X.; Lu, D.; Tan, J.; Sun, X.; Zhang, Q.; Zhang, L.; Li, Y.; Wang, W.; Liu, Q.; Jiang, G. Two-Dimensional Silicon Fingerprints Reveal Dramatic Variations in the Sources of Particulate Matter in Beijing during 2013–2017. Environ. Sci. Technol. 2020, 54, 7126–7135. [Google Scholar] [CrossRef] [PubMed]
- Basile-Doelsch, I.; Meunier, J.D.; Parron, C. Another continental pool in the terrestrial silicon cycle. Nature 2005, 433, 399–402. [Google Scholar] [CrossRef] [PubMed]
- Ohara, T.; Akimoto, H.; Kurokawa, J.; Horii, N.; Yamaji, K.; Yan, X.; Hayasaka, T. An Asian emission inventory of anthropogenic emission sources for the period 1980–2020. Atmos. Chem. Phys. Discuss. 2007, 7, 4419–4444. [Google Scholar] [CrossRef] [Green Version]
- Zhang, Q.; Streets, D.G.; Carmichael, G.R.; He, K.B.; Huo, H.; Kannari, A.; Klimont, Z.; Park, I.S.; Reddy, S.; Fu, J.S.; et al. Asian emissions in 2006 for the NASA INTEX-B mission. Atmos. Chem. Phys. 2009, 9, 5131–5153. [Google Scholar] [CrossRef] [Green Version]
- Ministry of Environment, National Air Pollutants Emission Service. Available online: http://airemiss.nier.go.kr/ (accessed on 15 January 2021).
- Kim, H.; Tae, S.; Yang, J. Calculation Methods of Emission Factors and Emissions of Fugitive Particulate Matter in South Korean Construction Sites. Sustainability 2020, 12, 9802. [Google Scholar] [CrossRef]
- Reff, A.; Bhave, P.V.; Simon, H.; Pace, T.G.; Pouliot, G.; Mobley, J.D.; Houyoux, M. Emissions Inventory of PM2.5 Trace Elements across the United States. Environ. Sci. Technol. 2009, 43, 5790–5796. [Google Scholar] [CrossRef] [PubMed]
- Ministry of Environment. Scattering Dust Management Manual; Ministry for the Environment: Sejong, Korea, 2017.
- National Institute of Environmental Research (NIER). National Air Pollutant Emission Calculation Method Manual III; NIER: Incheon, Korea, 2013.
- The Ministry of Environment. Emergency Reduction Measures for Ultra-Fine Dust. 2019. Available online: www.cleanair.go.kr/dust/dust/dust-emergency01.do (accessed on 11 November 2021). (In Korean)
- Ministry of Environment. Air Pollutant Emission-Cap Management for Industrial Workplace. Available online: www.keco.or.kr/en/core/climate_air2/contentsid/1947/index.do (accessed on 11 November 2021).
- National Assembly Research Service (NARS). Current Status of Total Air Pollution Control System at Workplaces and Improvement Plan, Legislative Policy Report; NARS: Seoul, Korea, 2019; Volume 36.
- Muleski, G.E.; Cowherd, C., Jr.; Kinsey, J.S. Particulate Emissions from Construction Activities. J. Air Waste Manag. Assoc. 2005, 55, 772–783. [Google Scholar] [CrossRef] [PubMed] [Green Version]
- Gyeonggi Research Institute (GRI). Seasonal Particulate Matter Management to Prevent High Pollution Events in Gyeong-gi-do; GRI: Suwon, Korea, 2019. [Google Scholar]
- National Institute of Environmental Research (NIER). Air Pollutant Emission Factor: Based on 2012 Air Pollutant Emissions; NIER: Incheon, Korea, 2015.
- US Environmental Protection Agency. AP-42: Compilation of Air Emissions Factors, Chapter 13.2.3: Heavy Construction Operations; US EPA: Washington, DC, USA, 1995.
- US Environmental Protection Agency. AP-42: Compilation of Air Emissions Factors, Chapter 11.9: Western Surface Coal Mining; US EPA: Washington, DC, USA, 1998.
- US Environmental Protection Agency. Introduction to AP 42, Volume I, 5th ed.; US EPA: Washington, DC, USA, 1995.
- National Institute of Environmental Research (NIER). Improvement of Fugitive Emission Calculation Method and Development of Real-Time Measurement Method of Fugitive Emissions on Roads, Final Report; NIER: Incheon, Korea, 2008.
- Ministry of Land, Infrastructure and Transport. Standard of Construction Estimate; Ministry of Land; Infrastructure and Transport: Sejong, Korea, 2020.
Publisher’s Note: MDPI stays neutral with regard to jurisdictional claims in published maps and institutional affiliations. |
© 2021 by the authors. Licensee MDPI, Basel, Switzerland. This article is an open access article distributed under the terms and conditions of the Creative Commons Attribution (CC BY) license (https://creativecommons.org/licenses/by/4.0/).